Does auditor regulatory oversight affect corporate financing and investment decisions?
Nemit Shroff Massachusetts Institute of Technology
Current draft: September, 2017 Comments welcome
ABSTRACT
This paper examines the real effects of auditor regulatory oversight on companies’ financing and investing policies. Using the Public Company Accounting Oversight Board’s (PCAOBs) international inspection program as a setting to generate within-country variation in auditor oversight, I find that companies respond to the increase in auditor oversight by issuing additional external capital amounting to 0.5% of assets and increasing capital expenditures by 0.3% of assets. These effects are larger for financially constrained companies and weaker for companies whose auditors’ are criticized by the PCAOB for having deficient engagement practices. This paper documents the importance of auditor oversight in mitigating external financing frictions. This paper is a finalist for the American Accounting Association 2016 FARS Midyear Meeting Best Paper Award. I thank Daniel Aobdia, Phil Berger, Beth Blankespoor, John Coates (discussant), Maria Correia (discussant), Lisa De Simone, Michelle Hanlon, Jonas Heese (discussant), Andrew Karolyi (discussant), Jinhwan Kim, Robert Knechel Becky Lester, Mark Maffett (discussant), Karen Ton, Rodrigo Verdi, and seminar participants at the Chinese University of Hong Kong, 2015 Dartmouth Accounting Research Conference, Erasmus University, 2016 FARS conference, HKUST, Indian School of Business, 2016 London School of Economics Conference, MIT, Ohio State University, 2015 PCAOB/JAR Conference, PCAOB Center for Economic Analysis, Singapore Management University, Southern Methodist University, Stanford University, University of Amsterdam, University of Chicago, University of Missouri, University of North Carolina, University of Texas, Austin Capital Markets Reading Group and the 2017 University of Toronto Conference for many helpful comments and suggestions. I thank Niketa Shroff for help with data collection. I acknowledge financial support from the MIT Junior Faculty Research Assistance Program. An earlier draft of this paper was entitled “Real Effects of Financial Reporting Quality and Credibility: Evidence from the PCAOB Regulatory Regime.” All errors are my own.
1
1. Introduction
One of the primary purposes of external financial reporting is to facilitate the exchange of
capital between investors and companies. For example, financial statements are used by
companies to write contracts with their stakeholders (e.g., debt holders, managers, suppliers, etc.)
and to provide information about company performance to outsiders. The degree to which
investors use the information in financial reports for contracting and decision-making depends on
the reliability of those reports; that is, the faith investors have in its accuracy. An independent
audit is a primary mechanism through which companies assure investors of the reliability of their
financial reports (Jensen and Meckling 1976; Watts and Zimmerman 1983).1 However, there are
significant agency issues between auditors, investors, and managers that can limit the extent to
which independent audits assure company stakeholders about the reliability and accuracy of
financial reports (e.g., Antle 1984; Acemoglu and Gietzmann 1997, Coffee 2006). In particular,
since auditors are compensated by the companies whose financial statements they are supposed
to verify, it is conceivable that auditors compromise their independence by allowing companies
excessive financial reporting discretion (DeFond and Zhang 2014).
In this paper, I examine whether regulatory oversight of a company’s auditor affects the
company’s financing and investing behavior. If auditor regulatory oversight helps mitigate the
agency issues between auditors and the company investors, then such oversight can increase the
degree to which investors rely on audited financial statements for decision-making. Specifically,
if regulatory oversight provides investors with additional assurance that the audited financial
statements are reliable, investors are likely to place more weight on the information in those
audited reports for capital allocation and contracting (e.g., Ijiri 1975, Minnis 2011). Ceteris
paribus, the increased reliance on audited financial statements by external stakeholders can lower
monitoring costs, thereby increasing a company’s access to finance (Jensen and Meckling 1976).
1 Following the naming convention of the PCAOB and the law literature, I refer to firms performing audits as “auditors” or “audit firms” and those receiving audits as “companies” throughout the paper.
2
In principal, auditor regulatory oversight can be beneficial because the audit process is
largely unobservable to investors. Thus, it is difficult for investors to assess the quality of the
work done by the auditors. In addition, it is difficult for auditors to differentiate themselves on
the basis of audit quality precisely because the audit process is unobservable to investors (Doty
2012, 2014; PCAOB 2015). Under such conditions, theory suggests that a public regulator can
increase the confidence investors have in an audit by inspecting the work performed by auditors
and by ensuring that the audit process conforms to certain minimum standards of quality and
independence (e.g., Landes and Posner 1975, Prichard 2006, Coates 2007).2
Ex ante, however, there are several reasons why auditor regulatory oversight might not
increase the perceived reliability of audited financial statements. Specifically, regulators also
have agency problems that can limit their effectiveness (Coarse 1960). For example, regulation is
typically created by political processes that are influenced by the lobbying efforts of the
regulated companies (Stigler 1971; Peltzman 1976). Not only can such lobbying efforts reduce
the effectiveness of a public regulator but can also serve the special interests of the regulated
agents rather than the public interest (see e.g., Mahoney 2001, Rajan and Zingales 2003). Thus,
whether regulatory oversight of auditors increases investor confidence in the audit process and
translates into greater access to external finance is an empirical question.
I use the Public Company Accounting Oversight Board (PCAOB) international
inspection program as a setting to test whether auditor regulatory oversight affects companies’
financing and investing behavior. The Sarbanes-Oxley Act of 2002 (SOX) requires the PCAOB
to inspect the auditing procedures of all auditors that participate in the audit of companies
registered with the U.S. Securities and Exchange Commission (SEC). Thus, a non-U.S.
company’s non-U.S. auditor could be subject to PCAOB oversight if the auditor has another
client that is registered with the SEC (e.g., a client cross-listed on a U.S. stock exchange). In
2 For example, a regulator could inspect confidential work papers related to audit engagements, examine compensation contracts and employee incentive plans in audit firms, and evaluate the overall audit firm culture.

3
other words, a company outside the U.S. with no direct exposure to U.S. securities regulation
could be indirectly affected by PCAOB oversight if its auditor has even one client that is
registered with the SEC. As a result, the PCAOB international inspection program creates
variation in auditor oversight within a country while holding constant all other country-level
regulation. An important advantage of the PCAOB’s international inspection program is that all
non-U.S. auditors, except the big-four auditors in Canada, have thus far been subject to only
triennial (instead of annual) inspections, thereby creating significant variation in the timing of
auditor inspections.3
To identify the effect of auditor oversight on company behavior, I construct a sample of
non-U.S. companies that are audited by PCAOB-inspected auditors but are not directly subject to
any SEC or PCAOB regulation. Focusing exclusively on a sample of non-U.S. companies, all of
whom employ a PCAOB-inspected auditor, helps mitigate the concern that my results are biased
by systematic differences between companies employing PCAOB-inspected auditors and those
without PCAOB-inspected auditors. The staggering in the timing of PCAOB inspections makes
such a research design choice feasible. I proxy for changes in auditor oversight using indicator
variables for the period following the completion of an auditor’s inspection fieldwork and the
public disclosure of its inspection report.4 To ensure that the effect of PCAOB oversight on
company behavior is identified only from the differences in inspection timing of its auditor, I
estimate regressions that include indicator variables for each country-industry-year combination
(i.e., country times industry times year fixed effects). These fixed effects control for all time-
varying and time-invariant country- and industry-characteristics that affect companies’ financing
and investing decisions (e.g., country or industry-level shocks to growth opportunities, country
or industry-level shocks to external financing conditions, local regulatory changes, etc.). To
3 Auditors that issue an audit report for more than 100 SEC registered companies are subject to annual inspections. The Canadian big-four auditors are the only non-U.S. auditors to have thus far met this criterion. 4 I discuss the PCAOB inspection process and the information contained in the inspection reports in Section 2.
4
mitigate concerns that time invariant company characteristics or measurement error in my
proxies affect my inferences, I include indicator variables for each company in all regressions.
Thus, my research design benchmarks changes in the financing and investing behavior of
companies whose auditors are PCAOB inspected in a given period to changes in the financing
and investing behavior of companies whose auditors (i) have already been inspected by the
PCAOB at an earlier period and (ii) will be subsequently inspected by the PCAOB at a future
period (see Figure 1 for an illustration of my research design).
The PCAOB international inspection setting offers three main advantages to test the
effect of auditor oversight on corporate finance decisions while mitigating the typical research
design concerns affecting studies examining regulation (see Leuz and Wysocki 2016 for a
discussion). First, my sample is comprised exclusively of non-U.S. companies that are free of
U.S. securities regulation; thus any economic consequences of PCAOB oversight accruing to
these companies are not confounded by the effects of the other provisions of SOX or other SEC
regulation.5 Second, my design identifies the treatment effects of PCAOB oversight by
comparing companies that operate in the same country, industry, and year. As a result, my results
are unlikely to be confounded by differential changes in the economic environment of the treated
and benchmark observations. Finally, since all companies in my sample are audited by a
PCAOB-inspected auditor, my results are unlikely to be explained by auditor selection effects.
Using data from 35 countries over the period 2002 to 2014, I find that companies audited
by PCAOB-inspected auditors raise significantly more external capital following the disclosure
of their auditors’ PCAOB inspection report. I find evidence of companies issuing additional debt
and equity capital following the disclosure of their auditor’s PCAOB inspection report. Further,
the extent to which companies change their capital raising behavior following the disclosure of
their auditors’ inspection report is contingent on the content of the report. I find that companies
5 A drawback of focusing on non-U.S. companies is that they are not subject to U.S. securities regulation and are not the intended beneficiaries of PCAOB oversight. Section 2.2 discusses potential mechanisms for such spillovers.

5
issue significantly lesser debt and equity capital when their auditor’s inspection report reveals
that the PCAOB found a larger number of engagement-level deficiencies in manner in which the
auditor conducts audits.6 The coefficient estimates imply that companies raise additional external
capital amounting to 0.5% of their assets, on average. However, companies whose auditors have
no engagement-level deficiencies in their inspection reports issue additional external capital
equal to 0.9% of their assets, of which 0.5% (0.4%) is in the form of additional debt (equity)
issuances. This economic magnitude represents a 9.7% increase in the external capital raised
conditional on the company raising additional capital.
I then investigate whether companies increase their capital expenditures in response to
the increased oversight of their auditors. To the extent auditor regulatory oversight mitigates the
agency problems in external financing arrangements and relaxes financing constraints, the
increased capital should lead to increases in corporate investment. Consistent with this
prediction, I find that companies respond to the disclosure of their auditor’s PCAOB inspection
report by increasing capital expenditures. However, the changes in capital expenditure following
PCAOB inspections are statistically significant only when the inspection reports disclose that the
auditor has few engagement-level deficiencies. Specifically, the coefficient estimate implies that
companies increase their capital expenditure by 0.3% of assets (or 6.1% of the average annual
capital expenditure incurred by the sample companies) following the disclosure that their auditor
was inspected by the PCAOB if the inspection report reveals that the auditor did not any
engagement-level deficiencies.
The above analyses assume that the average company has unfunded growth opportunities
prior to their auditor’s PCAOB inspection, perhaps because the average company is capital
constrained. Since my sample comprises of companies located in countries with relatively less
developed capital markets than that in the U.S., such an assumption is plausible. To relax this
6 Christensen et al. (2016) provide survey evidence that investors view the number of engagement deficiencies in PCAOB inspection reports as an indicator of overall audit firm quality.

6
assumption, I next examine whether companies that are ex ante financially constrained increase
external financing and capital expenditures by a larger magnitude in response to their auditors’
PCAOB inspection report than financially unconstrained companies. Since financially
constrained companies are the ones with binding capital constraints, such companies are likely to
be more responsive to an increase in external financing capacity than unconstrained companies.
Consistent with my prediction, I find that financially unconstrained (constrained) companies
respond to the PCAOB inspection of their auditor by issuing additional external capital equal to
0.3% (0.9%) of their assets. Further, only the financially constrained companies increase capital
expenditures (by 0.5% of assets) in response to their auditor’s PCAOB inspection.7
My results are robust to using different fixed-effect structures, clustering standard error at
different levels, the inclusion/exclusion of control variables, and dropping individual countries
from my sample. Further, I find no evidence of a pre-treatment trend in the financing and
investing behavior of companies before the PCAOB inspection of their auditors, providing
support for the validity of the parallel trends assumption.
This paper contributes to the literature examining the consequences of PCAOB oversight,
which predominantly focuses on changes in the auditing industry and financial reporting
practices of SEC registered companies. A number of prior studies examine the effect of PCAOB
inspections, enforcement, and the content of inspection reports on auditor behavior and auditor
market share (e.g., Lennox and Pittman 2010, DeFond and Lennox 2011, Nagy 2014, Boone,
Khurana and Raman 2015, Aobdia 2016a, Aobdia and Shroff 2017). With the exception of
Lennox and Pittman (2010), prior studies find that U.S. auditors lose market share when
inspection reports raise concerns about audit quality and, in the international setting, non-U.S.
auditors inspected by the PCAOB gain market share from competitors not inspected by the
7 I also examine whether companies audited by one of the big-four network auditors derive any differential benefits from PCAOB oversight of their auditors. I find that there is no statistically significant difference in the financing and investing responses to PCAOB inspections of companies audited by big-four versus non-big-four network auditors.
7
PCAOB. Prior research also documents that PCAOB inspections affect audit quality for the
clients of inspected auditors (e.g., Gramling, Krishnan and Zhang 2011, Aobdia 2016a, b,
Lamoreaux 2016, DeFond and Lennox 2017, Fung, Raman and Zhu 2017, Krishnan, Krishnan
and Song 2017). Finally, Gipper, Leuz and Maffett (2016) document increases equity investors’
responses to earnings news following the introduction of the PCAOB inspection regime. This
paper extends this literature by documenting the real effects of PCAOB oversight on corporate
finance decisions. To the best of my knowledge, this is the first paper to show that PCAOB
oversight has real effects and to document the economic magnitude of these effects.8
A more unique contribution of this paper is to examine the spillover effects of U.S.
securities regulation on non-U.S. companies. With the exception of Aobdia and Shroff (2017)
and Fung et al. (2017), prior research exclusively focuses on the effects of PCAOB oversight on
SEC registered companies.9 The PCAOB does not inspect the audit engagements of companies
not registered with the SEC. Yet, I find that non-SEC registered companies derive economic
benefits from PCAOB oversight and the magnitude of this benefit depends on the content of
PCAOB inspection reports. Understanding the spillover effects of PCAOB oversight is important
because it helps us better evaluate and quantify the total benefit of PCAOB oversight. Given the
resources devoted to the PCAOB and skepticism about its value, additional evidence on the costs
and benefits of PCAOB oversight is warranted.10
Finally, this paper contributes to the literature on the real effects of accounting. Prior
studies such as Hope and Thomas (2008), McNichols and Stubben (2008), Biddle, Hilary and
Verdi (2009), Beatty, Liao and Weber (2010a, b), Balakrishnan, Core and Verdi (2014), and
Balakrishnan, Watts, and Zuo (2016) provide evidence that financial reporting quality helps
alleviate financing frictions, which then leads to more efficient investment. Other studies 8 See Coates and Srinivasan (2014) and DeFond and Zhang (2014) for reviews of the literature. 9 Fung et al. (2017) find that PCAOB inspections have spillover effects on the audit quality of non-SEC registered clients audited by the inspected auditors and Aobdia and Shroff (2017) find that non-U.S. auditors gain market share of non-SEC registered clients if they are subject to PCAOB oversight. 10 The PCAOB 2017 budget totals $268.5 million (see: https://www.sec.gov/news/pressrelease/2016-263.html).
8
examine the effect of accounting rules, managers’ information sets, and financial reporting
incentives on corporate investment behavior (e.g., Bushee 1998, Graham, Hanlon and Shevlin
2011, Bae, Choi, Dhaliwal and Lamoreaux 2017, Shroff 2017). Recently, Kausar, Shroff and
White (2016) examine whether the choice to get an audit in a voluntary audit regime provides
investors incremental information that alleviates financing frictions and facilitates corporate
investment. This paper contributes to the literature by examining the real effects of auditor
regulatory oversight, which hitherto has not been examined.
Before proceeding, I caveat that my inferences are based on a sample of non-U.S.
companies that operate in countries with weaker regulatory and institutional environments than
that of the U.S. Thus the results of this paper might not generalize to companies in the U.S.
2. Institutional setting and hypotheses
2.1. PCAOB’s international inspection program
The PCAOB was established in 2002 via Section 101 of the Sarbanes-Oxley Act (SOX).
Section 104 of SOX requires the PCAOB to inspect the auditing procedures of all auditors that
issue audit reports opining on the financial statement of SEC registered companies, including the
non-U.S. auditors of non-U.S. companies cross-listed on a U.S. stock exchange.11 Under SOX
and the PCAOB’s rules, non-U.S. audit firms are subject to PCAOB inspections “in the same
manner and to the same extent” as U.S. based audit firms (SOX Section 106). Thus, PCAOB’s
international inspection program creates variation in auditor oversight in countries beside the
U.S., which allow the PCAOB to inspect their domestic auditors.
The PCAOB commenced its inspections of non-U.S. auditors in 2005. Auditors that issue
audit reports for more than 100 SEC registered companies are subject to annual inspections; the
rest are subject to (at least) triennial inspections. Before the start of an inspection, the PCAOB
11 The PCAOB might also inspect auditors that play a substantial role in preparing (but do not issue) audit reports of an SEC registered company or its foreign subsidiary (SOX Section 106(a), PCAOB Rule 2100 and 4000).
9
staff notifies the audit firm of when it plans to conduct the inspection. It also requests
information such as the list of audits of SEC registered companies performed by the auditor, the
personnel performing those audits, and the audit firm’s quality control program. In most cases,
the inspection fieldwork occurs at the offices of the inspected audit firms. PCAOB inspections
involve two parts: (i) an in-depth analysis of select audit engagements performed by an auditor
and, (ii) an examination of the auditor’s firm-level quality control systems.
In the first part of the inspection, the PCAOB inspectors select a subsample of audit
engagements (of SEC registered clients) for inspection based on a risk-weighted system. For
each audit selected, the inspection team meets with the audit engagement team and examines the
audit work papers. The inspectors’ goal is to analyze how the audit was performed and to answer
questions such as: (i) does the auditor follow the procedures required under the PCAOB’s
auditing standards, (ii) did the auditor identify any areas in which the financial statements did not
conform to GAAP and how the auditor handled potential adjustments to the financial statements
in such cases, and (iii) are there any indications that the auditor is not independent. Overall, the
purpose of such an examination of the audit work papers is to “identify and address weaknesses
and deficiencies related to how a firm conducts audits” (PCAOB Annual Report 2012).
The second part of the inspection concerns the auditor’s firm-level quality control
system. Examples of the types of issues addressed include: (i) review of the processes for partner
evaluation, compensation, admission to partnership, and disciplinary actions (ii) review of
management structure and processes, including the tone at the top and whether management
instills a culture of commitment to integrity and independence (iii) review of the firm’s processes
for monitoring audit performance (e.g., how the audit firm identifies, evaluates, and responds to
possible indicators of deficiencies in its performance of audits) and (iv) review of engagement
acceptance and retention such as policies and procedures for identifying and assessing the risks
involved in accepting or continuing audit engagements (see PCAOB Annual Report 2012).
10
Upon completion of each inspection, the PCAOB prepares a written report on the
inspection and subsequently makes portions of the reports available to the public, subject to
statutory restrictions on public disclosure. Specifically, the public portion of the inspection
reports describes audit deficiencies found within the sample of audit engagements examined by
PCAOB inspectors (which are known as Part I Findings). These deficiencies typically concern
instances where the auditor failed to gather sufficient audit evidence to support an audit opinion
(see PCAOB Release No. 2012-003). However, the report does not divulge names of clients
whose audit engagements were inspected by the PCAOB. The PCAOB does not disclose any
deficiencies in the quality control systems of the inspected audit firm (known as Part II
Findings), as long as the audit firm satisfactorily addresses concerns raised by the PCAOB
within one year of the issuance of the inspection report (SOX Section 104).
2.2. Hypothesis development
Financial statements are valuable as a contracting tool and information source only to the
extent investors perceive the information reported in those statements as being reliable (Watts
2003). One of the primary mechanisms to increase the reliability of financial statements is to
have an independent outside party verify those disclosures. Theory suggests this assurance
benefit of an audit reduces financing frictions, such as adverse selection and moral hazard
between managers and capital providers, which improves resource allocation and contracting
efficiency (Jensen and Meckling 1976; Watts and Zimmerman 1983). For example, Jensen and
Meckling (1976) argue that “independent auditors would be engaged by management to testify to
the accuracy and correctness of [financial statements]” because such an action reduces investors’
monitoring costs, which would lead to a lower cost of capital and greater access to capital for the
company. In other words, to the extent an independent audit serves to provide investors
assurance that financial statements represent what they purport to represent, investors are more
likely to use financial statement information for contracting purposes and for making resource

11
allocation decisions. Consistent with theory, prior research finds that an audit (and even the
choice to subject oneself to an audit) lowers the cost of external financing (e.g., Blackwell et al.
1998, Minnis 2011, Kausar et al. 2016) and that lenders’ pricing decisions are more sensitive to
financial statement variables when financial statements have been audited (e.g., Minnis 2011).
The degree to which an audit assures investors of the reliability of financial statement
critically depends on the independence of the auditor and the rigor with which the audit is
performed (Watts and Zimmerman 1983). Yet, these attributes of audit engagements,
independence and rigor, are mostly unobservable to external stakeholders (PCAOB 2015).
Typically, outside stakeholders only observe whether a company receives a clean audit opinion
or an opinion with some caveats. As a result, outside stakeholders are forced to rely on an
auditor’s private incentives to be independent and thorough in her audits, which stem from
litigation costs and reputational damages in the event an audit failure becomes public. Although
prior research finds that an auditor’s private incentives help improve audit quality, the evidence
is generally mixed (see DeFond and Zhang 2014 and Donovan et al. 2014). In addition, it is
unclear whether auditors’ private incentives to supply high quality audits are sufficient to
completely resolve agency issues between auditors, managers and capital providers.
While auditors have private incentives to supply high quality audits, there are
countervailing incentives for auditors to allow companies/managers excessive financial reporting
discretion. Specifically, since managers often have significant influence in the auditor selection
process (e.g., Beasley et al. 2009, Cohen et al. 2010, Dhaliwal et al. 2015), it is plausible that
auditor independence (or its perception) is compromised. The perception of independence is
especially important in the audit setting because the audit process is unobservable to stakeholders
outside the company. The unobservable nature of the audit process also affects auditors’
incentives to be rigorous in their audits, potentially promoting the commoditization of audits

12
(Advisory Committee on the Auditing Profession 2008; PCAOB 2015).12 Specifically, if
stakeholders are unable to differentiate the quality of work done by different auditors (or within a
subset of auditors such as the big-four), then the primary basis for competition among auditors is
the audit fees charged (Doty 2012, 2014). The focus on audit fees then reduces auditors’
incentives to be rigorous, potentially reducing audit quality and the level of assurance from an
audit (e.g., Christensen et al. 2014, Ettredge et al. 2014). Commenting on the concern that audits
are viewed as commodities by some investors, James Doty, the Chairman of the PCAOB, said in
his 2014 keynote address at Baruch College that “I believe the nub of this commoditization [of
an audit] is that it is difficult [for investors] to observe the full benefit of a good audit. We can’t
tell which companies would or might have collapsed under management misreporting, but for the
auditor’s watchful eye.”
Given these features of the auditing industry, a public regulator can serve to increase the
assurance value of an audit by inspecting the work performed by auditors. For example,
Pritchard (2006) and Aobdia and Shroff (2017) discuss that a public regulator can gain
confidential access to the auditor’s work papers and provide a more precise evaluation of the
quality of an auditor’s work relative to that inferred from public signals of audit quality (e.g.,
lawsuits and restatements). Similarly, a public regulator can examine personnel policies,
employee compensation arrangements, practices to attract new clients and retain existing clients,
and the overall culture at the audit firm to evaluate whether the personnel performing the audit
have incentives to stay independent of the client.
I hypothesize that PCAOB oversight increases the perceived reliability of the financial
statements by providing investors additional comfort that the auditor is independent of
management and by increasing investor confidence that the audit work is performed thoroughly. 12 The 2008 Final Report of the Advisory Committee on the Auditing Profession to the U.S. Department of the Treasury discusses that “Currently, there is minimal publicly available information regarding indicators of audit quality at individual accounting firms. Consequently, it is difficult to determine whether audit committees…have the tools that are useful in assessing audit quality that would contribute to making the initial auditor selection and subsequent auditor retention evaluation processes more informed and meaningful.”
13
Specifically, the PCAOB’s in-depth analysis of selected audit engagements is geared towards
identifying deficiencies in the way in which an audit is conducted and, providing the auditors
incentives to correct deficiencies identified during the inspection (see Aobdia 2016a). PCAOB
inspectors also look for evidence on whether an auditor is independent from its clients as
required under SEC and PCAOB rules. Specifically, the PCAOB inspection of auditors’ firm-
wide quality control systems reviews the audit firms’ management structure, culture, partner
evaluation criteria, compensation arrangements, policies to gain new clients and retain existing
clients, etc. with the goal of ensuring that the audit firm has a commitment to integrity and
independence. The PCAOB incentivizes auditors to remediate firm-wide quality control
deficiencies by keeping such deficiencies confidential for at least a year after the inspection
report is made public. If the auditor satisfactorily addresses the PCAOB’s concerns, such quality
control deficiencies remain confidential; otherwise, the PCAOB publicly discloses these
criticisms as a “Part II Finding” in an updated inspection report (Aobdia 2016b).
Consistent with the PCAOB inspection process providing auditors incentives to improve
audit practices ex ante, Lamoreaux (2016) uses variation in whether non-U.S. governments allow
the PCAOB to inspect domestic auditors and finds that PCAOB inspection access leads to
improvements in audit quality of non-U.S. companies cross-listed in the U.S. Similarly, DeFond
and Lennox (2017) and Krishnan et al. (2017) find that PCAOB inspections lead to
improvements in audit quality following the inspection of a company’s auditor (i.e., ex post).
Further, Gipper et al. (2016) find that PCAOB oversight increases the extent to which investors
respond on earnings news, as measured by short-window earnings response coefficients. The
evidence in Gipper et al. (2016) suggests that investors are more reliant on the information in
earnings following the PCAOB oversight regime. Aobdia (2016a, b) uses confidential PCAOB
inspection data and finds significant changes in audit practices in response to PCAOB
inspections.

14
My analyses exclusively focus on non-U.S. companies that are not listed on a U.S.
exchange and as such are free of SEC oversight. The auditors of these non-U.S. companies are
inspected by the PCAOB because they participate in the audit of at least one SEC registered
company. In other words, I examine whether PCAOB inspections of non-U.S. auditors affect the
financing/investing behavior of their non-U.S. clients not subject to SEC oversight. Thus, my
analyses require that PCAOB oversight has spillover effects on the non-U.S. clients of non-U.S.
auditors. In principle, PCAOB inspections of non-U.S. auditors can have spillover effects on the
non-U.S. clients of inspected auditors for the following reasons.
First, PCAOB inspections include an evaluation of the auditor’s firm-wide quality control
systems. This part of the inspection by definition extends beyond individual audit engagements
and can lead to auditor-wide changes in audit policies. For example, PCAOB quality-control
inspections evaluate whether partner evaluation, compensation, promotion, termination and
staffing practices encourage technical competence and independence instead of marketing
(Aobdia 2016b). If the PCAOB inspectors conclude that existing partner compensation policies
do not promote independence, audit firms have strong incentives to change partner compensation
practices in a manner that satisfies the PCAOB inspectors to avoid receiving a Part II Finding.
Such changes in partner compensation policies usually occur at the audit firm-level, affecting the
audit engagements of non-U.S. companies not registered with the SEC.
Second, PCAOB inspections of select audit engagements can have spillover effects on
the audit engagements of other clients, including an auditor’s non-U.S. clients. Gipper et al.
(2016) discuss an example where the PCAOB identified five engagement deficiencies during its
inspection of Deloitte in 2004, which subsequently led Deloitte to undertake a firm-wide review
of its auditing practice related to the deficiency and led to subsequent changes in other audit
engagements (see Appendix A in Gipper et al. (2016) for a more detailed discussion as well as
additional examples). Concurrent research also provides large sample evidence that PCAOB
15
inspections not only affect the audit engagements chosen for inspection but also have spillover
effects on the engagements of other clients whose audits are not inspected by the PCAOB.
Aobdia (2016a) uses confidential PCAOB data to show that PCAOB inspections affect the audit
engagements of clients whose audits are not chosen for inspection.
Third, and most directly related to my study, concurrent work by Fung et al. (2017) finds
that PCAOB inspections of non-U.S. auditors lead to audit quality improvements for the
auditors’ non-U.S. clients. Similarly, Aobdia and Shroff (2017) find that PCAOB inspected non-
U.S. auditors observe a 4 to 6% increase in their market share of non-SEC registered clients
following their PCAOB inspections, suggesting that PCAOB oversight has spillover effects on
the non-U.S. clients of inspected auditors.13 Overall, prior research, anecdotal evidence, and the
scope of a PCAOB inspection suggest that the inspections are likely to affect all audit
engagements of an auditor, not simply those audit engagements selected for PCAOB review.
Finally, my hypothesis only requires PCAOB oversight to affect the perceived reliability
of non-U.S. companies’ financial statements and does not require any actual changes in the audit
quality of non-U.S. companies. Supporting this notion, Christensen et al. (2016) conduct a
survey of investors and find that investors use information in auditors’ PCAOB inspection
reports to infer the overall audit firm quality. Notwithstanding the above arguments, my
empirical tests are biased towards finding no result if PCAOB oversight does not have spillover
effects on the perceived reliability of non-U.S. companies’ financial statements.
H: Companies audited by PCAOB-inspected auditors increase their external financing and investment expenditures following the PCAOB inspection of their auditors.
Despite the above discussion, there are compelling arguments for why auditor regulatory
oversight might not affect the perceived reliability of financial statements. A number of prior
13 Anecdotally, private conversations with the PCAOB international inspection staff revealed that during the inspection field work, colleagues from the auditors’ national offices often visit the local inspection site to understand any issues raised by the inspectors. Further, the audit firms often send out technical bulletins to all employees at the audit firm after the completion of an inspection.
16
studies argue that regulatory solutions are often ineffective because regulators are subject to
political pressure and capture, resource constraints, and inefficiencies (Stigler 1971, Peltzman
1976, Peltzman et al. 1989). Prior research and commentators raise a number of reasons why the
PCAOB specifically, and its approach to auditor oversight, might be ineffective. For example,
Glover et al. (2009) interview practicing auditors who indicate that the PCAOB inspectors often
lack the competence to understand complex auditing and accounting issues. Glover et al. (2009)
conclude that the inspection process is fundamentally flawed. Auditing professionals also assert
that inspector-identified deficiencies typically capture differences in professional judgment
rather than systematic audit failures; and argue that PCAOB inspectors lack the incentives to
identify deficiencies that are likely to improve audit quality (Johnson et al. 2014, Dowling et al.
2015). Anecdotally, the former CEO of Deloitte and a member of several public company
boards, J. Michael Cook, commented that “I think the [PCAOB inspection] process is well
intended, and it is helpful and constructive, but right now it is not producing the kind of results
that it should for people who are using the results and trying to understand what this means.”14
Thus, whether PCAOB oversight affects investor perceptions of the reliability of financial
statements and helps reduce external financing frictions is ultimately an empirical question.
3. Data and sample
I obtain the complete list of non-U.S. auditors inspected by the PCAOB and the date
when the inspection reports are made public from the PCAOB website as of November 10,
2014.15 I then hand collect data on the inspection end date from the individual inspection reports
downloaded from the PCAOB website. All my analyses are conducted on non-U.S. companies
operating in countries with at least one PCAOB inspected auditor. I obtain the financial
14 See: http://ww2.cfo.com/accounting-tax/2007/01/why-the-big-four-are-still-a-big-mystery/. Skepticism about the value of PCAOB inspections is also raised by Hodowanitz and Solieri (2005), Palmrose (2006), and Hilzenrath (2010) among others. 15 See: http://pcaobus.org/International/Inspections/pages/internationalinspectionreports.aspx
17
statement information of non-U.S. companies from the Compustat Global Vantage database and
hand collect the auditor identities from the S&P Capital IQ database for all company-year
observations in the intersection of Compustat Global and Capital IQ.16 Although Compustat
Global has a variable identifying the auditor for its sample company-years, I hand collect auditor
data from Capital IQ for three reasons: (i) over 60% of the company-year observations in
Compustat Global have auditors classified in the generic category “Other;” (ii) Of the identified
auditors, the vast majority of company-years are those using a big-four auditor; (iii) The auditor
variable in Compustat Global is often erroneous. As a final step to identify the auditor for each
company-year in my sample, I manually clean the auditor identities for the observations in my
sample as the auditor names are not uniformly coded in the Capital IQ database.
My sample period begins in 2002 (following the enactment of SOX and the creation of
the PCAOB) and ends in 2014 (the most recent year on Compustat Global at the time I began
collecting auditor identities). I require company-years to be in the intersection of the Compustat
Global and Capital IQ databases and have non-missing values for total assets, capital
expenditure, Tobin’s Q, and cash flow. These restrictions yield an initial sample of 158,763
company-year observations. I exclude companies cross-listed on a U.S. exchange as they are
subject to the other provisions of SOX, and the timing of PCAOB inspection effects are likely to
be different for these companies, leaving me with 146,340 observations. Dropping companies
without a PCAOB inspected auditor results in a sample of 86,077 observations. I also drop 1,205
observations with annually inspected auditors since the treatment effect for such companies are
not staggered. In some instances, companies are audited by multiple auditors. Dropping such
observations, as well as, companies that change auditors during my sample period leaves me
with a sample of 52,755 observations. I drop companies with auditor changes because Aobdia
16 I use the Global Vantage database (rather than Datastream) in part because the primary source of auditor data is Capital IQ, and Datastream does not share a reliable company identifier with Capital IQ. GVKEY serves as a common company identifier for observation in Global Vantage and Capital IQ.

18
and Shroff (2017) find that PCAOB inspected auditors gain market share from those not
inspected by the PCAOB. Thus, companies that switch auditors during my sample period could
induce a selection bias in my results. Finally, I drop companies operating in the financial
industry because their financing and investing incentives are typically different than that of
industrial companies. My final sample comprises of 52,329 company-year observations and
6,924 unique companies from 35 countries that allow the PCAOB to inspect their domestic
auditors. Table 1 outlines the sample selection procedure.
4. Research design and descriptive statistics
4.1. Research design
I estimate the following difference-in-differences regression to test my predictions:
yi,t = β1 INSPECTIONi,t-1 + β2 REPORTi,t-1 + αi + αt × αind × αc + ɤ′X + εi,t (1)
where i, t, ind, and c indexes companies, years, industries, and countries, respectively; , is a
proxy for the amount of external capital raised or investment expenditures. I proxy for the
amount of external capital raised using the sum of debt and equity issuances (DEBT ISSUANCE
+ EQUITY ISSUANCE), where DEBT ISSUANCE is the net amount of long-term debt issued in a
year (Compustat data item dltis minus dlr) or the change in total debt if dltis and dlr are missing.
EQUITY ISSUANCE is the sum of the proceeds raised from the sale of common and preferred
stock (Compustat data item sstk). In cases where sstk is missing, I assume equity issuances are
zero. However, I include an indicator variable that equals one for such cases to control for any
systematic effects of treating missing equity issuances as a zero issuance. I scale the amount of
capital raised by average assets in the current and immediately preceding year. I proxy for
investment using capital expenditure scaled by average assets (CAPEX). , , , and are
company, year, industry (2-digit SIC), and country indicators. X is a vector of controls.
As it is difficult to know when precisely companies would change their corporate finance
decisions in response to PCAOB oversight, I include indicator variables to capture the fiscal
19
years following the (i) completion of the inspection fieldwork (INSPECTION) and (ii) public
disclosure of the inspection report (REPORT). Specifically, INSPECTION is an indicator
variable that equals one for the fiscal years in between the completion of a company’s auditor’s
PCAOB inspection fieldwork and the disclosure of the company’s auditor’s inspection report.
Thus, this variable captures changes in a company’s financing and investing behavior in the
period in between the completion of its auditor’s inspection fieldwork and the public disclosure
its auditor’s inspection report. REPORT is an indicator variable that equals one for the fiscal
years after the disclosure of a company’s auditor’s inspection report. In the international
inspection setting, the time elapsed between the completion of an auditor’s inspection fieldwork
and the disclosure of its inspection report is 569 days on average (Table 3). Given the significant
lag between the inspection end date and report disclosure date, I estimate separate treatment
effects for these two events.17
When the dependent variable is CAPEX, the vector of control variables includes: Tobin’s
Q (TOBIN’S Q), sales growth (SALES GROWTH), cash flows from operations (CFO), company
size (LN(MVE)), cash (CASH), leverage (LEVERAGE), and the ratio of tangible to total assets
(ASSET TANGIBILITY). When the dependent variable is EXTERNAL FINANCING, DEBT
ISSUANCE, or EQUITY ISSUANCE, the vector of control variables includes: Tobin’s Q
(TOBIN’S Q), sales growth (SALES GROWTH), cash flows from operations (CFO), profitability
(ROA), an indicator variable for dividend payments (DIVIDEND INDICATOR), company size
(LN(MVE)), cash (CASH), leverage (LEVERAGE), and the ratio of tangible to total assets
(ASSET TANGIBILITY). The list of control variables included in my regressions follows prior
research (e.g., Kaplan and Zingales 1997; Whited 2006; Hadlock and Pierce 2010; Badertscher et
17 In principle, external capital providers can ex ante identify which auditors are subject to PCAOB oversight because auditors with SEC registered companies as clients can be identified using publicly available data. Thus, it is plausible that companies audited by a PCAOB inspected auditor change their external financing behavior after their auditor’s inspection fieldwork ends rather than waiting until the inspection report is publicly disclosed.
20
al. 2013; Kausar et al. 2016). All continuous variables are winsorized at the 1st and 99th
percentile of their empirical distribution. I cluster standard errors at the country-auditor level.18
The identifying assumption essential to the interpretation of my difference-in-differences
coefficient is that the treated and control company-year observations would have had parallel
trends in external financing and investment had it not been for the treatment effect. My empirical
design takes several steps to mitigate concerns about violation of the parallel trends assumption.
First, I include country-industry-year fixed effects in all the regressions. This fixed effects
structure benchmarks the behavior of a treated company-year to the behavior of a company-year
not receiving treatment but operating in the same country-industry-year. As a result, all
observable and unobservable factors that affect a company’s external financing and investing
behavior at the country-industry-year level are differenced away.
Second, by restricting the analyses to a sample of companies whose auditors are all
inspected by the PCAOB on a triennial basis, my research design identifies treatment effects
only from the staggering of PCAOB inspections (see Figure 1 for a diagrammatic illustration of
the staggered design; Table 2, Panel C show the extent of staggering in PCAOB inspection
disclosures in each country). This approach mitigates any concern that the companies audited by
PCAOB inspected auditors have systematically different financing/investing behavior than
companies audited by non-PCAOB inspected auditors.
Third, I restrict my sample to companies that do not change auditors during my sample
period (2002 to 2014), further mitigating concerns that auditor selection during my sample
period affects my inferences. Given that the PCAOB was established in 2002 as part of SOX and
the auditor choices of my sample companies pre-date the creation of the PCAOB, auditor
selection is especially unlikely to confound my inferences. A potential concern related to auditor
selection remains if companies audited by different PCAOB-inspected auditors have different
18 My results are robust to clustering standard errors at the company level, which is the approach in Gipper et al. (2016) and DeFond and Lennox (2017), as well as clustering at the country-industry level.
21
financing/investing incentives. However, such selection concerns are again unlikely to affect my
inferences because each company serves as its own control in my difference-in-differences
design, thereby differencing selection effects related to a company’s auditor choice.
Fourth, I include company-fixed effects in all regressions, which differences away all
time invariant company-specific determinants of external financing and investment; I also
include time-varying controls for a number of company-level characteristics (such as size,
growth, and profitability) that could cause a company’s financing or investing trends to diverge
post-treatment for reasons unrelated to the PCAOB inspection induced effects. Notwithstanding
the above, I empirically test and find no evidence of a differential pre-treatment trend in the
corporate finance policies of treatment and control observations (see Section 5.3).
4.2. Descriptive statistics
Table 2 presents the distribution of the company-year observations in my sample, the
number of PCAOB inspections, and inspection deficiencies by country (Panel A) and year (Panel
B). Panel A shows that Japan, Taiwan, and the U.K. make up a large fraction of the total number
of observations. Although Canada has the largest numbers of auditor inspections in my sample,
Canadian companies make up less than 1% of the sample. This is because Canadian companies
are often cross-listed on a U.S. stock exchange. Panel A also reveals that the number of PCAOB
inspections in my sample exceed the number of PCAOB inspection reports, which occurs
because some of the inspection reports are disclosed in 2014 towards the end of my sample
period. Finally, Panel A shows that the frequency of Part I Findings (related to engagement-level
deficiencies) far exceed the number of publicly disclosed Part II Findings (related to auditor-
level quality control criticisms). Such a pattern suggests that auditors strive to address PCAOB’s
concerns related to quality control deficiencies to avoid the public disclosure of Part II Findings,
consistent with Aobdia (2016b) and Gipper et al. (2016).
22
Table 2, Panel B shows that the number of observations in my sample are similarly
distributed across the periods covered in my sample. Further, PCAOB inspections begin in 2005
and significantly vary thorough the years in my sample. Similarly, the first PCAOB inspection
report is disclosed in 2006 (for the set of auditors included in my sample) and there is reasonable
variation in the number of reports disclosed each year. Since my identification comes from
variation in the timing of auditor inspections within each country, I also tabulate the distribution
of the number of unique auditors that receive their first PCAOB inspection report by each
country-year (see Table 2, Panel C).19 The table shows that there is considerable variation in the
timing of auditor inspections within each country. Each of 146 initial inspection reports in Panel
C serves as a unique treatment source for different companies in my sample.
Table 3 presents the descriptive statistics for the variables used in my analyses. The
average company spends 4.9% of its average assets on investment and raises external capital
amounting to 2.6% of its average assets in a year. The average net debt (equity) issuance is 0.7%
(1.9%) of average assets. In terms of PCAOB inspection characteristics, the table shows that the
average lag between when the PCAOB completes its inspection fieldwork and discloses the
inspection report is 569 days. The table also shows that 35.9% of the inspected audit
engagements have at least one deficiency identified by the PCAOB. However, only 2.5% of the
PCAOB inspections result in a publicly disclosed quality control criticism. Table 3 shows that
the average company’s auditor is inspected two times by the PCAOB during my sample period.
Further, the average company’s sales grows by 9% per year, it generates cash flows equal to
6.4% of its average assets, and has a return on assets of 2% per year. Note that the majority of
sample is audited by a big-four network auditor, which is partly because the big-four affiliates
have the largest aggregate market share of publicly traded companies across the world and
because they are more likely to have SEC registered companies as their clients.
19 I focus on an auditor’s first inspection report in this table because the indicator variable REPORT is equal to one for all fiscal years following the disclosure of a company’s auditor’s PCAOB inspection report.

23
5. Results
5.1. Does PCAOB oversight affect external financing decisions?
I begin my analyses by examining whether companies audited by PCAOB-inspected
auditors raise additional external capital following their auditor’s PCAOB inspection and
whether the content of the inspection report affects companies’ capital raising behavior. Table 4
presents the results. The first column presents the results from a regression without conditioning
on the content of the inspection report. Column 1 in Table 4 shows that the coefficient for
INSPECTION is statistically insignificant (coef.=0.001; t-stat.=0.41) and the coefficient for
REPORT is statistically significant at the two-tailed 10% level (coef.=0.005; t-stat.=1.66). The
coefficient estimate for REPORT suggests that companies raise additional external capital equal
to 0.5% of their assets, which is approximately 5.4% of the average external capital raised
conditional on raising capital. These coefficients provide initial evidence that companies audited
by PCAOB-inspected auditors raise additional external capital following the disclosure that their
auditor is inspected by the PCAOB.
Column 2 in Table 4 presents the results from a regression that includes two additional
covariates, INSPECTION × %PART I FINDINGS and REPORT × %PART I FINDINGS, that
capture the incremental effect of having engagement-level deficiencies in an auditor’s inspection
report.20 Specifically, %PART I FINDINGS is the proportion of inspected audit engagements that
are identified as having at least one deficiency by the PCAOB inspectors during the inspection
fieldwork. To the extent investors perceive auditors with a larger number of engagement
deficiencies as conducting poor quality audits, the companies whose auditors have a high
engagement-deficiency rate are less likely to gain access to additional external capital as a result
of PCAOB oversight. Christensen et al. (2016) survey 102 investors and find that “…investors
20 The main effect of %PART I FINDINGS is not included in the regressions because it is perfectly collinear with the interaction terms (since only company-years with PCAOB inspections can have non-zero Part I Findings).
24
overwhelmingly associate fewer PCAOB deficiencies with higher overall audit firm quality.”
(p.1651) Thus, I predict that the coefficient for INSPECTION × %PART I FINDINGS and/or
REPORT × %PART I FINDINGS will be negative.
Column 2 in Table 4 shows that the coefficients for INSPECTION and INSPECTION ×
%PART I FINDINGS are statistically insignificant (similar to the evidence in column 1). But
consistent with my predictions, the coefficient for REPORT is positive and statistically
significant (coef.=0.009; t-stat.=2.89) while the coefficient for REPORT × %PART I FINDINGS
is negative and statistically significant (coef.=-0.010; t-stat.=-3.45). These coefficients suggest
that companies audited by PCAOB inspected auditors respond to their auditors’ PCAOB
inspection reports by raising significantly more external capital when their auditor’s inspection
report does not have an engagement deficiency; the increase in external financing in response to
a PCAOB inspection report is significantly smaller when the company’s auditor’s inspection
report reveals that the PCAOB found deficiencies in the manner in which the auditor performed
an audit. These results support my hypothesis and indicate that PCAOB inspection reports
enhance the reliability of financial statements primarily when the inspection report indicates that
the auditor is thorough in the manner in which it performs audits.
The coefficient estimate for REPORT implies that companies issue additional external
capital amounting to 0.9% of their assets if their auditor does not have any engagement
deficiency in its inspection report. However, companies whose auditors have the average
percentage of engagement deficiencies found in my sample of inspection reports raise additional
external capital equal to 0.5% of their assets following the disclosure of their auditors’ inspection
report. These economic magnitudes represent 9.7% and 5.4% of the average external capital
raised conditional on companies raising external capital, respectively. The evidence connecting

25
the content of PCAOB inspection reports to changes in company behavior is especially helpful in
ruling out alternative explanations for the results.
The observation that the effect of PCAOB oversight occurs only following the disclosure
of an inspection report perhaps raises the question of why capital providers do not anticipate the
benefits of PCAOB oversight and extend additional capital to companies in advance of the
report. Since the PCAOB has a well-defined and publicly observable criterion to inspect auditors
– i.e., auditors participating in the audits of SEC registered companies – it is possible for capital
providers to precisely identify the auditors subject to PCAOB oversight in advance of the actual
inspection report date. Thus, it is not immediately clear why capital providers and companies do
not change behavior sooner. One plausible reason why the economic effects of PCAOB
oversight manifest only after the disclosure of inspection reports is that capital providers wait to
observe the content of the inspection reports before supplying additional capital.
Next, I examine whether companies respond to PCAOB auditor oversight by issuing
additional debt or equity or both. Specifically, I change the dependent variable from EXTERNAL
FINANCING to DEBT ISSUANCE and EQUITY ISSUANCE and re-estimate the regressions,
which are presented in Table 5, Panels A and B, respectively. Column 1 in Table 5, Panel A
shows that coefficient for INSPECTION and REPORT are statistically insignificant when the
dependent variable is DEBT ISSUANCE. However, results presented in column 2 of the table
show that the coefficient for REPORT is positive and statistically significant (coef.=0.005; t-
stat.=2.08) and the coefficient for REPORT × %PART I FINDINGS is negative and statistically
significant (coef.=-0.007; t-stat.=-2.97). These coefficients suggest that companies audited by
PCAOB inspected auditors respond to their auditors’ PCAOB inspection reports by issuing
addition debt only when their auditor’s inspection report has a below average engagement-level
deficiency rate. Specifically, companies whose auditors have a zero percent engagement-level
26
deficiency rate, issue additional debt equal to 0.5% of their assets or 7.1% of the average debt
issuance conditional on issuing debt. However, companies whose auditors have the average
engagement-level deficiency rate issue additional debt equal to 0.3%, which is not statistically
different than zero (two-tailed p-value from F-test=0.23).
Table 5, Panel B presents similar results with EQUITY ISSUANCE as the dependent
variable. The first column in Panel B shows that the coefficients for INSPECTION and REPORT
are insignificant. The second column shows that the main and interactive effect for
INSPECTION remains insignificant but the coefficient for REPORT is positive and statistically
significant (coef.=0.004; t-stat.=1.95); the coefficient for REPORT × %PART I FINDINGS is
negative but statistically insignificant at the 10% two-tailed level (coef.=-0.003; t-stat.=-1.41).
These results suggest that companies raise additional equity equal to 0.4% of their assets
following the public disclosure of their auditor’s PCAOB inspection report when the auditor has
a zero percent engagement-level deficiency rate. Companies whose auditors have the sample
average rate of engagement deficiencies respond to PCAOB oversight by issuing additional
equity amounting to 0.3% of their assets (which marginally insignificant; two-tailed p-
value=0.126). The economic magnitude relative to the average equity issuance conditional on
issuing equity is 3% for the average company with a PCAOB-inspected auditor (column 1) and
6% for the average company whose PCAOB-inspected auditor has a zero percent deficiency rate
(column 2). Overall, these results support my hypothesis that PCAOB auditor oversight helps
reduce external financing frictions, leading to an increase in external financing capacity and a
consequent increase in external capital issuances.
5.2. Does PCAOB oversight affect corporate investment decisions?
Next, I examine whether companies audited by PCAOB-inspected auditors increase
investment expenditures following the PCAOB inspections of their auditor. If companies audited
27
by PCAOB inspected auditors have greater access to capital as a result of the increased auditor
oversight, it is plausible that companies also increase investment in response to PCAOB
oversight. Table 6 presents the results.
The first column in Table 6 shows that the coefficient for INSPECTION and REPORT are
statistically insignificant. These results suggest that companies, on average, do not respond to
PCAOB oversight by increasing capital expenditures. The second column in the table presents
the results from a regression that conditions on the content of the PCAOB inspection report. The
table shows that the coefficients for INSPECTION and INSPECTION × %PART I FINDINGS are
statistically insignificant, consistent with the evidence in prior tables. However, the coefficient
REPORT is positive and statistically significant (coef.=0.003; t-stat.=2.60) and the coefficient for
REPORT × %PART I FINDINGS is negative and statistically significant (coef.=-0.005; t-stat.=-
2.80). These coefficients suggest that companies audited by PCAOB-inspected auditors increase
investment only if their auditors’ inspection reports have zero/few engagement-level
deficiencies. In terms of economic magnitude, the coefficient estimate for REPORT (in column
2) suggests that companies respond to the PCAOB inspection of their auditor by increasing
investment by 0.3% of assets or 6.1% of their average annual capital expenditures when the
auditor has a zero-percent deficiency rate. Overall, I interpret the evidence thus far as suggesting
that PCAOB auditor oversight increases in the reliability of the company’s audited financial
statements, which increases the company’s access to external capital (as observed in Tables 4
and 5) and leads to a subsequent increase in investment (Table 6).
5.3. Dynamic analyses of the effect of PCAOB oversight on external financing and investment
To further mitigate endogeneity concerns, I investigate the dynamic effects of PCAOB
inspections on company behavior. If my results are picking up a firm-specific trend related to
changing economic conditions (e.g., because the timing of PCAOB inspection disclosures are

28
coincidentally correlated with changes in economic conditions localized to the companies whose
auditors it inspects), then one might expect the economic changes to affect corporate financing
and investing behavior even before the PCAOB inspection report is disclosed. However, if
companies systematically change their financing and investing behavior only after their auditors’
inspection reports are disclosed, which is staggered in time and varies in its content, then it is
quite unlikely that a correlated omitted variable can explain the results.
In Table 7, I repeat the analyses from tables 4 and 6 after replacing the REPORT
indicator variable with nine indicator variables: REPORT [-4], REPORT [-3], REPORT [-2],
REPORT [-1], REPORT [0], REPORT [1], REPORT [2], REPORT [3] and REPORT [4+]. Each
of these are indicator variables that equal one for the individual years before or after a company’s
auditor’s PCAOB inspection report is publicly disclosed. For example, the variable REPORT [-
4] equals one for a company four years prior to the date its auditor’s PCAOB inspection report is
publicly disclosed. Similarly, REPORT [3] equals one for a company three years after the date
its auditor’s PCAOB inspection report is made public. Finally, REPORT [4+] equals one for a
company for the forth and later years after the date its auditor’s PCAOB inspection report is
made public. I estimate regressions replacing REPORT with the nine indicator variables without
conditioning for the content of the inspection report as well as regressions that interact each of
the nine indicator variables with %PART I FINDINGS.
Table 7, Panel A (B) presents the results when EXTERNAL FINANCING (CAPEX) is the
dependent variable. Panel A shows that all nine indicator variables are statistically insignificant
at conventional significance levels when I do not condition on the content of inspection reports
(column 1). However, the coefficient estimate for the indicator variables capturing the pre-
treatment periods (REPORT [-4], REPORT [-3], REPORT [-2] and REPORT [-1]) range
between -0.002 and -0.001, while the coefficient estimates for the post-treatment periods
29
(REPORT [0], REPORT [1], REPORT [2], REPORT [3] and REPORT [4+]) are larger, ranging
from 0.001 to 0.007. Importantly, once I include interaction terms that capture the content of the
inspection reports, I find that all five post-treatment indicator variables become statistically
significant. Specifically, the coefficients for REPORT [0], REPORT [1], REPORT [2], REPORT
[3] and REPORT [4+] are all positive and statistically significant at the 10% two-tailed level or
better. Further, the coefficients for the interaction of these post-treatment indicator variables and
%PART I FINDINGS are negative in all cases and statistically significant at the 10% two-tailed
level in three of the five cases. None of the pre-treatment indicator variables are statistically
significant. Figure 2 presents a graphical representation of the coefficients for the nine indicator
variables and their 90% confidence intervals. Panel A (B) in the figure corresponds to the
regressions results in the first (second) column in the table.
Table 7, Panel B presents the results when CAPEX is the dependent variable. The first
column presents the regression results without conditioning on the content of inspection reports.
The table shows that the coefficient estimates for the pre-treatment indicator variables (REPORT
[-4], REPORT [-3], REPORT [-2] and REPORT [-1]) range between 0.000 and 0.001 and none
of them are statistically different than zero. In contrast, the coefficient estimates for the post-
treatment periods (REPORT [0], REPORT [1], REPORT [2], REPORT [3] and REPORT [4+])
are larger, ranging from -0.001 to 0.008, and statistically significant in four of the five cases.
Column 2 in the table presents the results from a regression that includes interaction terms
between the nine indicator variables and %PART I FINDINGS. The table shows that none of the
pre-treatment indicator variables or its interaction with %PART I FINDINGS is statistically
significant. However, the four of the five post-treatment indicator variables (REPORT [1],
REPORT [2], REPORT [3] and REPORT [4+]) are positive and statistically significant and four
of the five interaction terms with %PART I FINDINGS are negative and statistically significant.

30
Figure 3 presents a graphical representation of the coefficients for the nine indicator variables
and their 90% confidence intervals. Panel A (B) in the figure corresponds to the regressions
results in the first (second) column in the table. The figures and tables show that there is no
evidence of a pre-treatment effect on external financing and investing activity, supporting my
inference that the change in companies’ corporate finance decisions are a response to the
PCAOB inspection reports of their auditors.
5.4. Cross-sectional analyses
Finally, I conduct cross-sectional tests to further substantiate my inference that PCAOB
oversight eases financing frictions, which allow companies to raise additional external capital
and increase investment. First, I examine whether financially constrained companies are more
responsive to the increase in external financing capacity following the PCAOB inspections of
their auditors. If PCAOB oversight increases access to external finance, then the economic
effects of PCAOB oversight should be larger for financially constrained companies since
external financing capacity is more likely to be a binding constraint for such companies. To test
this prediction, I augment equation 1 by including additional interaction terms with a proxy for
financing constraints. I proxy for financing constraints using an indicator variable that equals one
for company-years that do not pay dividends and are below median in size (FIN
CONSTRAINED). The coefficient for INSPECTION and REPORT capture the effect of PCAOB
oversight on financially unconstrained companies, and the coefficients for the interaction terms
(INSPECTION × FIN CONSTRAINED and REPORT × FIN CONSTRAINED) capture the
incremental effect of PCAOB oversight for financially constrained companies.
Table 8 presents the results. Consistent with my prediction, I find that the coefficient for
REPORT × FIN CONSTRAINED is positive and statistically significant when the dependent
variable is EXTERNAL FINANCING and CAPEX. The table also shows that the coefficient for
REPORT is statistically insignificant in both regressions. These coefficients suggest that only the
31
financially constrained companies raise additional capital and increase investment in response to
the PCAOB inspection reports of their auditors. The coefficient estimates imply that financially
constrained companies increase external financing by 0.9% of their assets and increase capital
expenditures by 0.5% of their assets (per the F-tests) following their auditors’ inspection reports.
These results support my inference that PCAOB oversight relaxes financing frictions and allows
companies to invest more by raising additional capital.
I also examine whether the PCAOB oversight has differential effects for companies
audited by big-four versus non-big-four network auditors. The idea is that the big-four network
auditors are relatively more reputed than auditors not belonging to the big-four network, and thus
the companies audited by a big-four network auditor are likely to derive smaller benefits from
PCAOB oversight. That is, to the extent the big-four network auditors have a reputation for
producing high quality audits, the incremental reliability benefit of PCAOB auditor oversight is
likely to be smaller for the clients of these auditors.
To test this prediction, I augment equation 1 by including additional interaction terms
with an indicator variable that equals one for companies audited by a non-big-four auditor (NOT
BIG4). Table 9 presents the results. The table shows that the coefficients for the interaction terms
(INSPECTION × NOT BIG4 and REPORT × NOT BIG4) are statistically insignificant
irrespective of the dependent variable. These results suggest that companies audited by big-four
and non-big-four network auditors respond similarly to PCAOB auditor oversight. However,
note that approximately 91% of the companies in my sample are audited by a big-four auditor
(see Table 3). Thus, it is plausible that my data lack sufficient variation to detect the differential
effect of PCAOB oversight for companies audited by big-four and non-big-four auditors.
5.5. Untabulated robustness tests
I conduct a number of robustness tests to mitigate concerns that my results are spurious.
First, I test and find that my results are robust to dropping individual countries from my sample.
32
Thus, the documented effects are not idiosyncratic to any one country. Second, I verify that my
results are robust to dropping individual control variables and using different fixed effect
structures (e.g., country-year fixed effects, country-industry-year fixed effects with industry
classifications based on the NAICS rather than SIC). Finally, I test and find that my inferences
are unchanged if I use a matched sample design where the control sample is composed of
companies whose auditors are not subject to PCAOB oversight.
6. Conclusion
In this paper, I use the PCAOB international inspection program as a setting to examine
the effects of auditor regulatory oversight on corporate financing and investing decisions. Even
though non-U.S. companies are not subject to any SEC/PCAOB regulation, their auditors can be
subject to PCAOB inspections if the auditor has at least one client that is cross-listed in the U.S.
As a result, PCAOB’s international inspection program generates within-country variation in
auditor oversight in countries besides the U.S (which allow the PCAOB access to inspect
domestic auditors). In addition, the PCAOB inspections of the vast majority of non-U.S. auditors
occur on a triennial basis, thereby affecting the auditors of different companies at different points
in time. My research design exploits the staggering of PCAOB international inspections within a
country to identify the treatment effect of auditor oversight.
My results based on a generalized difference-in-differences design show that companies
audited by a PCAOB-inspected auditor raise significantly more external capital and increase
capital expenditure following their auditors’ PCAOB inspections. The economic magnitude of
the change in external financing and investment in response to PCAOB auditor inspections is
larger when the inspection reports reveal that the auditor has fewer engagement-level
deficiencies and when companies are financially constrained. I interpret the overall evidence as
33
suggesting that PCAOB auditor oversight increases the reliability of audited financial statements,
which increases a company’s access to capital and facilitates its investment expenditures.
The evidence in this paper is important because it highlights the role of auditor oversight
in the capital allocation process. Most studies examining the effect of regulation face
identification challenges because of the endogenous timing of regulatory changes and the lack of
appropriate control samples (Coates and Srinivasan 2014; Leuz and Wysocki 2016). The
PCAOB international inspection setting provides a unique opportunity to compare companies
that are located in the same country and operate in the same industry-year, and yet are subject to
different levels of regulatory oversight.
Before concluding, I highlight that my inferences are based on a sample of non-U.S.
companies that operate in countries with weaker regulatory and institutional environments than
that in the U.S. Thus the results of this paper, particularly the economic magnitudes, might not
generalize to U.S. companies. In addition, the evidence on benefits of PCAOB auditor oversight
might not generalize to other public regulators in other settings. Finally, my study does not speak
to net benefits of auditor oversight because I do not examine the costs of such oversight.

34
References
Acemoglu, D. and Gietzmann, M. 1997. Auditor independence, incomplete contracts and the role of legal liability’. European Accounting Review 6 (3): 355-375.
Advisory Committee on the Auditing Profession. 2008. Final Report of the Advisory Committee on the Auditing Profession to the U.S. Department of the Treasury. https://www.treasury.gov/about/organizational-structure/offices/Documents/final-report.pdf
Antle, R., 1984. Auditor independence, Journal of Accounting Research 22: 1-20.
Aobdia, D. 2016a. The impact of the PCAOB individual engagement inspection process – preliminary evidence. Working Paper.
Aobdia, D. 2016b. Does the organization and culture of the largest audit firms influence their audit quality and efficiency? Working Paper.
Aobdia, D. and N. Shroff. 2017. Regulatory Oversight and Auditor Market Share. Journal of Accounting and Economics 63(2-3): 262-287.
Badertscher, B., N. Shroff, and H. White. 2013. Externalities of public firm presence: Evidence from private firms’ investment decisions. Journal of Financial Economics 109, 682-706.
Bae, G. S., S. U. Choi, D. S. Dhaliwal, and P. T. Lamoreaux. 2017. Auditors and Client Investment Efficiency. The Accounting Review 92, 2: 19-40.
Balakrishnan, K., Core, J. E., Verdi, R. S. 2014. The Relation between reporting quality and financing and investment: Evidence from Changes in Financing Capacity. Journal of Accounting Research, 52(1), 1-36.
Balakrishnan, K., Watts, R., Zuo, L., 2016. The Effect of Accounting Conservatism on Corporate Investment during the Global Financial Crisis. Journal of Business Finance and Accounting 43.5-6 (2016): 513–542.
Beasley, M., J. Carcello, D. Hermanson, and T. Neal. 2009. The audit committee oversight process. Contemporary Accounting Research 26 (1): 65–122.
Beatty, A., Liao, S. and Weber, J., 2010a. Financial reporting quality, private information, monitoring, and the lease-versus-buy decision. The Accounting Review, 85(4), pp.1215-1238.
Beatty, A., Liao, S. and Weber, J., 2010b. The effect of private information and monitoring on the role of accounting quality in investment decisions. Contemporary Accounting Research, 27(1), pp.17-47.
Biddle, G.C., G. Hilary, and R.S. Verdi. 2009. How does financial reporting quality relate to investment efficiency? Journal of Accounting and Economics 48 (2-3): 112-131.
Blackwell, D. W., T. R. Noland, & D. B. Winters. 1998. The value of auditor assurance: Evidence from loan pricing. Journal of Accounting Research 36(1): 57-70.
Boone, J. P., I. K. Khurana, and K. K. Raman. 2015. Did the 2007 PCAOB Disciplinary Order against Deloitte Impose Actual Costs on the Firm or Improve Its Audit Quality? The Accounting Review 90(2): 405-441.
Bushee, B. J. 1998, The influence of institutional investors on myopic R&D investment behavior. The Accounting Review 73(3), 305–333.
35
Christensen, B. E., S. M. Glover, T.C. Omer, and M. K. Shelley. 2016. Understanding audit quality: Insights from audit professional and investors. Contemporary Accounting Research 33: 1648-1684.
Christensen, B.E., T.C. Omer, N.Y. Sharp, and M. K. Shelley. 2014. Pork Bellies and Public Company Audits: Have Audits Once Again Become Just Another Commodity? Working paper.
Coase, R. 1960. The Problem of Social Cost. Journal of Law and Economics 3: 1-44.
Coates, J.C., 2007. The goals and promise of the Sarbanes-Oxley Act. Journal of Economic Perspectives 21, 91-116.
Coates, J. C., and S. Srinivasan. 2014. SOX after ten years: A multidisciplinary review. Accounting Horizons, 28(3), 627-671.
Coffee, John C., Jr. 2006. Gatekeepers: The Professions and Corporate Governance. Oxford: Oxford University Press.
Cohen, J., G. Krishnamoorthy, and A. Wright. 2010. Corporate governance in the post Sarbanes-Oxley era: Auditor experiences. Contemporary Accounting Research 26 (1): 65–122.
DeFond, M.L., and C.S. Lennox. 2011. The effect of SOX on small auditor exits and audit quality. Journal of Accounting and Economics 52 (1): 21-40.
DeFond, M.L., and C.S. Lennox. 2017. Do PCAOB Inspections Improve the Quality of Internal Control Audits. Journal of Accounting Research 55 (3): 591-627.
DeFond, M.L., and J. Zhang. 2014. A review of archival auditing research. Journal of Accounting and Economics, 58(2-3), 275-326.
Dhaliwal, D.S., P. Lamoreaux, C.S. Lennox, L.M. Mauler. 2015. Management influence on auditor selection and subsequent impairments of auditor independence during the post-SOX period. Contemporary Accounting Research 32 (2): 575-607.
Donovan, J., Frankel, R., Lee, J., Martin, X., and H. Seo. 2014. Issues raised by studying DeFond and Zhang: What should audit researchers do? Journal of Accounting and Economics, 58(2-3), 327-338.
Doty, J. 2012. The Relevance of Audits and the Needs of Investors. Speech at the 31st Annual SEC and Financial Reporting Institute Conference on May 31, 2012. Speech available at: https://pcaobus.org//News/Speech/Pages/05312012_DotyAuditsInvestors.aspx
Doty, J. 2014. Keynote Speech at the 13th Annual Financial Reporting Conference at Baruch College on May 1 2014. See: https://pcaobus.org/News/Speech/Pages/05012014_Baruch.aspx
Dowling, C., Knechel, W. R., Moroney, R., 2015. Public Oversight of the Audit Firms: The Slippery Slope of Enforcing Regulation. Working Paper. The University of Melbourne, University of Florida, and Monash University, Caulfield.
Ettredge, M., E. E. Fuerherm, and C. Li. 2014. Fee pressure and audit quality. Accounting, Organizations and Society 39 (4): 247–263.
Fung, S. Y. K., Raman, K. K., and X.K. Zhu. 2017. Does the PCAOB’s International Inspection Program Improve Audit Quality for Non-US-listed Foreign Clients? Journal of Accounting and Economics 64 (1): 15–36.
36
Gipper, B., C. Leuz, M. Maffett. 2016. Public Audit Oversight and Reporting Credibility: Evidence from the PCAOB Inspection Regime. NBER working paper.
Glover, S. M., Prawitt, D. F., Taylor, M. H. 2009. Audit standard setting and inspection of US Public Companies: A critical assessment and recommendations for fundamental change. Accounting Horizons 23(June): 221–237.
Graham, J. M. Hanlon, and T Shevlin. 2011. Real effects of accounting rules: evidence from multinational firms’ investment location and profit repatriation decisions. Journal of Accounting Research 49: 137-185.
Gramling, A.A., J. Krishnan and Y. Zhang. 2011. Are PCAOB-identified audit deficiencies associated with a change in reporting decisions of triennially inspected audit firms? Auditing: A Journal of Practice and Theory 30 (3): 59-79.
Hadlock, J.H. & Pierce, J. R., 2010. New evidence on measuring financial constraints: Moving beyond the KZ index. Review of Financial Studies, 23(5): 1909-1940.
Hilzenrath, D.S., 2010. Peekaboo: New boss over corporate audits is much like the old one. The Washington Post, July 9, 2010.
Hodowanitz, J., and S.A. Solieri.. 2005. Guarding the guardians. Strategic Finance 87, 47–53.
Hope, O.-K, and W. Thomas. 2008. Managerial empire building and firm disclosure. Journal of Accounting Research 46: 591–626.
Ijiri, Y. Theory of Accounting Measurement. Sarasota, FL: American Accounting Association, 1975.
Jensen, M. C., and W.H. Meckling. 1976. Theory of the Firm: Managerial Behavior, Agency Costs and Ownership Structure. Journal of Financial Economics, 3(4), 305-360.
Johnson, L. M., M. B. Keune, and J. Winchel. 2014. Auditor perceptions of the PCAOB oversight process. Working paper, University of Tennessee, University of Dayton, and University of Virginia.
Kaplan, Steven, and Luigi Zingales, 1997, Do financing constraints explain why investment is correlated with cash flow?, Quarterly Journal of Economics 112, 169-215.
Kausar, A, N. Shroff, and H. White. 2016. Real effects of the audit choice. Journal of Accounting and Economics, 62(1): 157-181.
Krishnan, J., J. Krishnan and H. Song. 2017. PCAOB international inspections and audit quality. The Accounting Review, forthcoming.
Lamoreaux, P. T. 2016. Does PCAOB inspection access improve audit quality? An examination of foreign firms listed in the United States. Journal of Accounting and Economics 61, 313-337.
Landes, W.M. and R.A. Posner. 1975. The private enforcement of law, Journal of Legal Studies 4:1-46.
Lennox, C., and J. Pittman. 2010. Auditing the auditors: Evidence on the recent reforms to the external monitoring of audit firms. Journal of Accounting and Economics 49: 84-103.
Leuz, C. and P. Wysocki. 2016. The Economics of Disclosure and Financial Reporting Regulation: Evidence and Suggestions for Future Research. Journal of Accounting Research 54(2): 525-622.
37
Mahoney, P. G., 2001. The political economy of the Securities Act of 1933. Journal of Legal Studies 30: 1-31.
McNichols, M., and S. Stubben, 2008. Does earnings management affect firms’ investment decisions? The Accounting Review 83 (6), 1571–1603.
Minnis, M., 2011. The value of financial statement verification in debt financing: Evidence from private U.S. firms. Journal of Accounting Research 49, 457–506.
Nagy, A. 2014. PCAOB Quality Control Inspection Reports and Auditor Reputation. Auditing: A Journal of Practice & Theory: August 2014, Vol. 33, No. 3, pp. 87-104.
Palmrose, Z. 2006. “Maintaining the Value and Viability of Auditors as Gatekeepers Under SOX: An Auditing Master Proposal” Book: Yasuyuki Fuchita and Robert E. Litan, eds, (2006) Financial Gatekeepers: Can They Protect Investors? Brookings Institution Press and the Nomura Institute of Capital Markets Research pp.103-135.
PCAOB 2015. Concept release on audit quality indicators. PCAOB Release No. 2015-005.
Peltzman, S. 1976. Toward a More General Theory of Regulation. Journal of Law and Economics 19: 211-240.
Peltzman, S., M. E. Levine, and R.G. Noll. 1989. The Economic Theory of Regulation after a Decade of Deregulation, Brookings Papers on Economic Activity. Microeconomics, Vol. 1989, pp. 1-59.
Pritchard, A. 2006. The irrational auditor and irrational liability. Lewis and Clark Law Review 10 (1): 19–55.
Rajan, R. and L. Zingales. 2003. The great reversals: the politics of financial development in the 20th century. Journal of Financial Economics 69: 5–50.
Shroff, N. 2017. Corporate Investment and Changes in GAAP. Review of Accounting Studies, 22(1): 1-63.
Stigler, G., 1971, The theory of economic regulation, Bell Journal of Economics and Management Science 2, 3–21.
Watts, R., 2003. Conservatism in accounting part 1: Explanations and implications. Accounting Horizons 17, 207-221.
Watts, R. and J. Zimmerman. 1983. Agency problems, auditing, and the theory of the firm: Some evidence. Journal of law and Economics, 613-633.
Watts, R. and J. Zimmerman. 1978. Towards a positive theory of the determination of accounting standards. Accounting review, 112-134.
Whited, T., 2006. External finance constraints and the intertemporal pattern of intermittent investment. Journal of Financial Economics 81, 467–502.

38
Appendix A Variable Definitions
This table provides a detailed description of the procedure used to compute each variable used in our analyses. Our data are obtained either through Audit Analytics, Compustat Global, Capital IQ, or the PCAOB website. All continuous variables are winsorized at 1% and 99% of the distribution and all dollar amounts are in millions. The variables are listed in alphabetical order.
Variable Definition
%PART I FINDINGS
The proportion of inspected engagements that receive audit deficiencies (Part I Finding) in an auditor’s PCAOB inspection report. For auditors with more than one publicly disclosed inspection report, this variable equals the most recent deficiency rate following the company’s fiscal year end date.
ASSET TANGIBILITY The ratio of total tangible assets measured as net property, plant and equipment (data PPENT) scaled by total assets (data AT) as of the fiscal year preceding the dependent variable measurement date.
BIG4 An indicator that equals one for companies audited by one of the big-four affiliated auditor. The big-four auditors include Deloitte, E&Y, KPMG, and PwC.
CAPEX Capital expenditure (data CAPX) scaled by average total assets (data AT).
CASH Total cash and cash equivalent balance (data CHE) scaled by average total assets (data AT) as of the fiscal year preceding the dependent variable measurement date.
CFO Operating cash flows (data OANCF) scaled by average total assets (data AT) as of the fiscal year preceding (concurrent to) the dependent variable measurement date in the external financing (investment) regression.
DAYS BTW INSPECTION & REPORT
The number of days since the completion of an auditor’s PCAOB inspection fieldwork and the public disclosure of its inspection report.
DEBT ISSUANCE Net debt issuance (data DLTIS minus DLTR) scaled by average total assets (data AT). When DLTIS and DLTR are missing, this variable equals the change in total debt for the company (change in data DLTT plus change in data DLC) scaled by average total assets.
DIVIDEND INDICATOR
An indicator that equals one for company-years with positive dividend payments (data DVC > 0). This variable is measured as of the fiscal year preceding the dependent variable measurement date.
EQUITY ISSUANCE Equity issuance (data SSTK) scaled by average total assets (data AT). This variable is set to zero if the variable SSTK is missing in Compustat.
EXTERNAL FINANCING
The sum of DEBT ISSUANCE and EQUITY ISSUANCE as defined above.
FIN CONSTRAINED
An indicator variable that equals one for companies satisfying two criteria: (i) the company is smaller than the median company in my sample as measured by its market value of equity and (ii) the company does not pay a dividend in the year. This variable is measured as of the fiscal year preceding the dependent variable measurement date.
INSPECTION An indicator variable that equals one for the fiscal years in between the completion of the auditor’s PCAOB inspection fieldwork and the public disclosure of the inspection report.
LEVERAGE The ratio of the sum of short- and long-term debt (data DLC plus data DLTT) to total assets (data AT) as of the fiscal year preceding the dependent variable measurement date.
LN(MVE) The natural log of a company’s market value of equity (data PRCC_F × CSHO) as of the fiscal year preceding the dependent variable measurement date for Canadian companies.
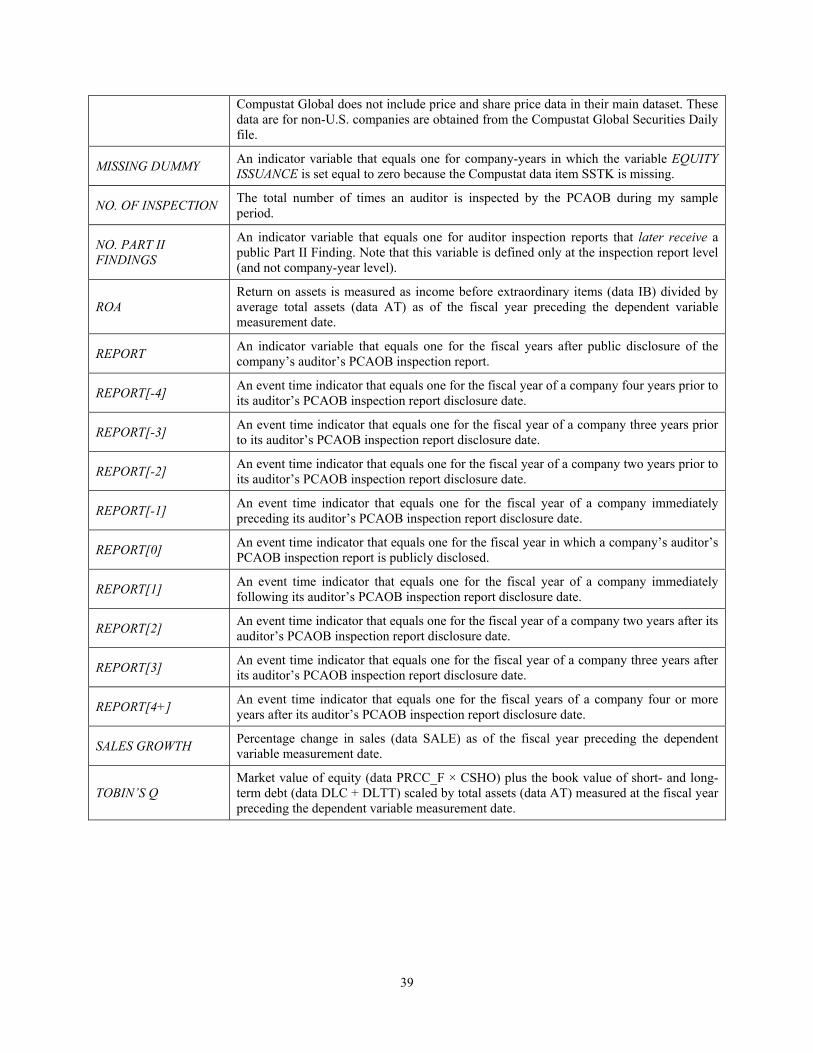
39
Compustat Global does not include price and share price data in their main dataset. These data are for non-U.S. companies are obtained from the Compustat Global Securities Daily file.
MISSING DUMMY An indicator variable that equals one for company-years in which the variable EQUITY ISSUANCE is set equal to zero because the Compustat data item SSTK is missing.
NO. OF INSPECTION The total number of times an auditor is inspected by the PCAOB during my sample period.
NO. PART II FINDINGS
An indicator variable that equals one for auditor inspection reports that later receive a public Part II Finding. Note that this variable is defined only at the inspection report level (and not company-year level).
ROA Return on assets is measured as income before extraordinary items (data IB) divided by average total assets (data AT) as of the fiscal year preceding the dependent variable measurement date.
REPORT An indicator variable that equals one for the fiscal years after public disclosure of the company’s auditor’s PCAOB inspection report.
REPORT[-4] An event time indicator that equals one for the fiscal year of a company four years prior to its auditor’s PCAOB inspection report disclosure date.
REPORT[-3] An event time indicator that equals one for the fiscal year of a company three years prior to its auditor’s PCAOB inspection report disclosure date.
REPORT[-2] An event time indicator that equals one for the fiscal year of a company two years prior to its auditor’s PCAOB inspection report disclosure date.
REPORT[-1] An event time indicator that equals one for the fiscal year of a company immediately preceding its auditor’s PCAOB inspection report disclosure date.
REPORT[0] An event time indicator that equals one for the fiscal year in which a company’s auditor’s PCAOB inspection report is publicly disclosed.
REPORT[1] An event time indicator that equals one for the fiscal year of a company immediately following its auditor’s PCAOB inspection report disclosure date.
REPORT[2] An event time indicator that equals one for the fiscal year of a company two years after its auditor’s PCAOB inspection report disclosure date.
REPORT[3] An event time indicator that equals one for the fiscal year of a company three years after its auditor’s PCAOB inspection report disclosure date.
REPORT[4+] An event time indicator that equals one for the fiscal years of a company four or more years after its auditor’s PCAOB inspection report disclosure date.
SALES GROWTH Percentage change in sales (data SALE) as of the fiscal year preceding the dependent variable measurement date.
TOBIN’S Q Market value of equity (data PRCC_F × CSHO) plus the book value of short- and long-term debt (data DLC + DLTT) scaled by total assets (data AT) measured at the fiscal year preceding the dependent variable measurement date.

40
FIGURE 1 Diagrammatic Representation of the Research Design
Notes: This figure presents an example of my difference-in-differences design where the non-U.S. clients of non-U.S. auditors are affected by PCAOB oversight at different points in time. The inspection/report dates are staggered in time, which is the primary source of variation for my identification. The figure also shows that my design exploits variation in the fiscal year ends of companies with the same auditor. Overall, the figure shows that my design compares the change in the behavior of companies located in the same country in the same period but whose auditors observe changes in regulatory oversight at different points in time.
Country Auditor Insp. dates Rep. dates Clients Fis. Month Variable F02 F03 F04 F05 F06 F07 F08 F09 F10 F11 F12 F13 F14
INSPECTION 0 0 0 0 0 0 0 0 0 0 0 0 0
REPORT 0 0 0 0 0 0 0 0 0 0 1 1 1
INSPECTION 0 0 0 0 0 0 0 0 0 0 0 0 0
REPORT 0 0 0 0 0 0 0 0 0 0 0 1 1
INSPECTION 0 0 0 0 0 0 0 0 0 0 1 0 0
REPORT 0 0 0 0 0 0 0 0 0 0 0 1 1
INSPECTION 0 0 0 0 0 0 1 1 1 0 0 0 0
REPORT 0 0 0 0 0 0 0 0 0 1 1 1 1
INSPECTION 0 0 0 0 0 0 0 1 1 1 0 0 0
REPORT 0 0 0 0 0 0 0 0 0 0 1 1 1
INSPECTION 0 0 0 0 0 0 0 1 1 0 0 0 0
REPORT 0 0 0 0 0 0 0 0 0 0 1 1 1
INSPECTION 0 0 0 0 0 0 0 0 0 0 0 0 0
REPORT 0 0 0 0 0 0 0 0 0 0 0 0 1
INSPECTION 0 0 0 1 0 0 0 0 0 1 0 0 0
REPORT 0 0 0 0 1 1 1 1 1 1 1 1 1
INSPECTION 0 0 0 0 1 0 0 0 0 0 1 0 0
REPORT 0 0 0 0 0 1 1 1 1 1 1 1 1
INSPECTION 0 0 0 0 0 0 0 1 1 0 0 1 0
REPORT 0 0 0 0 0 0 0 0 0 1 1 1 1
INSPECTION 0 0 0 0 0 0 0 1 1 0 0 1 0
REPORT 0 0 0 0 0 0 0 0 0 0 1 1 1
INSPECTION 0 0 0 0 0 0 0 1 1 0 0 0 0
REPORT 0 0 0 0 0 0 0 0 0 0 1 1 1
INSPECTION 0 0 0 0 0 0 0 0 0 1 1 0 0
REPORT 0 0 0 0 0 0 1 1 1 1 1 1 1
INSPECTION 0 0 0 0 0 0 0 0 0 0 1 0 0
REPORT 0 0 0 0 0 0 0 1 1 1 1 1 1
S.R
. Bat
libo
i & C
o10/7/2011 2/2/2012
Exide Industries
31-Mar
Oudh Sugar Mills
30-Jun
Bata India 31-Dec
Del
oitt
e H
aski
ns &
Se
lls 2/29/2008
11/22/2010 3/8/2013
4/29/2011 10/27/2011 10/24/2013
Mahindra & Mahindra
31-Mar
Automotive Axles
30-Sep
KSB Pumps 31-Dec
31-Mar
ADVFN 30-Jun
Nichols
T.R
. C
hadh
a &
Co.
9/13/2013 3/25/2014Narmada Gelatines
31-Mar
BD
O 12/16/2005 11/2/2012
12/20/2006 12/19/2013
Blacks Leisure
28-Feb
Uni
ted
Kin
gdom
Indi
a
31-Dec
PWC 2/29/2008
8/19/20119/30/2008 10/1/2013
Harvey Nash Group
31-Jan
Sportech 31-Dec
Prezzo 31-Dec
Gra
nt T
horn
ton
7/17/2008 6/29/2012
4/29/2011 7/1/2013
Caffyns

41
FIGURE 2 Effect of PCAOB Auditor Oversight on External Capital Issuances by Companies
Panel A: Effect of PCAOB oversight on external capital issuances
Panel B: Effect of PCAOB oversight on external capital issuances conditional on having zero deficiencies in the inspection report
Notes: In the figure above, the x-axis represents time relative a company’s auditor’s PCAOB report date and the y-axis represents the amount of external capital (debt plus equity) issued scaled by assets. The figure plots the two-tailed 90% confidence interval around each point estimate of the relation between PCAOB oversight and external financing. Panel A presents the average effect for all companies and Panel B presents the average effect conditional on the auditor receiving a clean PCAOB inspection report (i.e., one without a Part I Finding).
-0.035
-0.025
-0.015
-0.005
0.005
0.015
0.025
0.035
t‐4 t‐3 t‐2 t‐1 t t+1 t+2 t+3 t+4 & later
-0.035
-0.025
-0.015
-0.005
0.005
0.015
0.025
0.035
t‐4 t‐3 t‐2 t‐1 t t+1 t+2 t+3 t+4 & later
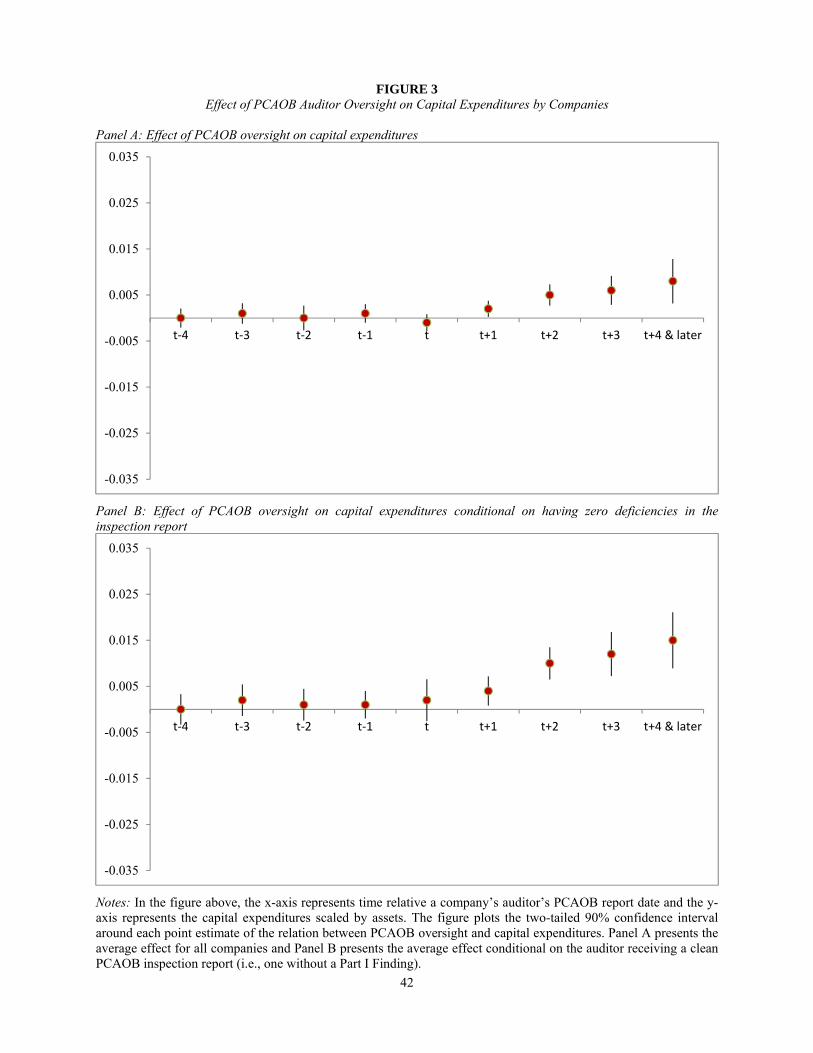
42
FIGURE 3 Effect of PCAOB Auditor Oversight on Capital Expenditures by Companies
Panel A: Effect of PCAOB oversight on capital expenditures
Panel B: Effect of PCAOB oversight on capital expenditures conditional on having zero deficiencies in the inspection report
Notes: In the figure above, the x-axis represents time relative a company’s auditor’s PCAOB report date and the y-axis represents the capital expenditures scaled by assets. The figure plots the two-tailed 90% confidence interval around each point estimate of the relation between PCAOB oversight and capital expenditures. Panel A presents the average effect for all companies and Panel B presents the average effect conditional on the auditor receiving a clean PCAOB inspection report (i.e., one without a Part I Finding).
-0.035
-0.025
-0.015
-0.005
0.005
0.015
0.025
0.035
t‐4 t‐3 t‐2 t‐1 t t+1 t+2 t+3 t+4 & later
-0.035
-0.025
-0.015
-0.005
0.005
0.015
0.025
0.035
t‐4 t‐3 t‐2 t‐1 t t+1 t+2 t+3 t+4 & later
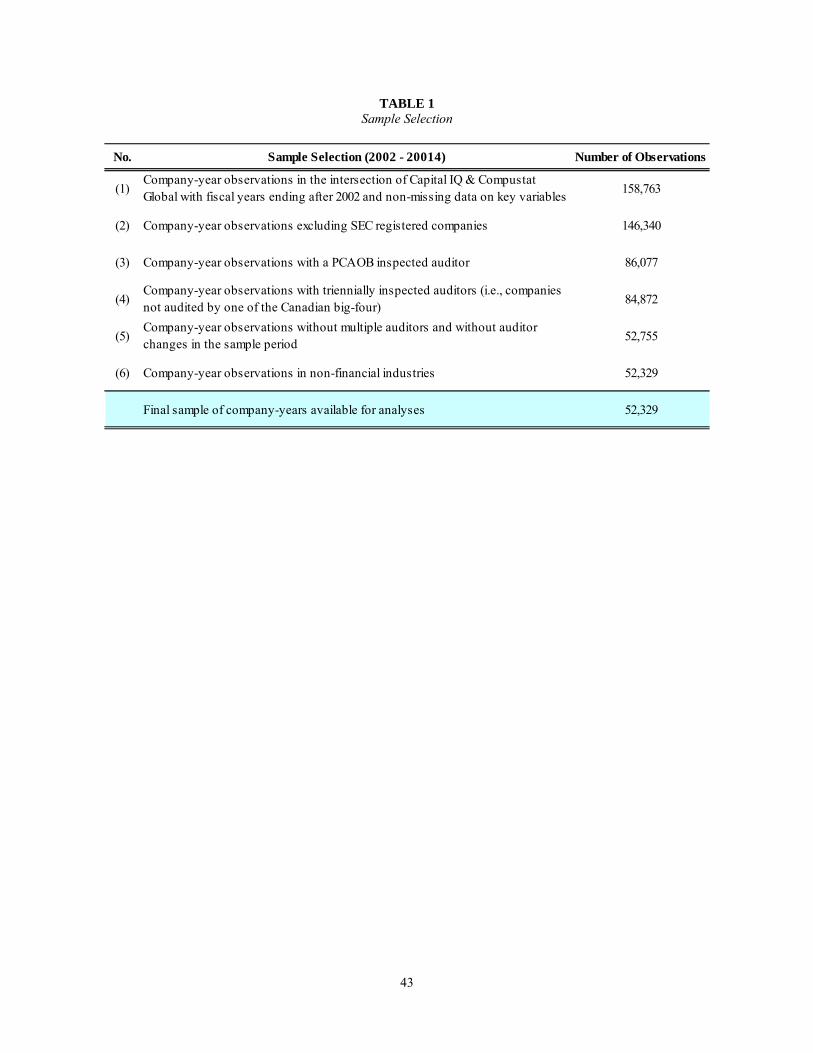
43
TABLE 1 Sample Selection
No. Sample Selection (2002 - 20014) Number of Observations
(1)Company-year observations in the intersection of Capital IQ & Compustat Global with fiscal years ending after 2002 and non-missing data on key variables
158,763
(2) Company-year observations excluding SEC registered companies 146,340
(3) Company-year observations with a PCAOB inspected auditor 86,077
(4)Company-year observations with triennially inspected auditors (i.e., companies not audited by one of the Canadian big-four)
84,872
(5)Company-year observations without multiple auditors and without auditor changes in the sample period
52,755
(6) Company-year observations in non-financial industries 52,329
Final sample of company-years available for analyses 52,329
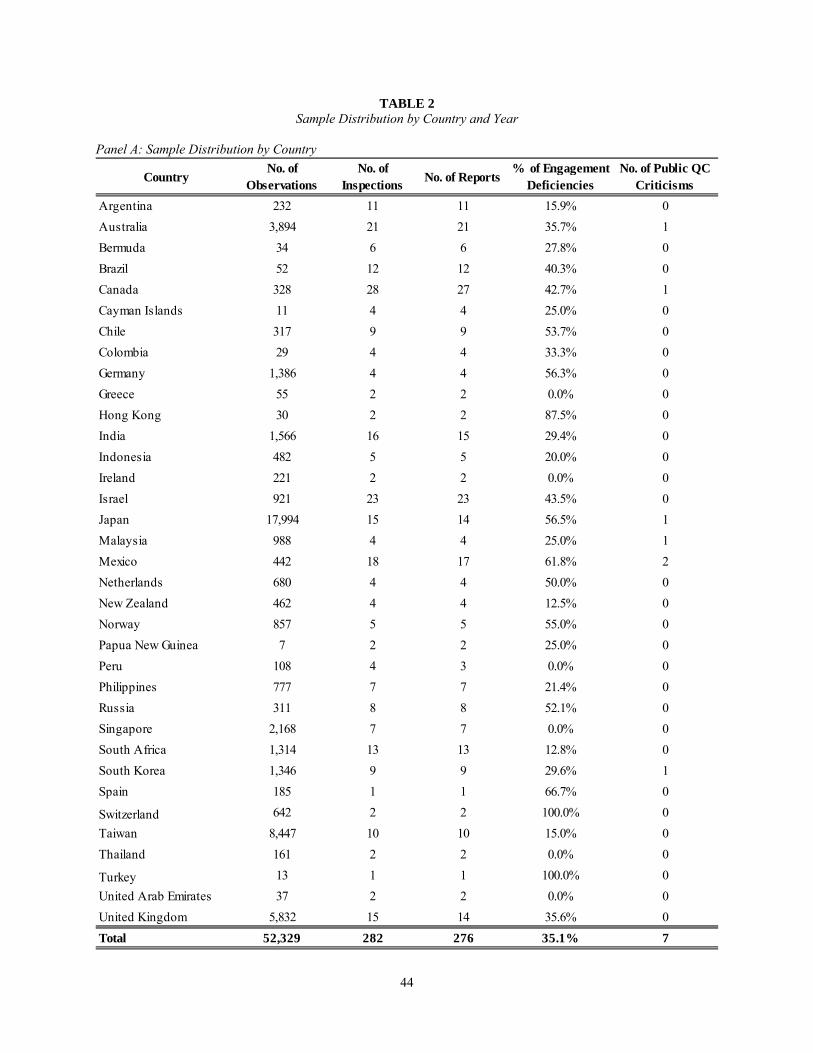
44
TABLE 2 Sample Distribution by Country and Year
Panel A: Sample Distribution by Country
CountryNo. of
Observations No. of
InspectionsNo. of Reports
% of Engagement Deficiencies
No. of Public QC Criticisms
Argentina 232 11 11 15.9% 0
Australia 3,894 21 21 35.7% 1
Bermuda 34 6 6 27.8% 0
Brazil 52 12 12 40.3% 0
Canada 328 28 27 42.7% 1
Cayman Islands 11 4 4 25.0% 0
Chile 317 9 9 53.7% 0
Colombia 29 4 4 33.3% 0
Germany 1,386 4 4 56.3% 0
Greece 55 2 2 0.0% 0
Hong Kong 30 2 2 87.5% 0
India 1,566 16 15 29.4% 0
Indonesia 482 5 5 20.0% 0
Ireland 221 2 2 0.0% 0
Israel 921 23 23 43.5% 0
Japan 17,994 15 14 56.5% 1
Malaysia 988 4 4 25.0% 1
Mexico 442 18 17 61.8% 2
Netherlands 680 4 4 50.0% 0
New Zealand 462 4 4 12.5% 0
Norway 857 5 5 55.0% 0
Papua New Guinea 7 2 2 25.0% 0
Peru 108 4 3 0.0% 0
Philippines 777 7 7 21.4% 0
Russia 311 8 8 52.1% 0
Singapore 2,168 7 7 0.0% 0
South Africa 1,314 13 13 12.8% 0
South Korea 1,346 9 9 29.6% 1
Spain 185 1 1 66.7% 0
Switzerland 642 2 2 100.0% 0
Taiwan 8,447 10 10 15.0% 0
Thailand 161 2 2 0.0% 0
Turkey 13 1 1 100.0% 0
United Arab Emirates 37 2 2 0.0% 0
United Kingdom 5,832 15 14 35.6% 0
Total 52,329 282 276 35.1% 7
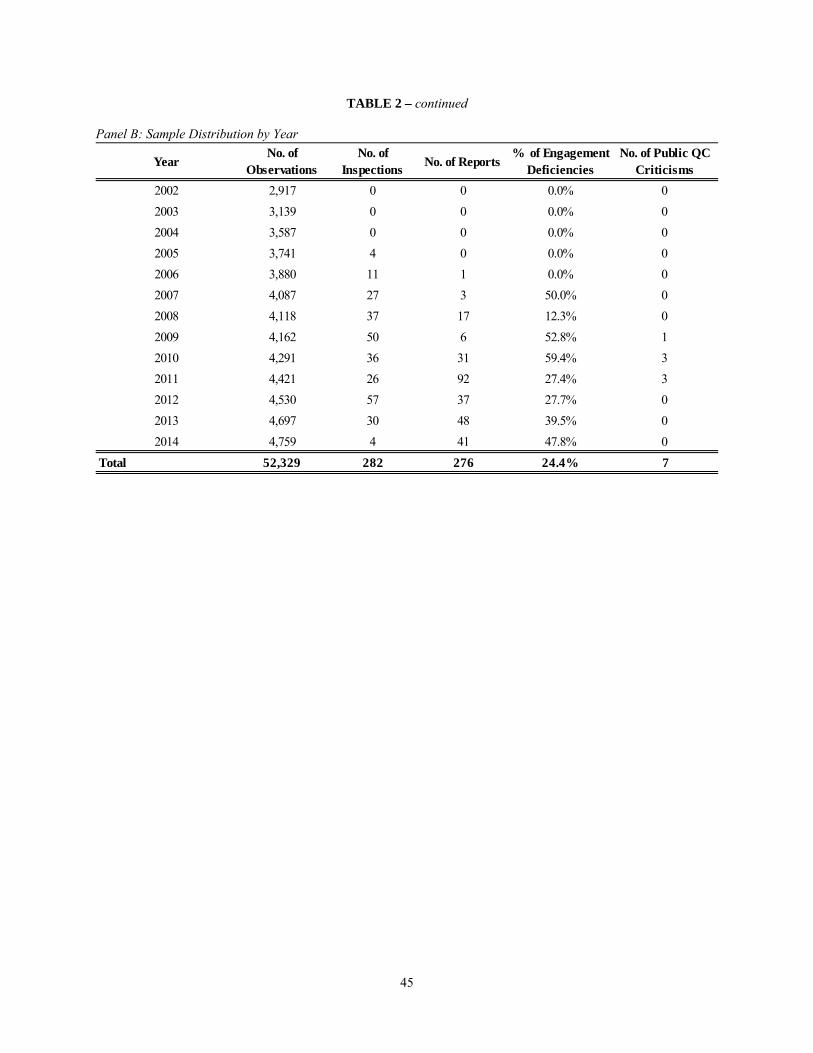
45
TABLE 2 – continued Panel B: Sample Distribution by Year
YearNo. of
Observations No. of
InspectionsNo. of Reports
% of Engagement Deficiencies
No. of Public QC Criticisms
2002 2,917 0 0 0.0% 0
2003 3,139 0 0 0.0% 0
2004 3,587 0 0 0.0% 0
2005 3,741 4 0 0.0% 0
2006 3,880 11 1 0.0% 0
2007 4,087 27 3 50.0% 0
2008 4,118 37 17 12.3% 0
2009 4,162 50 6 52.8% 1
2010 4,291 36 31 59.4% 3
2011 4,421 26 92 27.4% 3
2012 4,530 57 37 27.7% 0
2013 4,697 30 48 39.5% 0
2014 4,759 4 41 47.8% 0
Total 52,329 282 276 24.4% 7

46
TABLE 2 – continued Panel C: Distribution of the number of auditors receiving their first inspection report in each country-year pair
Notes: Panel A (B) in this table presents the distribution of the number of company-year observations, the number of inspection fieldwork end dates, the number of inspection report disclosures, the average percentage of engagement-level deficiencies, and the number of inspection reports with publicly disclosed quality control criticisms by country (year). Panel C presents the distribution of the number of initial auditor inspection reports disclosed by country and year.
Country \ Year 2006 2007 2008 2009 2010 2011 2012 2013 2014
Argentina 0 0 3 0 0 1 0 0 0
Australia 0 0 0 0 3 5 1 0 1
Bermuda 0 0 2 0 0 0 0 0 0
Brazil 0 0 0 0 4 0 0 0 0
Canada 0 3 3 0 3 2 0 0 0
Cayman Islands 0 0 0 0 1 1 1 0 1
Chile 0 0 2 1 0 0 0 0 0
Colombia 0 0 0 1 0 1 0 0 0
Germany 0 0 0 0 0 0 0 2 2
Greece 0 0 0 0 0 2 0 0 0
Hong Kong 0 0 0 0 1 0 0 0 0
India 0 0 1 0 0 4 2 0 2
Indonesia 0 0 0 0 0 2 0 0 0
Ireland 0 0 0 0 0 2 0 0 0
Israel 0 0 1 1 4 3 0 0 0
Japan 0 0 0 0 1 4 1 1 0
Malaysia 0 0 0 0 0 4 0 0 0
Mexico 0 0 1 2 2 1 0 0 0
Netherlands 0 0 0 0 0 0 0 2 2
New Zealand 0 0 1 0 0 0 1 0 0
Norway 0 0 0 0 0 1 1 1 1
Papua New Guinea 0 0 0 0 0 1 0 0 0
Peru 0 0 0 0 0 1 1 0 0
Philippines 0 0 0 0 0 3 1 0 1
Russia 0 0 0 0 3 1 1 0 0
Singapore 0 0 0 0 0 4 1 0 0
South Africa 0 0 0 0 3 1 2 1 0
South Korea 0 0 0 0 1 4 0 0 0
Spain 0 0 0 0 0 0 0 0 1
Switzerland 0 0 0 0 0 0 0 0 2
Taiwan 0 0 2 0 1 1 0 0 0
Thailand 0 0 0 0 0 1 0 0 0
Turkey 0 0 0 0 0 0 0 0 1
United Arab Emirates 0 0 0 0 0 2 0 0 0
United Kingdom 1 0 1 1 1 1 0 2 2
Total 1 3 17 6 28 53 13 9 16

47
TABLE 3 Descriptive Statistics
Notes: This table presents a number of descriptive statistics for my sample companies. The variable definitions are available in Appendix A.
Variables Mean SD P25 P50 P75 N
External financing & investment proxies
CAPEX 0.049 0.057 0.013 0.031 0.062 52,329
EXTERNAL FINANCING 0.026 0.118 -0.021 0.000 0.045 52,329
DEBT ISSUANCE 0.007 0.086 -0.025 0.000 0.029 52,329
EQUITY ISSUANCE 0.019 0.079 0.000 0.000 0.000 52,329
Inspection report characteristics
DAYS BTW INSPECTION & REPORT 568.8 363.2 307.8 450.0 819.8 276
%PART I FINDINGS 0.359 0.385 0.000 0.333 0.667 276
NO. PART II FINDINGS 0.025 0.158 0.000 0.000 0.000 276
Company characteristics
NO. OF INSPECTION 2.158 0.676 2.000 2.000 3.000 52,329
TOBIN'S Q 1.160 1.198 0.571 0.812 1.254 52,329
SALES GROWTH 0.090 0.338 -0.044 0.045 0.155 52,329
CFO 0.064 0.108 0.023 0.067 0.116 52,329
ROA 0.020 0.122 0.004 0.031 0.069 52,329
DIVIDEND INDICATOR 0.566 0.496 0.000 1.000 1.000 52,329
LN(MVE) 7.822 2.936 5.767 8.073 9.796 52,329
CASH 0.172 0.157 0.059 0.125 0.235 52,329
LEVERAGE 0.208 0.184 0.039 0.178 0.329 52,329
ASSET TANGIBILITY 0.306 0.211 0.137 0.277 0.437 52,329
BIG4 0.911 0.284 1.000 1.000 1.000 52,329
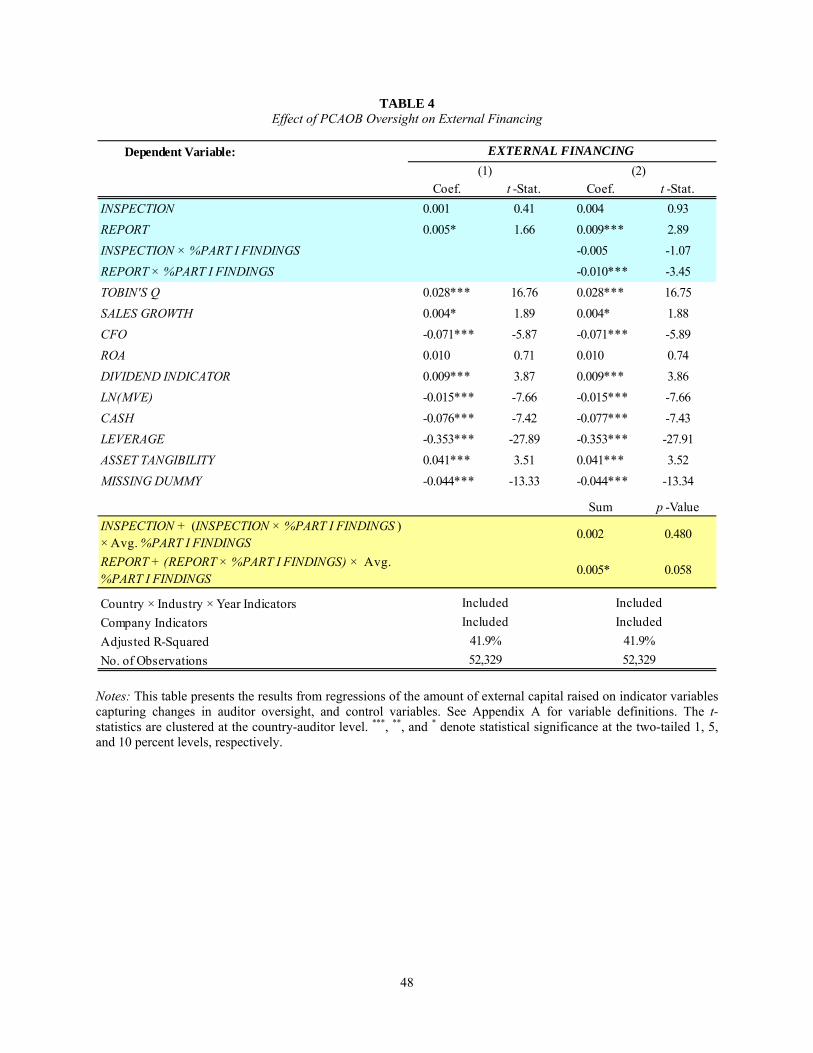
48
TABLE 4 Effect of PCAOB Oversight on External Financing
Notes: This table presents the results from regressions of the amount of external capital raised on indicator variables capturing changes in auditor oversight, and control variables. See Appendix A for variable definitions. The t-statistics are clustered at the country-auditor level. ***, **, and * denote statistical significance at the two-tailed 1, 5, and 10 percent levels, respectively.
Dependent Variable:
Coef. t -Stat. Coef. t -Stat.
INSPECTION 0.001 0.41 0.004 0.93
REPORT 0.005* 1.66 0.009*** 2.89
INSPECTION × %PART I FINDINGS -0.005 -1.07
REPORT × %PART I FINDINGS -0.010*** -3.45
TOBIN'S Q 0.028*** 16.76 0.028*** 16.75
SALES GROWTH 0.004* 1.89 0.004* 1.88
CFO -0.071*** -5.87 -0.071*** -5.89
ROA 0.010 0.71 0.010 0.74
DIVIDEND INDICATOR 0.009*** 3.87 0.009*** 3.86
LN(MVE) -0.015*** -7.66 -0.015*** -7.66
CASH -0.076*** -7.42 -0.077*** -7.43
LEVERAGE -0.353*** -27.89 -0.353*** -27.91
ASSET TANGIBILITY 0.041*** 3.51 0.041*** 3.52
MISSING DUMMY -0.044*** -13.33 -0.044*** -13.34
Sum p -Value
INSPECTION + (INSPECTION × %PART I FINDINGS ) × Avg. %PART I FINDINGS
0.002 0.480
REPORT + (REPORT × %PART I FINDINGS) × Avg. %PART I FINDINGS
0.005* 0.058
Country × Industry × Year Indicators
Company Indicators
Adjusted R-Squared
No. of Observations
EXTERNAL FINANCING
(1) (2)
52,329
41.9%
52,329
Included
Included
Included
Included
41.9%
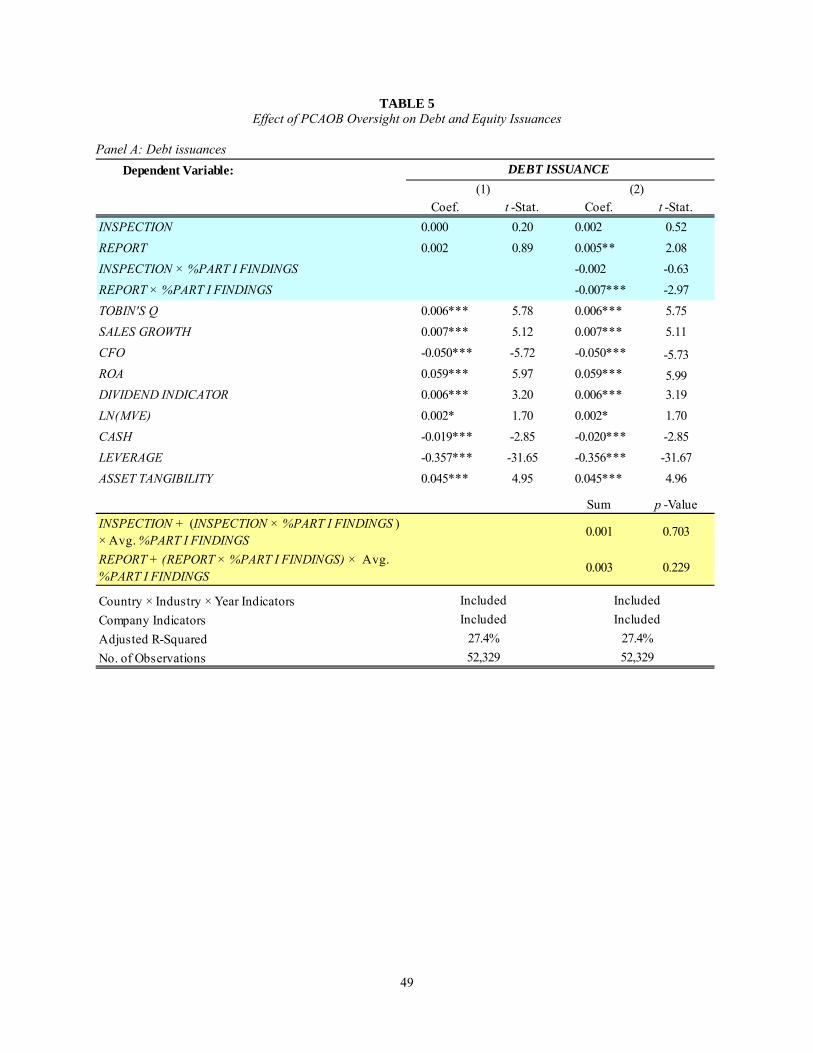
49
TABLE 5 Effect of PCAOB Oversight on Debt and Equity Issuances
Panel A: Debt issuances
Dependent Variable:
Coef. t -Stat. Coef. t -Stat.
INSPECTION 0.000 0.20 0.002 0.52
REPORT 0.002 0.89 0.005** 2.08
INSPECTION × %PART I FINDINGS -0.002 -0.63
REPORT × %PART I FINDINGS -0.007*** -2.97
TOBIN'S Q 0.006*** 5.78 0.006*** 5.75
SALES GROWTH 0.007*** 5.12 0.007*** 5.11
CFO -0.050*** -5.72 -0.050*** -5.73
ROA 0.059*** 5.97 0.059*** 5.99
DIVIDEND INDICATOR 0.006*** 3.20 0.006*** 3.19
LN(MVE) 0.002* 1.70 0.002* 1.70
CASH -0.019*** -2.85 -0.020*** -2.85
LEVERAGE -0.357*** -31.65 -0.356*** -31.67
ASSET TANGIBILITY 0.045*** 4.95 0.045*** 4.96
Sum p -Value
INSPECTION + (INSPECTION × %PART I FINDINGS ) × Avg. %PART I FINDINGS
0.001 0.703
REPORT + (REPORT × %PART I FINDINGS) × Avg. %PART I FINDINGS
0.003 0.229
Country × Industry × Year Indicators
Company Indicators
Adjusted R-Squared
No. of Observations
DEBT ISSUANCE
(1) (2)
Included Included
Included Included
27.4% 27.4%
52,329 52,329
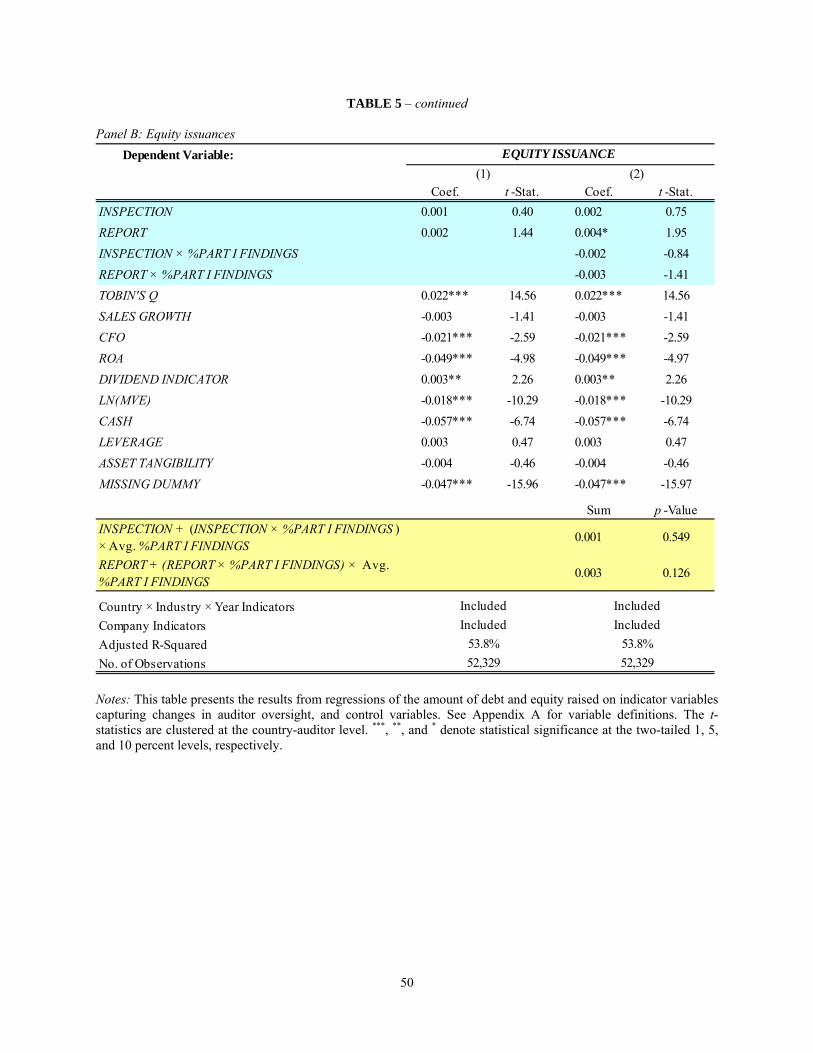
50
TABLE 5 – continued Panel B: Equity issuances
Notes: This table presents the results from regressions of the amount of debt and equity raised on indicator variables capturing changes in auditor oversight, and control variables. See Appendix A for variable definitions. The t-statistics are clustered at the country-auditor level. ***, **, and * denote statistical significance at the two-tailed 1, 5, and 10 percent levels, respectively.
Dependent Variable:
Coef. t -Stat. Coef. t -Stat.
INSPECTION 0.001 0.40 0.002 0.75
REPORT 0.002 1.44 0.004* 1.95
INSPECTION × %PART I FINDINGS -0.002 -0.84
REPORT × %PART I FINDINGS -0.003 -1.41
TOBIN'S Q 0.022*** 14.56 0.022*** 14.56
SALES GROWTH -0.003 -1.41 -0.003 -1.41
CFO -0.021*** -2.59 -0.021*** -2.59
ROA -0.049*** -4.98 -0.049*** -4.97
DIVIDEND INDICATOR 0.003** 2.26 0.003** 2.26
LN(MVE) -0.018*** -10.29 -0.018*** -10.29
CASH -0.057*** -6.74 -0.057*** -6.74
LEVERAGE 0.003 0.47 0.003 0.47
ASSET TANGIBILITY -0.004 -0.46 -0.004 -0.46
MISSING DUMMY -0.047*** -15.96 -0.047*** -15.97
Sum p -Value
INSPECTION + (INSPECTION × %PART I FINDINGS ) × Avg. %PART I FINDINGS
0.001 0.549
REPORT + (REPORT × %PART I FINDINGS) × Avg. %PART I FINDINGS
0.003 0.126
Country × Industry × Year Indicators
Company Indicators
Adjusted R-Squared
No. of Observations
53.8% 53.8%
52,329 52,329
Included Included
Included Included
EQUITY ISSUANCE
(1) (2)
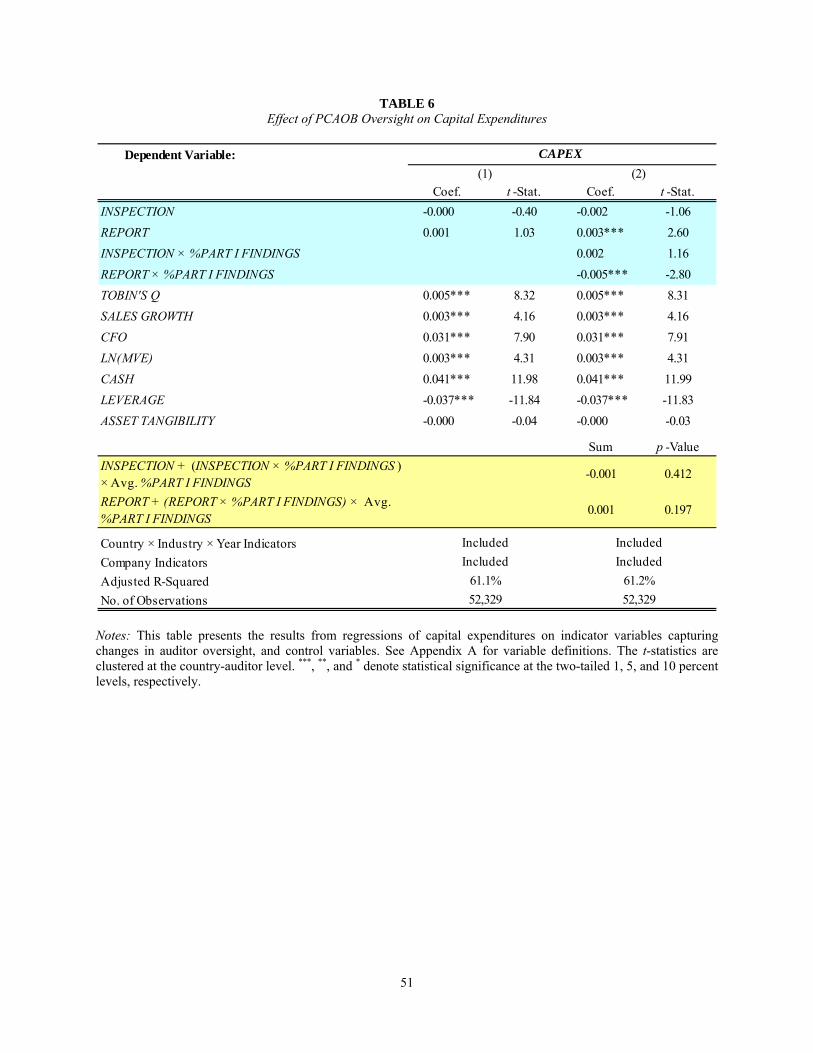
51
TABLE 6 Effect of PCAOB Oversight on Capital Expenditures
Notes: This table presents the results from regressions of capital expenditures on indicator variables capturing changes in auditor oversight, and control variables. See Appendix A for variable definitions. The t-statistics are clustered at the country-auditor level. ***, **, and * denote statistical significance at the two-tailed 1, 5, and 10 percent levels, respectively.
Dependent Variable:
Coef. t -Stat. Coef. t -Stat.
INSPECTION -0.000 -0.40 -0.002 -1.06
REPORT 0.001 1.03 0.003*** 2.60
INSPECTION × %PART I FINDINGS 0.002 1.16
REPORT × %PART I FINDINGS -0.005*** -2.80
TOBIN'S Q 0.005*** 8.32 0.005*** 8.31
SALES GROWTH 0.003*** 4.16 0.003*** 4.16
CFO 0.031*** 7.90 0.031*** 7.91
LN(MVE) 0.003*** 4.31 0.003*** 4.31
CASH 0.041*** 11.98 0.041*** 11.99
LEVERAGE -0.037*** -11.84 -0.037*** -11.83
ASSET TANGIBILITY -0.000 -0.04 -0.000 -0.03
Sum p -Value
INSPECTION + (INSPECTION × %PART I FINDINGS ) × Avg. %PART I FINDINGS
-0.001 0.412
REPORT + (REPORT × %PART I FINDINGS) × Avg. %PART I FINDINGS
0.001 0.197
Country × Industry × Year Indicators
Company Indicators
Adjusted R-Squared
No. of Observations
61.1% 61.2%
52,329 52,329
CAPEX
(1) (2)
Included Included
Included Included
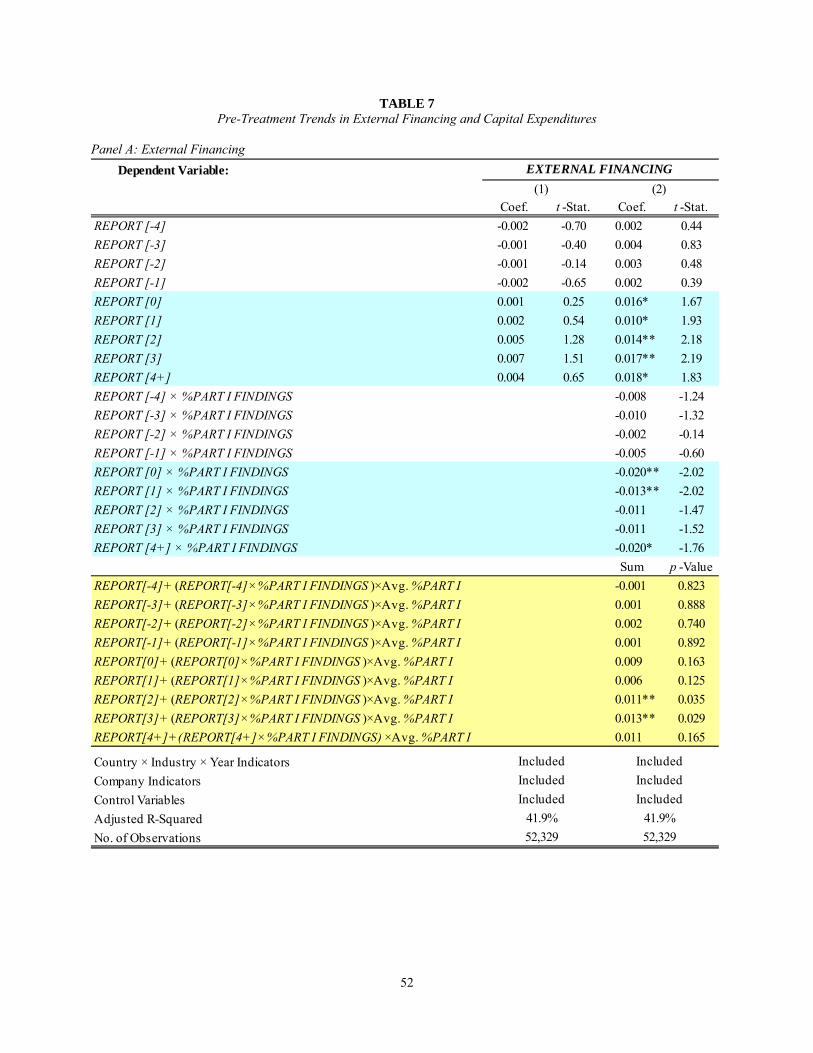
52
TABLE 7 Pre-Treatment Trends in External Financing and Capital Expenditures
Panel A: External Financing
Dependent Variable:
Coef. t -Stat. Coef. t -Stat.
REPORT [-4] -0.002 -0.70 0.002 0.44
REPORT [-3] -0.001 -0.40 0.004 0.83
REPORT [-2] -0.001 -0.14 0.003 0.48
REPORT [-1] -0.002 -0.65 0.002 0.39
REPORT [0] 0.001 0.25 0.016* 1.67
REPORT [1] 0.002 0.54 0.010* 1.93
REPORT [2] 0.005 1.28 0.014** 2.18
REPORT [3] 0.007 1.51 0.017** 2.19
REPORT [4+] 0.004 0.65 0.018* 1.83
REPORT [-4] × %PART I FINDINGS -0.008 -1.24
REPORT [-3] × %PART I FINDINGS -0.010 -1.32
REPORT [-2] × %PART I FINDINGS -0.002 -0.14
REPORT [-1] × %PART I FINDINGS -0.005 -0.60
REPORT [0] × %PART I FINDINGS -0.020** -2.02
REPORT [1] × %PART I FINDINGS -0.013** -2.02
REPORT [2] × %PART I FINDINGS -0.011 -1.47
REPORT [3] × %PART I FINDINGS -0.011 -1.52
REPORT [4+] × %PART I FINDINGS -0.020* -1.76
Sum p -Value
REPORT[-4]+ (REPORT[-4]×%PART I FINDINGS )×Avg. %PART I -0.001 0.823
REPORT[-3]+ (REPORT[-3]×%PART I FINDINGS )×Avg. %PART I 0.001 0.888
REPORT[-2]+ (REPORT[-2]×%PART I FINDINGS )×Avg. %PART I 0.002 0.740
REPORT[-1]+ (REPORT[-1]×%PART I FINDINGS )×Avg. %PART I 0.001 0.892
REPORT[0]+ (REPORT[0]×%PART I FINDINGS )×Avg. %PART I 0.009 0.163
REPORT[1]+ (REPORT[1]×%PART I FINDINGS )×Avg. %PART I 0.006 0.125
REPORT[2]+ (REPORT[2]×%PART I FINDINGS )×Avg. %PART I 0.011** 0.035
REPORT[3]+ (REPORT[3]×%PART I FINDINGS )×Avg. %PART I 0.013** 0.029
REPORT[4+]+(REPORT[4+]×%PART I FINDINGS) ×Avg. %PART I 0.011 0.165
Country × Industry × Year Indicators
Company Indicators
Control Variables
Adjusted R-Squared
No. of Observations
Included Included
(1) (2)
EXTERNAL FINANCING
Included Included
52,329 52,329
41.9% 41.9%
Included Included

53
TABLE 7 – continued Panel B: Capital Expenditures
Notes: This table presents the results from regressions of external financing and capital expenditures on indicator variables capturing changes in auditor oversight, auditor deficiencies identified in auditors’ inspection reports and control variables. See Appendix A for variable definitions. The t-statistics are clustered at the country-auditor level. ***, **, and * denote statistical significance at the two-tailed 1, 5, and 10 percent levels, respectively.
Dependent Variable:
Coef. t -Stat. Coef. t -Stat.
REPORT [-4] -0.000 -0.12 0.000 0.22
REPORT [-3] 0.001 0.93 0.002 1.02
REPORT [-2] -0.000 -0.29 0.001 0.46
REPORT [-1] 0.001 1.10 0.001 0.65
REPORT [0] -0.001 -0.58 0.002 0.59
REPORT [1] 0.002* 1.65 0.004** 2.15
REPORT [2] 0.005*** 3.66 0.010*** 4.65
REPORT [3] 0.006*** 3.19 0.012*** 4.01
REPORT [4+] 0.008*** 2.72 0.015*** 3.98
REPORT [-4] × %PART I FINDINGS -0.002 -0.55
REPORT [-3] × %PART I FINDINGS -0.002 -0.87
REPORT [-2] × %PART I FINDINGS -0.005 -0.67
REPORT [-1] × %PART I FINDINGS 0.003 0.88
REPORT [0] × %PART I FINDINGS -0.003 -0.93
REPORT [1] × %PART I FINDINGS -0.004* -1.70
REPORT [2] × %PART I FINDINGS -0.007** -2.54
REPORT [3] × %PART I FINDINGS -0.009*** -2.99
REPORT [4+] × %PART I FINDINGS -0.012** -2.55
Sum p -Value
REPORT[-4]+ (REPORT[-4]×%PART I FINDINGS )×Avg. %PART I 0.000 0.917
REPORT[-3]+ (REPORT[-3]×%PART I FINDINGS )×Avg. %PART I 0.001 0.366
REPORT[-2]+ (REPORT[-2]×%PART I FINDINGS )×Avg. %PART I -0.001 0.760
REPORT[-1]+ (REPORT[-1]×%PART I FINDINGS )×Avg. %PART I 0.002 0.121
REPORT[0]+ (REPORT[0]×%PART I FINDINGS )×Avg. %PART I 0.001 0.735
REPORT[1]+ (REPORT[1]×%PART I FINDINGS )×Avg. %PART I 0.003** 0.033
REPORT[2]+ (REPORT[2]×%PART I FINDINGS )×Avg. %PART I 0.007*** 0.000
REPORT[3]+ (REPORT[3]×%PART I FINDINGS )×Avg. %PART I 0.008*** 0.000
REPORT[4+]+(REPORT[4+]×%PART I FINDINGS) ×Avg. %PART I 0.010*** 0.001
Country × Industry × Year Indicators
Company Indicators
Control Variables
Adjusted R-Squared
No. of Observations 52,329 52,329
(1) (2)
Included Included
Included Included
CAPEX
Included Included
61.2% 61.2%

54
TABLE 8 Economic Effects of PCAOB Oversight Conditional on the Degree of Financing Constraints
Notes: This table presents the results from regressions of external financing and capital expenditures on indicator variables capturing changes in auditor oversight and control variables conditioned on the degree of financing constraints. See Appendix A for variable definitions. The t-statistics are clustered at the country-auditor level. ***, **, and * denote statistical significance at the two-tailed 1, 5, and 10 percent levels, respectively.
Dependent Variable:
Coef. t -Stat. Coef. t -Stat.
INSPECTION 0.003 1.12 -0.000 -0.54
REPORT 0.003 0.94 -0.001 -0.63
INSPECTION × FIN CONSTRAINED -0.006 -1.25 0.001 0.38
REPORT × FIN CONSTRAINED 0.007* 1.73 0.005*** 3.77
FIN CONSTRAINED -0.005 -1.33 -0.003** -2.19
TOBIN'S Q 0.028*** 16.68 0.005*** 8.26
SALES GROWTH 0.004* 1.88 0.003*** 4.17
ROA -0.071*** -5.89
DIVIDEND INDICATOR 0.009 0.65
CFO 0.007** 2.34 0.030*** 7.81
LN(MVE) -0.015*** -7.64 0.003*** 4.22
CASH -0.076*** -7.39 0.041*** 11.97
LEVERAGE -0.353*** -27.85 -0.037*** -11.83
ASSET TANGIBILITY 0.041*** 3.50 -0.000 -0.07
MISSING DUMMY -0.044*** -13.32
Sum p -Value Sum p -Value
INSPECTION+ (INSPECTION×FIN CONSTRAINED ) -0.003 0.455 0.000 0.942
REPORT+(REPORT×FIN CONSTRAINED) 0.009** 0.037 0.005*** 0.001
Country × Industry × Year Indicators
Company Indicators
Adjusted R-Squared
No. of Observations
41.9% 61.2%
52,329 52,329
(1) (2)
Included Included
Included Included
EXTERNAL FINANCING CAPEX

55
TABLE 9 Economic Effects of PCAOB Oversight Conditional on having a Big 4 Auditors
Notes: This table presents the results from regressions of external financing and capital expenditures on indicator variables capturing changes in auditor oversight and control variables conditioned on whether the auditor is member of the big-four auditor network. See Appendix A for variable definitions. The t-statistics are clustered at the country-auditor level. ***, **, and * denote statistical significance at the two-tailed 1, 5, and 10 percent levels, respectively.
Dependent Variable:
Coef. t -Stat. Coef. t -Stat.
INSPECTION 0.001 0.32 -0.000 -0.04
REPORT 0.005 1.54 0.001 0.97
INSPECTION × NOT BIG4 0.002 0.23 -0.003 -1.01
REPORT × NOT BIG4 -0.002 -0.22 0.001 0.32
TOBIN'S Q 0.028*** 16.75 0.005*** 8.32
SALES GROWTH 0.004* 1.89 0.003*** 4.16
ROA -0.071*** -5.87
DIVIDEND INDICATOR 0.010 0.71
CFO 0.009*** 3.87 0.031*** 7.91
LN(MVE) -0.015*** -7.66 0.003*** 4.31
CASH -0.076*** -7.43 0.041*** 12.00
LEVERAGE -0.353*** -27.86 -0.037*** -11.84
ASSET TANGIBILITY 0.041*** 3.52 -0.000 -0.04
MISSING DUMMY -0.044*** -13.33
Sum p -Value Sum p -Value
INSPECTION+ (INSPECTION×NOT BIG4 ) 0.003 0.739 -0.003 0.295
REPORT+(REPORT×NOT BIG4) 0.003 0.693 0.002 0.536
Country × Industry × Year Indicators
Company Indicators
Adjusted R-Squared
No. of Observations
Included Included
(1) (2)
EXTERNAL FINANCING CAPEX
52,329 52,329
41.9% 61.2%
Included Included
Recommended