Hudson River Estuary Program NYS Department of Environmental Conservation
Dining Out With Fishes and Birds of the Hudson
Students examine photographs of fish mouths and bird beaks to draw conclusions about these animals’ eating habits and their roles in food webs.
Objectives: Students will examine photographs of living creatures to: • observe external physical features necessary for taking in food;• understand how these animals are adapted for survival in their
environment.
Grade level: Elementary (Grades 3-6)
Subject Area: Science
Standards: Mathematics, Science, & Technology Standards 1, 4
Skills: • Observe characteristics of creatures native to the Hudson.• Predict each animal’s role in the food web based on these
observations.
Duration: Preparation time: 5 minutes Activity time: 30 minutes per worksheet
Materials: Each student should have: Worksheets: Dining Out With Fishes of the Hudson, Dining Out
With Birds of the Hudson, Weaving Food Chains Into Food Webs Pencil or pen Scissors Blank sheet of paper Paste or tape
Note: A simpler food chain lesson - “What Do Animals Need to Stay Alive? FOOD!” - is available for kindergarten to third grade students at http://www.dec.ny.gov/education/77601.html.
Hudson River Estuary Program NYS Department of Environmental Conservation
Background: Fishes and birds are the most abundant and diverse of the vertebrate animals found in the Hudson River Valley. They display an amazing variety of adaptations for survival in habitats along the estuary. Adaptations for obtaining food are among the most obvious features of these animals; they offer insights into how each species relates to others through food webs.
Activity: • Introduce the concept of adaptation by having students read the selection “Adapting to
Estuaries” from the Hudson River Estuary Program’s Readings in Natural History lessons.• Go over each worksheet with the class or hand out as an in-class or homework assignment.• Extension: have students research and write short reports about one of the fish or birds.
Assessment: • Have students share answers to questions from worksheets, or collect and grade sheets.• Have students construct their own food webs using pictures and information about common
Hudson River organisms available at http://www.dec.ny.gov/education/88154.html.
Vocabulary: adaptation: a feature that allows an organism to deal with environmental conditions algae: single celled, sometimes colonial, plants without a vascular system – the tubes that move sap and water through plants barbel: fleshy “whisker” on fish crustacean: one of a class of mostly aquatic arthropods such as shrimp, crabs, and Daphia decay: decompose; break down chemically into constituent compounds energy: the ability to do work, to power activity; the sun (solar) and food are sources food chain: the path by which energy in food moves from one organism to another food web: interwoven food chains linking organisms to many food sources
habitat: the particular sort of place where a given plant or animal lives invertebrate: an animal without a backbone larva: an early form or life stage of an animal; plural is larvae organism: an individual living thing (plant, animal, bacteria, etc.) predator: an animal that lives by killing and eating other animals prey: an animal taken as food by another animal specialized: adapted for a particular function or lifestyle zooplankton: animals, mostly tiny, that drift in water, unable to swim strongly
Resources: The Department of Environmental Conservation posts pictures and information about freshwater fish in this lesson at http://www.dec.ny.gov/animals/269.html At this writing there is not a similar site for the saltwater fishes – lined seahorse, Atlantic needlefish, and northern pipefish. However, an internet search for each fish’s name will find useful websites.
A broad array of information about birds is available on the Cornell Laboratory of Ornithology’s website at http://www.birds.cornell.edu/ . Worth noting are the Educator’s Guide to Bird Study at http://www.birds.cornell.edu/schoolyard/ and the Bird Guide at All About Birds http://www.birds.cornell.edu/AllAboutBirds/ . For links to DEC fact sheets and information pages about birds, visit http://www.dec.ny.gov/animals/271.html
Dining Out With Fishes of the Hudson: Page 1
B. Small creatures on river bottom: insect larvae, crustaceans, worms
A. Frogs, fish, big crustaceans
C. Tiny fish, crustaceans, insects D. Tiny invertebrates, zooplankton
lined seahorse – 5” pumpkinseed – 6”
Dining Out With Fishes of the Hudson: ANSWER KEY
Dining Out With Fishes of the Hudson
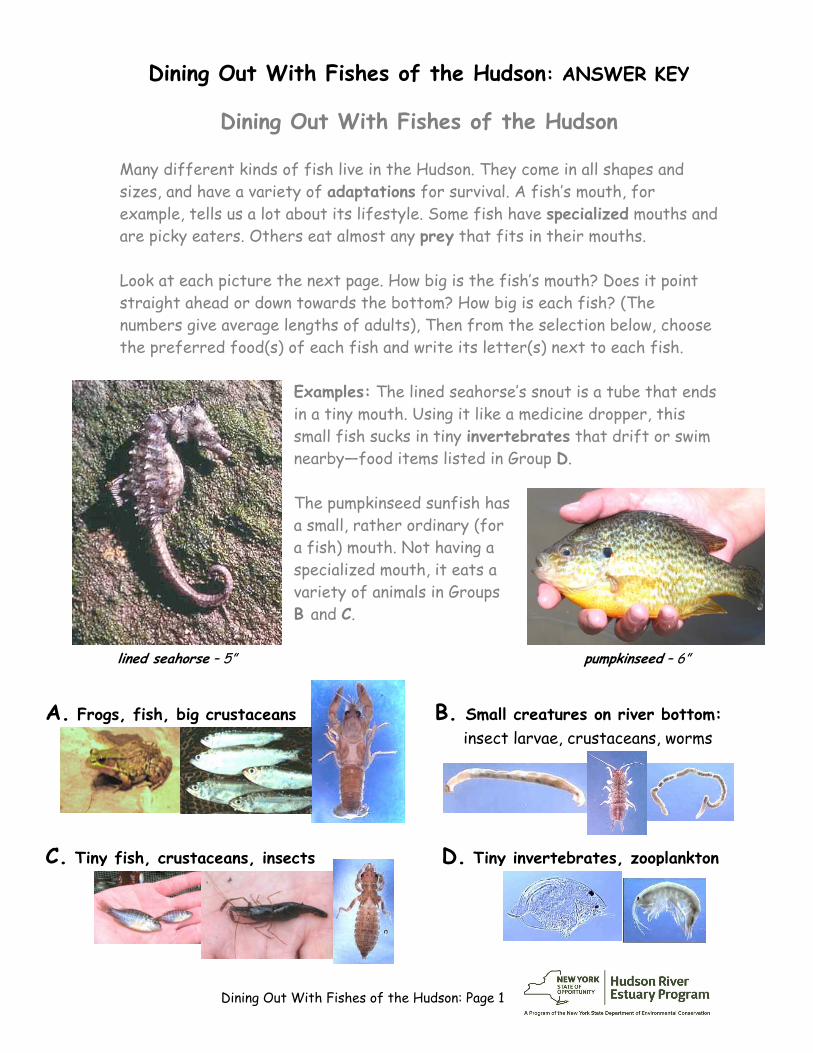
Many different kinds of fish live in the Hudson. They come in all shapes and sizes, and have a variety of adaptations for survival. A fish’s mouth, for example, tells us a lot about its lifestyle. Some fish have specialized mouths and are picky eaters. Others eat almost any prey that fits in their mouths.
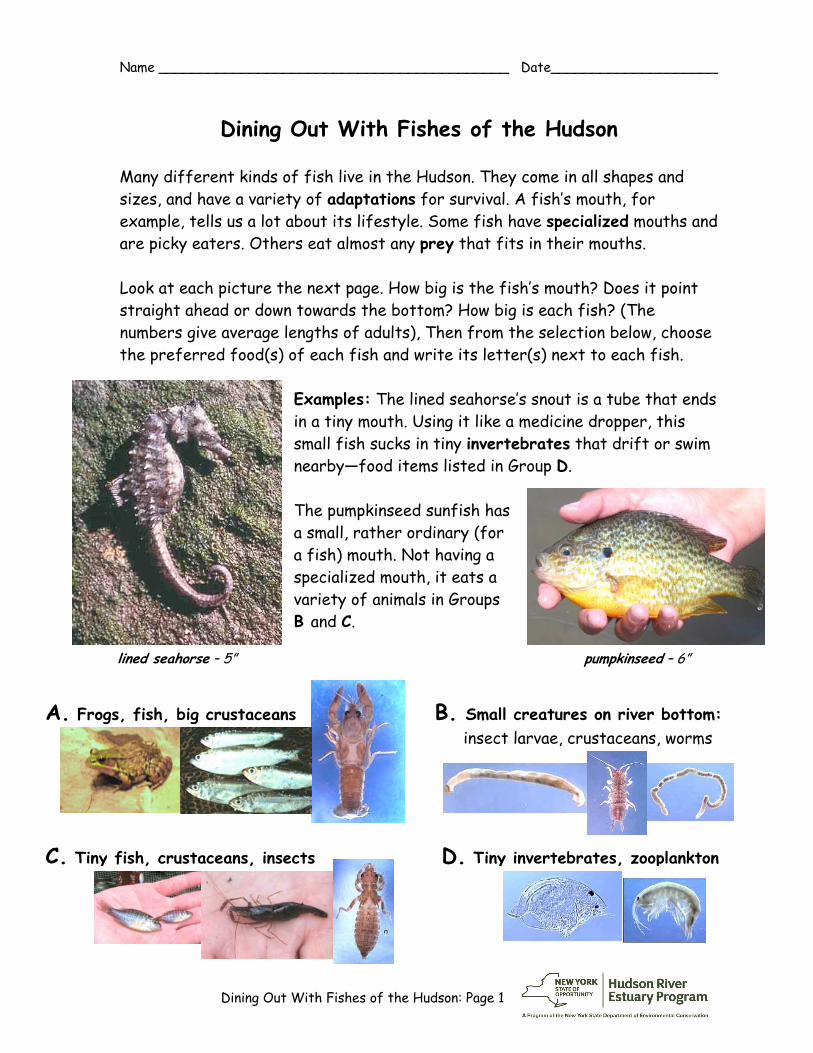
Look at each picture the next page. How big is the fish’s mouth? Does it point straight ahead or down towards the bottom? How big is each fish? (The numbers give average lengths of adults), Then from the selection below, choose the preferred food(s) of each fish and write its letter(s) next to each fish.
Examples: The lined seahorse’s snout is a tube that ends in a tiny mouth. Using it like a medicine dropper, this small fish sucks in tiny invertebrates that drift or swim nearby—food items listed in Group D.
The pumpkinseed sunfish has a small, rather ordinary (for a fish) mouth. Not having a specialized mouth, it eats a variety of animals in Groups B and C.
Dining Out With Fishes of the Hudson: Page 2
5. white sucker – 14” Its mouth points down.
___B___
7
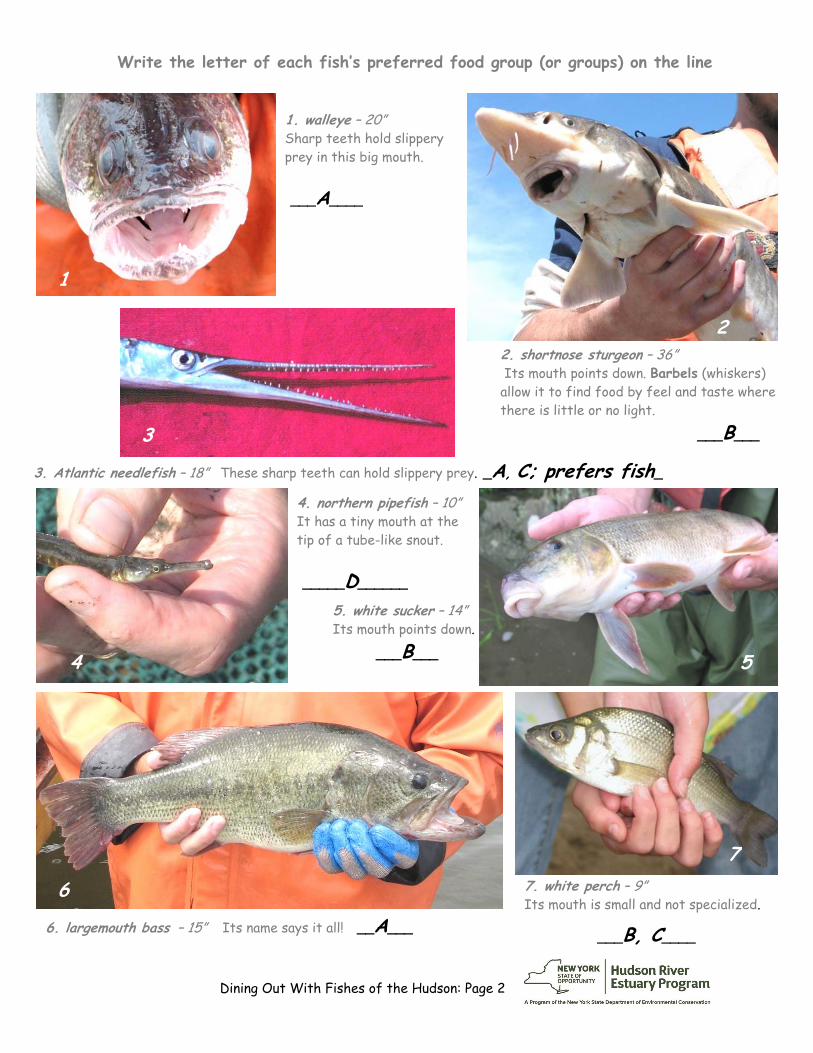
1. walleye – 20” Sharp teeth hold slippery prey in this big mouth.
___A____
2. shortnose sturgeon – 36” Its mouth points down. Barbels (whiskers) allow it to find food by feel and taste where there is little or no light.
___B___
4. northern pipefish – 10” It has a tiny mouth at the tip of a tube-like snout.
_____D______
3. Atlantic needlefish – 18” These sharp teeth can hold slippery prey. _A, C; prefers fish_
6. largemouth bass – 15” Its name says it all! __A___
1
4 5
6
7
2
3
7. white perch – 9” Its mouth is small and not specialized.
___B, C____
7
Write the letter of each fish’s preferred food group (or groups) on the line
Dining Out With Birds of the Hudson: Page 1
Dining Out With Birds of the Hudson: ANSWER KEY
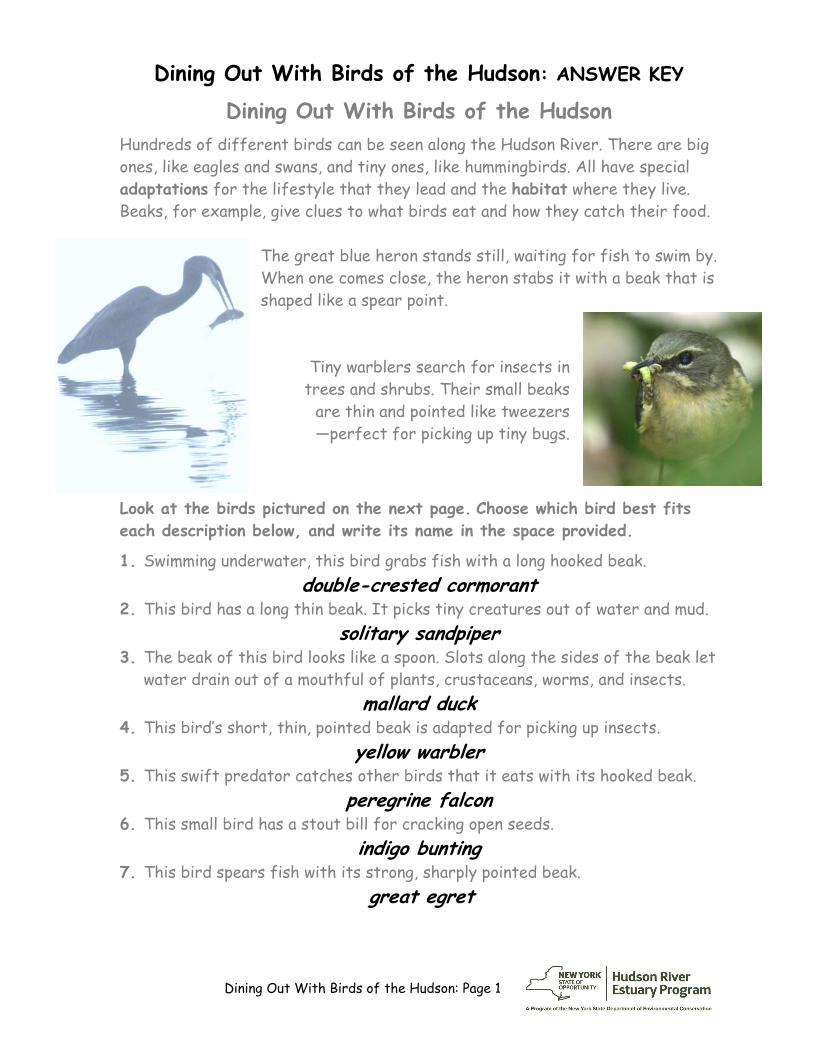
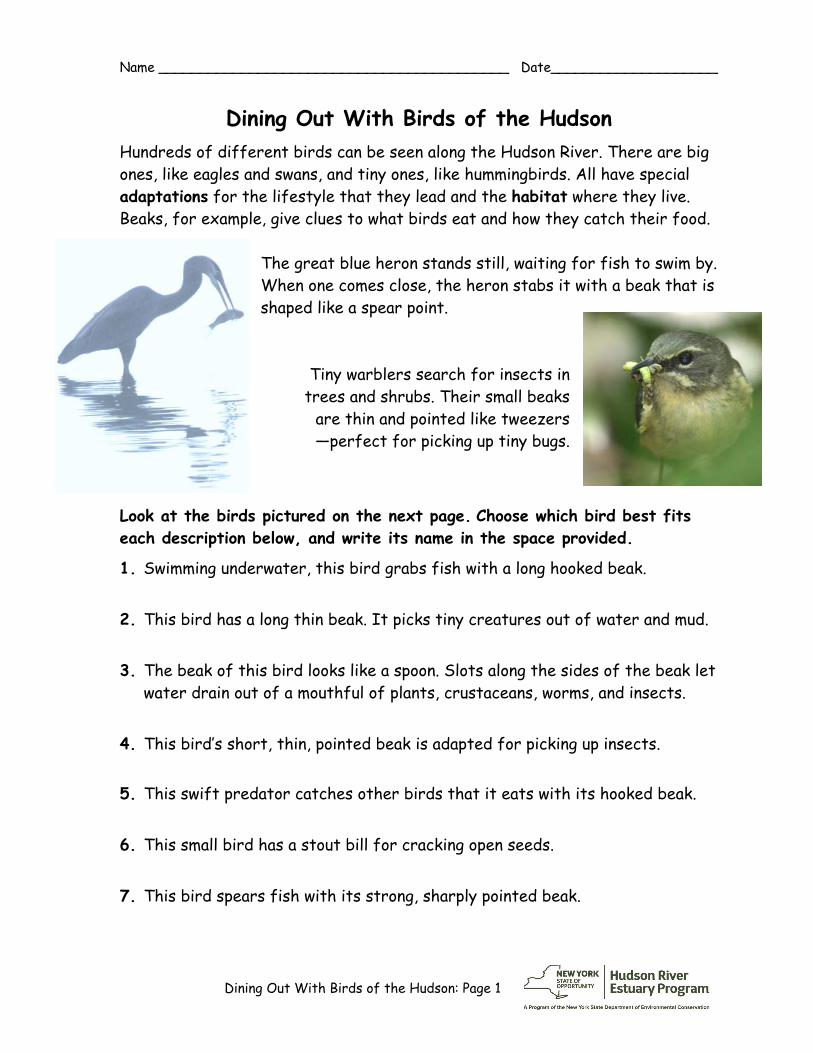
Dining Out With Birds of the HudsonHundreds of different birds can be seen along the Hudson River. There are big ones, like eagles and swans, and tiny ones, like hummingbirds. All have special adaptations for the lifestyle that they lead and the habitat where they live. Beaks, for example, give clues to what birds eat and how they catch their food.
The great blue heron stands still, waiting for fish to swim by. When one comes close, the heron stabs it with a beak that is shaped like a spear point.
Tiny warblers search for insects in trees and shrubs. Their small beaks
are thin and pointed like tweezers —perfect for picking up tiny bugs.
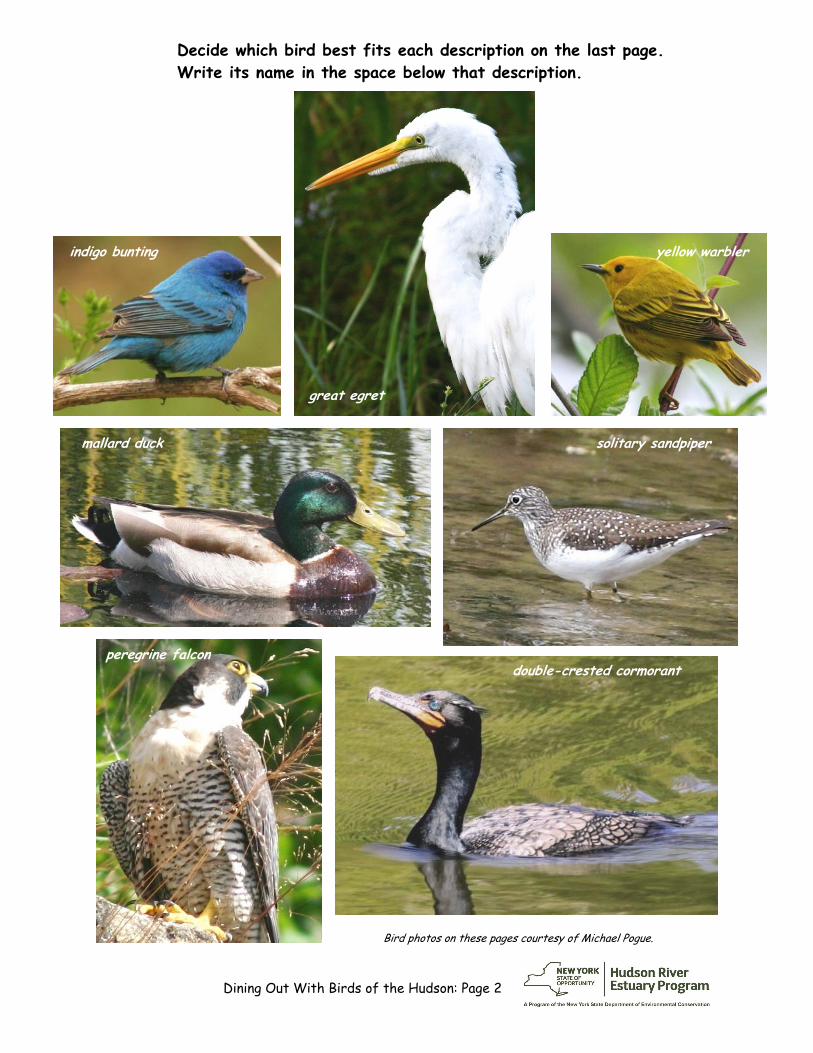
Look at the birds pictured on the next page. Choose which bird best fits each description below, and write its name in the space provided.
1. Swimming underwater, this bird grabs fish with a long hooked beak.double-crested cormorant
2. This bird has a long thin beak. It picks tiny creatures out of water and mud.solitary sandpiper
3. The beak of this bird looks like a spoon. Slots along the sides of the beak letwater drain out of a mouthful of plants, crustaceans, worms, and insects.
mallard duck 4. This bird’s short, thin, pointed beak is adapted for picking up insects.
yellow warbler 5. This swift predator catches other birds that it eats with its hooked beak.
peregrine falcon 6. This small bird has a stout bill for cracking open seeds.
indigo bunting 7. This bird spears fish with its strong, sharply pointed beak.
great egret

Dining Out With Birds of the Hudson: Page 2
7
Decide which bird best fits each description on the last page. Write its name in the space below that description.
indigo bunting
great egret
yellow warbler
mallard duck solitary sandpiper
peregrine falcon
Bird photos on these pages courtesy of Michael Pogue.
double-crested cormorant
Weaving Food Chains Into Food Webs: Page 1
shrimp white perch
great blue heron (photo by Brian Houser)
water celery – a green plant green algae cells
Scud (a type of crustacean) feeding on dead leaves
(photo by Eric Lind) dead leaves
Weaving Food Chains Into Food Webs : ANSWER KEY
Weaving Food Chains Into Food Webs
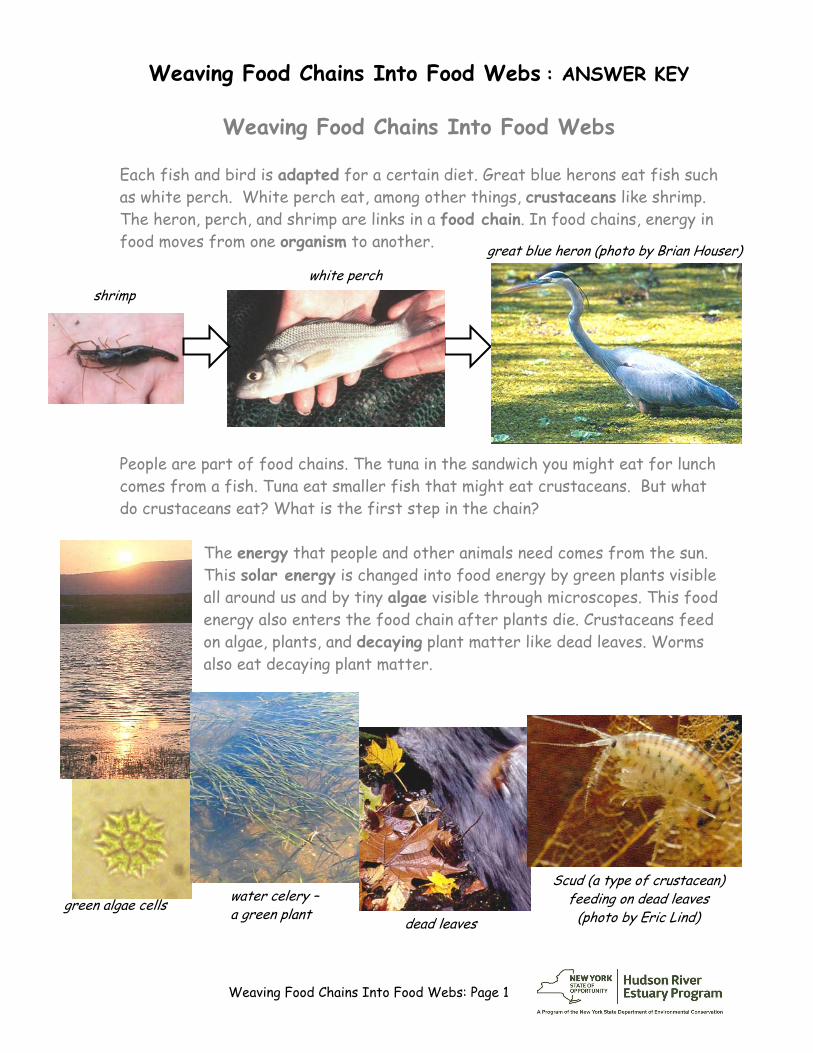
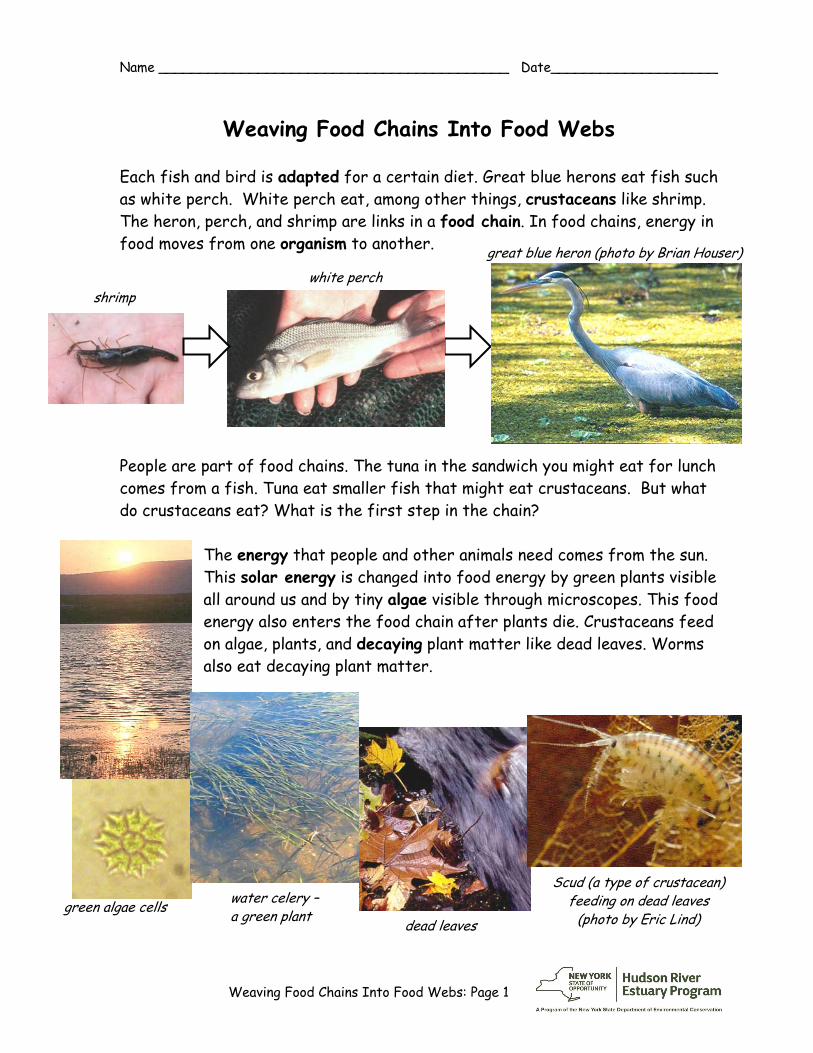
Each fish and bird is adapted for a certain diet. Great blue herons eat fish such as white perch. White perch eat, among other things, crustaceans like shrimp. The heron, perch, and shrimp are links in a food chain. In food chains, energy in food moves from one organism to another.
People are part of food chains. The tuna in the sandwich you might eat for lunch comes from a fish. Tuna eat smaller fish that might eat crustaceans. But what do crustaceans eat? What is the first step in the chain?
The energy that people and other animals need comes from the sun. This solar energy is changed into food energy by green plants visible all around us and by tiny algae visible through microscopes. This food energy also enters the food chain after plants die. Crustaceans feed on algae, plants, and decaying plant matter like dead leaves. Worms also eat decaying plant matter.
Hudson River Food Chains and Food Webs: Page 2
2
1
3
4
5
green algae
scud
pumpkinseed sunfish
double-crested cormorant
1 5
3
4
2
great egret dead leaves
white sucker
isopod (crustacean)
sun
sun
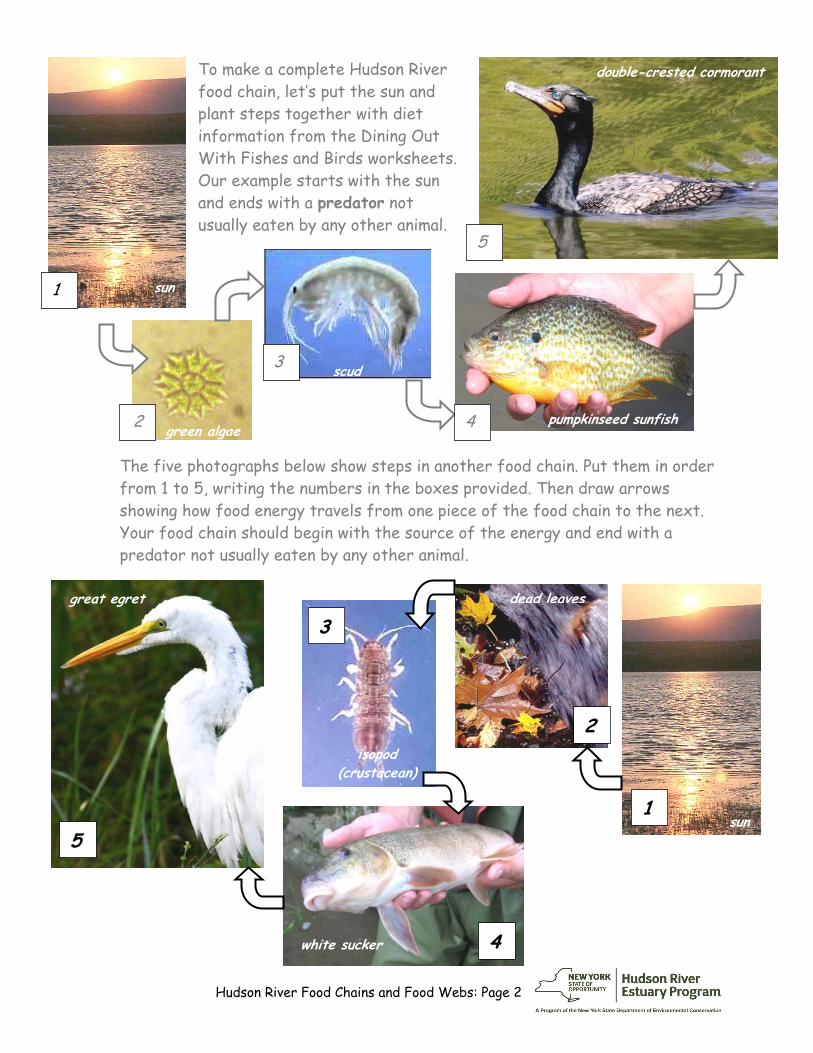
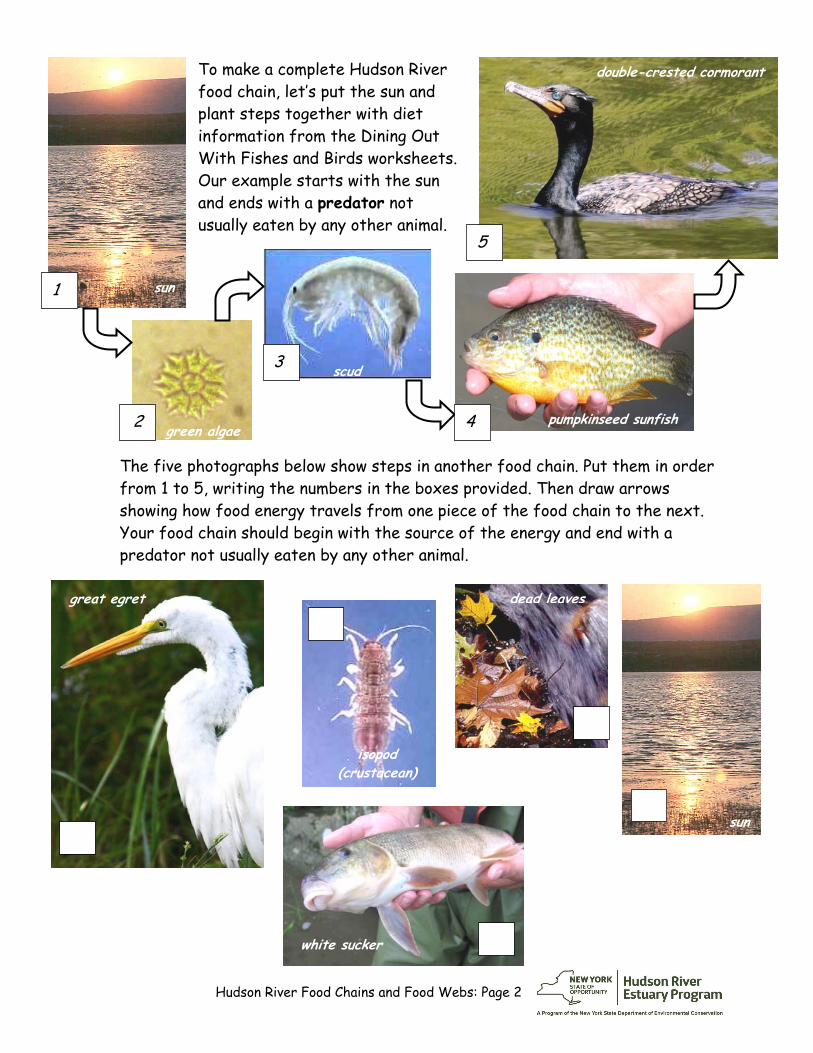
To make a complete Hudson River food chain, let’s put the sun and plant steps together with diet information from the Dining Out With Fishes and Birds worksheets. Our example starts with the sun and ends with a predator not usually eaten by any other animal.
The five photographs below show steps in another food chain. Put them in order from 1 to 5, writing the numbers in the boxes provided. Then draw arrows showing how food energy travels from one piece of the food chain to the next. Your food chain should begin with the source of the energy and end with a predator not usually eaten by any other animal.
Hudson River Food Chains and Food Webs: Page 3
7
scud
mallard duck
white perch
solitary sandpiper
green algae
worm
walleye
pumpkinseed sunfish largemouth bass
isopod
peregrine falcon
leaves
water celery
sun
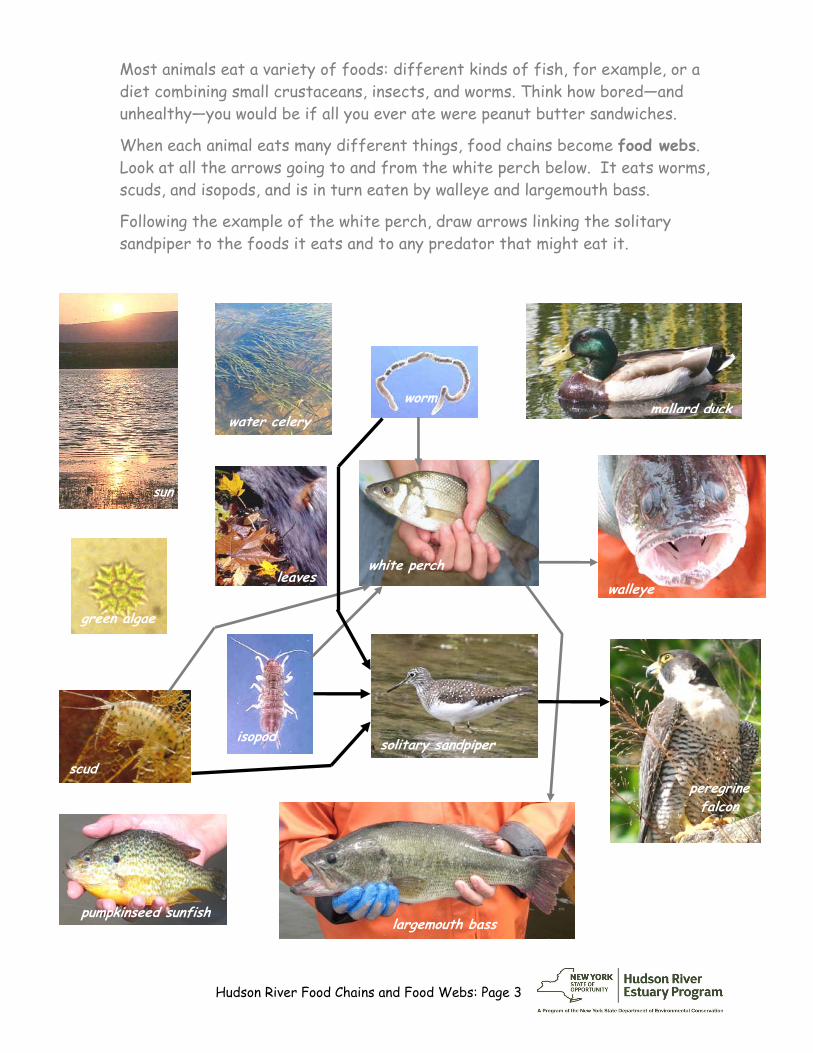
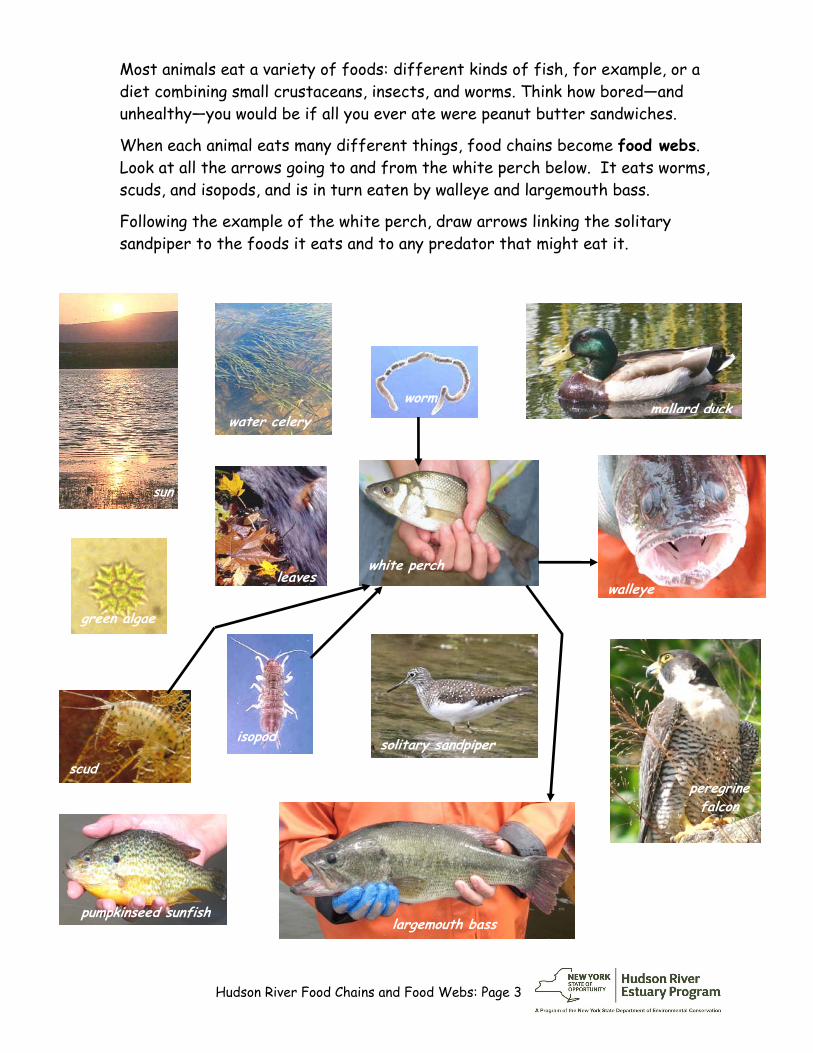
Most animals eat a variety of foods: different kinds of fish, for example, or a diet combining small crustaceans, insects, and worms. Think how bored—and unhealthy—you would be if all you ever ate were peanut butter sandwiches.
When each animal eats many different things, food chains become food webs. Look at all the arrows going to and from the white perch below. It eats worms, scuds, and isopods, and is in turn eaten by walleye and largemouth bass.
Following the example of the white perch, draw arrows linking the solitary sandpiper to the foods it eats and to any predator that might eat it.
Hudson River Food Chains and Food Webs: Page 4
7 scud
mallard duck
white perch
solitary sandpiper
green algae
isopod
peregrine falcon leaves
water celery
sun
Atlantic needlefish white sucker
double-crested cormorant
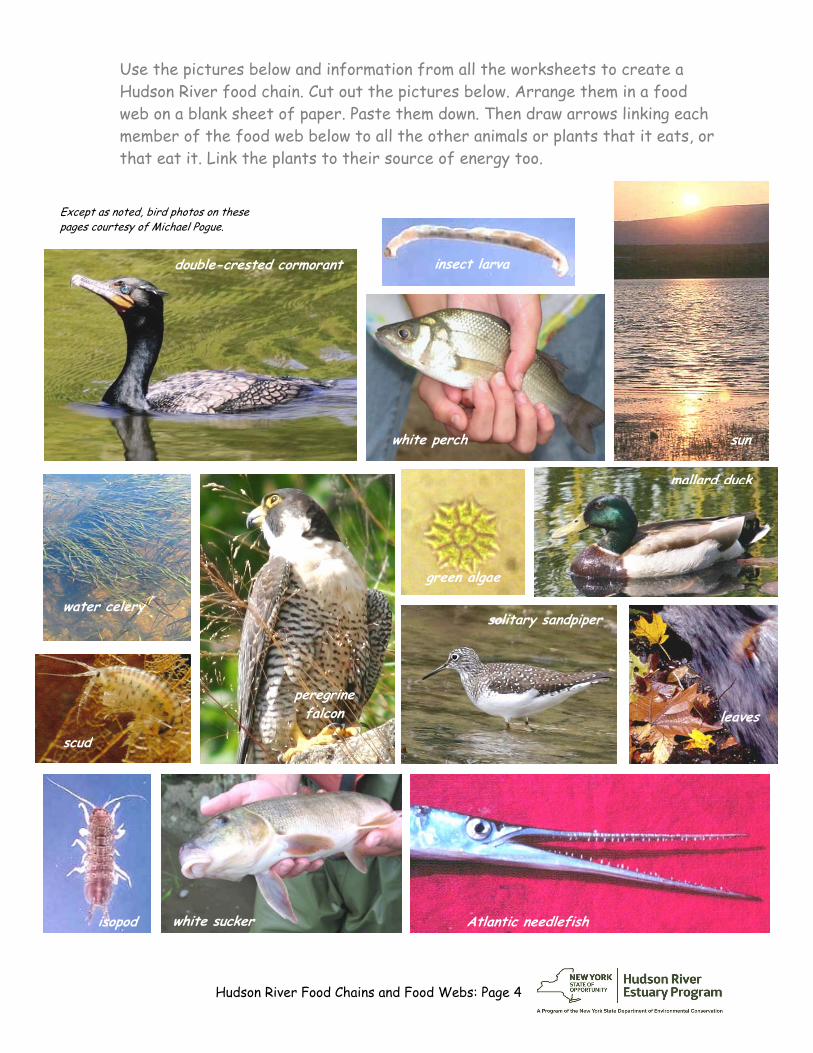
Except as noted, bird photos on these pages courtesy of Michael Pogue.
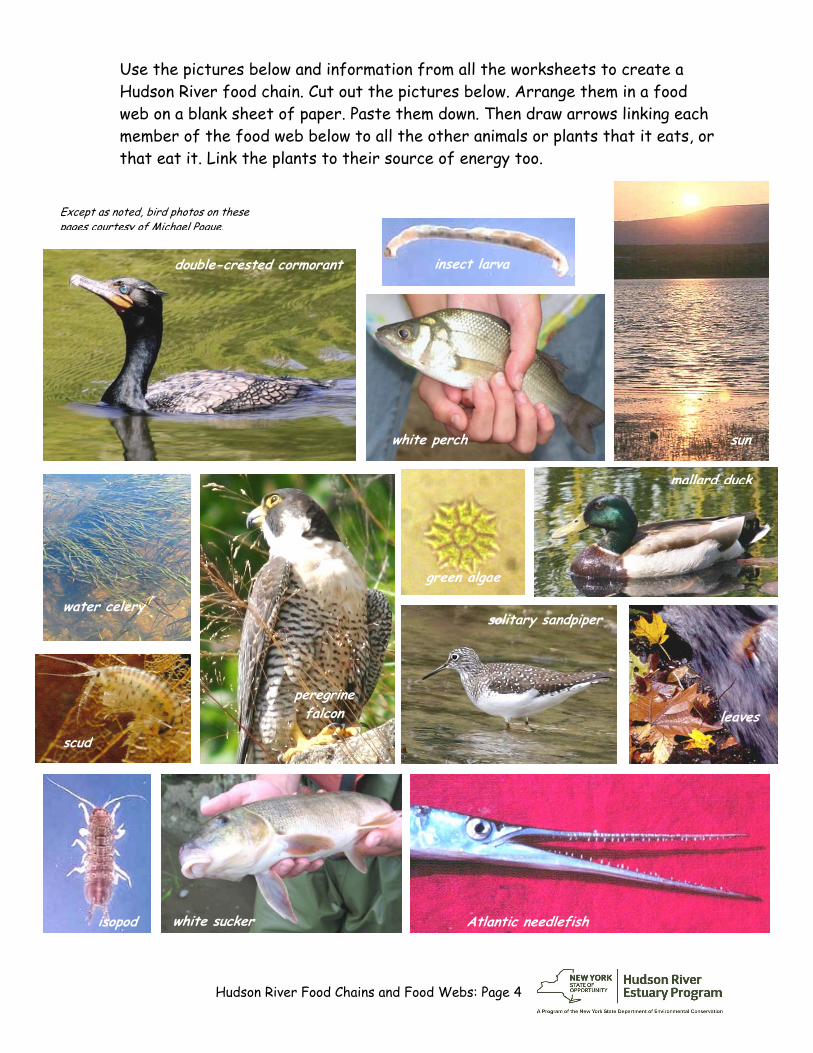
Use the pictures below and information from all the worksheets to create a Hudson River food chain. Cut out the pictures below. Arrange them in a food web on a blank sheet of paper. Paste them down. Then draw arrows linking each member of the food web below to all the other animals or plants that it eats, or that eat it. Link the plants to their source of energy too.
insect larva
Dining Out With Fishes of the Hudson: Page 1
B. Small creatures on river bottom: insect larvae, crustaceans, worms
A. Frogs, fish, big crustaceans
C. Tiny fish, crustaceans, insects D. Tiny invertebrates, zooplankton
lined seahorse – 5” pumpkinseed – 6”
Name __________________________________________ Date____________________
Dining Out With Fishes of the Hudson
Many different kinds of fish live in the Hudson. They come in all shapes and sizes, and have a variety of adaptations for survival. A fish’s mouth, for example, tells us a lot about its lifestyle. Some fish have specialized mouths and are picky eaters. Others eat almost any prey that fits in their mouths.
Look at each picture the next page. How big is the fish’s mouth? Does it point straight ahead or down towards the bottom? How big is each fish? (The numbers give average lengths of adults), Then from the selection below, choose the preferred food(s) of each fish and write its letter(s) next to each fish.
Examples: The lined seahorse’s snout is a tube that ends in a tiny mouth. Using it like a medicine dropper, this small fish sucks in tiny invertebrates that drift or swim nearby—food items listed in Group D.
The pumpkinseed sunfish has a small, rather ordinary (for a fish) mouth. Not having a specialized mouth, it eats a variety of animals in Groups B and C.

Dining Out With Fishes of the Hudson: Page 2
5. white sucker – 14” Its mouth points down.
___________
7
1. walleye – 20” Sharp teeth hold slippery prey in this big mouth.
___________
2. shortnose sturgeon – 36” Its mouth points down. Barbels (whiskers) allow it to find food by feel and taste where there is little or no light.
___________
4. northern pipefish – 10” It has a tiny mouth at the tip of a tube-like snout.
___________
3. Atlantic needlefish – 18” These sharp teeth can hold slippery prey. ___________
6. largemouth bass – 15” Its name says it all! ___________
1
4 5
6
7
2
3
7. white perch – 9” Its mouth is small and not specialized.
___________
7
Write the letter of each fish’s preferred food group (or groups) on the line
Dining Out With Birds of the Hudson: Page 1
Name __________________________________________ Date____________________
Dining Out With Birds of the HudsonHundreds of different birds can be seen along the Hudson River. There are big ones, like eagles and swans, and tiny ones, like hummingbirds. All have special adaptations for the lifestyle that they lead and the habitat where they live. Beaks, for example, give clues to what birds eat and how they catch their food.
The great blue heron stands still, waiting for fish to swim by. When one comes close, the heron stabs it with a beak that is shaped like a spear point.
Tiny warblers search for insects in trees and shrubs. Their small beaks
are thin and pointed like tweezers —perfect for picking up tiny bugs.
Look at the birds pictured on the next page. Choose which bird best fits each description below, and write its name in the space provided.
1. Swimming underwater, this bird grabs fish with a long hooked beak.
2. This bird has a long thin beak. It picks tiny creatures out of water and mud.
3. The beak of this bird looks like a spoon. Slots along the sides of the beak letwater drain out of a mouthful of plants, crustaceans, worms, and insects.
4. This bird’s short, thin, pointed beak is adapted for picking up insects.
5. This swift predator catches other birds that it eats with its hooked beak.
6. This small bird has a stout bill for cracking open seeds.
7. This bird spears fish with its strong, sharply pointed beak.
Dining Out With Birds of the Hudson: Page 2
7
Decide which bird best fits each description on the last page. Write its name in the space below that description.
indigo bunting
great egret
yellow warbler
mallard duck solitary sandpiper
peregrine falcon
Bird photos on these pages courtesy of Michael Pogue.
double-crested cormorant
Weaving Food Chains Into Food Webs: Page 1
shrimp white perch
great blue heron (photo by Brian Houser)
water celery – a green plant green algae cells
Scud (a type of crustacean) feeding on dead leaves
(photo by Eric Lind) dead leaves
Name __________________________________________ Date____________________
Weaving Food Chains Into Food Webs
Each fish and bird is adapted for a certain diet. Great blue herons eat fish such as white perch. White perch eat, among other things, crustaceans like shrimp. The heron, perch, and shrimp are links in a food chain. In food chains, energy in food moves from one organism to another.
People are part of food chains. The tuna in the sandwich you might eat for lunch comes from a fish. Tuna eat smaller fish that might eat crustaceans. But what do crustaceans eat? What is the first step in the chain?
The energy that people and other animals need comes from the sun. This solar energy is changed into food energy by green plants visible all around us and by tiny algae visible through microscopes. This food energy also enters the food chain after plants die. Crustaceans feed on algae, plants, and decaying plant matter like dead leaves. Worms also eat decaying plant matter.
Hudson River Food Chains and Food Webs: Page 2
2
1
3
4
5
green algae
scud
pumpkinseed sunfish
double-crested cormorant
great egret dead leaves
white sucker
isopod (crustacean)
sun
sun
To make a complete Hudson River food chain, let’s put the sun and plant steps together with diet information from the Dining Out With Fishes and Birds worksheets. Our example starts with the sun and ends with a predator not usually eaten by any other animal.
The five photographs below show steps in another food chain. Put them in order from 1 to 5, writing the numbers in the boxes provided. Then draw arrows showing how food energy travels from one piece of the food chain to the next. Your food chain should begin with the source of the energy and end with a predator not usually eaten by any other animal.
Hudson River Food Chains and Food Webs: Page 3
7
scud
mallard duck
white perch
solitary sandpiper
green algae
worm
walleye
pumpkinseed sunfish largemouth bass
isopod
peregrine falcon
leaves
water celery
sun
Most animals eat a variety of foods: different kinds of fish, for example, or a diet combining small crustaceans, insects, and worms. Think how bored—and unhealthy—you would be if all you ever ate were peanut butter sandwiches.
When each animal eats many different things, food chains become food webs. Look at all the arrows going to and from the white perch below. It eats worms, scuds, and isopods, and is in turn eaten by walleye and largemouth bass.
Following the example of the white perch, draw arrows linking the solitary sandpiper to the foods it eats and to any predator that might eat it.
Hudson River Food Chains and Food Webs: Page 4
7 scud
mallard duck
white perch
solitary sandpiper
green algae
isopod
peregrine falcon leaves
water celery
sun
Atlantic needlefish white sucker
double-crested cormorant
Except as noted, bird photos on these pages courtesy of Michael Pogue.
Use the pictures below and information from all the worksheets to create a Hudson River food chain. Cut out the pictures below. Arrange them in a food web on a blank sheet of paper. Paste them down. Then draw arrows linking each member of the food web below to all the other animals or plants that it eats, or that eat it. Link the plants to their source of energy too.
insect larva
Hudson River Estuary Program NYS Department of Environmental Conservation
Fish Communities in the Hudson
Students will use tables of fish collection data to draw conclusions about where fish live in the Hudson estuary.
Objectives: Students will use data presented in tables to: • interpret organized observations and measurements;• recognize simple patterns, sequences, and relationships;• understand environmental factors that influence where fish live and
determine the makeup of fish communities.
Grade level: Elementary (Grades 3-5)
Subject Area: Math, Science, English Language Arts
Standards: Mathematics, Science, & Technology Standards 1, 4 English Language Arts Standard 1
Skills: • Interpret data presented in table format.• Observe, identify, and communicate patterns.• Present inferences or generalizations indicated by data
Duration: Preparation time: 5 minutes Activity time: 30 minutes
Materials: Each student should have: Worksheet: Fish Communities in The Hudson Hudson River Miles map (helpful but not required) Pencil
Note: A simpler food chain lesson - “What Do Animals Need to Stay Alive? HABITAT!” - is available for kindergarten to third grade students at http://www.dec.ny.gov/education/77601.html.
Hudson River Estuary Program NYS Department of Environmental Conservation
Background: The Hudson is home to a great variety and abundance of fishes. Each kind has its habitat and lifestyle preferences. For example, the Hudson is an estuary in which salty ocean water and fresh water mix. Some of the river’s fish are found only in salt water, others only in fresh; a few can live in either. Some fish swim in schools; others tend to keep to themselves. Given these preferences, fishes occur in communities—fishes of freshwater shallows, for instance.
During DEC’s annual Day in the Life of the Hudson River event, students collect fish at sites all along the tidal Hudson and New York Harbor. Of the 200+ kinds of fish found in the Hudson and its tributaries, students caught 33 species from 2003 to 2006; the worksheet’s tables show data for a handful of these. To simplify, data from sites less than one mile apart were combined, and many sites were left out. Most of the fish recorded during Day in the Life events are caught in beach seines—curtains of netting with a pole at either end.
Locations along the Hudson are often measured in Hudson River Miles. Hudson River Miles start at the southern tip of Manhattan. This spot, called The Battery, is River Mile 0. The estuary part of the Hudson ends at the Federal Dam in Troy at River Mile 153.
Activity: 1. Review the concept of estuary with the students.2. Introduce the Hudson River Miles system.3. Go over the worksheet with the class or hand out as an in-class or homework assignment.
Assessment: • Have students share answers to questions from worksheets, or collect and grade sheets.• Investigate one species of fish further, using the resources listed below.
Vocabulary: average: equal or close to an arithmetic mean community: a group of living things that interact and are located in one place fresh water: water that is not salty Hudson River Miles: distance north from the Battery at Manhattan’s southern tip leading edge: line marking a beginning or end salt front: the leading edge of seawater entering an estuary
salt water: seawater or other water that contains salt school (of fish): a group of fish swimming together seine net: a fishing net that hangs vertically between floats and weights species: a class of living things of the same kind and same name upriver: towards a stream’s source
Resources: Find illustrations and information about the fish described in this activity at the Department of Environmental Conservation website www.dec.ny.gov/animals/269.html or the Estuary Program’s gallery of Hudson River organisms http://www.dec.ny.gov/education/88154.html. The Atlantic silverside and other fish of salt water are described in the Chesapeake Bay Program’s Bay Field Guide www.chesapeakebay.net/bfg_fish.aspx?menuitem=14340 Information about and data from the Day in the Life of the Hudson River is available at www.ldeo.columbia.edu/edu/k12/snapshotday/
Fish Communities in the Hudson: Page 1
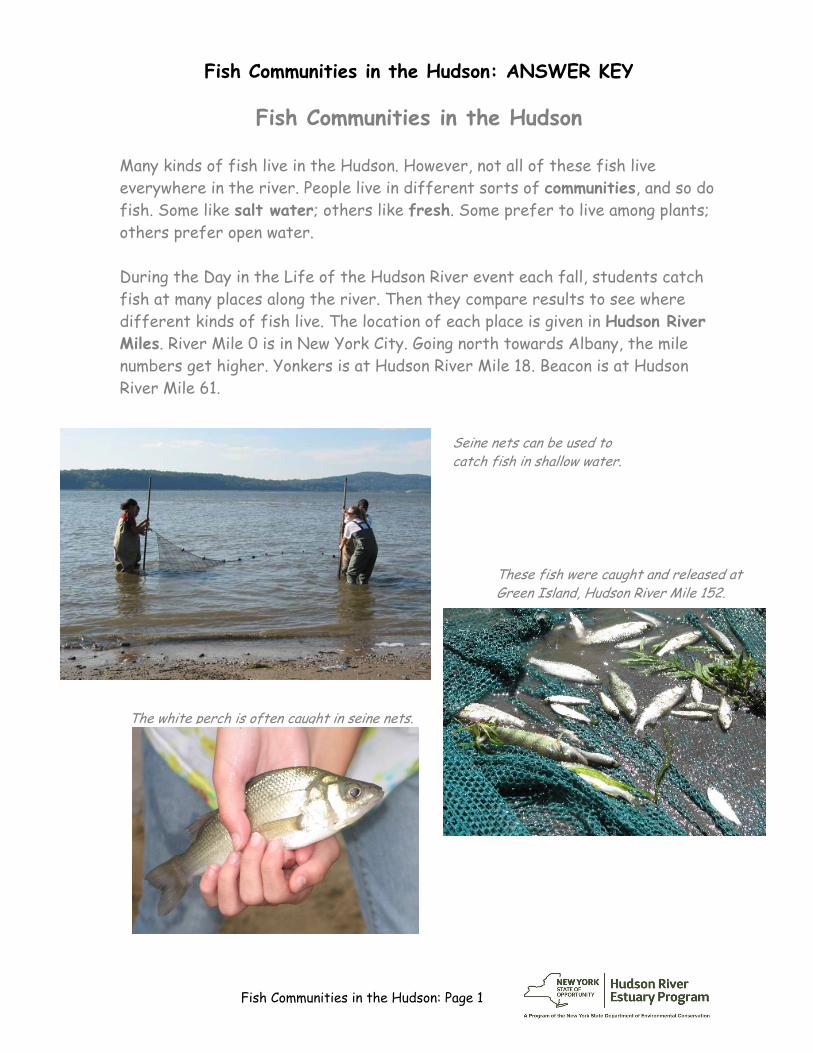
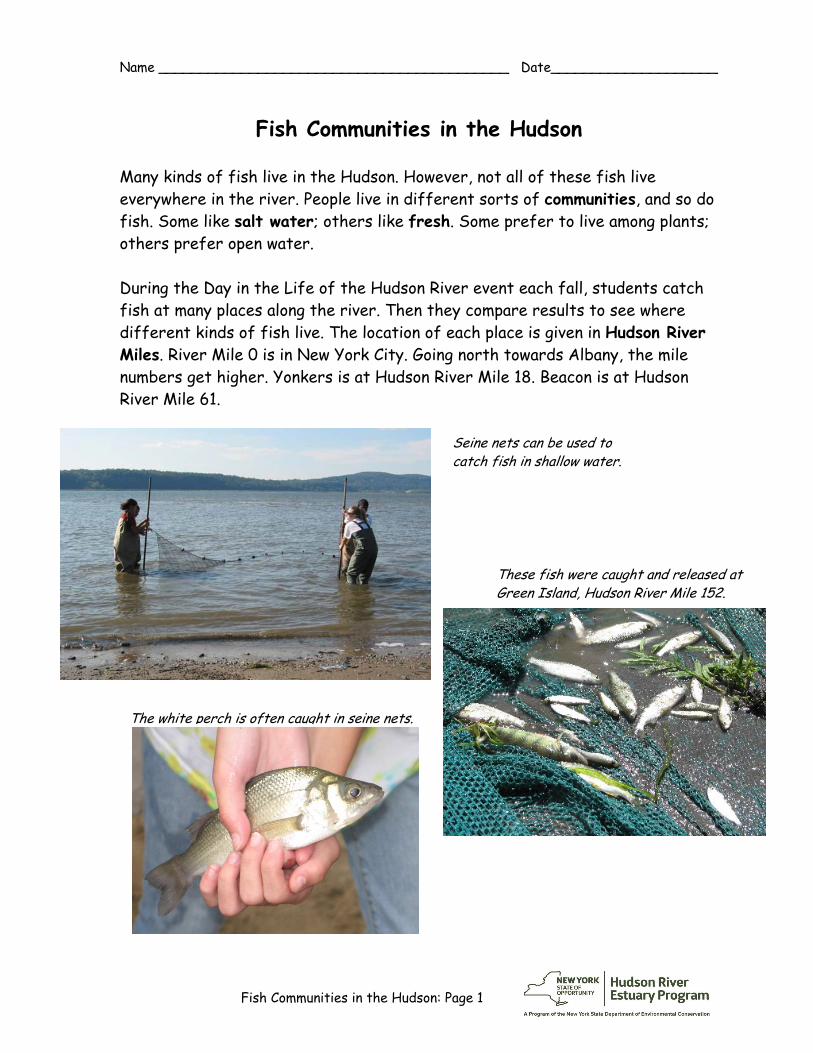
Seine nets can be used to catch fish in shallow water.
The white perch is often caught in seine nets.
These fish were caught and released at Green Island, Hudson River Mile 152.
Fish Communities in the Hudson: ANSWER KEY
Fish Communities in the Hudson
Many kinds of fish live in the Hudson. However, not all of these fish live everywhere in the river. People live in different sorts of communities, and so do fish. Some like salt water; others like fresh. Some prefer to live among plants; others prefer open water.
During the Day in the Life of the Hudson River event each fall, students catch fish at many places along the river. Then they compare results to see where different kinds of fish live. The location of each place is given in Hudson River Miles. River Mile 0 is in New York City. Going north towards Albany, the mile numbers get higher. Yonkers is at Hudson River Mile 18. Beacon is at Hudson River Mile 61.
Fish Communities in the Hudson: Page 2
(b) tessellated darter _Fresh_
(c) pumpkinseed _Fresh_
(a) Atlantic silverside _Salt_
Salt front located at HRM 53
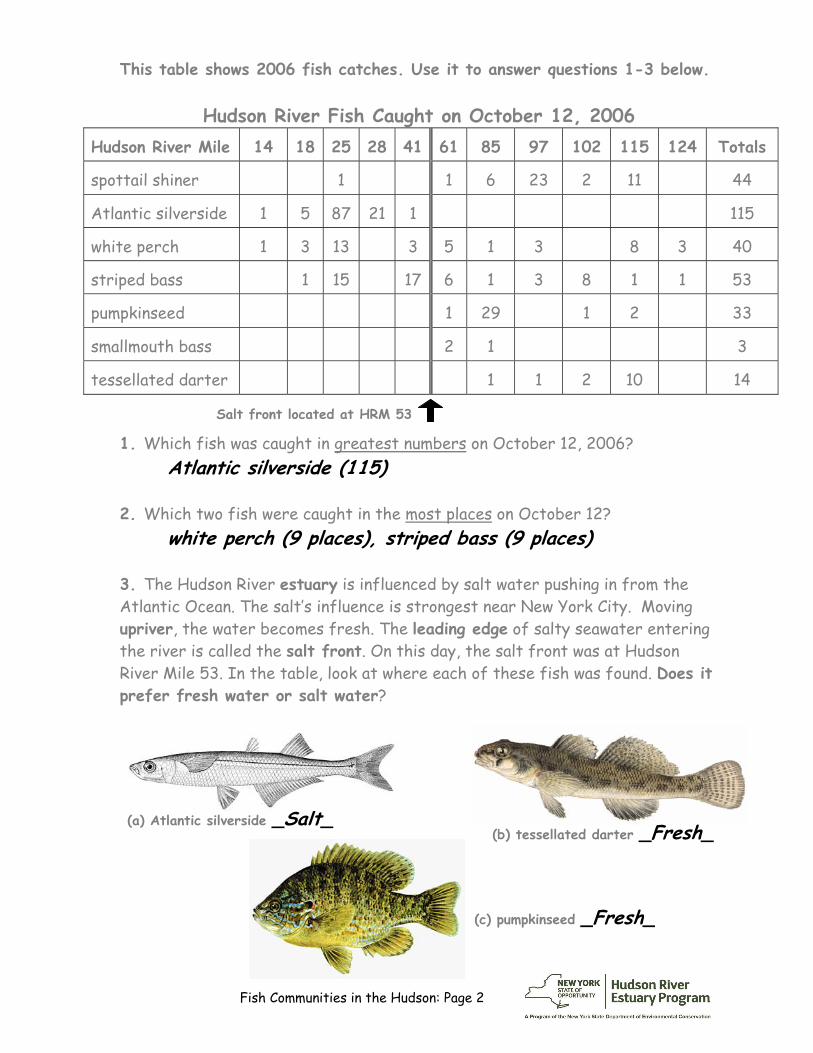
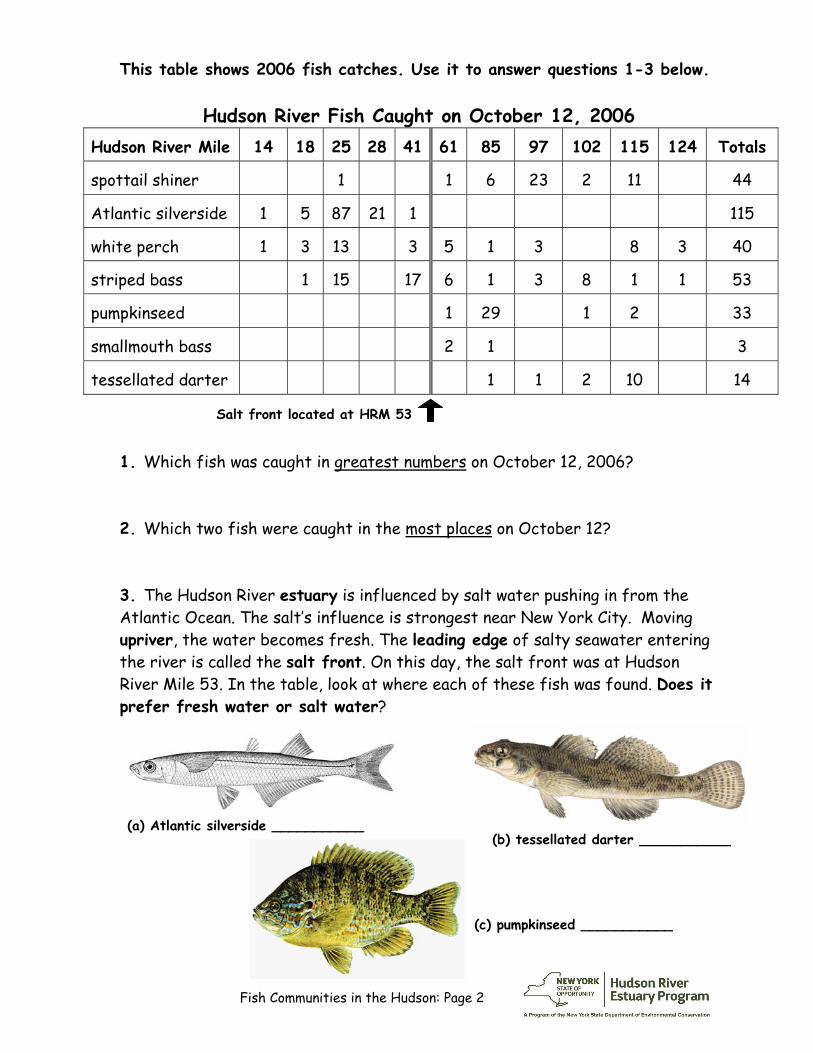
This table shows 2006 fish catches. Use it to answer questions 1-3 below.
Hudson River Fish Caught on October 12, 2006 Hudson River Mile 14 18 25 28 41 61 85 97 102 115 124 Totals
spottail shiner 1 1 6 23 2 11 44
Atlantic silverside 1 5 87 21 1 115
white perch 1 3 13 3 5 1 3 8 3 40
striped bass 1 15 17 6 1 3 8 1 1 53
pumpkinseed 1 29 1 2 33
smallmouth bass 2 1 3
tessellated darter 1 1 2 10 14
1. Which fish was caught in greatest numbers on October 12, 2006?Atlantic silverside (115)
2. Which two fish were caught in the most places on October 12?white perch (9 places), striped bass (9 places)
3. The Hudson River estuary is influenced by salt water pushing in from theAtlantic Ocean. The salt’s influence is strongest near New York City. Moving upriver, the water becomes fresh. The leading edge of salty seawater entering the river is called the salt front. On this day, the salt front was at Hudson River Mile 53. In the table, look at where each of these fish was found. Does it prefer fresh water or salt water?
Fish Communities in the Hudson: Page 3
Yonkers is on the east side of the Hudson at Hudson River Mile 18.
Alpine is on the west side of the Hudson at Hudson River Mile 18.
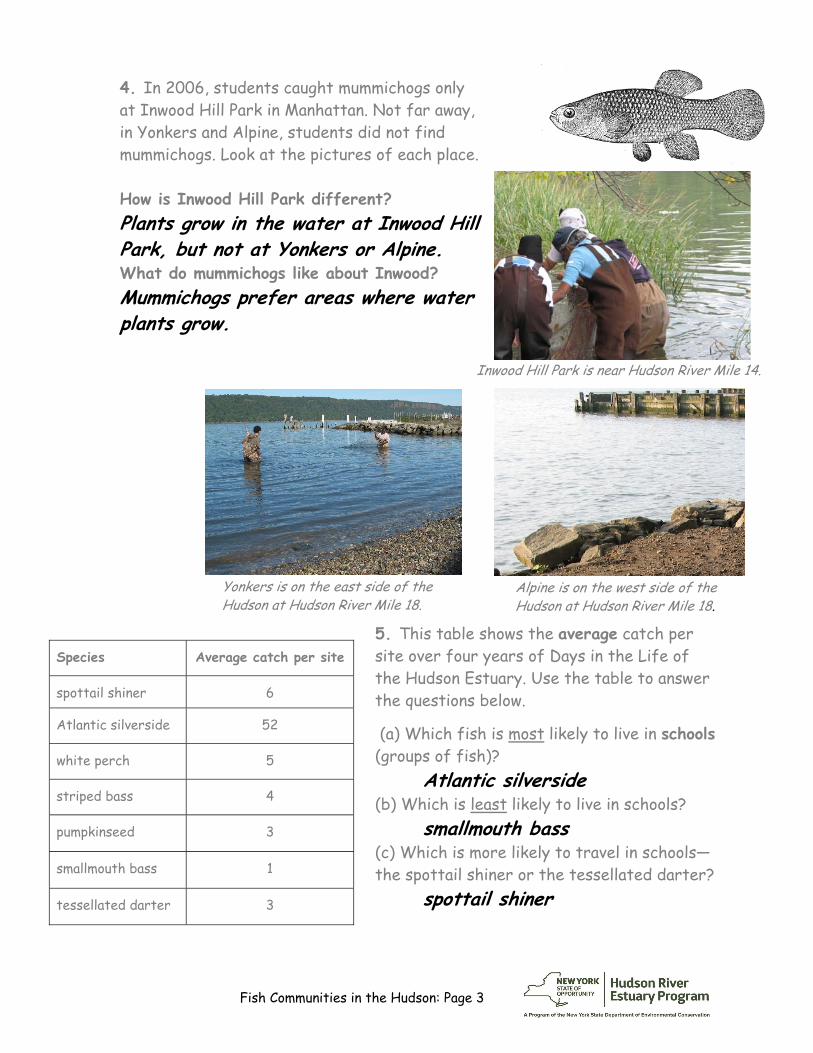
Inwood Hill Park is near Hudson River Mile 14.
Species Average catch per site
spottail shiner 6
Atlantic silverside 52
white perch 5
striped bass 4
pumpkinseed 3
smallmouth bass 1
tessellated darter 3
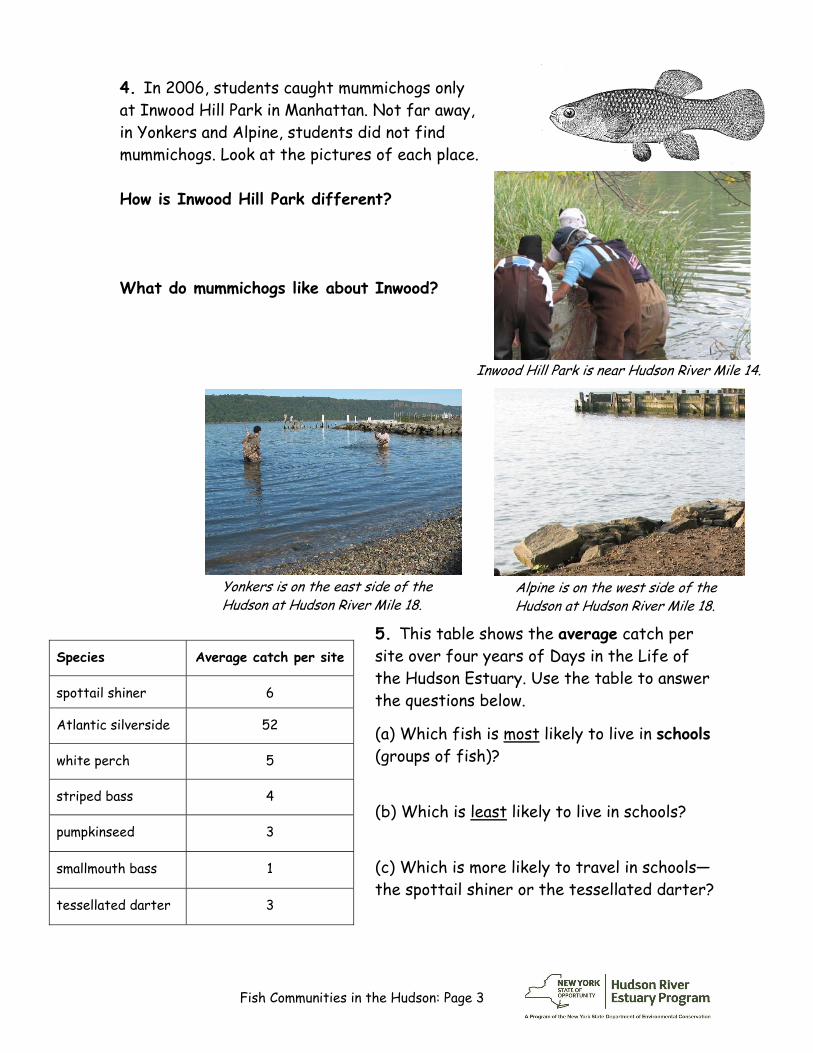
4. In 2006, students caught mummichogs onlyat Inwood Hill Park in Manhattan. Not far away, in Yonkers and Alpine, students did not find mummichogs. Look at the pictures of each place.
How is Inwood Hill Park different? Plants grow in the water at Inwood Hill Park, but not at Yonkers or Alpine. What do mummichogs like about Inwood? Mummichogs prefer areas where water plants grow.
5. This table shows the average catch persite over four years of Days in the Life of the Hudson Estuary. Use the table to answer the questions below.
(a) Which fish is most likely to live in schools (groups of fish)?
Atlantic silverside (b) Which is least likely to live in schools?
smallmouth bass (c) Which is more likely to travel in schools—the spottail shiner or the tessellated darter?
spottail shiner

This page intentionally left blank.
Fish Communities in the Hudson: Page 1
Seine nets can be used to catch fish in shallow water.
The white perch is often caught in seine nets.
These fish were caught and released at Green Island, Hudson River Mile 152.
Name __________________________________________ Date____________________
Fish Communities in the Hudson
Many kinds of fish live in the Hudson. However, not all of these fish live everywhere in the river. People live in different sorts of communities, and so do fish. Some like salt water; others like fresh. Some prefer to live among plants; others prefer open water.
During the Day in the Life of the Hudson River event each fall, students catch fish at many places along the river. Then they compare results to see where different kinds of fish live. The location of each place is given in Hudson River Miles. River Mile 0 is in New York City. Going north towards Albany, the mile numbers get higher. Yonkers is at Hudson River Mile 18. Beacon is at Hudson River Mile 61.
Fish Communities in the Hudson: Page 2
(b) tessellated darter ___________
(c) pumpkinseed ___________
(a) Atlantic silverside ___________
Salt front located at HRM 53
This table shows 2006 fish catches. Use it to answer questions 1-3 below.
Hudson River Fish Caught on October 12, 2006 Hudson River Mile 14 18 25 28 41 61 85 97 102 115 124 Totals
spottail shiner 1 1 6 23 2 11 44
Atlantic silverside 1 5 87 21 1 115
white perch 1 3 13 3 5 1 3 8 3 40
striped bass 1 15 17 6 1 3 8 1 1 53
pumpkinseed 1 29 1 2 33
smallmouth bass 2 1 3
tessellated darter 1 1 2 10 14
1. Which fish was caught in greatest numbers on October 12, 2006?
2. Which two fish were caught in the most places on October 12?
3. The Hudson River estuary is influenced by salt water pushing in from theAtlantic Ocean. The salt’s influence is strongest near New York City. Moving upriver, the water becomes fresh. The leading edge of salty seawater entering the river is called the salt front. On this day, the salt front was at Hudson River Mile 53. In the table, look at where each of these fish was found. Does it prefer fresh water or salt water?
Fish Communities in the Hudson: Page 3
Yonkers is on the east side of the Hudson at Hudson River Mile 18.
Alpine is on the west side of the Hudson at Hudson River Mile 18.
Inwood Hill Park is near Hudson River Mile 14.
Species Average catch per site
spottail shiner 6
Atlantic silverside 52
white perch 5
striped bass 4
pumpkinseed 3
smallmouth bass 1
tessellated darter 3
4. In 2006, students caught mummichogs onlyat Inwood Hill Park in Manhattan. Not far away, in Yonkers and Alpine, students did not find mummichogs. Look at the pictures of each place.
How is Inwood Hill Park different?
What do mummichogs like about Inwood?
5. This table shows the average catch persite over four years of Days in the Life of the Hudson Estuary. Use the table to answer the questions below.
(a) Which fish is most likely to live in schools (groups of fish)?
(b) Which is least likely to live in schools?
(c) Which is more likely to travel in schools—the spottail shiner or the tessellated darter?

This page intentionally left blank.
Hudson River Estuary Program NYS Department of Environmental Conservation
Which Fish Where?
Students will use tables and graphs of fish collection data to draw conclusions about where fish live in the Hudson estuary.
Objectives: Students will use data presented in tables and graphs to: • interpret organized observations and measurements;• recognize simple patterns, sequences, and relationships;• understand environmental factors that influence where fish live.
Grade level: Elementary (Grades 4-7)
Subject Area: Math, Science
Standards: Mathematics, Science, & Technology Standards 1, 4
Skills: • Interpret data presented in tables and graphs.• Observe, identify, and communicate patterns.• Present inferences or generalizations indicated by data.
Duration: Preparation time: 5 minutes Activity time: 60 minutes or two 30 minute sessions
Materials: Each student should have: Worksheet: Which Fish Where? Hudson River Miles map (helpful but not required) Pencil
Hudson River Estuary Program NYS Department of Environmental Conservation
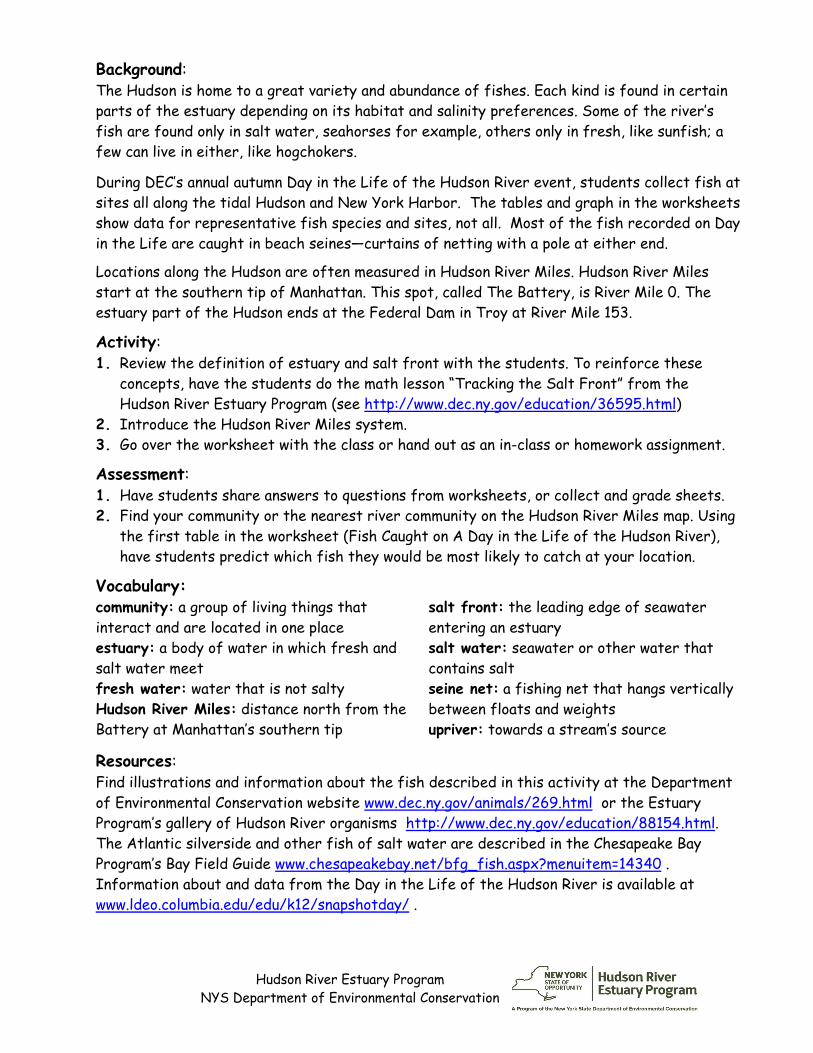
Background: The Hudson is home to a great variety and abundance of fishes. Each kind is found in certain parts of the estuary depending on its habitat and salinity preferences. Some of the river’s fish are found only in salt water, seahorses for example, others only in fresh, like sunfish; a few can live in either, like hogchokers.
During DEC’s annual autumn Day in the Life of the Hudson River event, students collect fish at sites all along the tidal Hudson and New York Harbor. The tables and graph in the worksheets show data for representative fish species and sites, not all. Most of the fish recorded on Day in the Life are caught in beach seines—curtains of netting with a pole at either end.
Locations along the Hudson are often measured in Hudson River Miles. Hudson River Miles start at the southern tip of Manhattan. This spot, called The Battery, is River Mile 0. The estuary part of the Hudson ends at the Federal Dam in Troy at River Mile 153.
Activity: 1. Review the definition of estuary and salt front with the students. To reinforce these
concepts, have the students do the math lesson “Tracking the Salt Front” from theHudson River Estuary Program (see http://www.dec.ny.gov/education/36595.html)
2. Introduce the Hudson River Miles system.3. Go over the worksheet with the class or hand out as an in-class or homework assignment.
Assessment: 1. Have students share answers to questions from worksheets, or collect and grade sheets.2. Find your community or the nearest river community on the Hudson River Miles map. Using
the first table in the worksheet (Fish Caught on A Day in the Life of the Hudson River),have students predict which fish they would be most likely to catch at your location.
Vocabulary: community: a group of living things that interact and are located in one place estuary: a body of water in which fresh and salt water meet fresh water: water that is not salty Hudson River Miles: distance north from the Battery at Manhattan’s southern tip
salt front: the leading edge of seawater entering an estuary salt water: seawater or other water that contains salt seine net: a fishing net that hangs vertically between floats and weights upriver: towards a stream’s source
Resources: Find illustrations and information about the fish described in this activity at the Department of Environmental Conservation website www.dec.ny.gov/animals/269.html or the Estuary Program’s gallery of Hudson River organisms http://www.dec.ny.gov/education/88154.html. The Atlantic silverside and other fish of salt water are described in the Chesapeake Bay Program’s Bay Field Guide www.chesapeakebay.net/bfg_fish.aspx?menuitem=14340 . Information about and data from the Day in the Life of the Hudson River is available at www.ldeo.columbia.edu/edu/k12/snapshotday/ .
Which Fish Where? Page 1
New York City HRM 0
Kowawese, New Windsor
HRM 59
Cohotate Preserve, Athens
HRM 115
Albany HRM 145
N Which Fish Where? ANSWER KEY
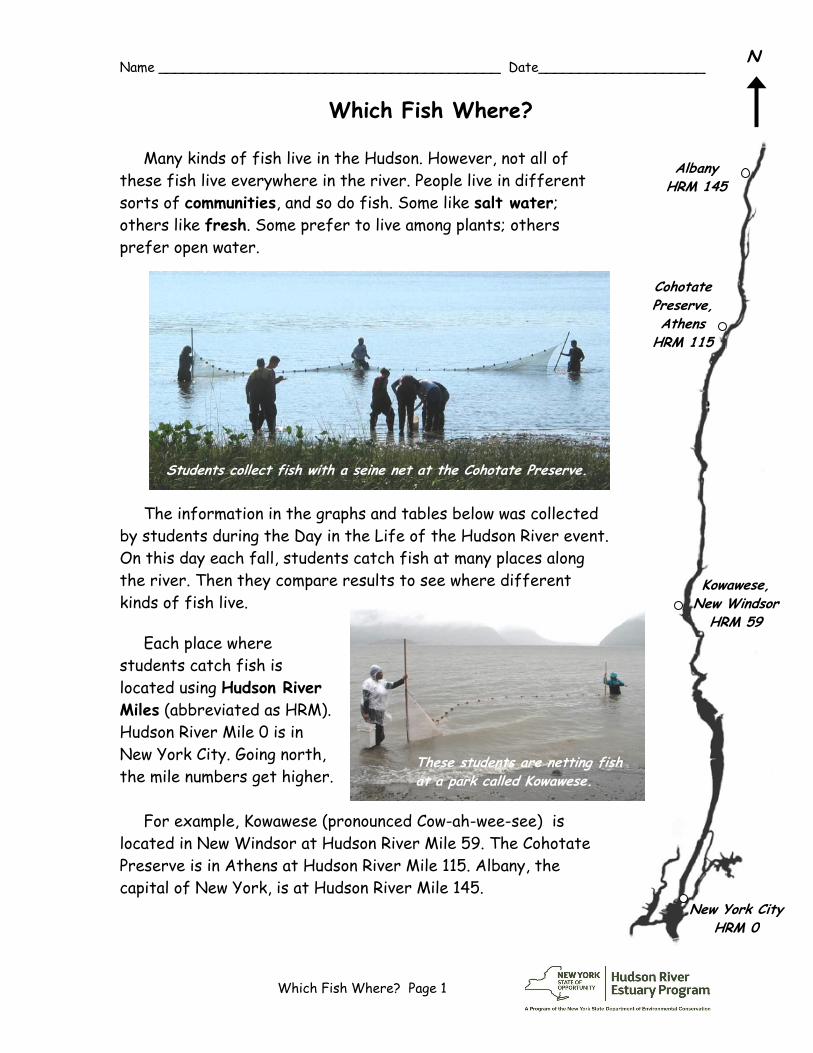
Which Fish Where?
Many kinds of fish live in the Hudson. However, not all of these fish live everywhere in the river. People live in different sorts of communities, and so do fish. Some like salt water; others like fresh. Some prefer to live among plants; others prefer open water.
The information in the graphs and tables below was collected by students during the Day in the Life of the Hudson River event. On this day each fall, students catch fish at many places along the river. Then they compare results to see where different kinds of fish live.
Each place where students catch fish is located using Hudson River Miles (abbreviated as HRM). Hudson River Mile 0 is in New York City. Going north, the mile numbers get higher.
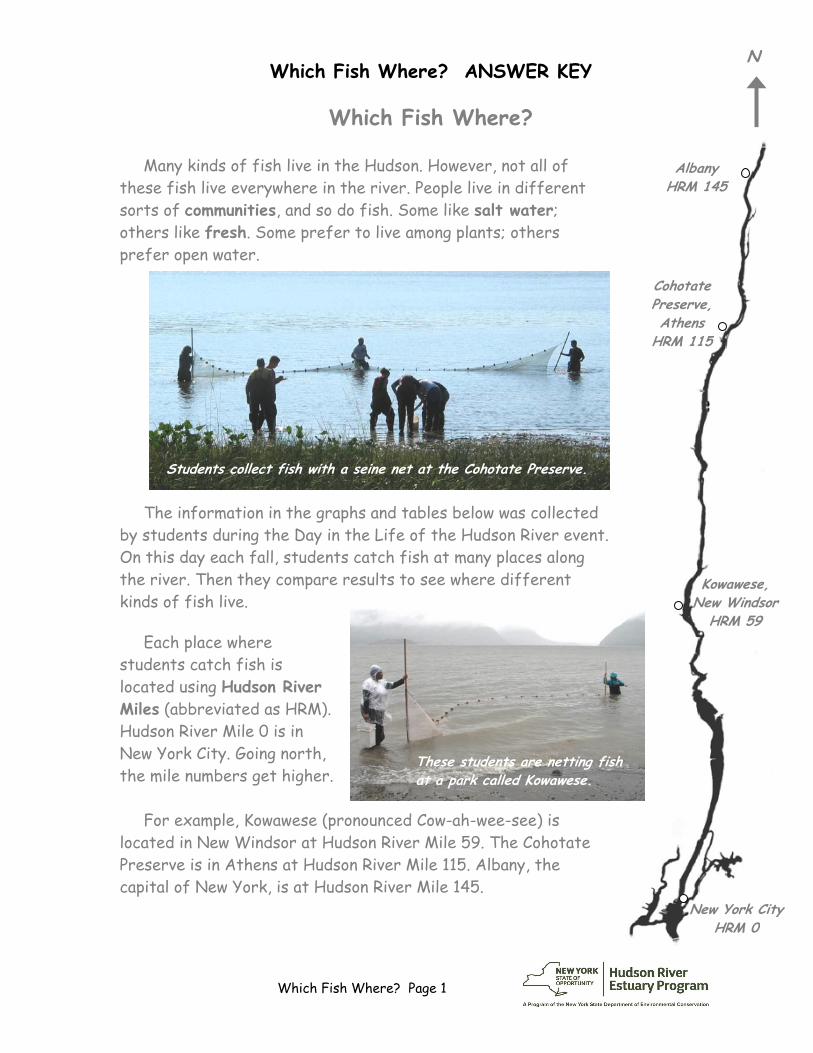
For example, Kowawese (pronounced Cow-ah-wee-see) is located in New Windsor at Hudson River Mile 59. The Cohotate Preserve is in Athens at Hudson River Mile 115. Albany, the capital of New York, is at Hudson River Mile 145.
Students collect fish with a seine net at the Cohotate Preserve.
These students are netting fish at a park called Kowawese.
Which Fish Where? Page 2
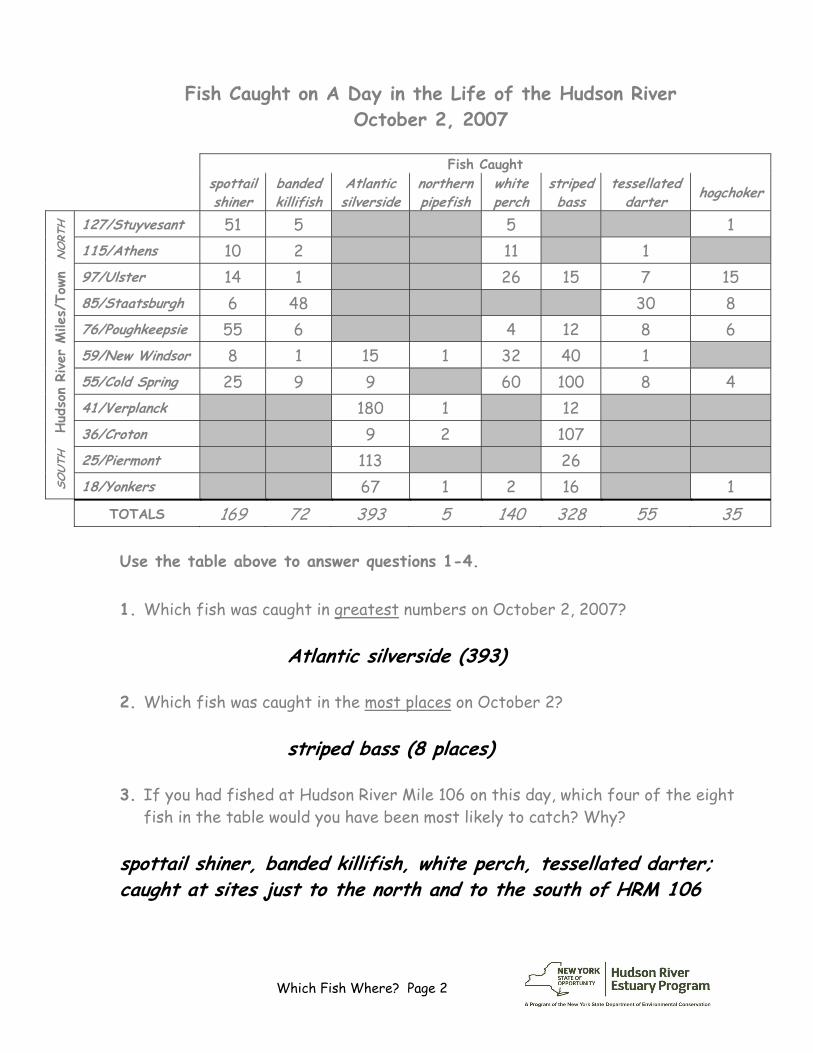
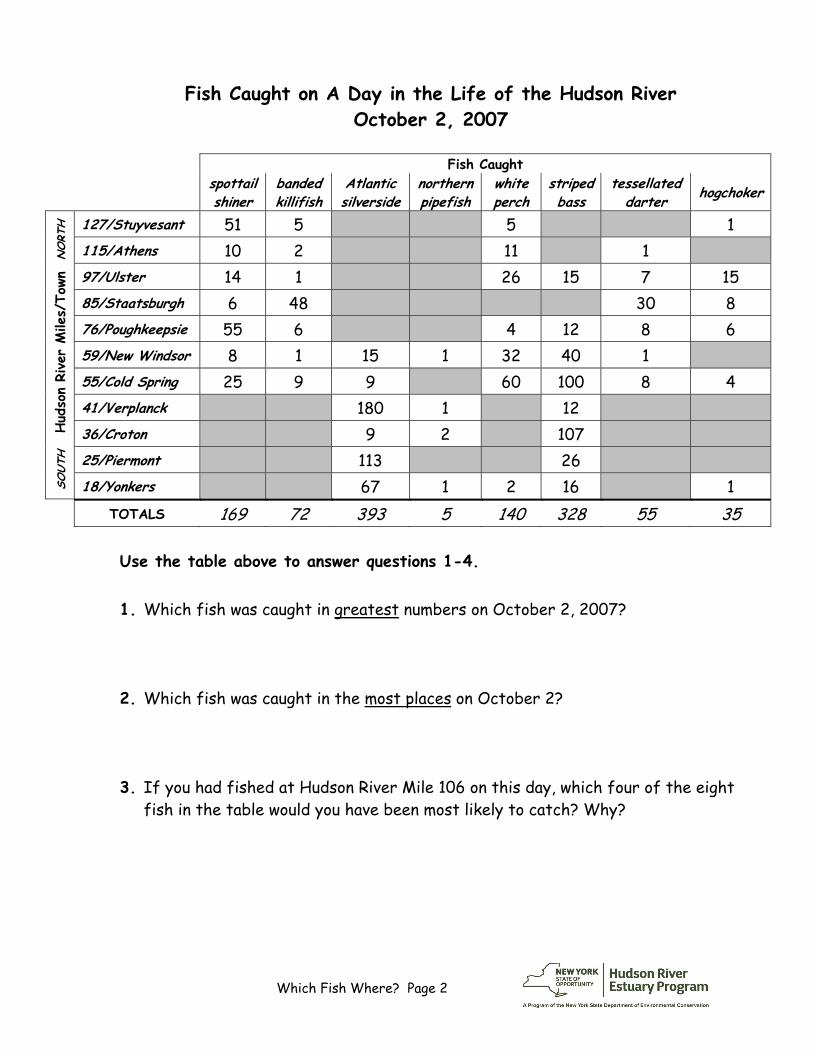
Fish Caught on A Day in the Life of the Hudson River October 2, 2007
Use the table above to answer questions 1-4.
1. Which fish was caught in greatest numbers on October 2, 2007?
Atlantic silverside (393)
2. Which fish was caught in the most places on October 2?
striped bass (8 places)
3. If you had fished at Hudson River Mile 106 on this day, which four of the eightfish in the table would you have been most likely to catch? Why?
spottail shiner, banded killifish, white perch, tessellated darter; caught at sites just to the north and to the south of HRM 106
Fish Caught spottail shiner
banded killifish
Atlantic silverside
northern pipefish
white perch
striped bass
tessellated darter hogchoker
SOUTH
H
udso
n Ri
ver
Mile
s/To
wn
NORT
H 127/Stuyvesant 51 5 5 1
115/Athens 10 2 11 197/Ulster 14 1 26 15 7 15 85/Staatsburgh 6 48 30 8 76/Poughkeepsie 55 6 4 12 8 6 59/New Windsor 8 1 15 1 32 40 1 55/Cold Spring 25 9 9 60 100 8 4 41/Verplanck 180 1 12 36/Croton 9 2 107 25/Piermont 113 26 18/Yonkers 67 1 2 16 1
TOTALS 169 72 393 5 140 328 55 35
Which Fish Where? Page 3
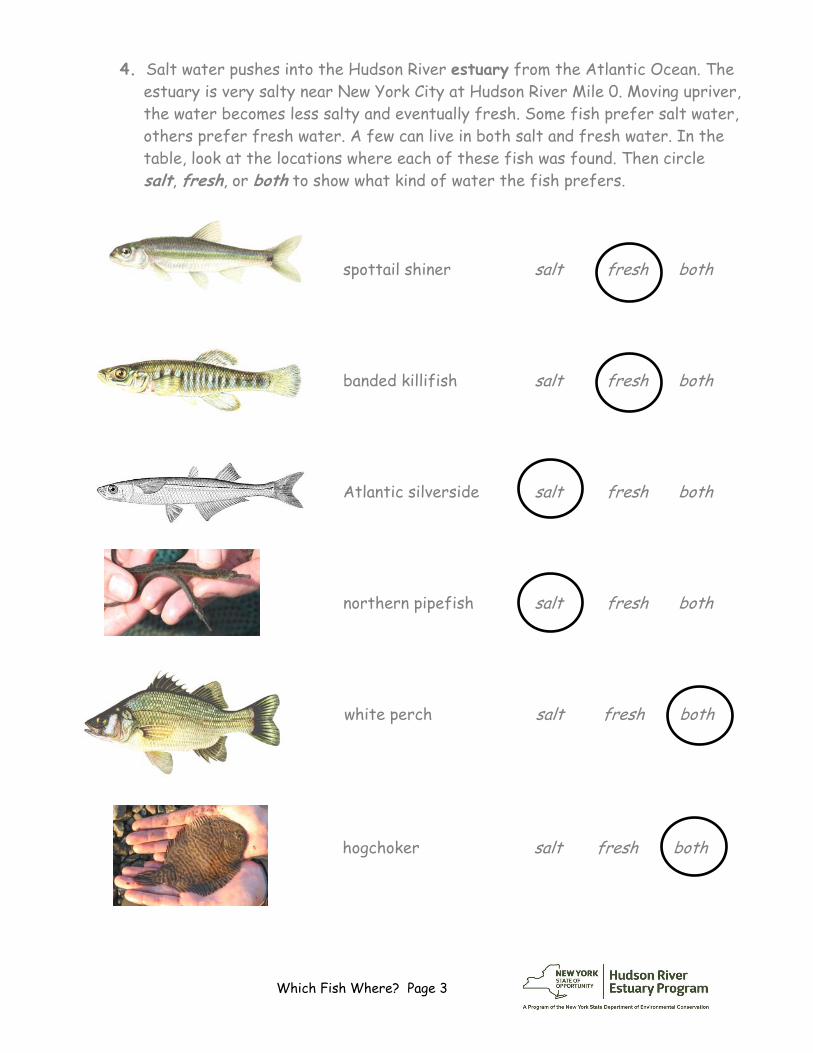
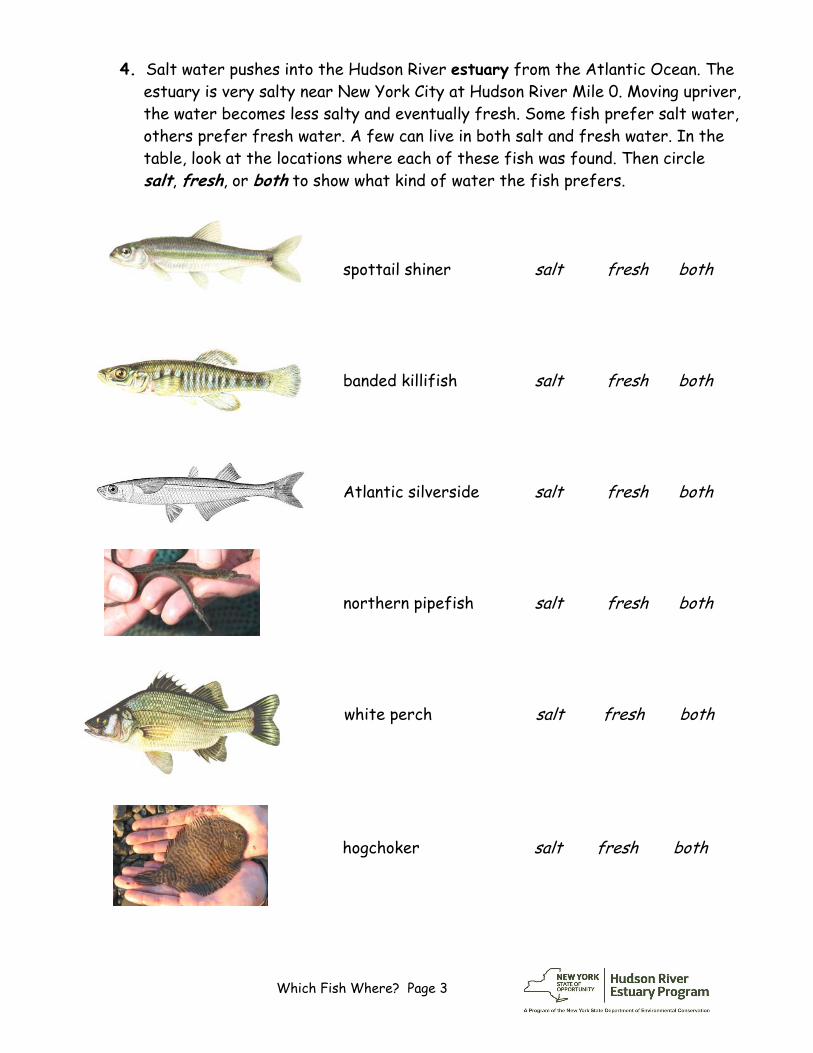
4. Salt water pushes into the Hudson River estuary from the Atlantic Ocean. Theestuary is very salty near New York City at Hudson River Mile 0. Moving upriver,the water becomes less salty and eventually fresh. Some fish prefer salt water,others prefer fresh water. A few can live in both salt and fresh water. In thetable, look at the locations where each of these fish was found. Then circlesalt, fresh, or both to show what kind of water the fish prefers.
spottail shiner salt fresh both
banded killifish salt fresh both
Atlantic silverside salt fresh both
northern pipefish salt fresh both
white perch salt fresh both
hogchoker salt fresh both
Which Fish Where? Page 4
North
South
spottail shiner
Atlantic silverside
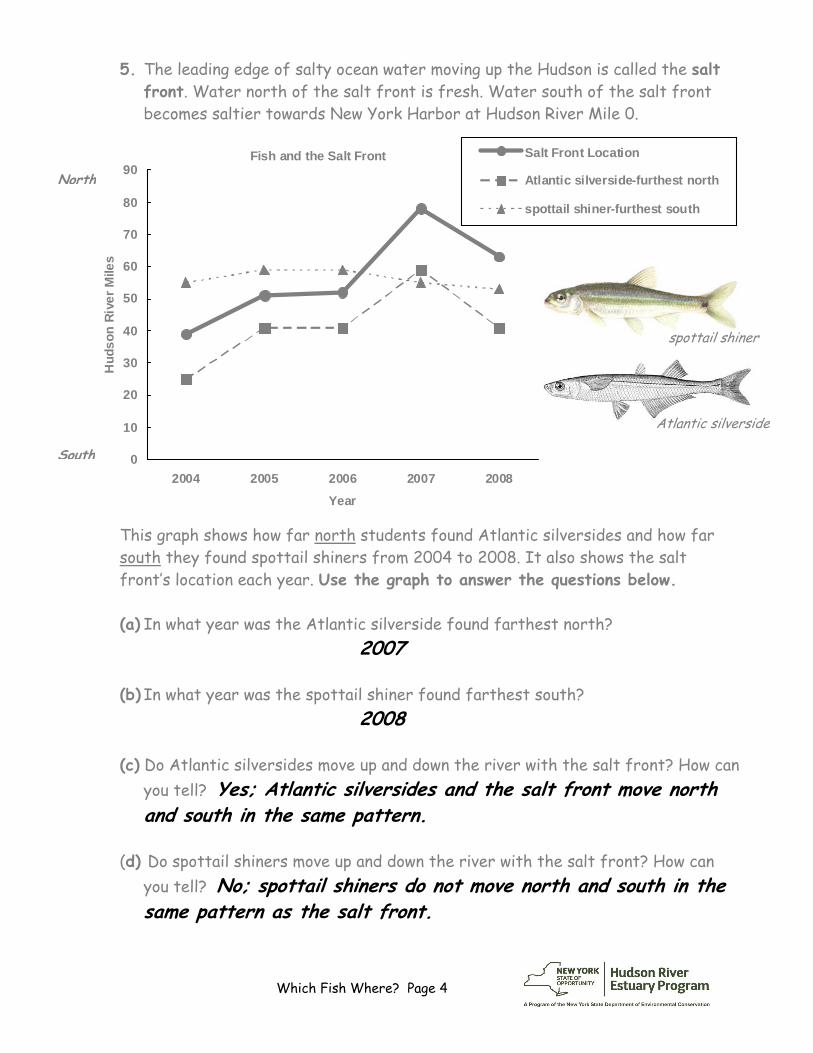
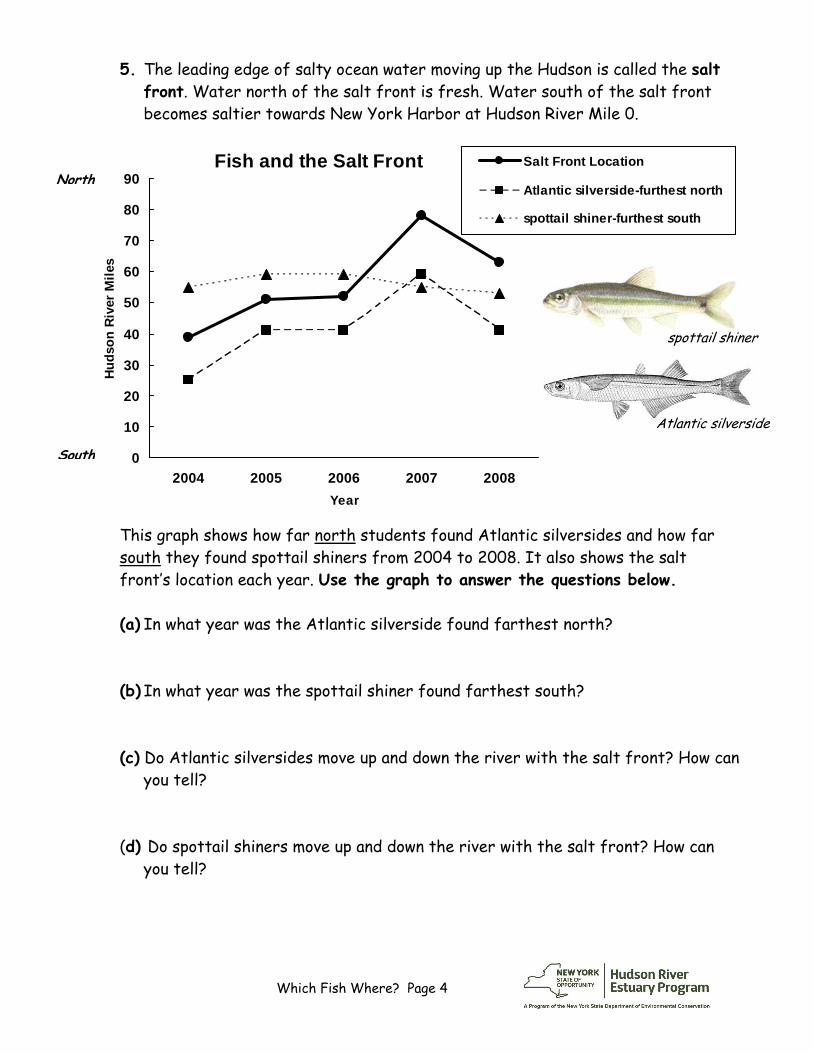
5. The leading edge of salty ocean water moving up the Hudson is called the saltfront. Water north of the salt front is fresh. Water south of the salt frontbecomes saltier towards New York Harbor at Hudson River Mile 0.
This graph shows how far north students found Atlantic silversides and how far south they found spottail shiners from 2004 to 2008. It also shows the salt front’s location each year. Use the graph to answer the questions below.
(a) In what year was the Atlantic silverside found farthest north? 2007
(b) In what year was the spottail shiner found farthest south? 2008
(c) Do Atlantic silversides move up and down the river with the salt front? How can you tell? Yes; Atlantic silversides and the salt front move north and south in the same pattern.
(d) Do spottail shiners move up and down the river with the salt front? How can you tell? No; spottail shiners do not move north and south in the same pattern as the salt front.
Fish and the Salt Front
0
10
20
30
40
50
60
70
80
90
2004 2005 2006 2007 2008
Year
Hud
son
Rive
r Mile
s
Salt Front Location
Atlantic silverside-furthest north
spottail shiner-furthest south
Which Fish Where? Page 5
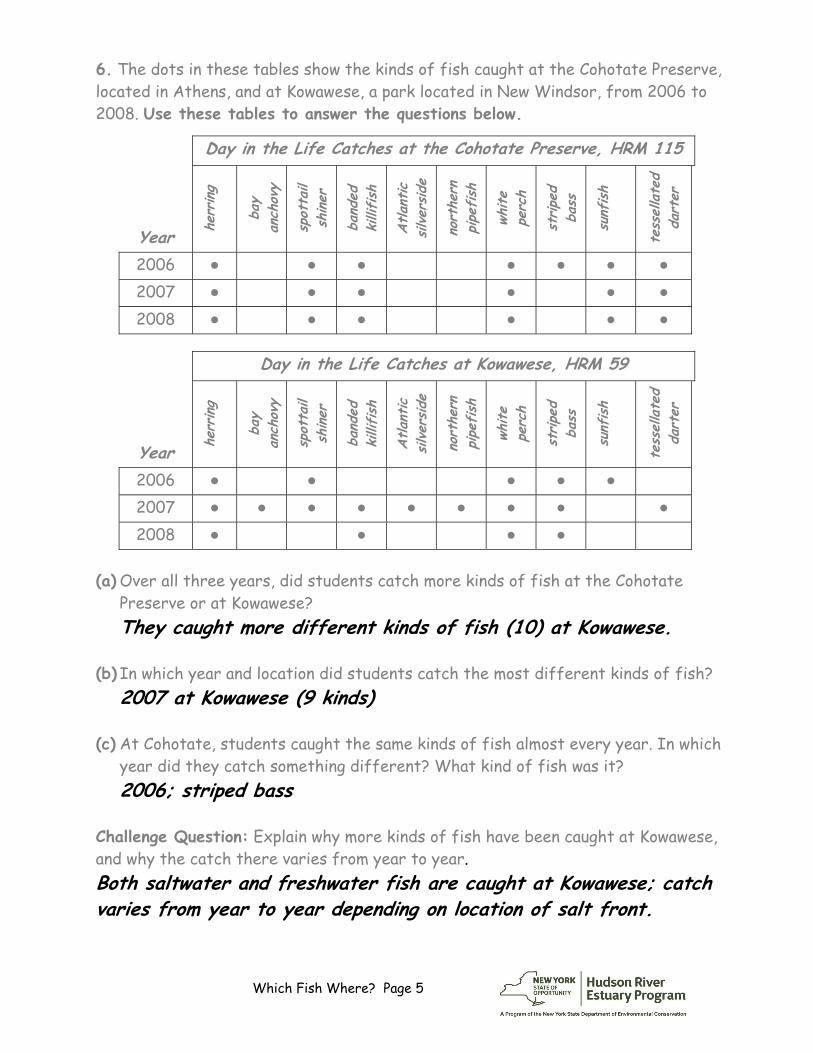
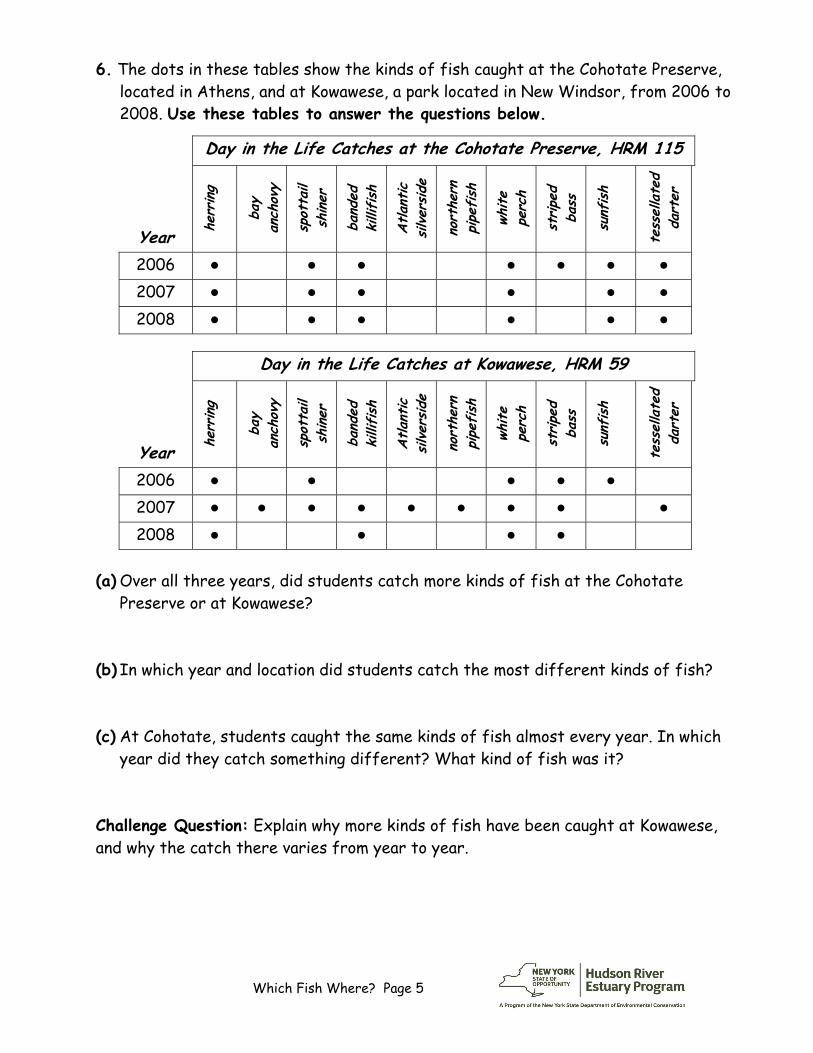
6. The dots in these tables show the kinds of fish caught at the Cohotate Preserve,located in Athens, and at Kowawese, a park located in New Windsor, from 2006 to 2008. Use these tables to answer the questions below.
(a) Over all three years, did students catch more kinds of fish at the Cohotate Preserve or at Kowawese? They caught more different kinds of fish (10) at Kowawese.
(b) In which year and location did students catch the most different kinds of fish? 2007 at Kowawese (9 kinds)
(c) At Cohotate, students caught the same kinds of fish almost every year. In which year did they catch something different? What kind of fish was it? 2006; striped bass
Challenge Question: Explain why more kinds of fish have been caught at Kowawese, and why the catch there varies from year to year. Both saltwater and freshwater fish are caught at Kowawese; catch varies from year to year depending on location of salt front.
Year
Day in the Life Catches at the Cohotate Preserve, HRM 115
herr
ing
bay
anch
ovy
spot
tail
shiner
band
ed
killifish
Atlant
ic
silver
side
nort
hern
pipe
fish
white
perc
h
stripe
d ba
ss
sunf
ish
tess
ellate
d da
rter
2006 2007 2008
Year
Day in the Life Catches at Kowawese, HRM 59
herr
ing
bay
anch
ovy
spot
tail
shiner
band
ed
killifish
Atlant
ic
silver
side
nort
hern
pipe
fish
white
perc
h
stripe
d ba
ss
sunf
ish
tess
ellate
d da
rter
2006 2007 2008

This page intentionally left blank.
Which Fish Where? Page 1
New York City HRM 0
Kowawese, New Windsor
HRM 59
Cohotate Preserve, Athens
HRM 115
Albany HRM 145
N Name _________________________________________ Date____________________
Which Fish Where?
Many kinds of fish live in the Hudson. However, not all of these fish live everywhere in the river. People live in different sorts of communities, and so do fish. Some like salt water; others like fresh. Some prefer to live among plants; others prefer open water.
The information in the graphs and tables below was collected by students during the Day in the Life of the Hudson River event. On this day each fall, students catch fish at many places along the river. Then they compare results to see where different kinds of fish live.
Each place where students catch fish is located using Hudson River Miles (abbreviated as HRM). Hudson River Mile 0 is in New York City. Going north, the mile numbers get higher.
For example, Kowawese (pronounced Cow-ah-wee-see) is located in New Windsor at Hudson River Mile 59. The Cohotate Preserve is in Athens at Hudson River Mile 115. Albany, the capital of New York, is at Hudson River Mile 145.
Students collect fish with a seine net at the Cohotate Preserve.
These students are netting fish at a park called Kowawese.
Which Fish Where? Page 2
Fish Caught on A Day in the Life of the Hudson River October 2, 2007
Use the table above to answer questions 1-4.
1. Which fish was caught in greatest numbers on October 2, 2007?
2. Which fish was caught in the most places on October 2?
3. If you had fished at Hudson River Mile 106 on this day, which four of the eightfish in the table would you have been most likely to catch? Why?
Fish Caught spottail shiner
banded killifish
Atlantic silverside
northern pipefish
white perch
striped bass
tessellated darter hogchoker
SOUTH
H
udso
n Ri
ver
Mile
s/To
wn
NORT
H 127/Stuyvesant 51 5 5 1
115/Athens 10 2 11 197/Ulster 14 1 26 15 7 15 85/Staatsburgh 6 48 30 8 76/Poughkeepsie 55 6 4 12 8 6 59/New Windsor 8 1 15 1 32 40 1 55/Cold Spring 25 9 9 60 100 8 4 41/Verplanck 180 1 12 36/Croton 9 2 107 25/Piermont 113 26 18/Yonkers 67 1 2 16 1
TOTALS 169 72 393 5 140 328 55 35
Which Fish Where? Page 3
4. Salt water pushes into the Hudson River estuary from the Atlantic Ocean. Theestuary is very salty near New York City at Hudson River Mile 0. Moving upriver,the water becomes less salty and eventually fresh. Some fish prefer salt water,others prefer fresh water. A few can live in both salt and fresh water. In thetable, look at the locations where each of these fish was found. Then circlesalt, fresh, or both to show what kind of water the fish prefers.
spottail shiner salt fresh both
banded killifish salt fresh both
Atlantic silverside salt fresh both
northern pipefish salt fresh both
white perch salt fresh both
hogchoker salt fresh both
Which Fish Where? Page 4
North
South
spottail shiner
Atlantic silverside
5. The leading edge of salty ocean water moving up the Hudson is called the saltfront. Water north of the salt front is fresh. Water south of the salt frontbecomes saltier towards New York Harbor at Hudson River Mile 0.
This graph shows how far north students found Atlantic silversides and how far south they found spottail shiners from 2004 to 2008. It also shows the salt front’s location each year. Use the graph to answer the questions below.
(a) In what year was the Atlantic silverside found farthest north?
(b) In what year was the spottail shiner found farthest south?
(c) Do Atlantic silversides move up and down the river with the salt front? How can you tell?
(d) Do spottail shiners move up and down the river with the salt front? How can you tell?
Fish and the Salt Front
0
10
20
30
40
50
60
70
80
90
2004 2005 2006 2007 2008Year
Huds
on R
iver
Mile
s
Salt Front Location
Atlantic silverside-furthest north
spottail shiner-furthest south
Which Fish Where? Page 5
6. The dots in these tables show the kinds of fish caught at the Cohotate Preserve,located in Athens, and at Kowawese, a park located in New Windsor, from 2006 to2008. Use these tables to answer the questions below.
(a) Over all three years, did students catch more kinds of fish at the Cohotate Preserve or at Kowawese?
(b) In which year and location did students catch the most different kinds of fish?
(c) At Cohotate, students caught the same kinds of fish almost every year. In which year did they catch something different? What kind of fish was it?
Challenge Question: Explain why more kinds of fish have been caught at Kowawese, and why the catch there varies from year to year.
Year
Day in the Life Catches at the Cohotate Preserve, HRM 115
herr
ing
bay
anch
ovy
spot
tail
shiner
band
ed
killifish
Atlant
ic
silver
side
nort
hern
pipe
fish
white
perc
h
stripe
d ba
ss
sunf
ish
tess
ellate
d da
rter
2006 2007 2008
Year
Day in the Life Catches at Kowawese, HRM 59
herr
ing
bay
anch
ovy
spot
tail
shiner
band
ed
killifish
Atlant
ic
silver
side
nort
hern
pipe
fish
white
perc
h
stripe
d ba
ss
sunf
ish
tess
ellate
d da
rter
2006 2007 2008

This page intentionally left blank.
Hudson River Estuary Program NYS Department of Environmental Conservation
Finding the Salt Front
Students will use Hudson River salinity data to create a line graph that shows the location of the salt front, and use math skills to explore how this location varies over time.
Objectives: Students will use data from tables to: • graph salinity data from sites along the Hudson River estuary;• observe patterns of change in salinity along the estuary;• use the graph to estimate the location of the salt front;• compare the location of the salt front in different years.
Grade level: Elementary (Grades 4-7)
Subject Area: Math, Science
Standards: Mathematics, Science, & Technology Standards 3, 4
Skills: • Use graphs to see patterns and relationships observed in the
physical environment.• Use whole numbers to identify locations and measure distances.• Add and subtract whole numbers.
Duration: Preparation time: 5 minutes Activity time: 50 minutes for each of two sections
Materials: Each student should have: Worksheet: Finding the Salt Front – Section 1 Worksheet: Finding the Salt Front – Section 2 Regular pencil Two colored pencils of different hues Ruler Hudson River Miles map (helpful but not required)
Hudson River Estuary Program NYS Department of Environmental Conservation
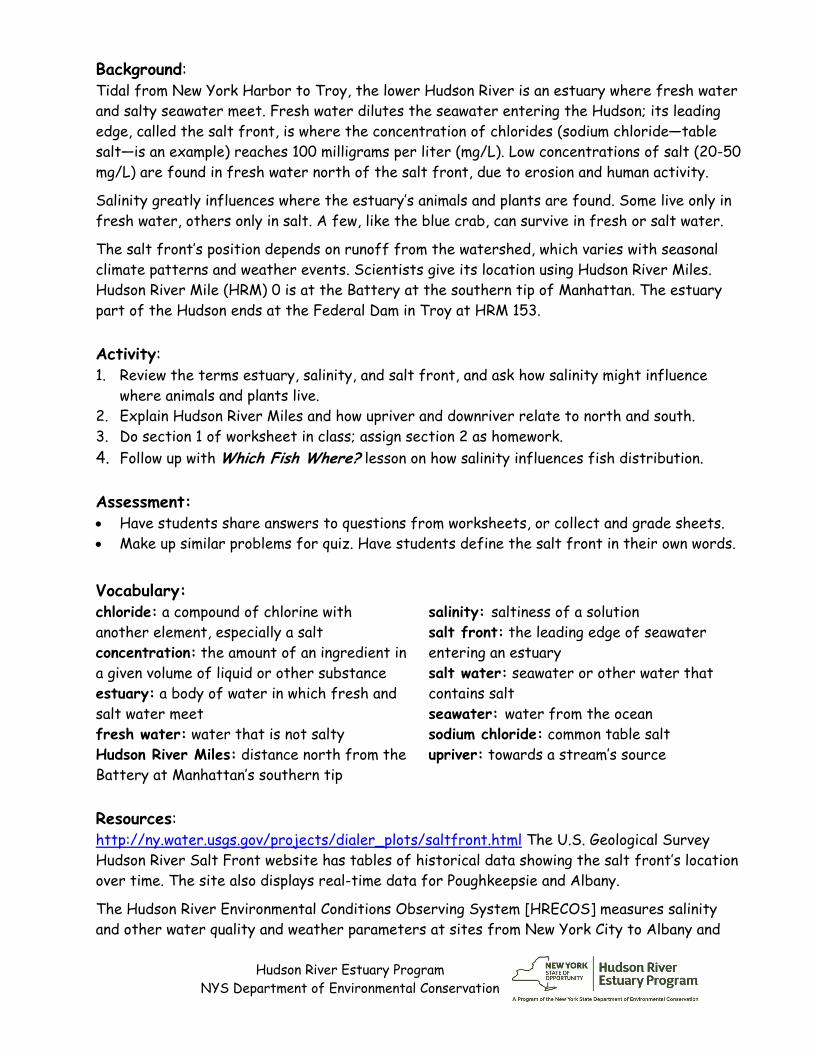
Background: Tidal from New York Harbor to Troy, the lower Hudson River is an estuary where fresh water and salty seawater meet. Fresh water dilutes the seawater entering the Hudson; its leading edge, called the salt front, is where the concentration of chlorides (sodium chloride—table salt—is an example) reaches 100 milligrams per liter (mg/L). Low concentrations of salt (20-50 mg/L) are found in fresh water north of the salt front, due to erosion and human activity.
Salinity greatly influences where the estuary’s animals and plants are found. Some live only in fresh water, others only in salt. A few, like the blue crab, can survive in fresh or salt water.
The salt front’s position depends on runoff from the watershed, which varies with seasonal climate patterns and weather events. Scientists give its location using Hudson River Miles. Hudson River Mile (HRM) 0 is at the Battery at the southern tip of Manhattan. The estuary part of the Hudson ends at the Federal Dam in Troy at HRM 153.
Activity: 1. Review the terms estuary, salinity, and salt front, and ask how salinity might influence
where animals and plants live.2. Explain Hudson River Miles and how upriver and downriver relate to north and south.3. Do section 1 of worksheet in class; assign section 2 as homework.4. Follow up with Which Fish Where? lesson on how salinity influences fish distribution.
Assessment: • Have students share answers to questions from worksheets, or collect and grade sheets.• Make up similar problems for quiz. Have students define the salt front in their own words.
Vocabulary: chloride: a compound of chlorine with another element, especially a salt concentration: the amount of an ingredient in a given volume of liquid or other substance estuary: a body of water in which fresh and salt water meet fresh water: water that is not salty Hudson River Miles: distance north from the Battery at Manhattan’s southern tip
salinity: saltiness of a solution salt front: the leading edge of seawater entering an estuary salt water: seawater or other water that contains salt seawater: water from the ocean sodium chloride: common table salt upriver: towards a stream’s source
Resources: http://ny.water.usgs.gov/projects/dialer_plots/saltfront.html The U.S. Geological Survey Hudson River Salt Front website has tables of historical data showing the salt front’s location over time. The site also displays real-time data for Poughkeepsie and Albany.
The Hudson River Environmental Conditions Observing System [HRECOS] measures salinity and other water quality and weather parameters at sites from New York City to Albany and
Hudson River Estuary Program NYS Department of Environmental Conservation
uploads this data to the web at www.hrecos.org. On the HRECOS website, click on the Current Conditions page to access this information. Dropdown menus allow users to select a station and parameter, choose units of measurement, plot continous readings (usually generated every 15 minutes) or daily averages, and specify start and end dates. One can also compare parameters by plotting two on one graph.
On DEC's annual Day in the Life of the Hudson River (a.k.a. Snapshot Day), thousands of students and teachers collect data at field sites from New York Harbor north to Albany and beyond. Their results are posted on at www.ldeo.columbia.edu/edu/k12/snapshotday/. It supplied the salinity data used here, but note that salinity is measured in various ways, and some data had to be converted to equivalent mg/L of chloride.
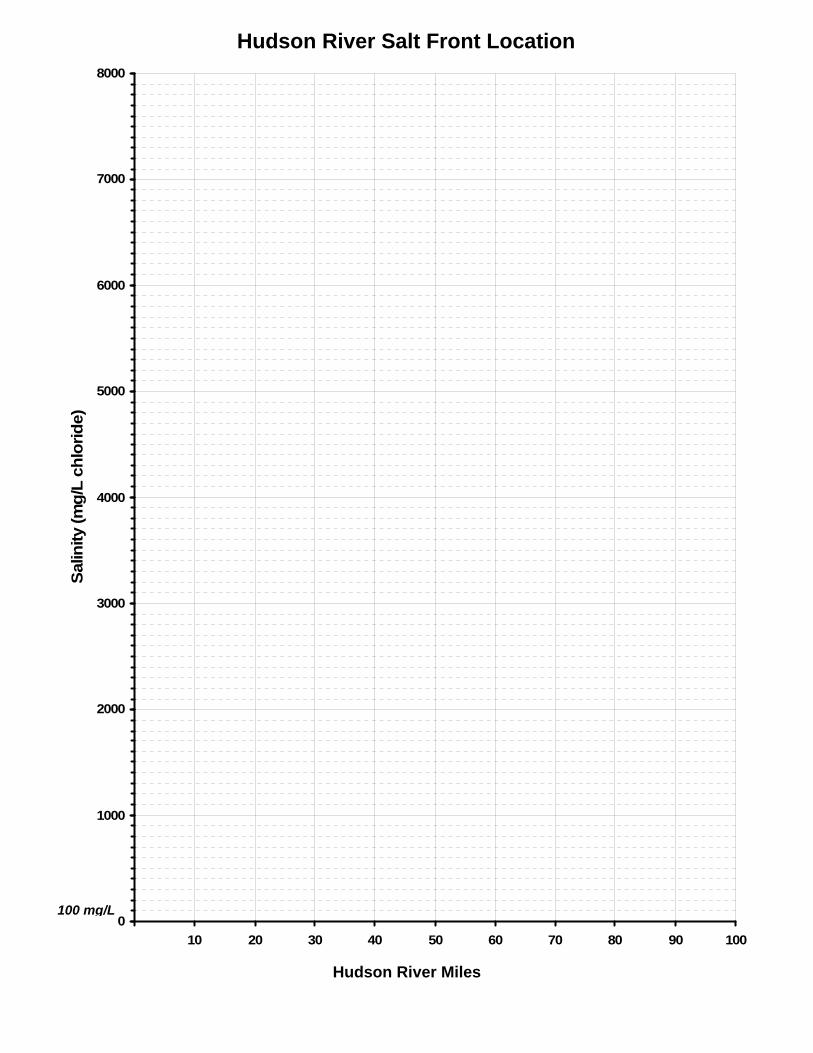
Teachers’s Key - Hudson River Salt Front Location
100 mg/L
Hudson River Miles
0
1000
2000
3000
4000
5000
6000
7000
8000
10 20 30 40 50 60 70 80 90 100
Salin
ity (m
g/L
chlo
ride)
2006
2004
Finding the Salt Front: Page 1
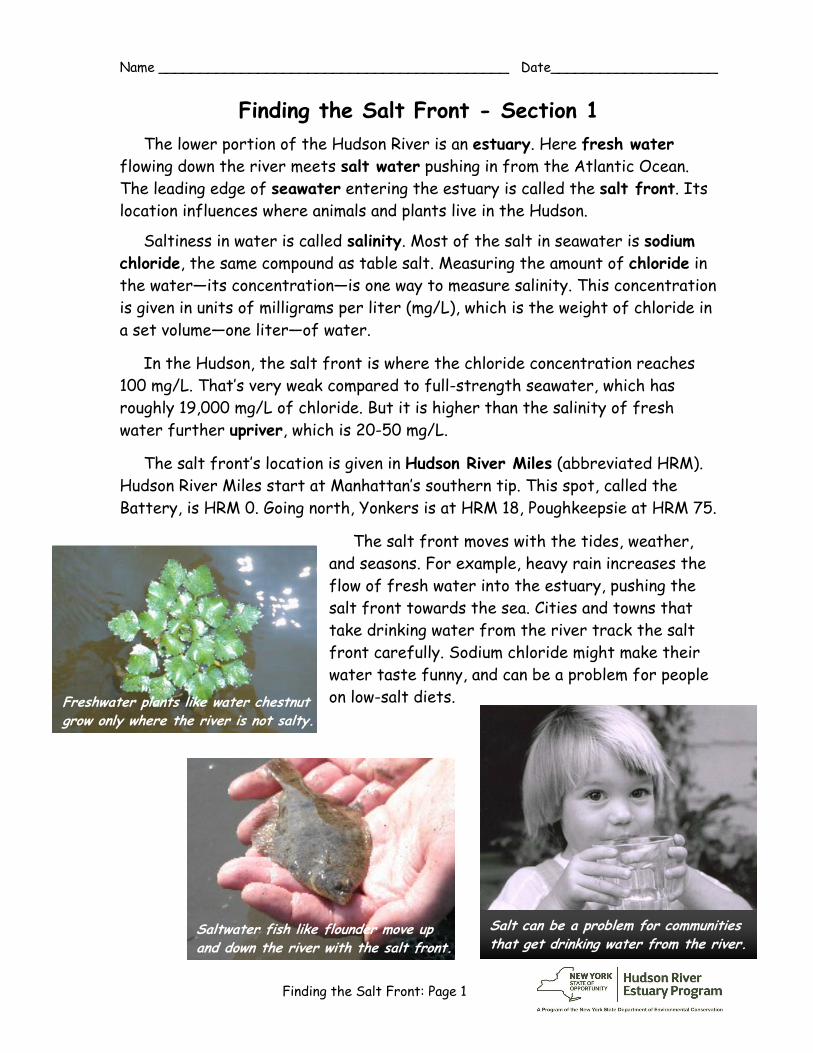
Saltwater fish like flounder move up and down the river with the salt front.
Freshwater plants like water chestnut grow only where the river is not salty. Freshwater plants like water chestnut grow only where the river is not salty.
Salt can be a problem for communities that get drinking water from the river.
Finding the Salt Front – ANSWER KEY
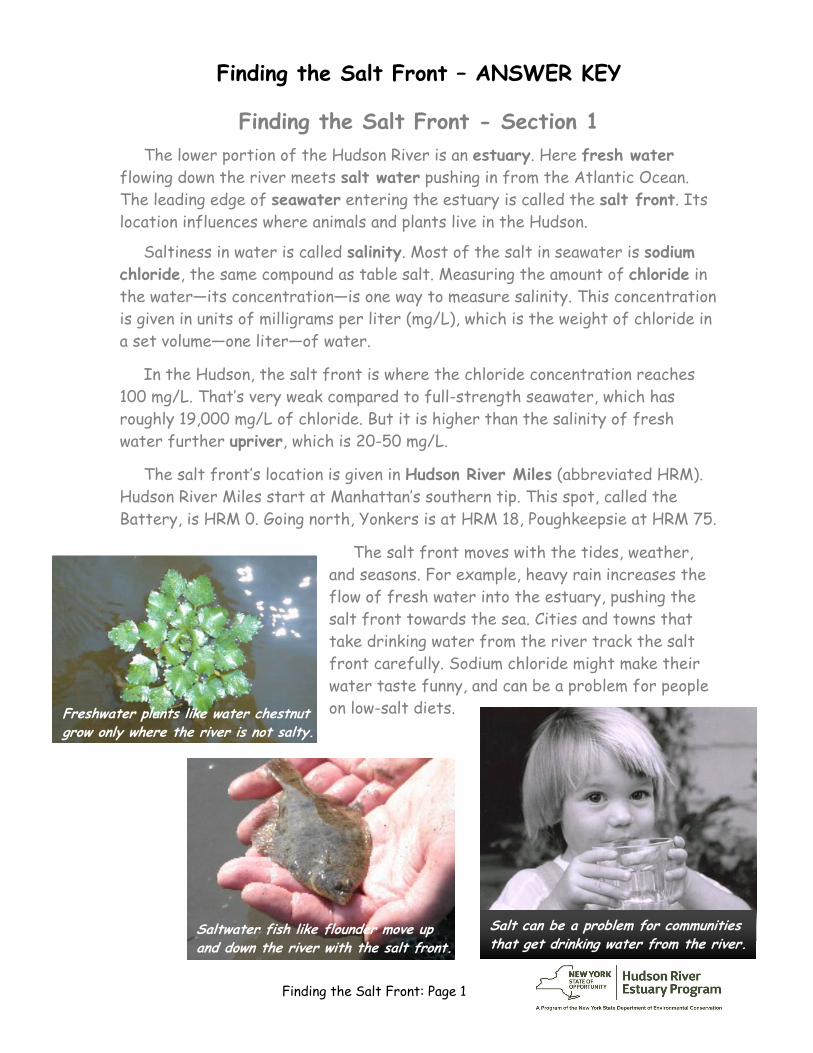
Finding the Salt Front - Section 1 The lower portion of the Hudson River is an estuary. Here fresh water
flowing down the river meets salt water pushing in from the Atlantic Ocean. The leading edge of seawater entering the estuary is called the salt front. Its location influences where animals and plants live in the Hudson.
Saltiness in water is called salinity. Most of the salt in seawater is sodium chloride, the same compound as table salt. Measuring the amount of chloride in the water—its concentration—is one way to measure salinity. This concentration is given in units of milligrams per liter (mg/L), which is the weight of chloride in a set volume—one liter—of water.
In the Hudson, the salt front is where the chloride concentration reaches 100 mg/L. That’s very weak compared to full-strength seawater, which has roughly 19,000 mg/L of chloride. But it is higher than the salinity of fresh water further upriver, which is 20-50 mg/L.
The salt front’s location is given in Hudson River Miles (abbreviated HRM). Hudson River Miles start at Manhattan’s southern tip. This spot, called the Battery, is HRM 0. Going north, Yonkers is at HRM 18, Poughkeepsie at HRM 75.
The salt front moves with the tides, weather, and seasons. For example, heavy rain increases the flow of fresh water into the estuary, pushing the salt front towards the sea. Cities and towns that take drinking water from the river track the salt front carefully. Sodium chloride might make their water taste funny, and can be a problem for people on low-salt diets.
Finding the Salt Front: Page 2
New York HRM 7
Yonkers HRM 18
Piermont HRM 25
Bear Mt. HRM 46
Cold Spring
HRM 55
Ulster HRM 97
HRM 7 to HRM 46
HRM 46 to HRM 97
N
1,805 - 50 = 1,755
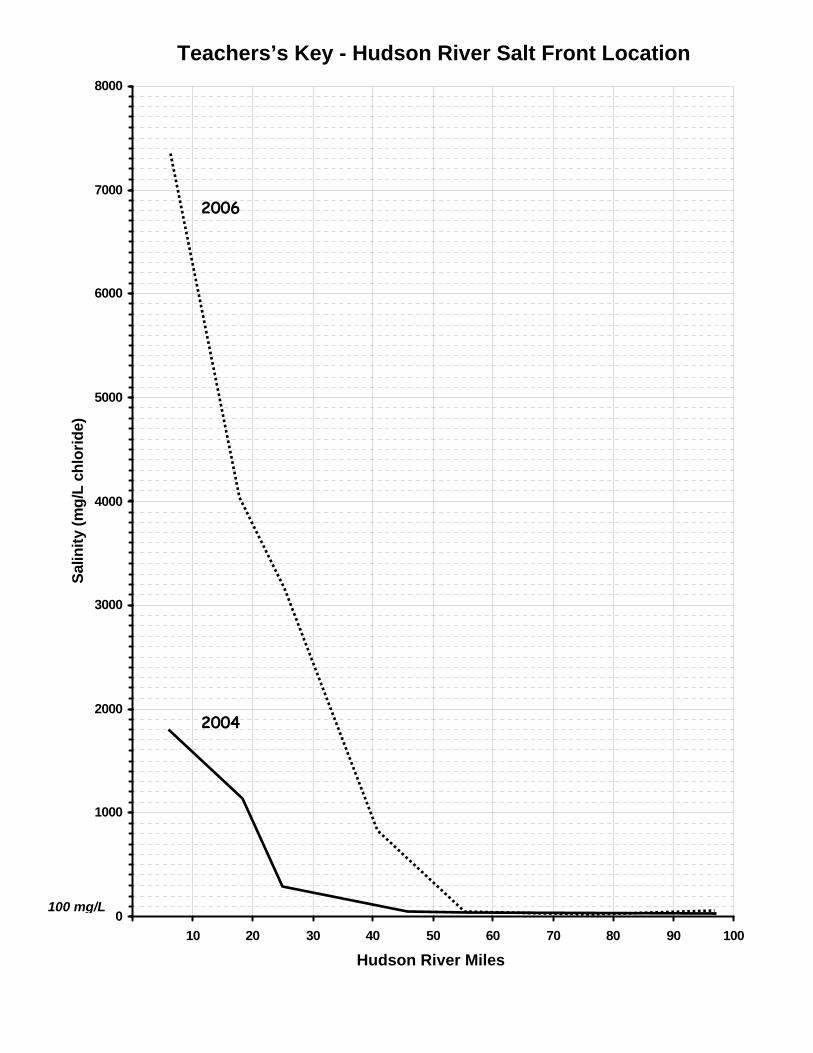
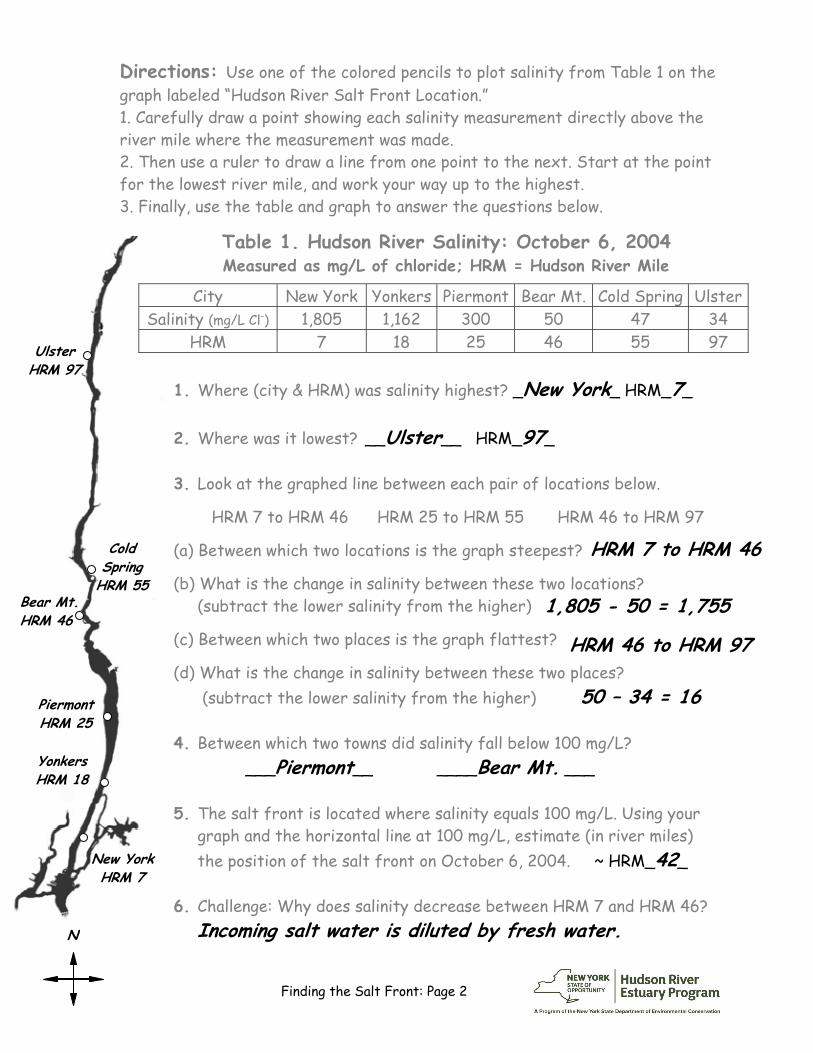
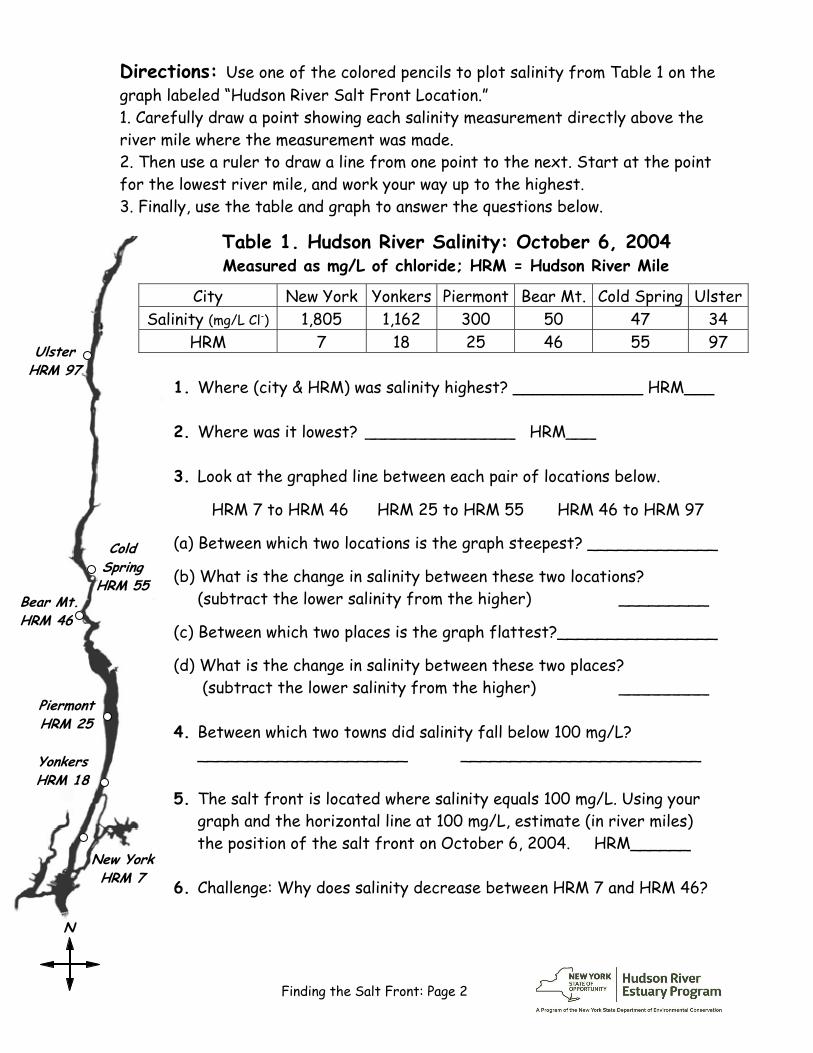
Directions: Use one of the colored pencils to plot salinity from Table 1 on the graph labeled “Hudson River Salt Front Location.” 1. Carefully draw a point showing each salinity measurement directly above theriver mile where the measurement was made. 2. Then use a ruler to draw a line from one point to the next. Start at the pointfor the lowest river mile, and work your way up to the highest. 3. Finally, use the table and graph to answer the questions below.
Table 1. Hudson River Salinity: October 6, 2004 Measured as mg/L of chloride; HRM = Hudson River Mile
1. Where (city & HRM) was salinity highest? _New York_ HRM_7_
2. Where was it lowest? __Ulster__ HRM_97_
3. Look at the graphed line between each pair of locations below.
HRM 7 to HRM 46 HRM 25 to HRM 55 HRM 46 to HRM 97
(a) Between which two locations is the graph steepest?
(b) What is the change in salinity between these two locations? (subtract the lower salinity from the higher)
(c) Between which two places is the graph flattest?
(d) What is the change in salinity between these two places? (subtract the lower salinity from the higher) 50 – 34 = 16
4. Between which two towns did salinity fall below 100 mg/L? ___Piermont__ ____Bear Mt. ___
5. The salt front is located where salinity equals 100 mg/L. Using yourgraph and the horizontal line at 100 mg/L, estimate (in river miles)the position of the salt front on October 6, 2004. ~ HRM_42_
6. Challenge: Why does salinity decrease between HRM 7 and HRM 46?Incoming salt water is diluted by fresh water.
City New York Yonkers Piermont Bear Mt. Cold Spring Ulster Salinity (mg/L Cl-) 1,805 1,162 300 50 47 34
HRM 7 18 25 46 55 97
Finding the Salt Front: Page 3
New York HRM 7
Ulster HRM 97
Cold Spring
HRM 55
Piermont HRM 25
Yonkers HRM 18
Verplanck HRM 41
Pough-keepsie HRM 76
HRM 7 to HRM 55
7,362 – 50 = 7,312HRM 55 to HRM 97
N
Name __________________________________________ Date____________________
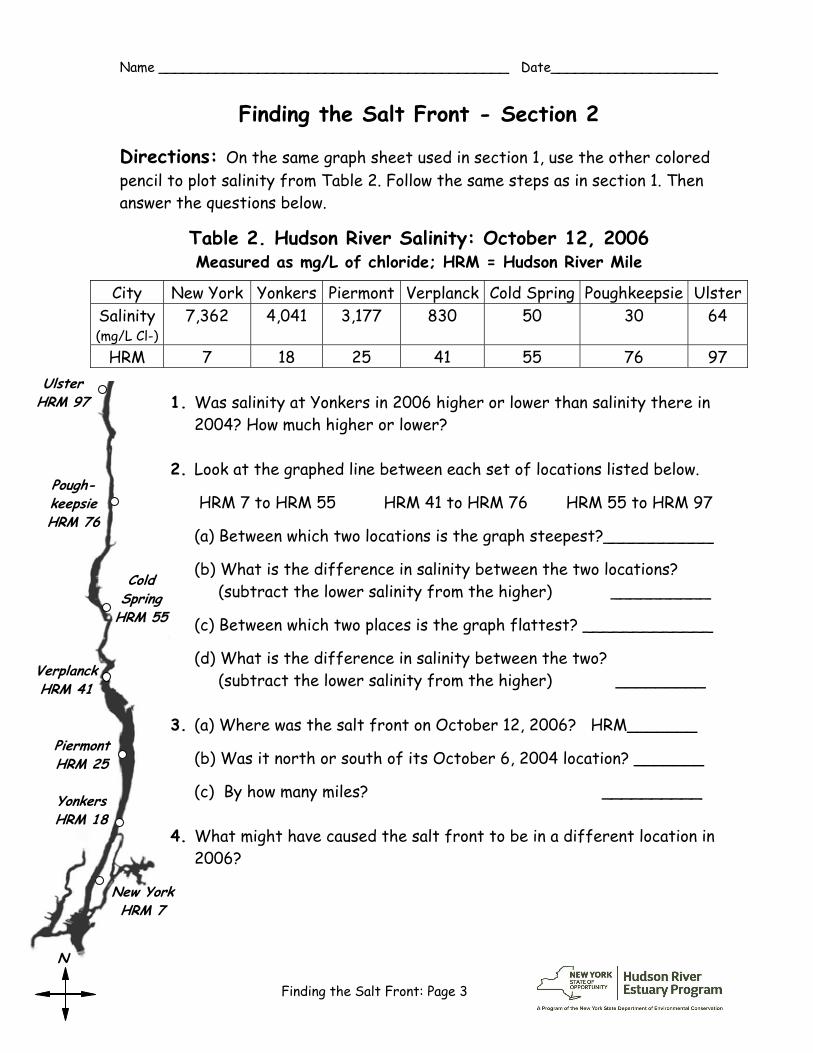
Finding the Salt Front - Section 2
Directions: On the same graph sheet used in section 1, use the other colored pencil to plot salinity from Table 2. Follow the same steps as in section 1. Then answer the questions below.
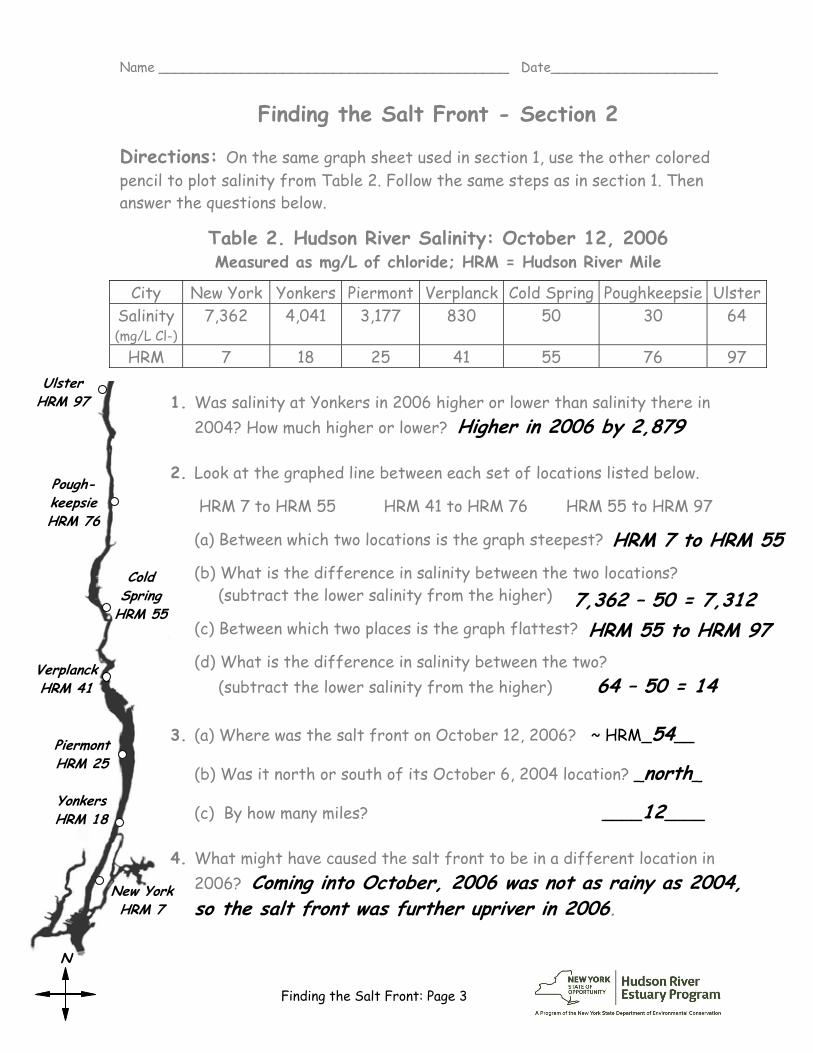
Table 2. Hudson River Salinity: October 12, 2006 Measured as mg/L of chloride; HRM = Hudson River Mile
1. Was salinity at Yonkers in 2006 higher or lower than salinity there in2004? How much higher or lower? Higher in 2006 by 2,879
2. Look at the graphed line between each set of locations listed below.
HRM 7 to HRM 55 HRM 41 to HRM 76 HRM 55 to HRM 97
(a) Between which two locations is the graph steepest?
(b) What is the difference in salinity between the two locations? (subtract the lower salinity from the higher)
(c) Between which two places is the graph flattest?
(d) What is the difference in salinity between the two? (subtract the lower salinity from the higher) 64 – 50 = 14
3. (a) Where was the salt front on October 12, 2006? ~ HRM_54__
(b) Was it north or south of its October 6, 2004 location? _north_
(c) By how many miles? ____12____
4. What might have caused the salt front to be in a different location in2006? Coming into October, 2006 was not as rainy as 2004,so the salt front was further upriver in 2006.
City New York Yonkers Piermont Verplanck Cold Spring Poughkeepsie Ulster Salinity (mg/L Cl-)
7,362 4,041 3,177 830 50 30 64
HRM 7 18 25 41 55 76 97

This page intentionally left blank.
Finding the Salt Front: Page 1
Saltwater fish like flounder move up and down the river with the salt front.
Freshwater plants like water chestnut grow only where the river is not salty.
Salt can be a problem for communities that get drinking water from the river.
Name __________________________________________ Date____________________
Finding the Salt Front - Section 1 The lower portion of the Hudson River is an estuary. Here fresh water
flowing down the river meets salt water pushing in from the Atlantic Ocean. The leading edge of seawater entering the estuary is called the salt front. Its location influences where animals and plants live in the Hudson.
Saltiness in water is called salinity. Most of the salt in seawater is sodium chloride, the same compound as table salt. Measuring the amount of chloride in the water—its concentration—is one way to measure salinity. This concentration is given in units of milligrams per liter (mg/L), which is the weight of chloride in a set volume—one liter—of water.
In the Hudson, the salt front is where the chloride concentration reaches 100 mg/L. That’s very weak compared to full-strength seawater, which has roughly 19,000 mg/L of chloride. But it is higher than the salinity of fresh water further upriver, which is 20-50 mg/L.
The salt front’s location is given in Hudson River Miles (abbreviated HRM). Hudson River Miles start at Manhattan’s southern tip. This spot, called the Battery, is HRM 0. Going north, Yonkers is at HRM 18, Poughkeepsie at HRM 75.
The salt front moves with the tides, weather, and seasons. For example, heavy rain increases the flow of fresh water into the estuary, pushing the salt front towards the sea. Cities and towns that take drinking water from the river track the salt front carefully. Sodium chloride might make their water taste funny, and can be a problem for people on low-salt diets.
Finding the Salt Front: Page 2
New York HRM 7
Yonkers HRM 18
Piermont HRM 25
Bear Mt. HRM 46
Cold Spring
HRM 55
Ulster HRM 97
N
Directions: Use one of the colored pencils to plot salinity from Table 1 on the graph labeled “Hudson River Salt Front Location.” 1. Carefully draw a point showing each salinity measurement directly above theriver mile where the measurement was made. 2. Then use a ruler to draw a line from one point to the next. Start at the pointfor the lowest river mile, and work your way up to the highest. 3. Finally, use the table and graph to answer the questions below.
Table 1. Hudson River Salinity: October 6, 2004 Measured as mg/L of chloride; HRM = Hudson River Mile
1. Where (city & HRM) was salinity highest? _____________ HRM___
2. Where was it lowest? _______________ HRM___
3. Look at the graphed line between each pair of locations below.
HRM 7 to HRM 46 HRM 25 to HRM 55 HRM 46 to HRM 97
(a) Between which two locations is the graph steepest? _____________
(b) What is the change in salinity between these two locations? (subtract the lower salinity from the higher) _________
(c) Between which two places is the graph flattest?________________
(d) What is the change in salinity between these two places? (subtract the lower salinity from the higher) _________
4. Between which two towns did salinity fall below 100 mg/L?_____________________ ________________________
5. The salt front is located where salinity equals 100 mg/L. Using yourgraph and the horizontal line at 100 mg/L, estimate (in river miles)the position of the salt front on October 6, 2004. HRM______
6. Challenge: Why does salinity decrease between HRM 7 and HRM 46?
City New York Yonkers Piermont Bear Mt. Cold Spring Ulster Salinity (mg/L Cl-) 1,805 1,162 300 50 47 34
HRM 7 18 25 46 55 97
Finding the Salt Front: Page 3
New York HRM 7
Ulster HRM 97
Cold Spring
HRM 55
Piermont HRM 25
Yonkers HRM 18
Verplanck HRM 41
Pough-keepsie HRM 76
N
Name __________________________________________ Date____________________
Finding the Salt Front - Section 2
Directions: On the same graph sheet used in section 1, use the other colored pencil to plot salinity from Table 2. Follow the same steps as in section 1. Then answer the questions below.
Table 2. Hudson River Salinity: October 12, 2006 Measured as mg/L of chloride; HRM = Hudson River Mile
1. Was salinity at Yonkers in 2006 higher or lower than salinity there in2004? How much higher or lower?
2. Look at the graphed line between each set of locations listed below.
HRM 7 to HRM 55 HRM 41 to HRM 76 HRM 55 to HRM 97
(a) Between which two locations is the graph steepest?___________
(b) What is the difference in salinity between the two locations? (subtract the lower salinity from the higher) __________
(c) Between which two places is the graph flattest? _____________
(d) What is the difference in salinity between the two? (subtract the lower salinity from the higher) _________
3. (a) Where was the salt front on October 12, 2006? HRM_______
(b) Was it north or south of its October 6, 2004 location? _______
(c) By how many miles? __________
4. What might have caused the salt front to be in a different location in2006?
City New York Yonkers Piermont Verplanck Cold Spring Poughkeepsie Ulster Salinity (mg/L Cl-)
7,362 4,041 3,177 830 50 30 64
HRM 7 18 25 41 55 76 97
0
1000
2000
3000
4000
5000
6000
7000
8000
10 20 30 40 50 60 70 80 90 100
Salin
ity (m
g/L
chlo
ride)
Hudson River Salt Front Location
Hudson River Miles
100 mg/L
Hudson River Estuary Program NYS Department of Environmental Conservation
The Hudson’s Ups and Downs
Students will interpret line graphs of Hudson River water levels to learn about tides and tidal cycles in the estuary.
Objectives: Students will read line graphs to: • examine how tides change water levels along Hudson River estuary;• observe that high tides and low tides occur in predictable cycles;• understand that high and low tides occur at different times in
different places along the Hudson estuary;• explore how weather can affect water levels and tides.
Grade level: Elementary (Grade 5-7)
Subject Area: Math, Science
Standards: Mathematics, Science, & Technology Standards 3, 4
Skills: • Use line graphs to analyze patterns observed in the physical
environment.• Use line graphs to compare and contrast data and events.
Duration: Preparation time: 5 minutes Activity time: 50 minutes
Materials: Each student should have: Worksheet: The Hudson’s Ups and Downs Pen or pencil
It would be helpful for the teacher to have: A jump rope or other length of rope
Hudson River Estuary Program NYS Department of Environmental Conservation
Background: The Hudson’s surface is roughly at sea level from New York Harbor to the dam at Troy, and is influenced by ocean tides over that distance. These tides are important to the movement of ships, the plans of kayakers and anglers, the distribution of aquatic plant communities, and many other aspects of economic, recreational, and ecological activity along the river.
This lesson explores the cycle of high and low tides but not their causes, which involve the gravitational attraction between the moon and earth and their relative positions—topics difficult for elementary students to comprehend. That said, a brief and greatly simplified explanation may be useful as background.
Imagine the earth as an idealized ball covered with water at the same depth all around. The moon’s gravitational attraction shapes this idealized ball into an ovoid, an egg-shaped object. One of the oval’s elongated ends is directly under the moon; the other is on the opposite side of the earth. These elongated ends can be thought of as bulges. While both earth’s crust and the oceans bulge, the effect is much greater in the water. These bulges are high tides.
Now put this picture in motion. As the earth spins on its axis, the bulges remain in position under the moon, and are experienced as two daily high tides along the Atlantic coast. In between the bulges, ocean levels are lower, causing low tides. So in the 24 hours it takes the earth to rotate once on its axis, we will usually have two high tides and two low tides. Actually, because the moon revolves around the earth, a complete tidal cycle takes more than 24 hours. Imagine checking your watch when you are directly under the moon and then waiting for the earth to spin full circle. In that time the moon doesn’t stand still. It moves ahead towards the east, so 24 hours plus 50 minutes go by before you are directly under the moon again. Thus the timing of a given tide falls back 50 minutes each day, on average. For example, if low tide on Monday morning is at 9:00, low tide Tuesday morning would be at 9:50.
While the above theoretically explains the forces that produce tides, the response of actual oceans, divided up into basins separated by continents, depends on the shape of the perimeter and sea floor of these basins. The bulges do not literally move across the oceans in two massive waves. An explanation of these tidal dynamics goes beyond the space available here.
Activity: 1. Discuss what tides are, perhaps by having students recount visits to the ocean.2. Relate what the line graphs show to the reality of water levels rising and falling.3. This activity is best done in class with the teacher available to provide assistance.
Assessment: • Have students share answers to questions, or collect and grade sheets.• On a classroom computer or Smartboard, visit a Hudson River remote sensing website and
use current water level data (see below) to have students identify high and low tides.
Hudson River Estuary Program NYS Department of Environmental Conservation
2
Vocabulary: dam: a barrier built across a stream estuary: a body of water in which fresh and salt water meet high tide: highest water level in the tidal cycle low tide: lowest water level in the tidal cycle
sea level: the average height of the ocean tidal cycle: the repetitive rise and fall of the ocean’s surface over a 24-hour period tides: the alternating rise and fall of the surface of the ocean and bodies of water closely linked to it
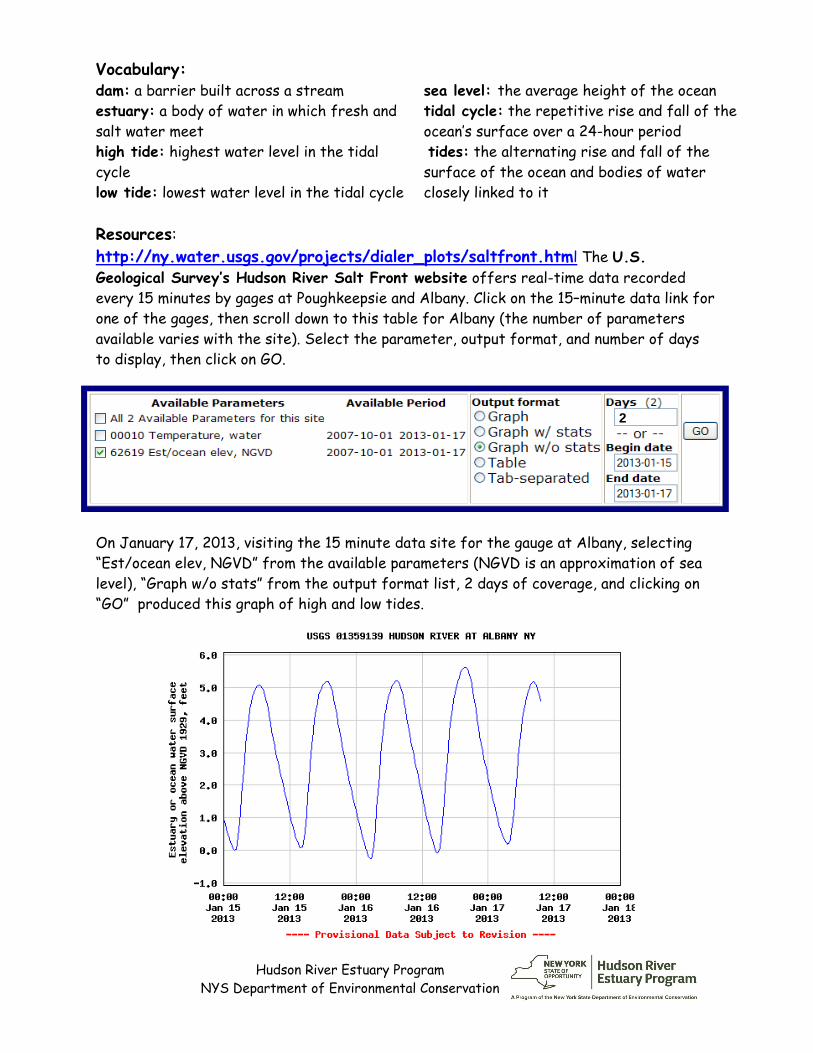
Resources: http://ny.water.usgs.gov/projects/dialer_plots/saltfront.html The U.S. Geological Survey’s Hudson River Salt Front website offers real-time data recorded every 15 minutes by gages at Poughkeepsie and Albany. Click on the 15–minute data link for one of the gages, then scroll down to this table for Albany (the number of parameters available varies with the site). Select the parameter, output format, and number of days to display, then click on GO.
On January 17, 2013, visiting the 15 minute data site for the gauge at Albany, selecting “Est/ocean elev, NGVD” from the available parameters (NGVD is an approximation of sea level), “Graph w/o stats” from the output format list, 2 days of coverage, and clicking on “GO” produced this graph of high and low tides.
Hudson River Estuary Program NYS Department of Environmental Conservation
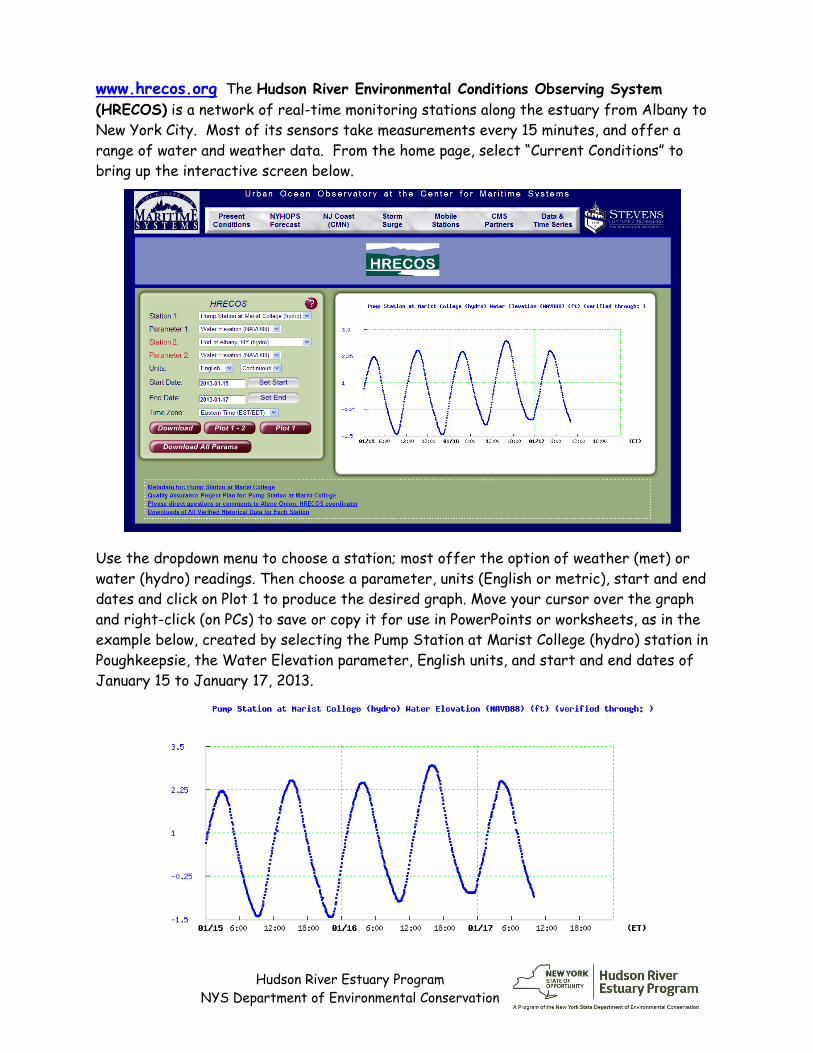
www.hrecos.org The Hudson River Environmental Conditions Observing System (HRECOS) is a network of real-time monitoring stations along the estuary from Albany to New York City. Most of its sensors take measurements every 15 minutes, and offer a range of water and weather data. From the home page, select “Current Conditions” to bring up the interactive screen below.
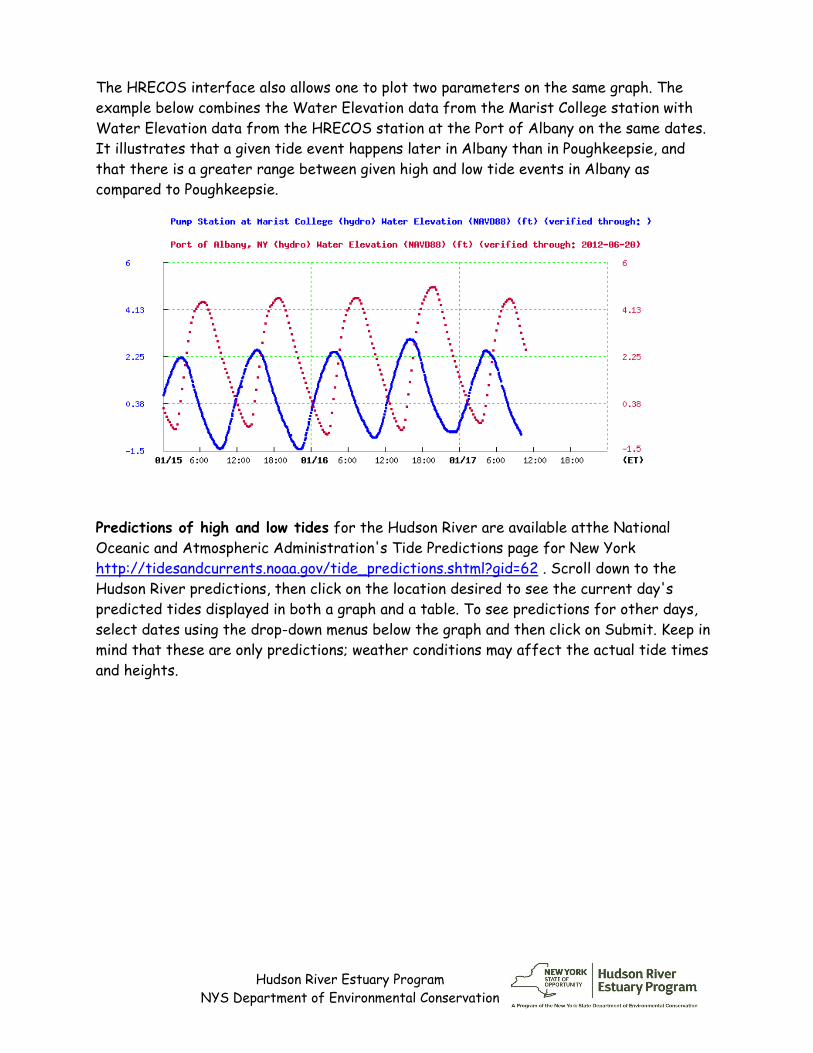
Use the dropdown menu to choose a station; most offer the option of weather (met) or water (hydro) readings. Then choose a parameter, units (English or metric), start and end dates and click on Plot 1 to produce the desired graph. Move your cursor over the graph and right-click (on PCs) to save or copy it for use in PowerPoints or worksheets, as in the example below, created by selecting the Pump Station at Marist College (hydro) station in Poughkeepsie, the Water Elevation parameter, English units, and start and end dates of January 15 to January 17, 2013.
Hudson River Estuary Program NYS Department of Environmental Conservation
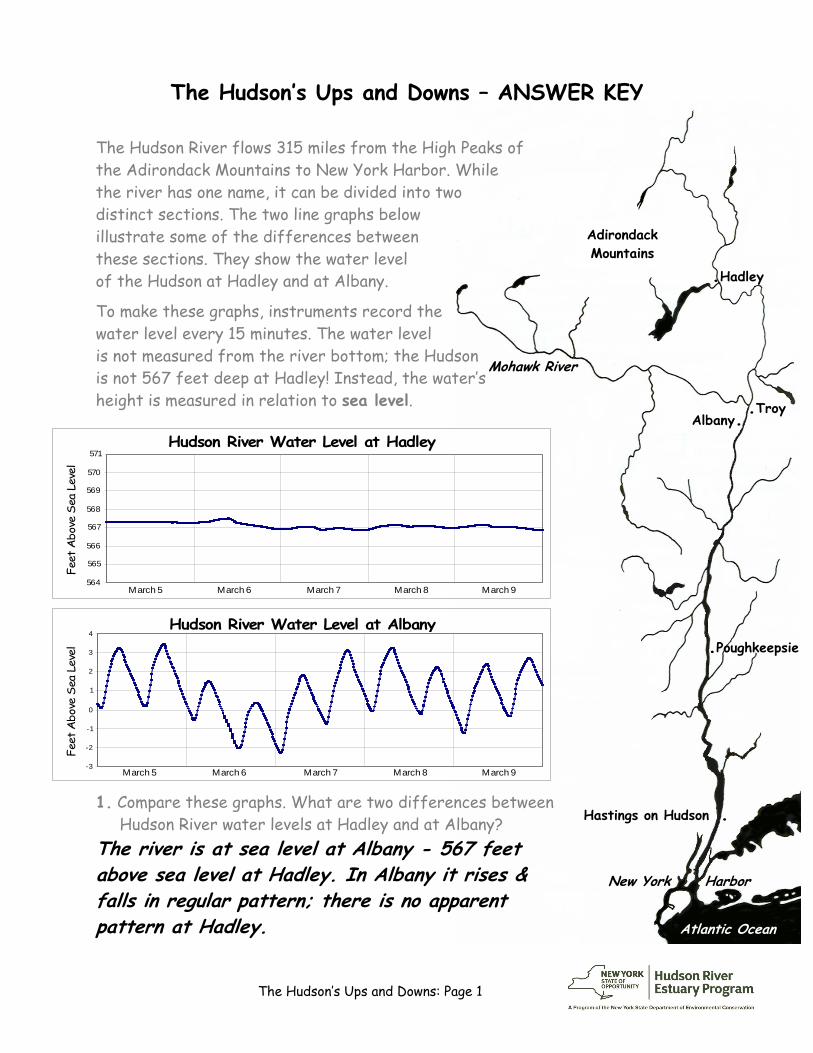
The HRECOS interface also allows one to plot two parameters on the same graph. The example below combines the Water Elevation data from the Marist College station with Water Elevation data from the HRECOS station at the Port of Albany on the same dates. It illustrates that a given tide event happens later in Albany than in Poughkeepsie, and that there is a greater range between given high and low tide events in Albany as compared to Poughkeepsie.
Predictions of high and low tides for the Hudson River are available atthe National Oceanic and Atmospheric Administration's Tide Predictions page for New York http://tidesandcurrents.noaa.gov/tide_predictions.shtml?gid=62 . Scroll down to the Hudson River predictions, then click on the location desired to see the current day's predicted tides displayed in both a graph and a table. To see predictions for other days, select dates using the drop-down menus below the graph and then click on Submit. Keep in mind that these are only predictions; weather conditions may affect the actual tide times and heights.
The Hudson’s Ups and Downs: Page 1
Mohawk River
Atlantic Ocean
New York Harbor
.Hadley
.Troy
.Poughkeepsie
Albany.
Hastings on Hudson .
The Hudson’s Ups and Downs – ANSWER KEY
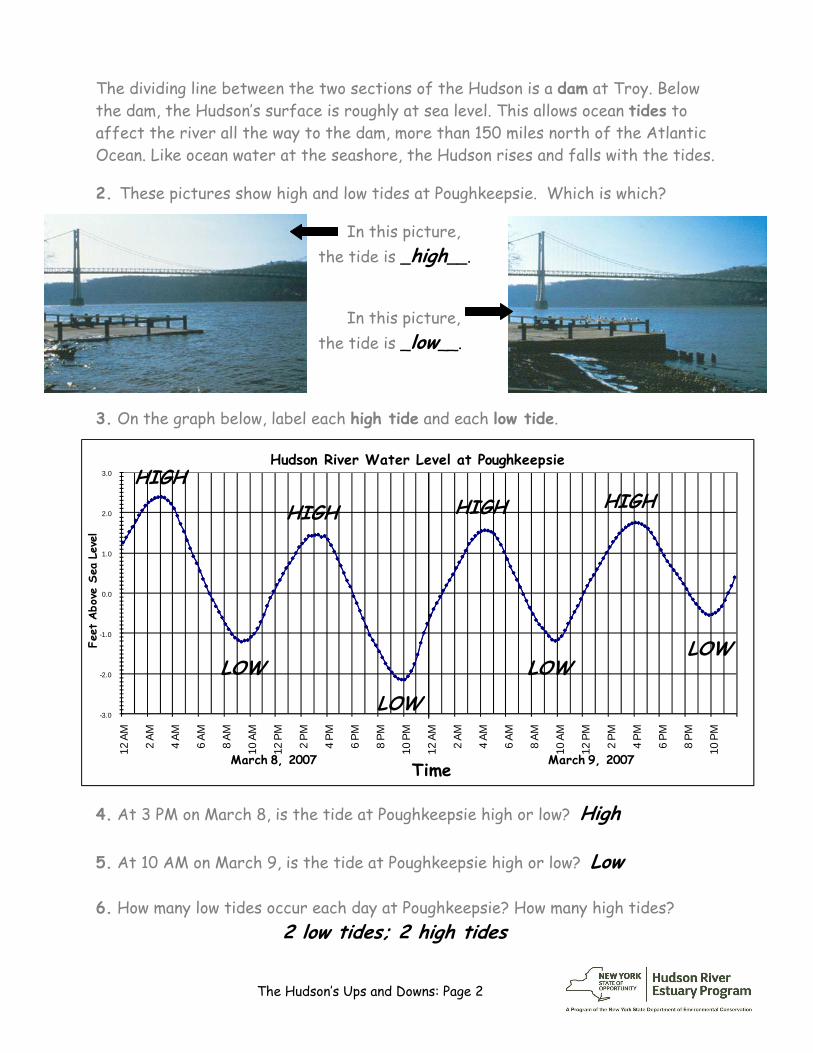
The Hudson River flows 315 miles from the High Peaks of the Adirondack Mountains to New York Harbor. While the river has one name, it can be divided into two distinct sections. The two line graphs below illustrate some of the differences between these sections. They show the water level of the Hudson at Hadley and at Albany.
To make these graphs, instruments record the water level every 15 minutes. The water level is not measured from the river bottom; the Hudson is not 567 feet deep at Hadley! Instead, the water’s height is measured in relation to sea level.
1. Compare these graphs. What are two differences betweenHudson River water levels at Hadley and at Albany?
The river is at sea level at Albany - 567 feet above sea level at Hadley. In Albany it rises & falls in regular pattern; there is no apparent pattern at Hadley.
Adirondack Mountains
-3
-2
-1
0
1
2
3
4
Feet
Abo
ve S
ea L
evel
Hudson River Water Level at Albany
March 6 March 7 March 8 March 9March 5
564
565
566
567
568
569
570
571
Feet
Abo
ve S
ea L
evel
Hudson River Water Level at Hadley
March 6 March 7 March 8 March 9March 5
The Hudson’s Ups and Downs: Page 2
The dividing line between the two sections of the Hudson is a dam at Troy. Below the dam, the Hudson’s surface is roughly at sea level. This allows ocean tides to affect the river all the way to the dam, more than 150 miles north of the Atlantic Ocean. Like ocean water at the seashore, the Hudson rises and falls with the tides.
2. These pictures show high and low tides at Poughkeepsie. Which is which?
In this picture, the tide is _high__.
In this picture, the tide is _low__.
3. On the graph below, label each high tide and each low tide.
4. At 3 PM on March 8, is the tide at Poughkeepsie high or low? High
5. At 10 AM on March 9, is the tide at Poughkeepsie high or low? Low
6. How many low tides occur each day at Poughkeepsie? How many high tides?2 low tides; 2 high tides
-3.0
-2.0
-1.0
0.0
1.0
2.0
3.0
12 A
M
2 AM
4 AM
6 AM
8 AM
10 A
M
12 P
M
2 PM
4 PM
6 PM
8 PM
10 P
M
12 A
M
2 AM
4 AM
6 AM
8 AM
10 A
M
12 P
M
2 PM
4 PM
6 PM
8 PM
10 P
M
March 9, 2007 March 8, 2007
Feet
Abo
ve S
ea L
evel
Time
Hudson River Water Level at Poughkeepsie HIGH
HIGH HIGH HIGH
LOW
LOW
LOW LOW
The Hudson’s Ups and Downs: Page 3
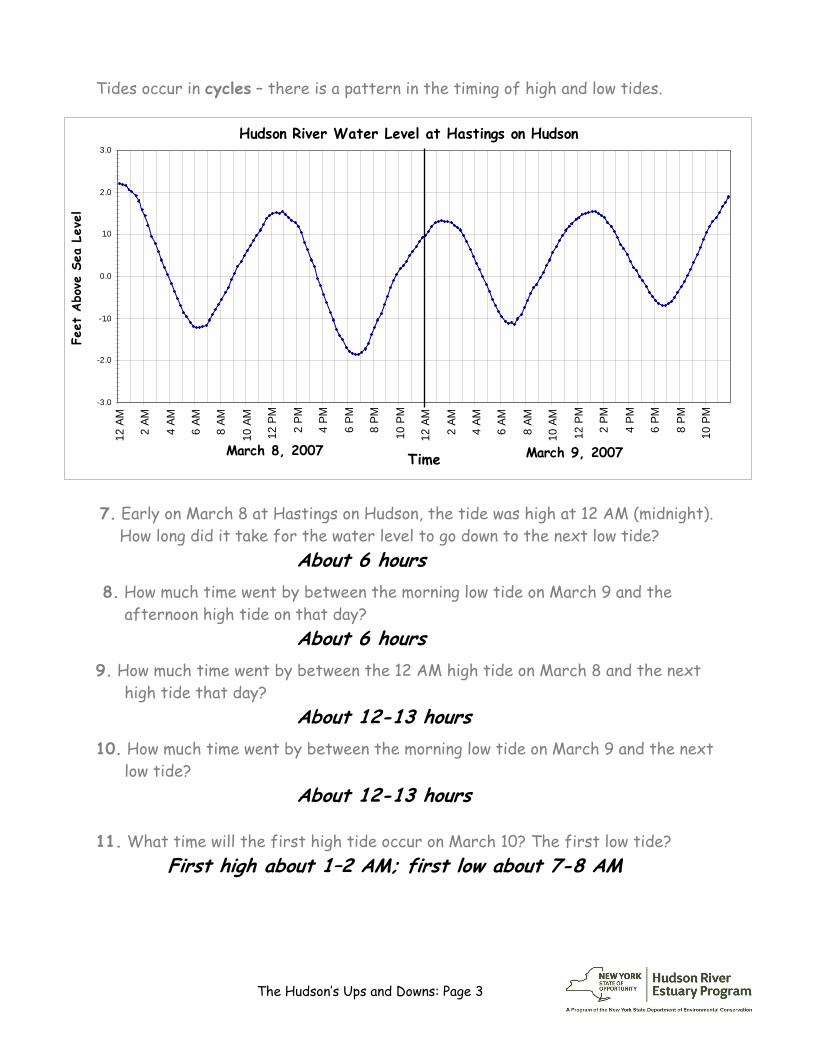
Tides occur in cycles – there is a pattern in the timing of high and low tides.
7. Early on March 8 at Hastings on Hudson, the tide was high at 12 AM (midnight).How long did it take for the water level to go down to the next low tide?
About 6 hours 8. How much time went by between the morning low tide on March 9 and the
afternoon high tide on that day?About 6 hours
9. How much time went by between the 12 AM high tide on March 8 and the next high tide that day?
About 12-13 hours 10. How much time went by between the morning low tide on March 9 and the next
low tide?About 12-13 hours
11. What time will the first high tide occur on March 10? The first low tide? First high about 1–2 AM; first low about 7-8 AM
-3.0
-2.0
-1.0
0.0
1.0
2.0
3.0
12 A
M
2 AM
4 AM
6 AM
8 AM
10 A
M
12 P
M
2 PM
4 PM
6 PM
8 PM
10 P
M
12 A
M
2 AM
4 AM
6 AM
8 AM
10 A
M
12 P
M
2 PM
4 PM
6 PM
8 PM
10 P
M
TimeMarch 8, 2007 March 9, 2007
Feet
Abo
ve S
ea L
evel
Hudson River Water Level at Hastings on Hudson
The Hudson’s Ups and Downs: Page 4
Albany.Albany.
Albany
Pough keepsie
Catskill
Hastings on Hudson
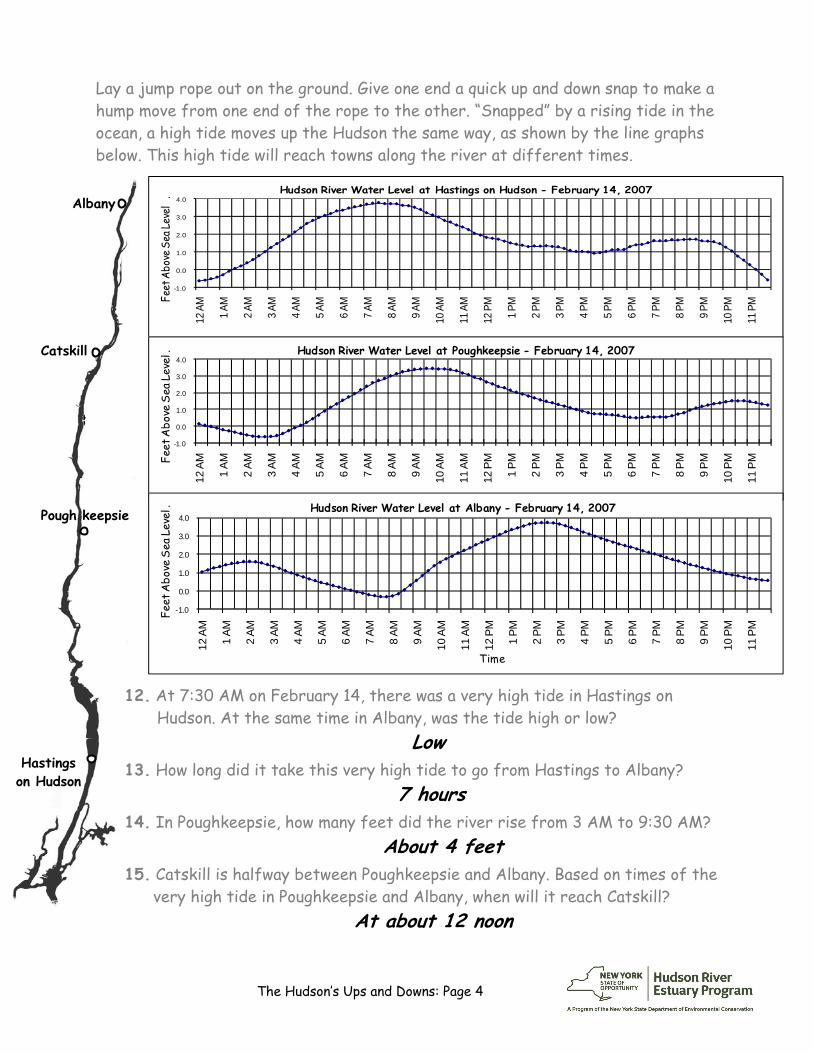
Lay a jump rope out on the ground. Give one end a quick up and down snap to make a hump move from one end of the rope to the other. “Snapped” by a rising tide in the ocean, a high tide moves up the Hudson the same way, as shown by the line graphs below. This high tide will reach towns along the river at different times.
12. At 7:30 AM on February 14, there was a very high tide in Hastings onHudson. At the same time in Albany, was the tide high or low?
Low 13. How long did it take this very high tide to go from Hastings to Albany?
7 hours 14. In Poughkeepsie, how many feet did the river rise from 3 AM to 9:30 AM?
About 4 feet 15. Catskill is halfway between Poughkeepsie and Albany. Based on times of the
very high tide in Poughkeepsie and Albany, when will it reach Catskill?At about 12 noon
-1.0
0.0
1.0
2.0
3.0
4.012
AM
1 AM
2 AM
3 AM
4 AM
5 AM
6 AM
7 AM
8 AM
9 AM
10 A
M
11 A
M
12 P
M
1 PM
2 PM
3 PM
4 PM
5 PM
6 PM
7 PM
8 PM
9 PM
10 P
M
11 P
MFeet
Abo
ve S
ea Le
vel
. Hudson River Water Level at Hastings on Hudson - February 14, 2007
-1.0
0.0
1.0
2.0
3.0
4.0
12 A
M
1 AM
2 AM
3 AM
4 AM
5 AM
6 AM
7 AM
8 AM
9 AM
10 A
M
11 A
M
12 P
M
1 PM
2 PM
3 PM
4 PM
5 PM
6 PM
7 PM
8 PM
9 PM
10 P
M
11 P
MFeet
Abo
ve S
ea L
evel
. Hudson River Water Level at Poughkeepsie - February 14, 2007
-1.0
0.0
1.0
2.0
3.0
4.0
12 A
M
1 AM
2 AM
3 AM
4 AM
5 AM
6 AM
7 AM
8 AM
9 AM
10 A
M
11 A
M
12 P
M
1 PM
2 PM
3 PM
4 PM
5 PM
6 PM
7 PM
8 PM
9 PM
10 P
M
11 P
M
Feet
Abo
ve S
ea L
evel
.
Time
Hudson River Water Level at Albany - February 14, 2007
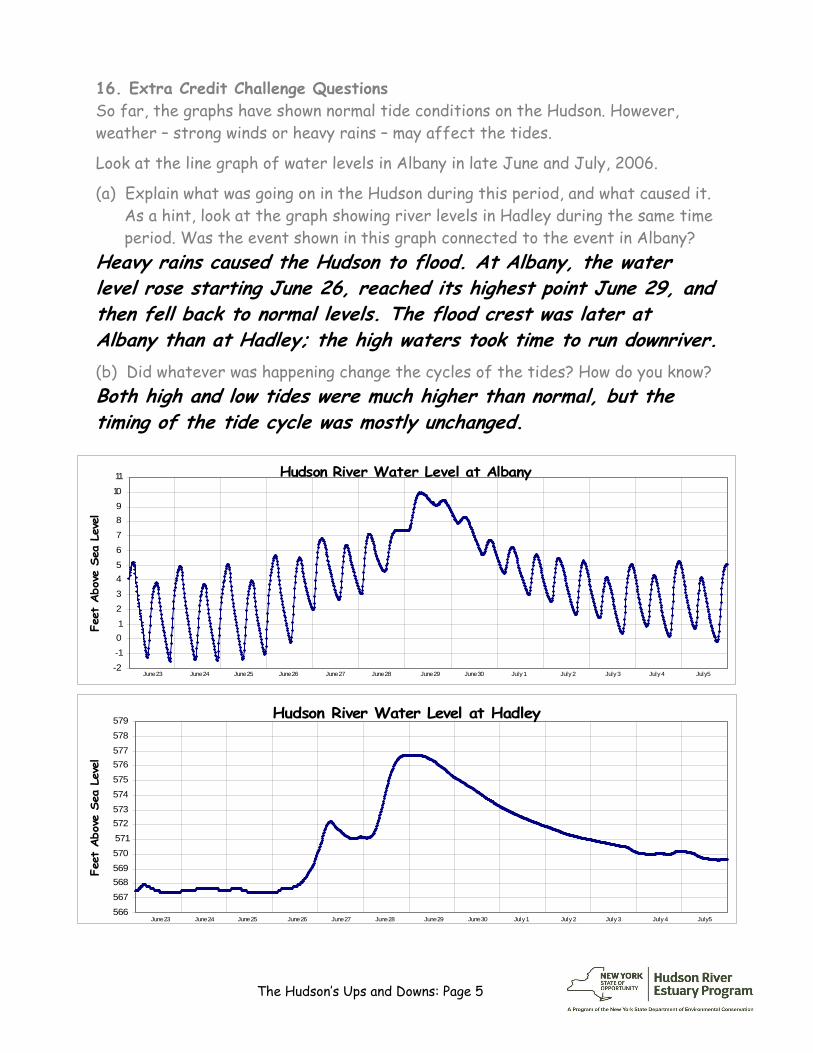
The Hudson’s Ups and Downs: Page 5
16. Extra Credit Challenge QuestionsSo far, the graphs have shown normal tide conditions on the Hudson. However, weather – strong winds or heavy rains – may affect the tides.
Look at the line graph of water levels in Albany in late June and July, 2006.
(a) Explain what was going on in the Hudson during this period, and what caused it. As a hint, look at the graph showing river levels in Hadley during the same time period. Was the event shown in this graph connected to the event in Albany?
Heavy rains caused the Hudson to flood. At Albany, the water level rose starting June 26, reached its highest point June 29, and then fell back to normal levels. The flood crest was later at Albany than at Hadley; the high waters took time to run downriver. (b) Did whatever was happening change the cycles of the tides? How do you know? Both high and low tides were much higher than normal, but the timing of the tide cycle was mostly unchanged.
Hudson River Water Level at Hadley
566567
568569570571
572573574575
576577
578579
Feet
Abo
ve S
ea L
evel
June 24 June 25 June 26 June 27 June 28 June 29 June 30 July 1 July 4July 3July 2 July5June 23
Hudson River Water Level at Albany
-2-101
23
4567
89
10
11
Feet
Abo
ve S
ea L
evel
June 24 June 25 June 26 June 27 June 28 June 29 June 30 July 1 July 4July 3July 2 July5June 23
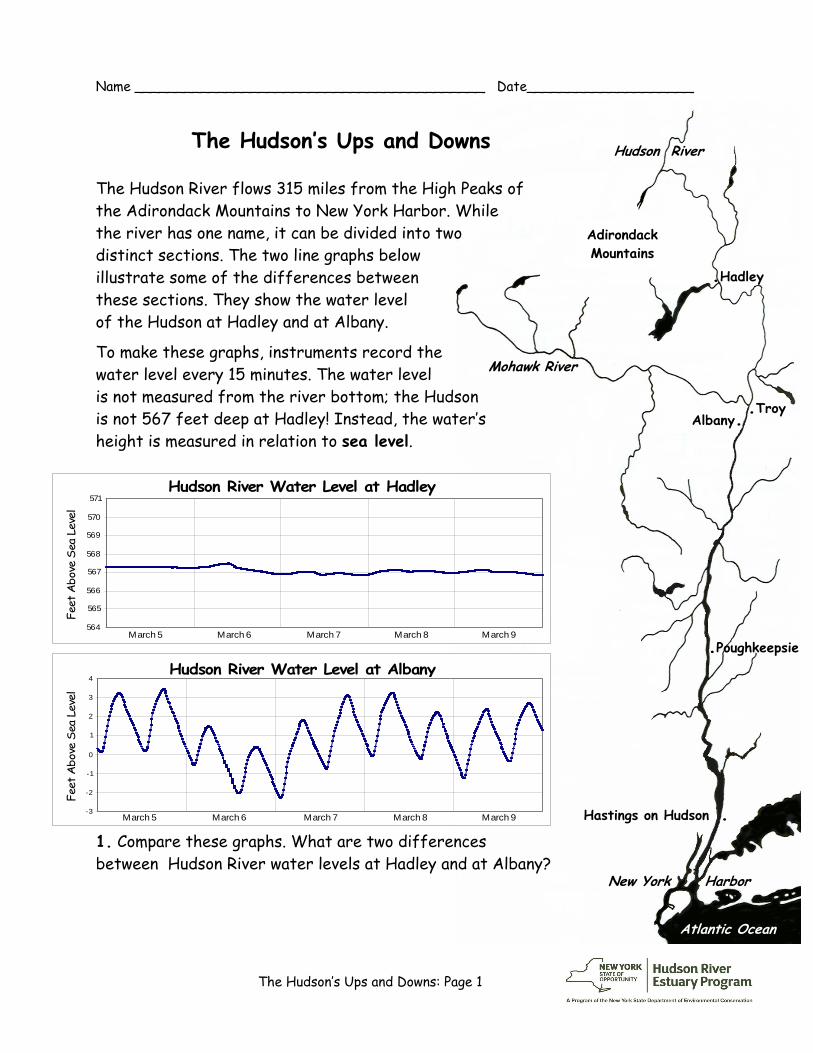
The Hudson’s Ups and Downs: Page 1
Mohawk River
Hudson River
Atlantic Ocean
New York Harbor
.Hadley
.Troy
.Poughkeepsie
Albany.
Hastings on Hudson .
Name __________________________________________ Date____________________
The Hudson’s Ups and Downs
The Hudson River flows 315 miles from the High Peaks of the Adirondack Mountains to New York Harbor. While the river has one name, it can be divided into two distinct sections. The two line graphs below illustrate some of the differences between these sections. They show the water level of the Hudson at Hadley and at Albany.
To make these graphs, instruments record the water level every 15 minutes. The water level is not measured from the river bottom; the Hudson is not 567 feet deep at Hadley! Instead, the water’s height is measured in relation to sea level.
1. Compare these graphs. What are two differencesbetween Hudson River water levels at Hadley and at Albany?
Adirondack Mountains
-3
-2
-1
0
1
2
3
4
Feet
Abo
ve S
ea L
evel
Hudson River Water Level at Albany
March 6 March 7 March 8 March 9March 5
564
565
566
567
568
569
570
571
Feet
Abo
ve S
ea L
evel
Hudson River Water Level at Hadley
March 6 March 7 March 8 March 9March 5

The Hudson’s Ups and Downs: Page 2
The dividing line between the two sections of the Hudson is a dam at Troy. Below the dam, the Hudson’s surface is roughly at sea level. This allows ocean tides to affect the river all the way to the dam, more than 150 miles north of the Atlantic Ocean. Like ocean water at the seashore, the Hudson rises and falls with the tides.
2. These pictures show high and low tides at Poughkeepsie. Which is which?
In this picture, the tide is ________.
In this picture, the tide is ________.
3. On the graph below, label each high tide and each low tide.
4. At 3 PM on March 8, is the tide at Poughkeepsie high or low?
5. At 10 AM on March 9, is the tide at Poughkeepsie high or low?
6. How many low tides occur each day at Poughkeepsie? How many high tides?
-3.0
-2.0
-1.0
0.0
1.0
2.0
3.0
12 A
M
2 AM
4 AM
6 AM
8 AM
10 A
M
12 P
M
2 PM
4 PM
6 PM
8 PM
10 P
M
12 A
M
2 AM
4 AM
6 AM
8 AM
10 A
M
12 P
M
2 PM
4 PM
6 PM
8 PM
10 P
M
March 9, 2007 March 8, 2007
Feet
Abo
ve S
ea L
evel
Time
Hudson River Water Level at Poughkeepsie
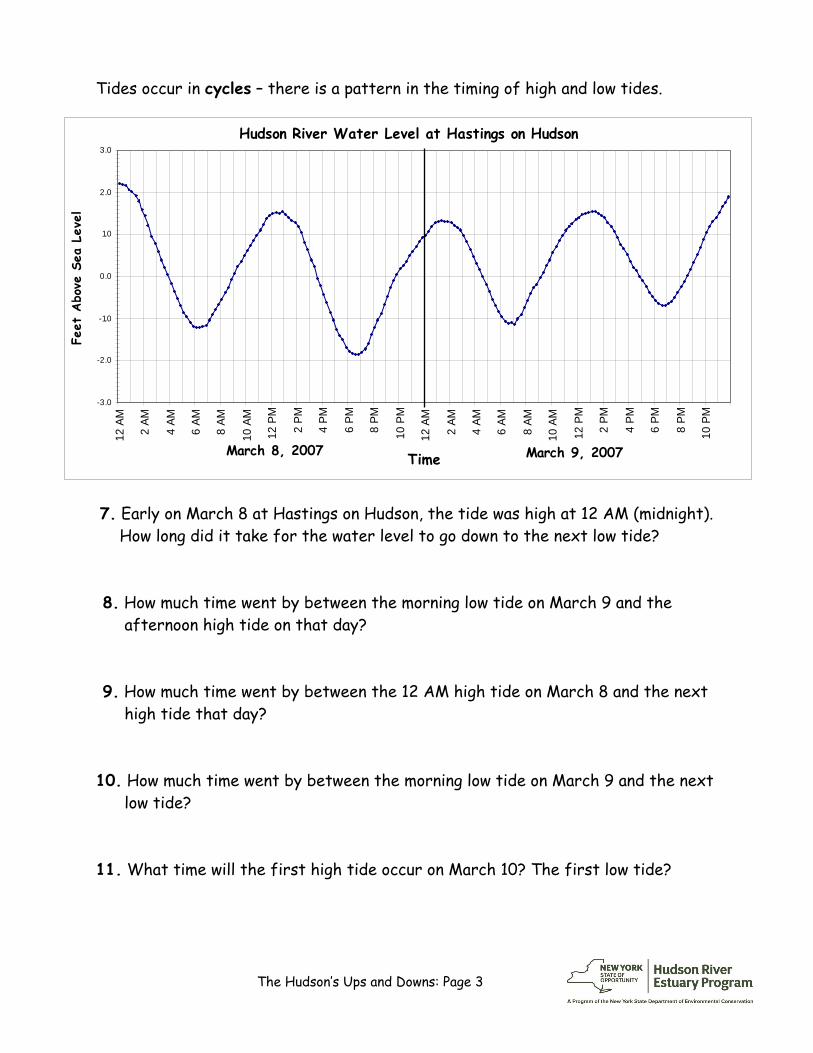
The Hudson’s Ups and Downs: Page 3
Tides occur in cycles – there is a pattern in the timing of high and low tides.
7. Early on March 8 at Hastings on Hudson, the tide was high at 12 AM (midnight).How long did it take for the water level to go down to the next low tide?
8. How much time went by between the morning low tide on March 9 and theafternoon high tide on that day?
9. How much time went by between the 12 AM high tide on March 8 and the nexthigh tide that day?
10. How much time went by between the morning low tide on March 9 and the nextlow tide?
11. What time will the first high tide occur on March 10? The first low tide?
-3.0
-2.0
-1.0
0.0
1.0
2.0
3.0
12 A
M
2 AM
4 AM
6 AM
8 AM
10 A
M
12 P
M
2 PM
4 PM
6 PM
8 PM
10 P
M
12 A
M
2 AM
4 AM
6 AM
8 AM
10 A
M
12 P
M
2 PM
4 PM
6 PM
8 PM
10 P
M
TimeMarch 8, 2007 March 9, 2007
Feet
Abo
ve S
ea L
evel
Hudson River Water Level at Hastings on Hudson
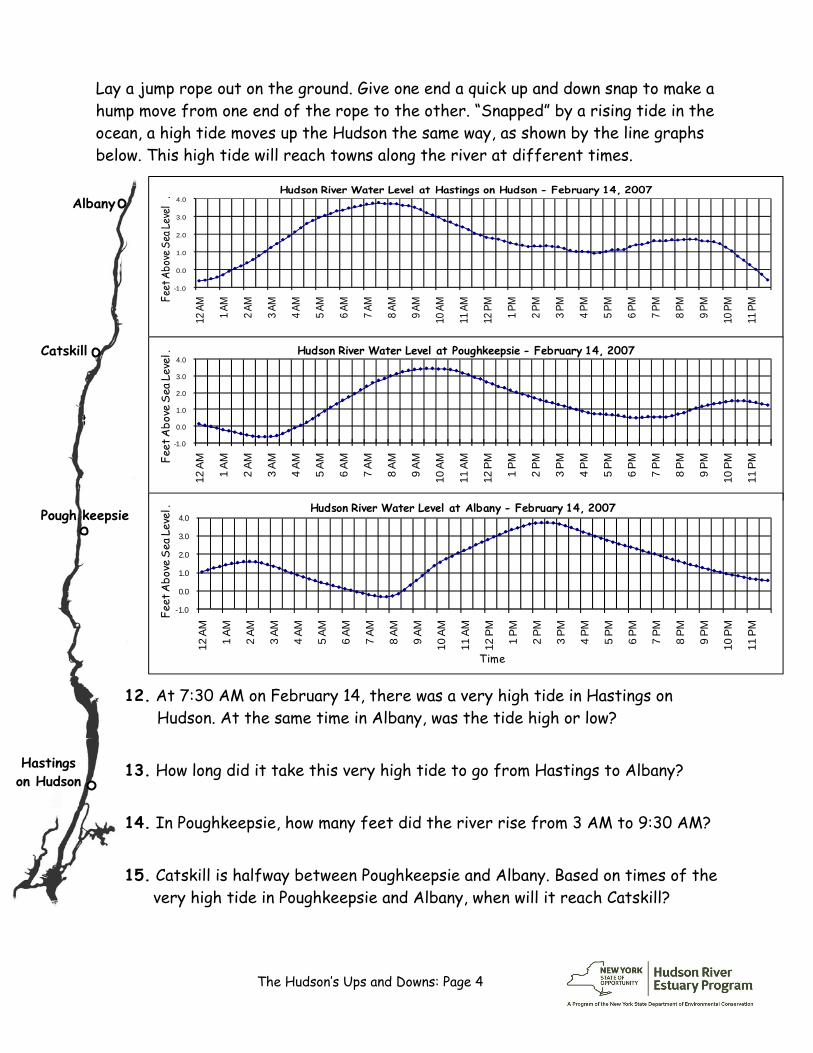
The Hudson’s Ups and Downs: Page 4
Albany.Albany.
Albany
Pough keepsie
Catskill
Hastings on Hudson
Lay a jump rope out on the ground. Give one end a quick up and down snap to make a hump move from one end of the rope to the other. “Snapped” by a rising tide in the ocean, a high tide moves up the Hudson the same way, as shown by the line graphs below. This high tide will reach towns along the river at different times.
12. At 7:30 AM on February 14, there was a very high tide in Hastings onHudson. At the same time in Albany, was the tide high or low?
13. How long did it take this very high tide to go from Hastings to Albany?
14. In Poughkeepsie, how many feet did the river rise from 3 AM to 9:30 AM?
15. Catskill is halfway between Poughkeepsie and Albany. Based on times of thevery high tide in Poughkeepsie and Albany, when will it reach Catskill?
-1.0
0.0
1.0
2.0
3.0
4.012
AM
1 AM
2 AM
3 AM
4 AM
5 AM
6 AM
7 AM
8 AM
9 AM
10 A
M
11 A
M
12 P
M
1 PM
2 PM
3 PM
4 PM
5 PM
6 PM
7 PM
8 PM
9 PM
10 P
M
11 P
MFeet
Abo
ve S
ea Le
vel
. Hudson River Water Level at Hastings on Hudson - February 14, 2007
-1.0
0.0
1.0
2.0
3.0
4.0
12 A
M
1 AM
2 AM
3 AM
4 AM
5 AM
6 AM
7 AM
8 AM
9 AM
10 A
M
11 A
M
12 P
M
1 PM
2 PM
3 PM
4 PM
5 PM
6 PM
7 PM
8 PM
9 PM
10 P
M
11 P
MFeet
Abo
ve S
ea L
evel
. Hudson River Water Level at Poughkeepsie - February 14, 2007
-1.0
0.0
1.0
2.0
3.0
4.0
12 A
M
1 AM
2 AM
3 AM
4 AM
5 AM
6 AM
7 AM
8 AM
9 AM
10 A
M
11 A
M
12 P
M
1 PM
2 PM
3 PM
4 PM
5 PM
6 PM
7 PM
8 PM
9 PM
10 P
M
11 P
M
Feet
Abo
ve S
ea L
evel
.
Time
Hudson River Water Level at Albany - February 14, 2007
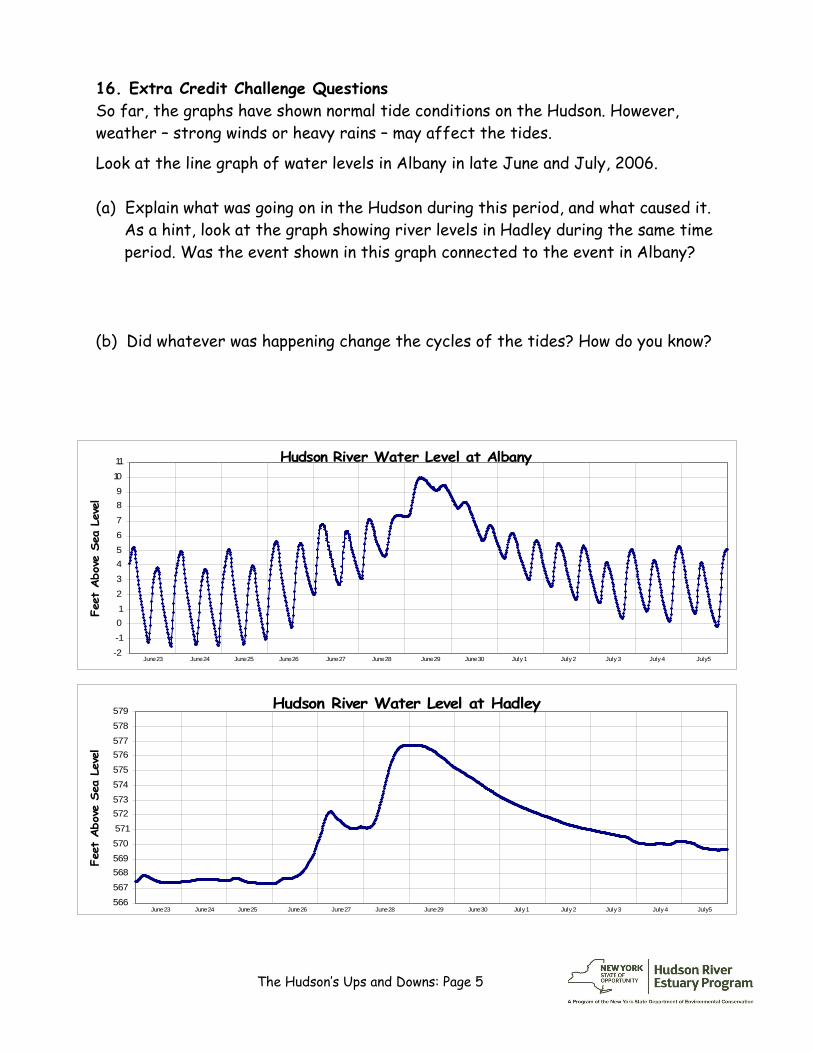
The Hudson’s Ups and Downs: Page 5
16. Extra Credit Challenge QuestionsSo far, the graphs have shown normal tide conditions on the Hudson. However, weather – strong winds or heavy rains – may affect the tides.
Look at the line graph of water levels in Albany in late June and July, 2006.
(a) Explain what was going on in the Hudson during this period, and what caused it. As a hint, look at the graph showing river levels in Hadley during the same time period. Was the event shown in this graph connected to the event in Albany?
(b) Did whatever was happening change the cycles of the tides? How do you know?
Hudson River Water Level at Albany
-2-101
23
4567
89
10
11
Feet
Abo
ve S
ea L
evel
June 24 June 25 June 26 June 27 June 28 June 29 June 30 July 1 July 4July 3July 2 July5June 23
Hudson River Water Level at Hadley
566567
568569570571
572573574575
576577
578579
Feet
Abo
ve S
ea L
evel
June 24 June 25 June 26 June 27 June 28 June 29 June 30 July 1 July 4July 3July 2 July5June 23

This page intentionally left blank.
Hudson River Estuary Program NYS Department of Environmental Conservation
Mapping Where Animals Live
Students will study the New York State Amphibian and Reptile Atlas to learn how maps can display information on the distribution of animals.
Objectives: Students will understand: • how maps serve as representations of a geographic region;• how maps can show where animals live in a certain region;• how the distribution of animals varies geographically based on
habitat requirements.
Grade level: Elementary (Grades 4-6)
Subject Area: Science, Social Studies
Standards: Social Studies Standard 3 Mathematics, Science, & Technology Standard 4
Skills: • Interpret data presented geographically on a map.• Observe, identify, and communicate patterns in data.• Analyze document-based information presented in scientific figures.
Duration: Preparation time: 10 minutes Activity time: 40 minutes
Materials: Each student should have: Worksheet: Mapping Where Animals Live Relief Map of New York State with county boundaries Pencil or pen
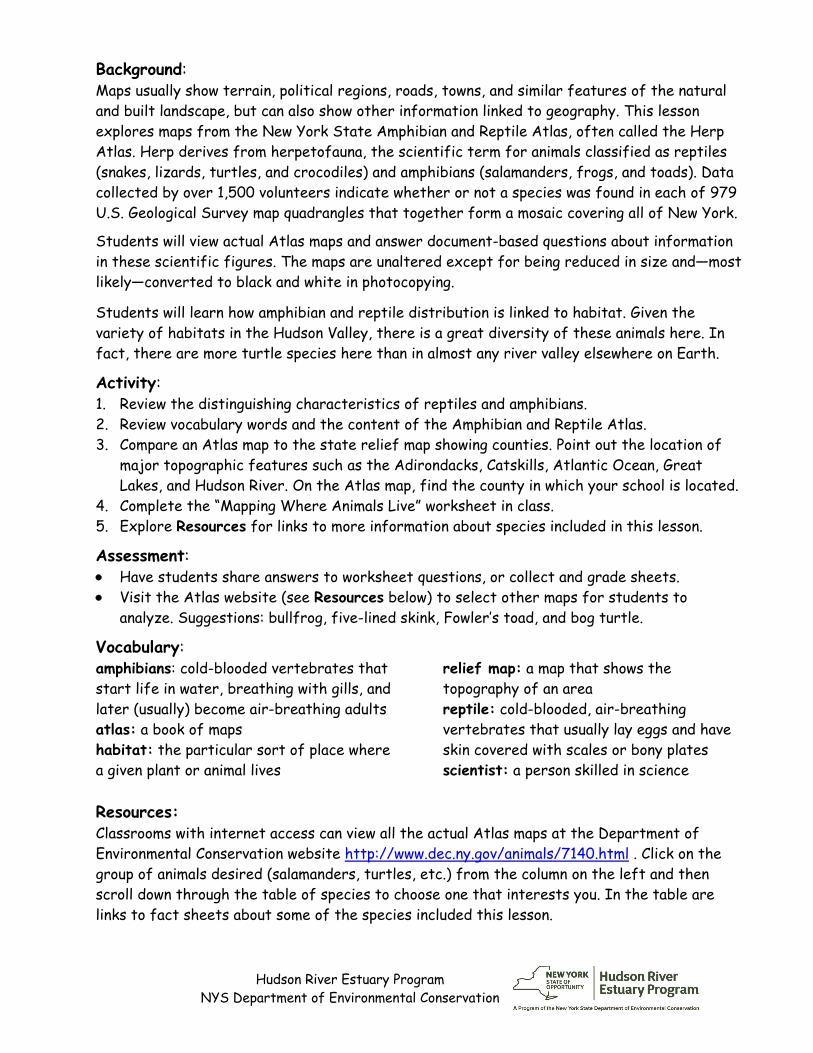
Hudson River Estuary Program NYS Department of Environmental Conservation
Background: Maps usually show terrain, political regions, roads, towns, and similar features of the natural and built landscape, but can also show other information linked to geography. This lesson explores maps from the New York State Amphibian and Reptile Atlas, often called the Herp Atlas. Herp derives from herpetofauna, the scientific term for animals classified as reptiles (snakes, lizards, turtles, and crocodiles) and amphibians (salamanders, frogs, and toads). Data collected by over 1,500 volunteers indicate whether or not a species was found in each of 979 U.S. Geological Survey map quadrangles that together form a mosaic covering all of New York.
Students will view actual Atlas maps and answer document-based questions about information in these scientific figures. The maps are unaltered except for being reduced in size and—most likely—converted to black and white in photocopying.
Students will learn how amphibian and reptile distribution is linked to habitat. Given the variety of habitats in the Hudson Valley, there is a great diversity of these animals here. In fact, there are more turtle species here than in almost any river valley elsewhere on Earth.
Activity: 1. Review the distinguishing characteristics of reptiles and amphibians.2. Review vocabulary words and the content of the Amphibian and Reptile Atlas.3. Compare an Atlas map to the state relief map showing counties. Point out the location of
major topographic features such as the Adirondacks, Catskills, Atlantic Ocean, GreatLakes, and Hudson River. On the Atlas map, find the county in which your school is located.
4. Complete the “Mapping Where Animals Live” worksheet in class.5. Explore Resources for links to more information about species included in this lesson.
Assessment: • Have students share answers to worksheet questions, or collect and grade sheets.• Visit the Atlas website (see Resources below) to select other maps for students to
analyze. Suggestions: bullfrog, five-lined skink, Fowler’s toad, and bog turtle.
Vocabulary: amphibians: cold-blooded vertebrates that start life in water, breathing with gills, and later (usually) become air-breathing adults atlas: a book of maps habitat: the particular sort of place where a given plant or animal lives
relief map: a map that shows the topography of an area reptile: cold-blooded, air-breathing vertebrates that usually lay eggs and have skin covered with scales or bony plates scientist: a person skilled in science
Resources: Classrooms with internet access can view all the actual Atlas maps at the Department of Environmental Conservation website http://www.dec.ny.gov/animals/7140.html . Click on the group of animals desired (salamanders, turtles, etc.) from the column on the left and then scroll down through the table of species to choose one that interests you. In the table are links to fact sheets about some of the species included this lesson.

Mapping Where Animals Live: Page 1
U.S. Geological Survey
Mapping Where Animals Live: ANSWER KEY
Mapping Where Animals Live
New York State is home to many kinds of amphibians (salamanders, frogs, and toads) and reptiles (snakes, turtles, and lizards). This is because New York has many types of habitats. Each has different kinds of amphibians and reptiles.
Scientists and volunteers go on field trips to search for reptiles and amphibians. They use maps to show where they find each kind. A book that collects many maps together is called an atlas. So the collection of maps showing where these animals live is called the Amphibian and Reptile Atlas.
Maps in the Atlas show New York’s counties. The tiny squares are sections of the maps in which reptiles or amphibians were found. The maps below show where northern leopard frogs and southern leopard frogs were found.
The southern leopard frog map shows that this frog lives – surprise! – mostly in the southeastern part of New York. The northern leopard frog map shows that this frog is not common in southeastern New York. However, it is found over much of the rest of the state.
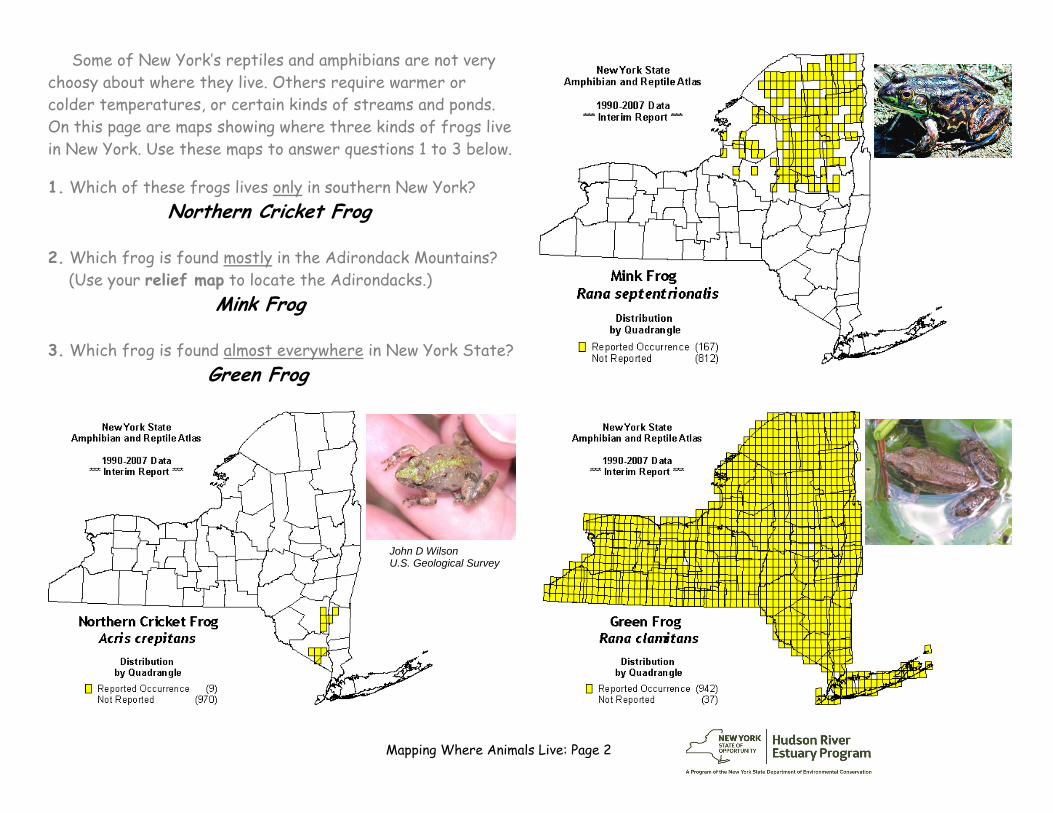
Mapping Where Animals Live: Page 2
John D Wilson U.S. Geological Survey
Some of New York’s reptiles and amphibians are not very choosy about where they live. Others require warmer or colder temperatures, or certain kinds of streams and ponds. On this page are maps showing where three kinds of frogs live in New York. Use these maps to answer questions 1 to 3 below.
1. Which of these frogs lives only in southern New York?Northern Cricket Frog
2. Which frog is found mostly in the Adirondack Mountains?(Use your relief map to locate the Adirondacks.)
Mink Frog
3. Which frog is found almost everywhere in New York State? Green Frog
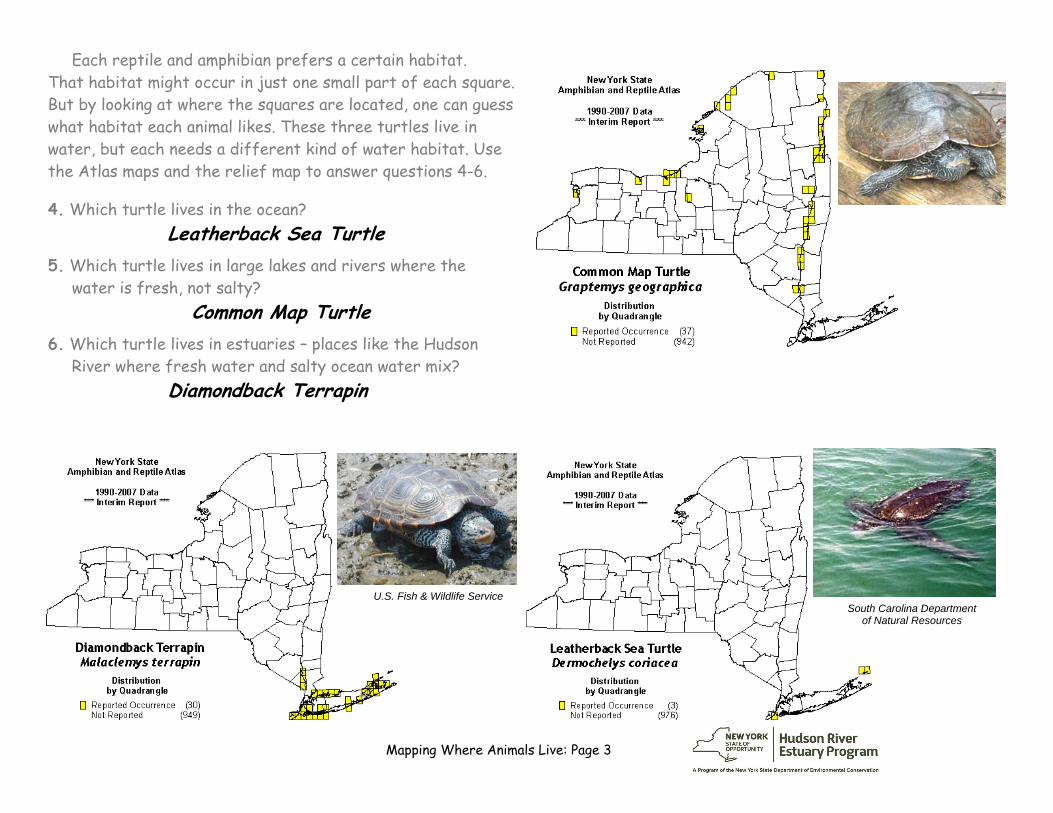
Mapping Where Animals Live: Page 3
U.S. Fish & Wildlife Service South Carolina Department
of Natural Resources
Each reptile and amphibian prefers a certain habitat. That habitat might occur in just one small part of each square. But by looking at where the squares are located, one can guess what habitat each animal likes. These three turtles live in water, but each needs a different kind of water habitat. Use the Atlas maps and the relief map to answer questions 4-6.
4. Which turtle lives in the ocean?Leatherback Sea Turtle
5. Which turtle lives in large lakes and rivers where thewater is fresh, not salty?
Common Map Turtle 6. Which turtle lives in estuaries – places like the Hudson
River where fresh water and salty ocean water mix?Diamondback Terrapin
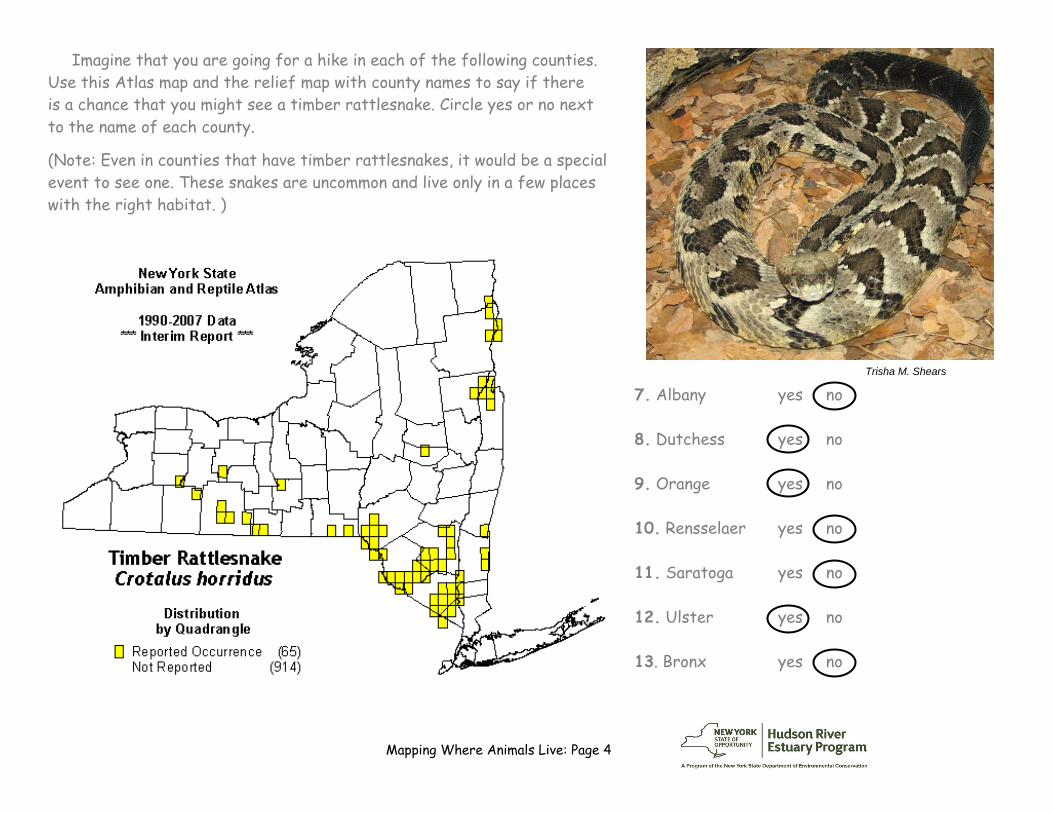
Mapping Where Animals Live: Page 4
Trisha M. Shears
Imagine that you are going for a hike in each of the following counties. Use this Atlas map and the relief map with county names to say if there is a chance that you might see a timber rattlesnake. Circle yes or no next to the name of each county.
(Note: Even in counties that have timber rattlesnakes, it would be a special event to see one. These snakes are uncommon and live only in a few places with the right habitat. )
7. Albany yes no
8. Dutchess yes no
9. Orange yes no
10. Rensselaer yes no
11. Saratoga yes no
12. Ulster yes no
13. Bronx yes no
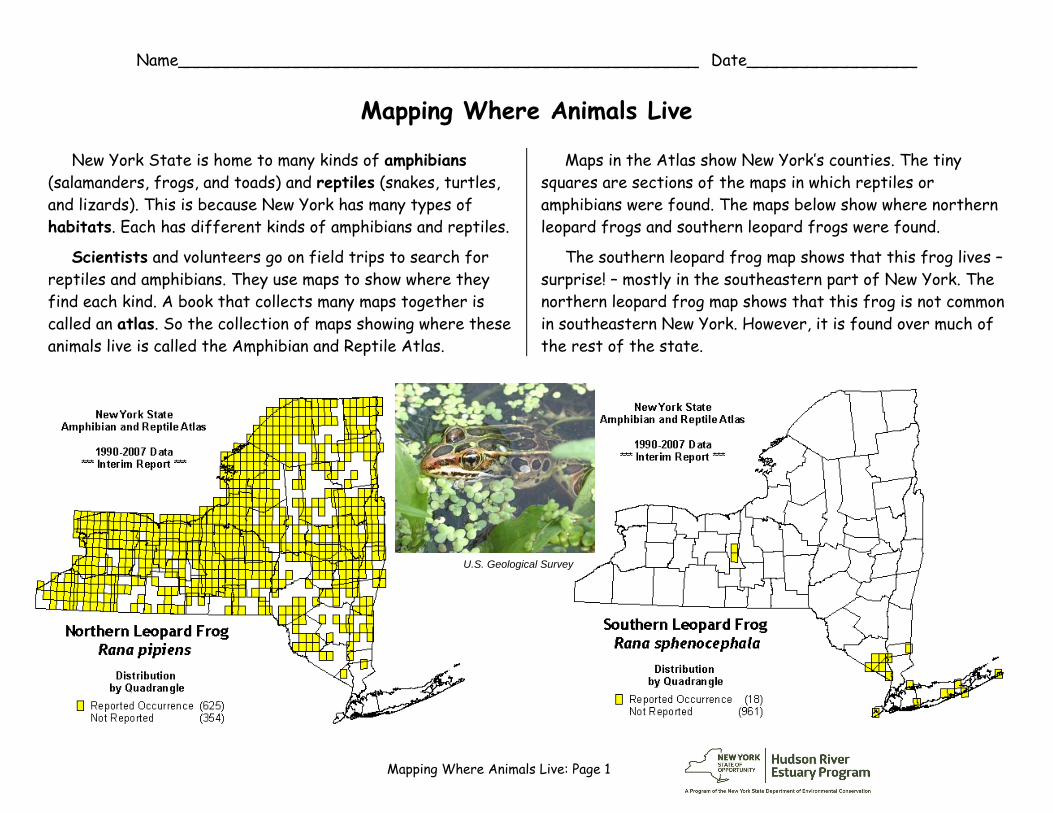
Mapping Where Animals Live: Page 1
U.S. Geological Survey
Name____________________________________________________ Date_________________
Mapping Where Animals Live
New York State is home to many kinds of amphibians (salamanders, frogs, and toads) and reptiles (snakes, turtles, and lizards). This is because New York has many types of habitats. Each has different kinds of amphibians and reptiles.
Scientists and volunteers go on field trips to search for reptiles and amphibians. They use maps to show where they find each kind. A book that collects many maps together is called an atlas. So the collection of maps showing where these animals live is called the Amphibian and Reptile Atlas.
Maps in the Atlas show New York’s counties. The tiny squares are sections of the maps in which reptiles or amphibians were found. The maps below show where northern leopard frogs and southern leopard frogs were found.
The southern leopard frog map shows that this frog lives – surprise! – mostly in the southeastern part of New York. The northern leopard frog map shows that this frog is not common in southeastern New York. However, it is found over much of the rest of the state.
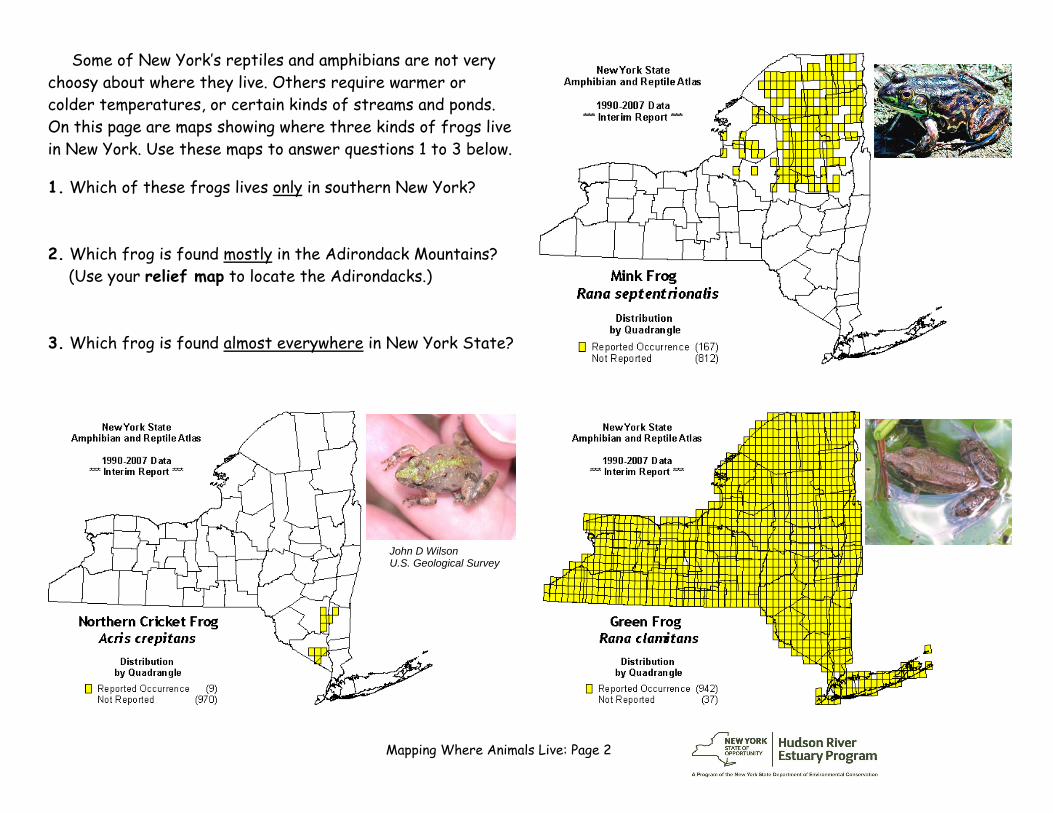
Mapping Where Animals Live: Page 2
John D Wilson U.S. Geological Survey
Some of New York’s reptiles and amphibians are not very choosy about where they live. Others require warmer or colder temperatures, or certain kinds of streams and ponds. On this page are maps showing where three kinds of frogs live in New York. Use these maps to answer questions 1 to 3 below.
1. Which of these frogs lives only in southern New York?
2. Which frog is found mostly in the Adirondack Mountains?(Use your relief map to locate the Adirondacks.)
3. Which frog is found almost everywhere in New York State?
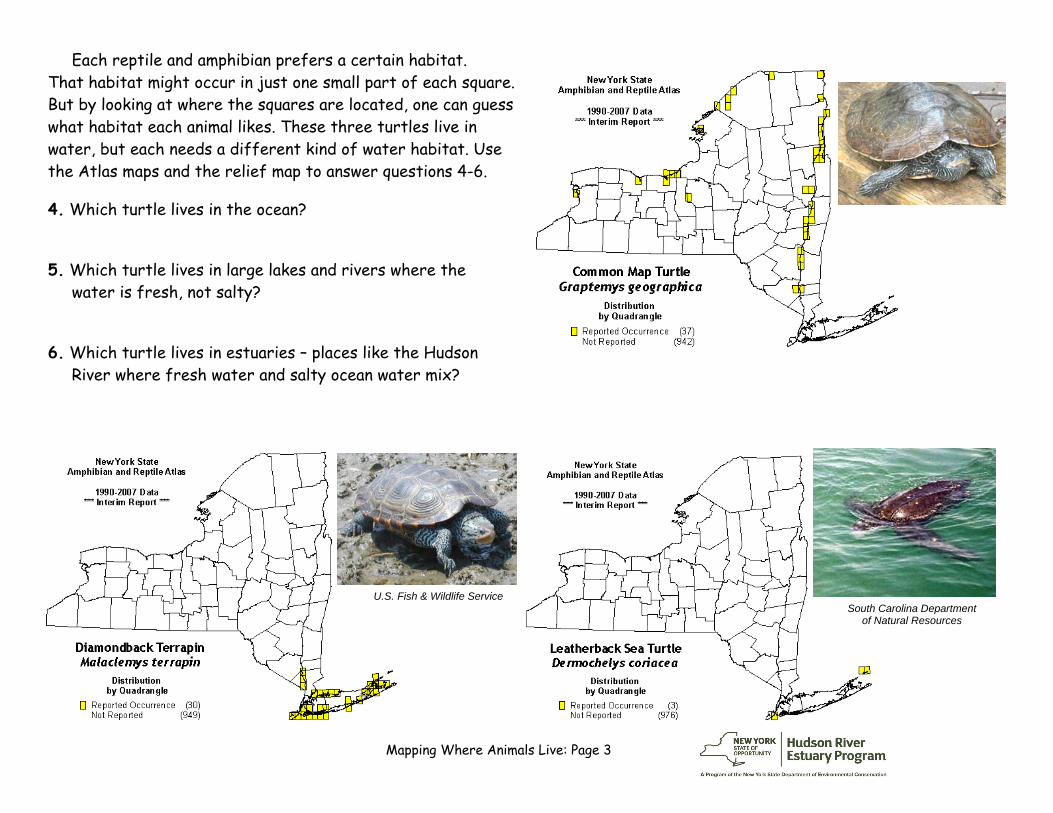
Mapping Where Animals Live: Page 3
U.S. Fish & Wildlife Service South Carolina Department
of Natural Resources
Each reptile and amphibian prefers a certain habitat. That habitat might occur in just one small part of each square. But by looking at where the squares are located, one can guess what habitat each animal likes. These three turtles live in water, but each needs a different kind of water habitat. Use the Atlas maps and the relief map to answer questions 4-6.
4. Which turtle lives in the ocean?
5. Which turtle lives in large lakes and rivers where thewater is fresh, not salty?
6. Which turtle lives in estuaries – places like the HudsonRiver where fresh water and salty ocean water mix?
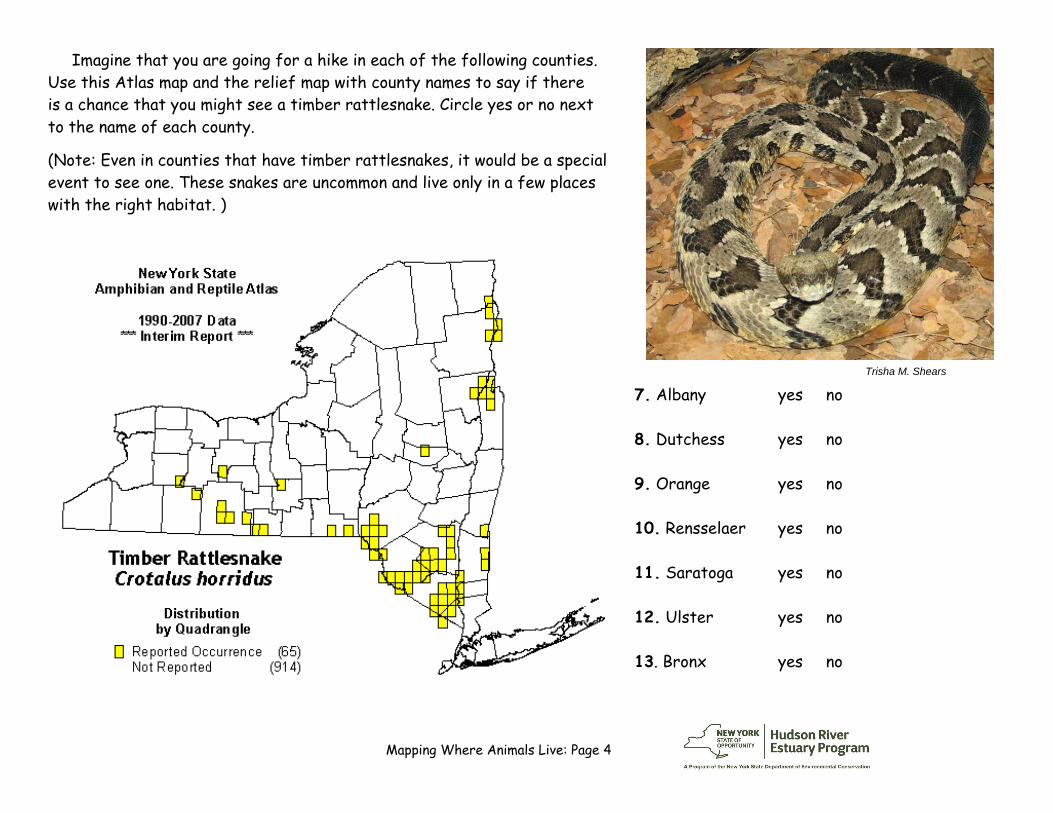
Mapping Where Animals Live: Page 4
Trisha M. Shears
Imagine that you are going for a hike in each of the following counties. Use this Atlas map and the relief map with county names to say if there is a chance that you might see a timber rattlesnake. Circle yes or no next to the name of each county.
(Note: Even in counties that have timber rattlesnakes, it would be a special event to see one. These snakes are uncommon and live only in a few places with the right habitat. )
7. Albany yes no
8. Dutchess yes no
9. Orange yes no
10. Rensselaer yes no
11. Saratoga yes no
12. Ulster yes no
13. Bronx yes no

ESSEX
ERIE
ST LAWRENCE
LEWIS
ONEIDA
ULSTER
STEUBEN DELAWARE
OTSEGO
CLINTON
OSWEGOWARREN
ORANGE
BROOMEGREENE
WAYNE
TIOGA
FULTON
FRANKLIN
HAMI
LTON
HERK
IMER
JEFFERSON
ALLEGANY
SULLIVAN
CAYU
GACATTARAUGUS CHENANGO
SUFFOLK
DUTCHESS
CHAUTAUQUA
SARATOGAMONROEONTARIO ONONDAGA
ALBANY
MADISON
COLUMBIA
WYOMING
WASHINGTON
YATES
NIAGARA
GENESEE
SCHOHARIE
RENSSELAERSE
NECA
LIVI
NGST
ON
CORTLAND
TOMPKINS
ORLEANS
CHEMUNG
SCHUYLER
WESTCHESTER
NASSAU
MONTGOMERY
PUTNAM
ROCKLANDSUFFOLK
SCHENECTADY
QUEENS
KINGS
BRONX
RICHMOND
NEW YORK
Lake
Cha
mpl
ain
Hudso
n
Adirond
ack Mo
untains
Lake Ontario
Lake ErieFinger
Lakes
Long Island Sound
Atlantic Ocean
Catskill Mountains
New York State Relief Map With County Boundaries
River
St. Law
renceRiver

This page intentionally left blank.
Hudson River Estuary Program NYS Department of Environmental Conservation
These Maps Are For The Birds
Students will study New York State Breeding Bird Atlas maps to learn where different bird species nest and how their distributions have changed over time.
Objectives: Students will understand: • how maps serve as representations of a geographic region;• how the distribution of animals varies geographically based on habitat
requirements;• how the distribution of animals changes over time as environmental
conditions change, often in response to human activities.
Grade level: Elementary/Middle School (Grades 4-7)
Subject Area: Science, Social Studies
Standards: Social Studies Standard 3 Mathematics, Science, & Technology Standard 4
Skills: • Interpret data presented geographically on a map.• Observe, identify, and communicate patterns in data.• Analyze document-based information presented in scientific figures.
Duration: Preparation time: 10 minutes Activity time: 50 minutes
Materials: Each student should have: Worksheet: These Maps Are For The Birds Relief Map of New York State with county boundaries Pencil or pen
Hudson River Estuary Program NYS Department of Environmental Conservation
Background: Maps usually show terrain, political regions, roads, towns, and similar features of the natural and built landscape, but can also show other information linked to geography. This lesson explores maps from the New York State Breeding Bird Atlas. The Atlas was created using data on nesting birds collected by more than 1,200 volunteers in 5,332 blocks—sections of U.S. Geological Survey maps—that together formed a mosaic covering all of New York.
The distribution of breeding birds is tied to the availability of suitable habitat. Their distribution can change as habitat is altered. Examples include the disappearance of grasslands due to urbanization, an increase in forest cover as farm fields are abandoned, and milder winters due to climate change. Other factors influencing bird distribution include application of toxic pesticides, shooting, and introduction of non-native species.
Students will view actual Breeding Bird Atlas maps to learn how such factors play roles in bird distribution. By comparing data collected over two decades, they will see how this distribution can vary over time. They will answer document-based questions about information in these scientific figures. The maps are unaltered except for being reduced in size and—most likely—converted to black and white in photocopying.
On each map, blocks in which a species occurred are colored to show the bird’s breeding distribution. The color of the block shows how likely it was that the species did nest. Finding a nest in use or babies would confirm breeding, indicated by a blue block. Possible breeding means only that the bird was seen in the right nesting habitat, indicated by a yellow block. Because color distinctions may be lost in copying to black and white, the worksheet for this lesson does not address this feature of the maps.
Activity: 1. Review vocabulary and point out that the lesson will look at where birds nest in New York.
The maps do not show where birds migrate, nor do they include non-breeding species.2. Compare an Atlas map to the state relief map showing counties. Point out the location of
major topographic features such as the Adirondacks, Catskills, Atlantic Ocean, GreatLakes, and Hudson River. On the Atlas map, find the county in which your school is located.
3. Go through the “These Maps Are For The Birds” worksheet in class.4. See Resources for links to more information about birds included in this lesson.
Assessment: • Have students share answers to worksheet questions, or collect and grade sheets.• Select other Atlas maps for students to analyze. Suggestions: double-crested cormorant,
golden-winged warbler, peregrine falcon, ring-necked pheasant, ruffed grouse, uplandsandpiper, and whip-poor-will. Fact sheets on the web (see Resources) explain increases ordeclines in these species.
Hudson River Estuary Program NYS Department of Environmental Conservation
Vocabulary: atlas: a book of maps breeding: producing young by hatching or live birth data: factual information (plural of datum) habitat: the particular sort of place where a given plant or animal lives landscape: a region’s set of landforms, viewed as a whole native: belonging in a particular place by birth; not brought in from another region
pesticide: a substance used to kill creatures or plants considered to be pests population: a group of individuals of one species living in a particular region relief map: a map that shows the topography of an area scientist: a person skilled in science species: a class of living things of the same kind and same name
Resources: All Breeding Bird Atlas maps are on the Department of Environmental Conservation website at www.dec.ny.gov/cfmx/extapps/bba/ . Scroll down to the table “Breeding Bird Atlas - Maps By Species.” In the row labeled “Alphabetic Order” select 1980-1985 or 2000-2005 to see a list of species. (To see maps from both time periods on one page, select “Alphabetic Order” in the row labeled “Compare Maps”). Clicking on a name in the list—duck, for example—opens a table listing one or more species in that category; click on a species name to see its map.
Find a list of breeding birds in your area. Go to www.dec.ny.gov/imsmaps/bbatlas/viewer.htm . A map of New York State will appear, with a search menu on the left. In the search menu, select “Town/City/Village,” enter the community’s name, and click on “Find.” This brings up a map of the locality covered with a grid. Each square in the grid is labeled with a block number – four numerals followed by the letter A, B, C, or D. Choose the block in which your school orhome is located and write down its number. Now go to www.dec.ny.gov/cfmx/extapps/bba/ , scroll down to the “Species List Inquiry” section, and enter the number in the indicated box. Choose the years for which you want to see the list, and then click “Submit.”
Documents on DEC’s website explain the reasons for changes in distribution of many birds. While the site’s search function can locate such documents, it will be hard for elementary students to sort through the “hits” that the search produces. Here are the URLs for documents covering a number of the species included in the lesson: bald eagle www.dec.ny.gov/animals/7068.html common tern www.dec.ny.gov/animals/7100.html mute swan www.dec.ny.gov/animals/7076.html wild turkey www.dec.ny.gov/animals/7062.html
For additional DEC bird fact sheets and information pages, visit http://www.dec.ny.gov/animals/271.html
A broad array of information about birds is available on the Cornell Laboratory of Ornithology’s website at www.birds.cornell.edu/ , including photographs of many species and activities for school classrooms.
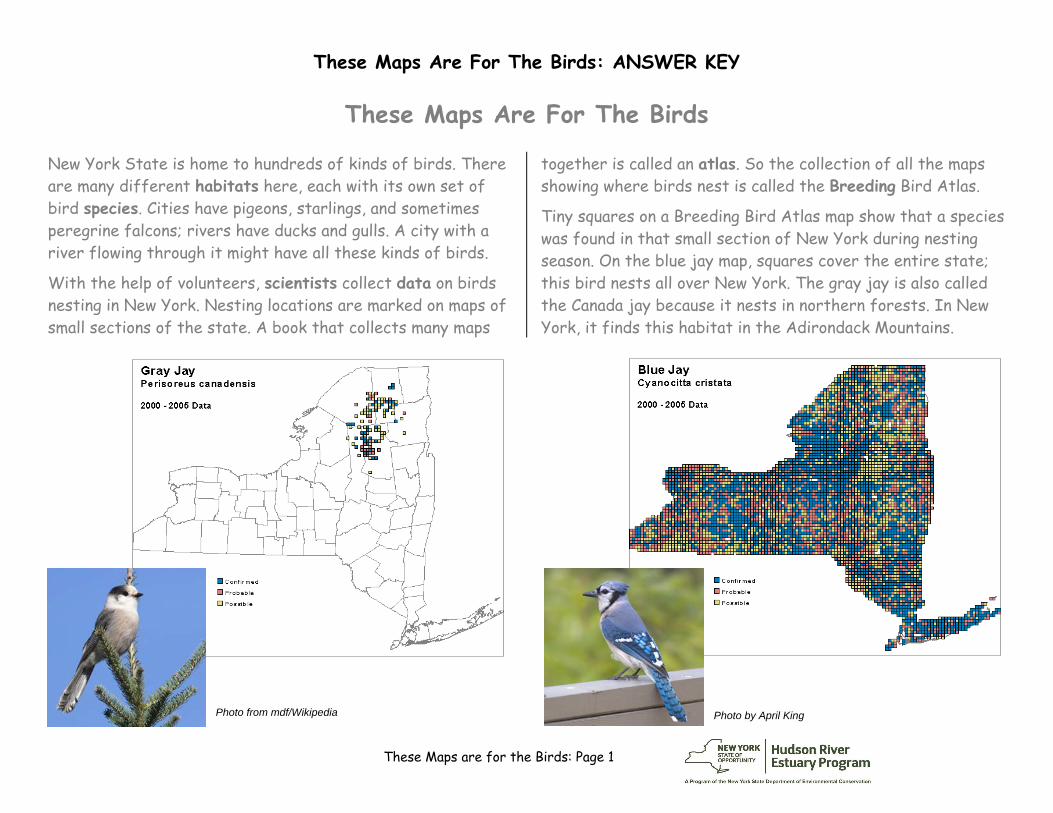
These Maps are for the Birds: Page 1
Photo from mdf/Wikipedia Photo by April King
These Maps Are For The Birds: ANSWER KEY
These Maps Are For The Birds
New York State is home to hundreds of kinds of birds. There are many different habitats here, each with its own set of bird species. Cities have pigeons, starlings, and sometimes peregrine falcons; rivers have ducks and gulls. A city with a river flowing through it might have all these kinds of birds.
With the help of volunteers, scientists collect data on birds nesting in New York. Nesting locations are marked on maps of small sections of the state. A book that collects many maps
together is called an atlas. So the collection of all the maps showing where birds nest is called the Breeding Bird Atlas.
Tiny squares on a Breeding Bird Atlas map show that a species was found in that small section of New York during nesting season. On the blue jay map, squares cover the entire state; this bird nests all over New York. The gray jay is also called the Canada jay because it nests in northern forests. In New York, it finds this habitat in the Adirondack Mountains.
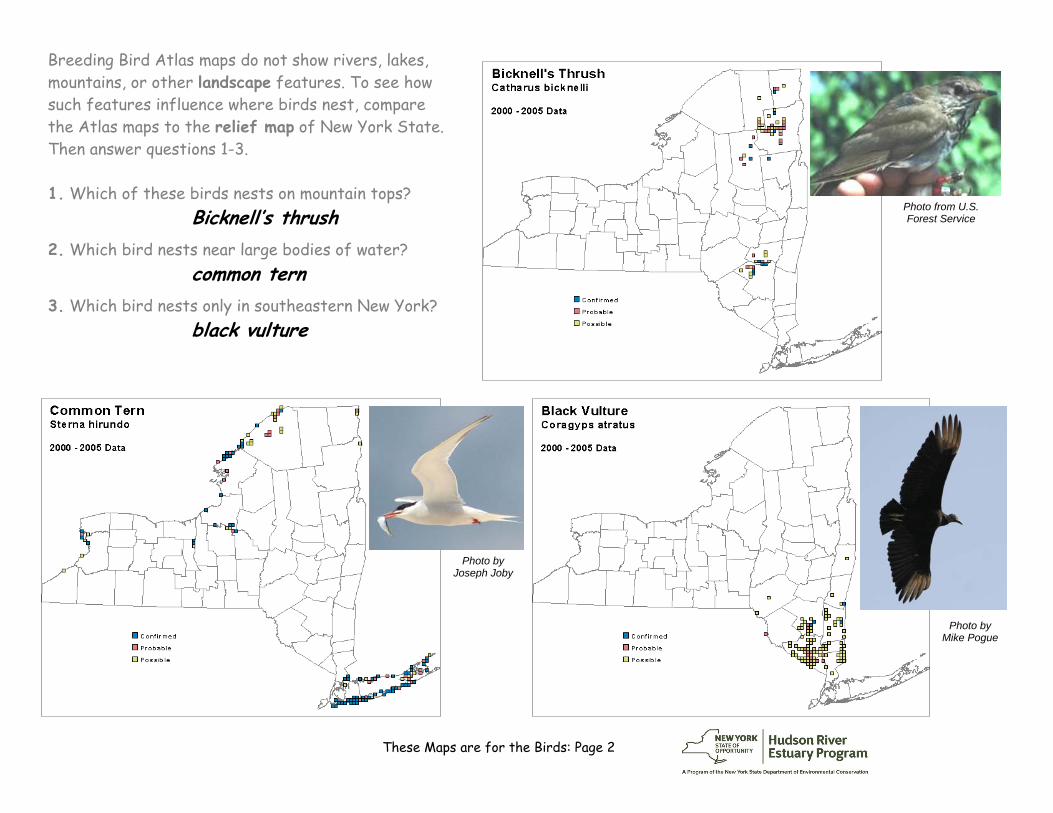
These Maps are for the Birds: Page 2
Photo by Joseph Joby
Photo from U.S. Forest Service
Photo by Mike Pogue
Breeding Bird Atlas maps do not show rivers, lakes, mountains, or other landscape features. To see how such features influence where birds nest, compare the Atlas maps to the relief map of New York State. Then answer questions 1-3.
1. Which of these birds nests on mountain tops?Bicknell’s thrush
2. Which bird nests near large bodies of water?common tern
3. Which bird nests only in southeastern New York?black vulture
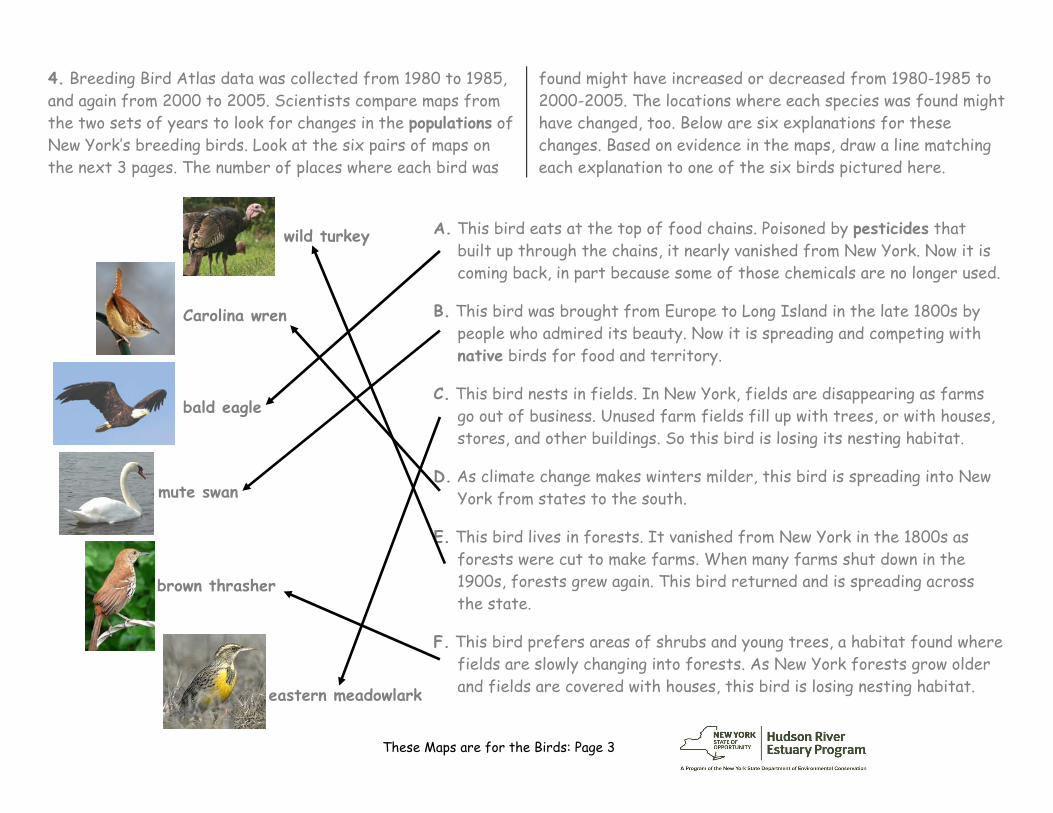
These Maps are for the Birds: Page 3
A. This bird eats at the top of food chains. Poisoned by pesticides that built up through the chains, it nearly vanished from New York. Now it is coming back, in part because some of those chemicals are no longer used.
B. This bird was brought from Europe to Long Island in the late 1800s by people who admired its beauty. Now it is spreading and competing with native birds for food and territory.
C. This bird nests in fields. In New York, fields are disappearing as farms go out of business. Unused farm fields fill up with trees, or with houses, stores, and other buildings. So this bird is losing its nesting habitat.
D. As climate change makes winters milder, this bird is spreading into New York from states to the south.
E. This bird lives in forests. It vanished from New York in the 1800s as forests were cut to make farms. When many farms shut down in the 1900s, forests grew again. This bird returned and is spreading across the state.
F. This bird prefers areas of shrubs and young trees, a habitat found where fields are slowly changing into forests. As New York forests grow older and fields are covered with houses, this bird is losing nesting habitat.
wild turkey
Carolina wren
bald eagle
mute swan
brown thrasher
eastern meadowlark
4. Breeding Bird Atlas data was collected from 1980 to 1985,and again from 2000 to 2005. Scientists compare maps from the two sets of years to look for changes in the populations of New York’s breeding birds. Look at the six pairs of maps on the next 3 pages. The number of places where each bird was
found might have increased or decreased from 1980-1985 to 2000-2005. The locations where each species was found might have changed, too. Below are six explanations for these changes. Based on evidence in the maps, draw a line matching each explanation to one of the six birds pictured here.
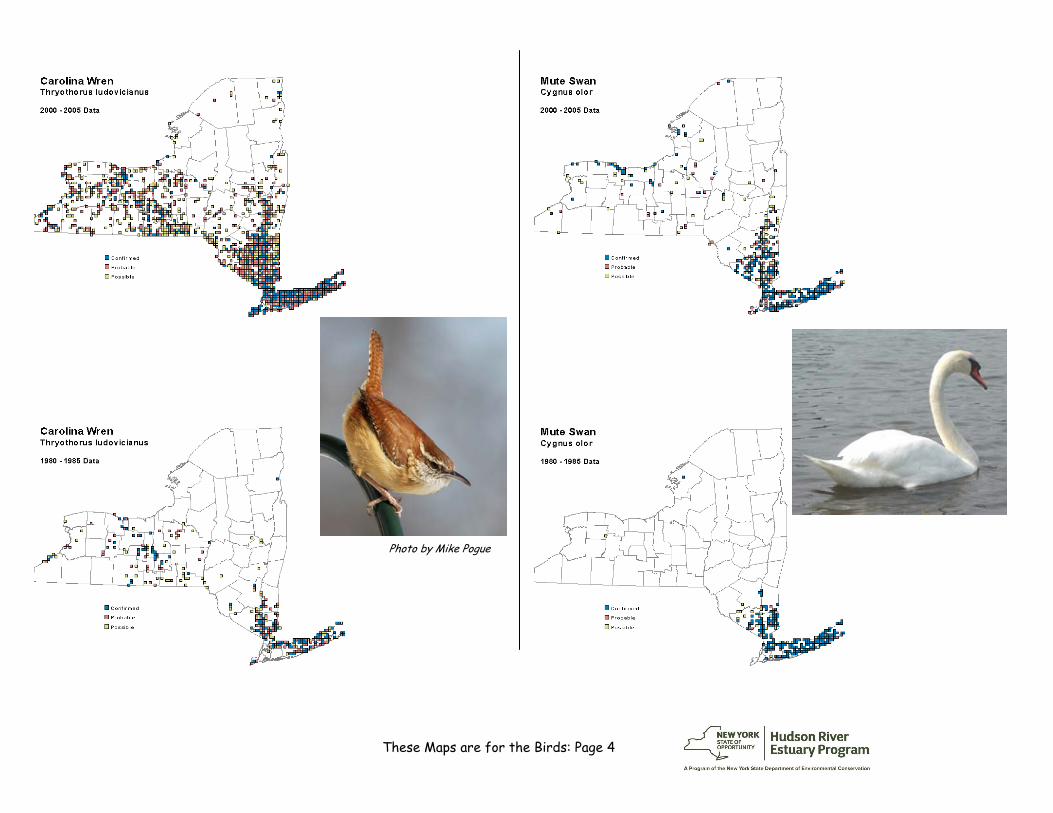
These Maps are for the Birds: Page 4
Photo by Mike Pogue
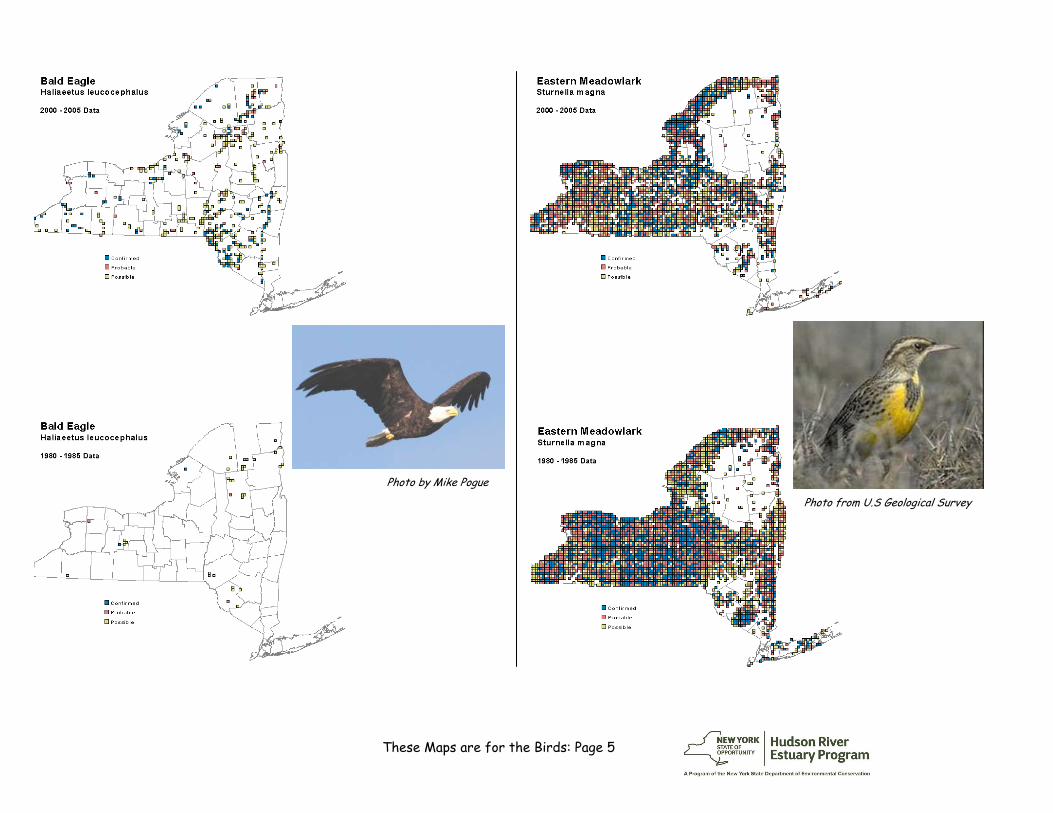
These Maps are for the Birds: Page 5
Photo by Mike Pogue
Photo from U.S Geological Survey
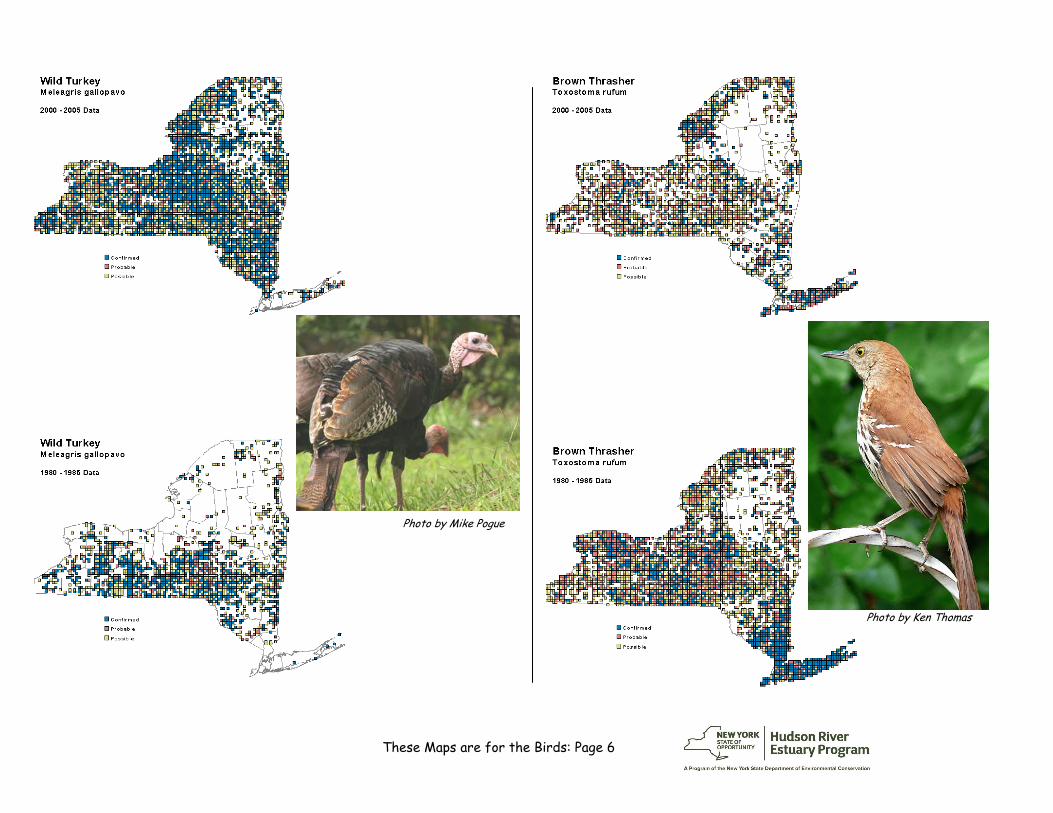
These Maps are for the Birds: Page 6
Photo by Mike Pogue
Photo by Ken Thomas
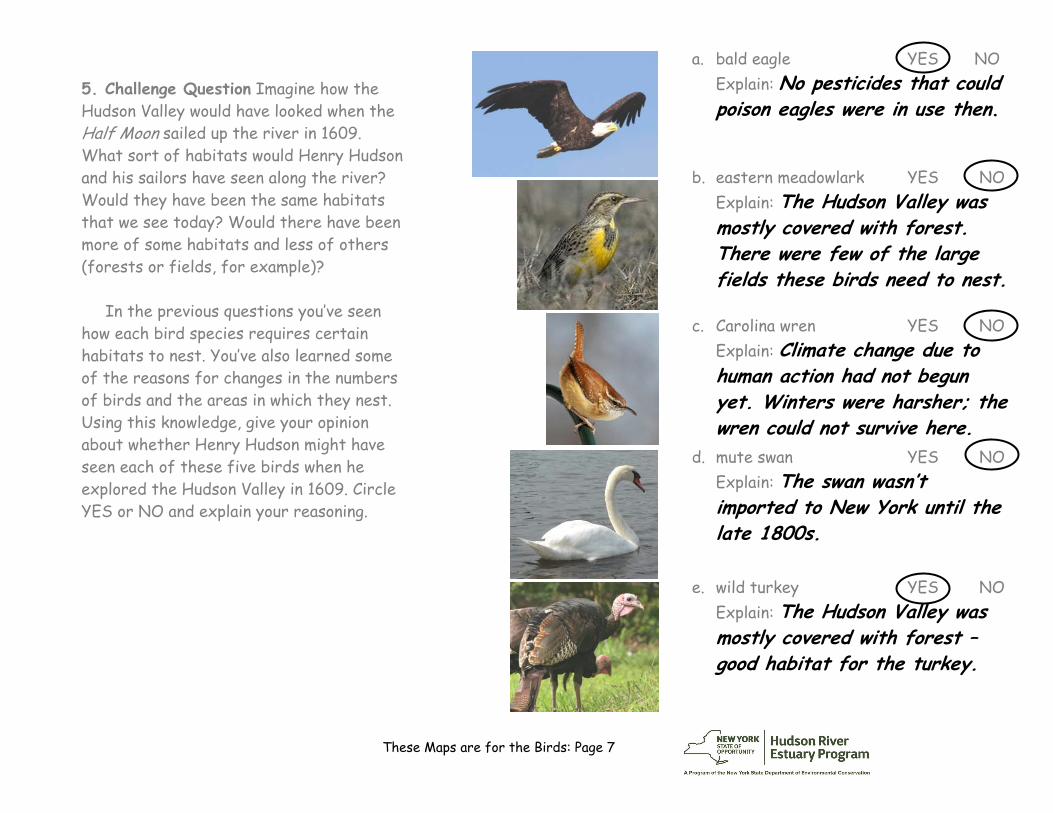
These Maps are for the Birds: Page 7
5. Challenge Question Imagine how theHudson Valley would have looked when the Half Moon sailed up the river in 1609. What sort of habitats would Henry Hudson and his sailors have seen along the river? Would they have been the same habitats that we see today? Would there have been more of some habitats and less of others (forests or fields, for example)?
In the previous questions you’ve seen how each bird species requires certain habitats to nest. You’ve also learned some of the reasons for changes in the numbers of birds and the areas in which they nest. Using this knowledge, give your opinion about whether Henry Hudson might have seen each of these five birds when he explored the Hudson Valley in 1609. Circle YES or NO and explain your reasoning.
a. bald eagle YES NOExplain: No pesticides that could poison eagles were in use then.
b. eastern meadowlark YES NOExplain: The Hudson Valley was mostly covered with forest. There were few of the large fields these birds need to nest.
c. Carolina wren YES NOExplain: Climate change due to human action had not begun yet. Winters were harsher; the wren could not survive here.
d. mute swan YES NOExplain: The swan wasn’t imported to New York until the late 1800s.
e. wild turkey YES NO Explain: The Hudson Valley was mostly covered with forest – good habitat for the turkey.
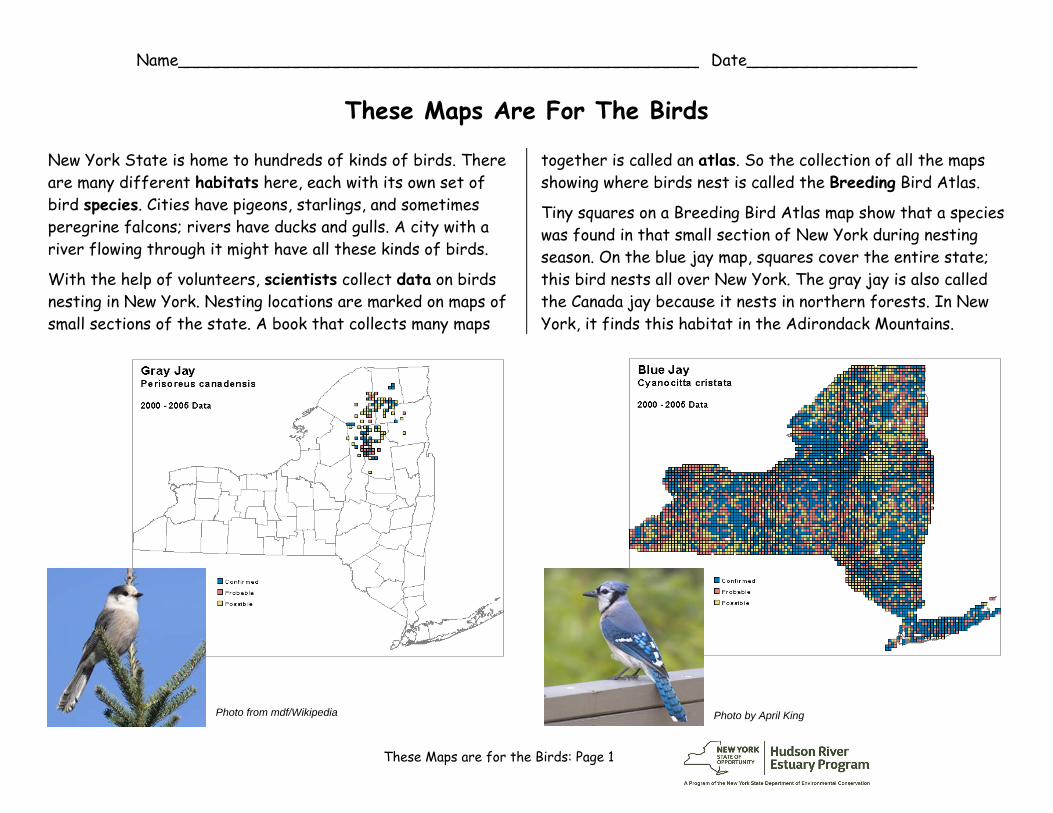
These Maps are for the Birds: Page 1
Photo from mdf/Wikipedia Photo by April King
Name____________________________________________________ Date_________________
These Maps Are For The Birds
New York State is home to hundreds of kinds of birds. There are many different habitats here, each with its own set of bird species. Cities have pigeons, starlings, and sometimes peregrine falcons; rivers have ducks and gulls. A city with a river flowing through it might have all these kinds of birds.
With the help of volunteers, scientists collect data on birds nesting in New York. Nesting locations are marked on maps of small sections of the state. A book that collects many maps
together is called an atlas. So the collection of all the maps showing where birds nest is called the Breeding Bird Atlas.
Tiny squares on a Breeding Bird Atlas map show that a species was found in that small section of New York during nesting season. On the blue jay map, squares cover the entire state; this bird nests all over New York. The gray jay is also called the Canada jay because it nests in northern forests. In New York, it finds this habitat in the Adirondack Mountains.
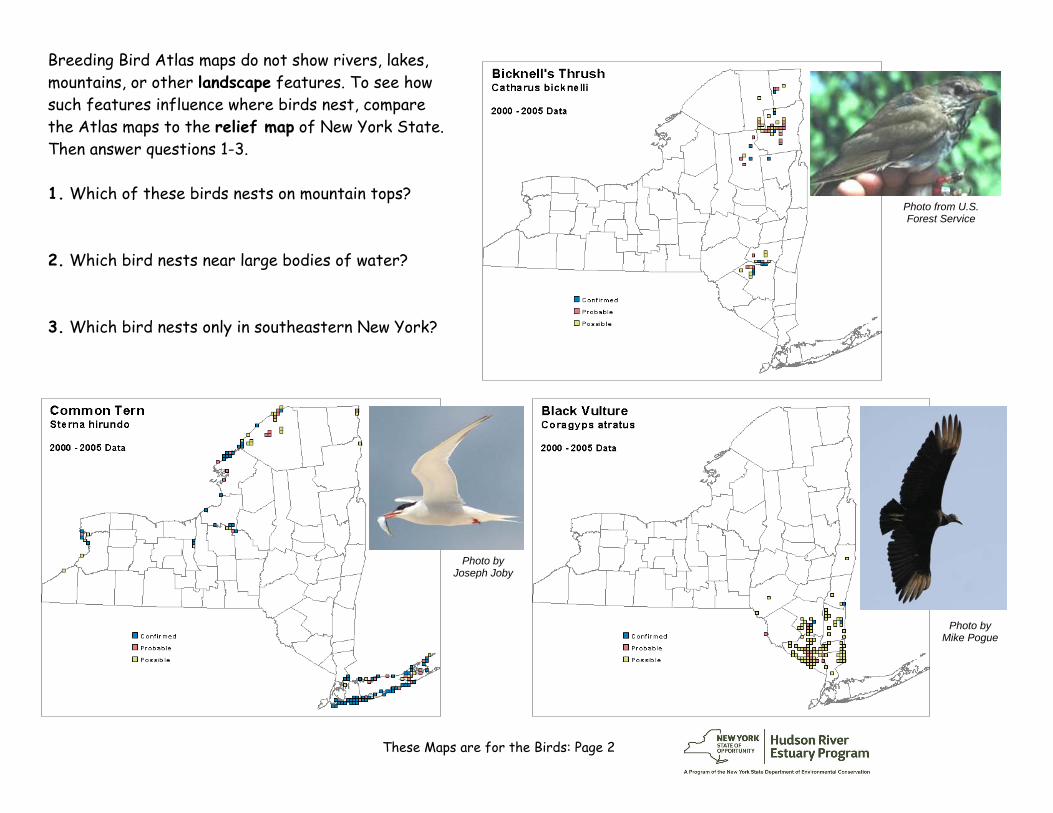
These Maps are for the Birds: Page 2
Photo by Joseph Joby
Photo from U.S. Forest Service
Photo by Mike Pogue
Breeding Bird Atlas maps do not show rivers, lakes, mountains, or other landscape features. To see how such features influence where birds nest, compare the Atlas maps to the relief map of New York State. Then answer questions 1-3.
1. Which of these birds nests on mountain tops?
2. Which bird nests near large bodies of water?
3. Which bird nests only in southeastern New York?
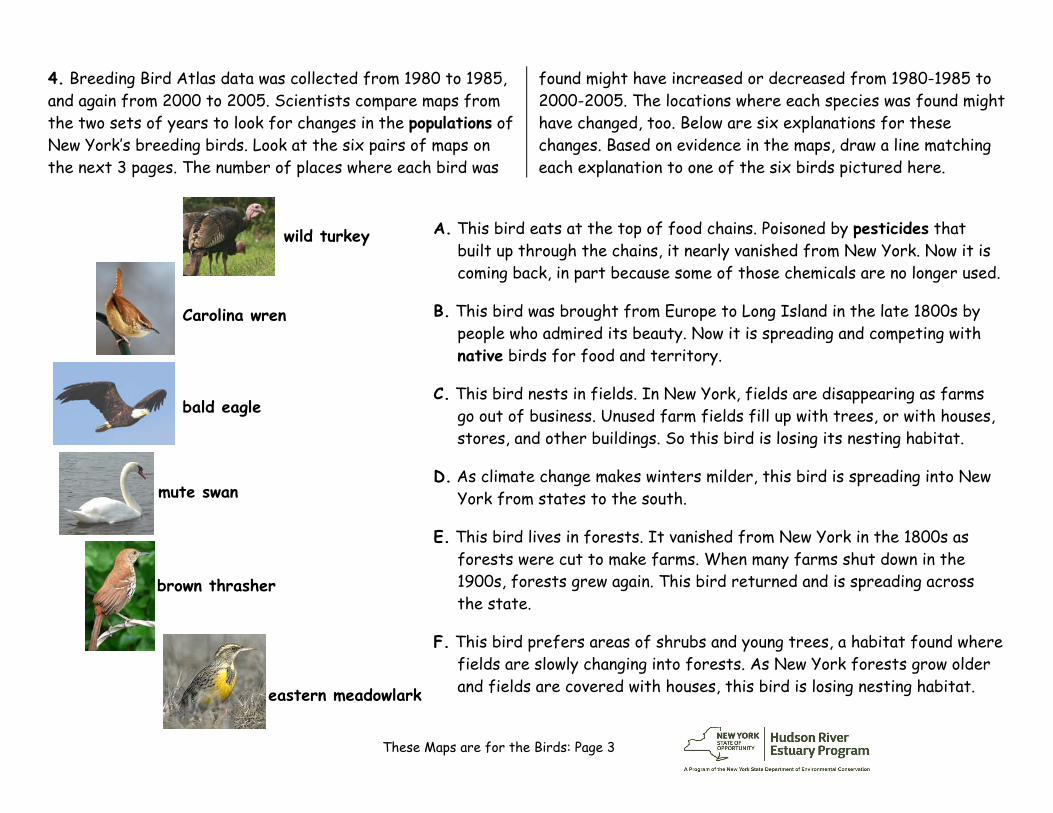
These Maps are for the Birds: Page 3
A. This bird eats at the top of food chains. Poisoned by pesticides that built up through the chains, it nearly vanished from New York. Now it is coming back, in part because some of those chemicals are no longer used.
B. This bird was brought from Europe to Long Island in the late 1800s by people who admired its beauty. Now it is spreading and competing with native birds for food and territory.
C. This bird nests in fields. In New York, fields are disappearing as farms go out of business. Unused farm fields fill up with trees, or with houses, stores, and other buildings. So this bird is losing its nesting habitat.
D. As climate change makes winters milder, this bird is spreading into New York from states to the south.
E. This bird lives in forests. It vanished from New York in the 1800s as forests were cut to make farms. When many farms shut down in the 1900s, forests grew again. This bird returned and is spreading across the state.
F. This bird prefers areas of shrubs and young trees, a habitat found where fields are slowly changing into forests. As New York forests grow older and fields are covered with houses, this bird is losing nesting habitat.
wild turkey
Carolina wren
bald eagle
mute swan
brown thrasher
eastern meadowlark
4. Breeding Bird Atlas data was collected from 1980 to 1985,and again from 2000 to 2005. Scientists compare maps from the two sets of years to look for changes in the populations of New York’s breeding birds. Look at the six pairs of maps on the next 3 pages. The number of places where each bird was
found might have increased or decreased from 1980-1985 to 2000-2005. The locations where each species was found might have changed, too. Below are six explanations for these changes. Based on evidence in the maps, draw a line matching each explanation to one of the six birds pictured here.

These Maps are for the Birds: Page 4
Photo by Mike Pogue
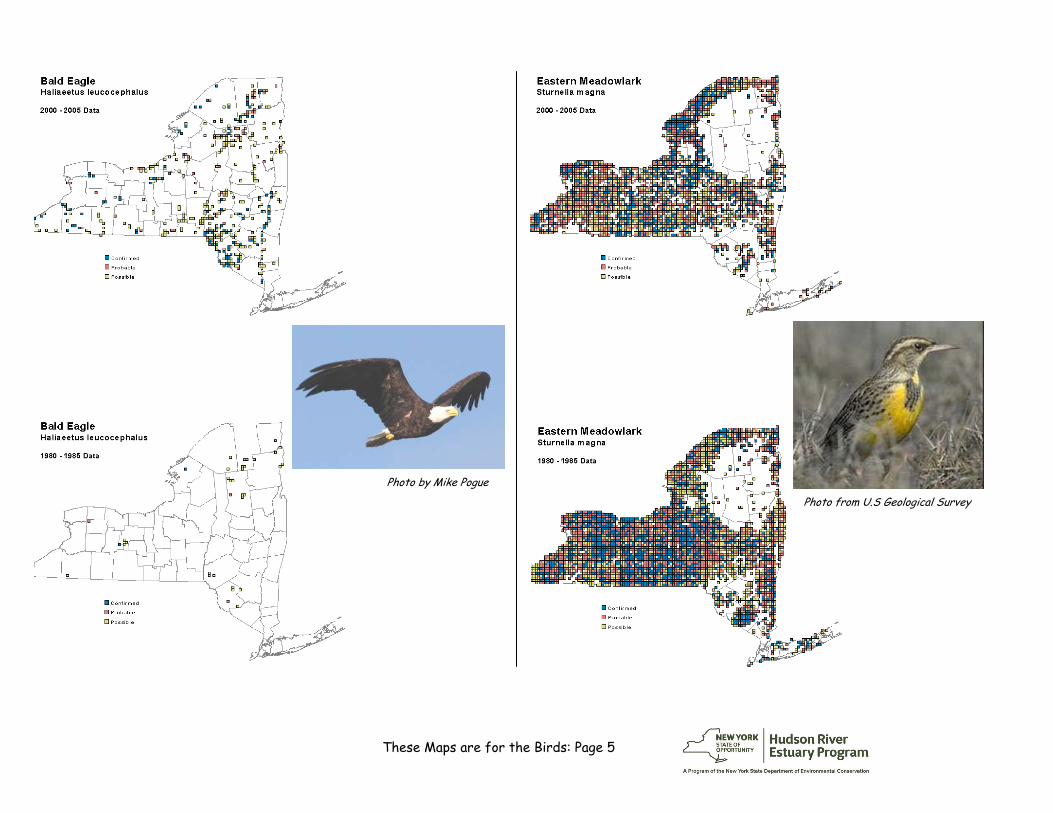
These Maps are for the Birds: Page 5
Photo by Mike Pogue Photo from U.S Geological Survey
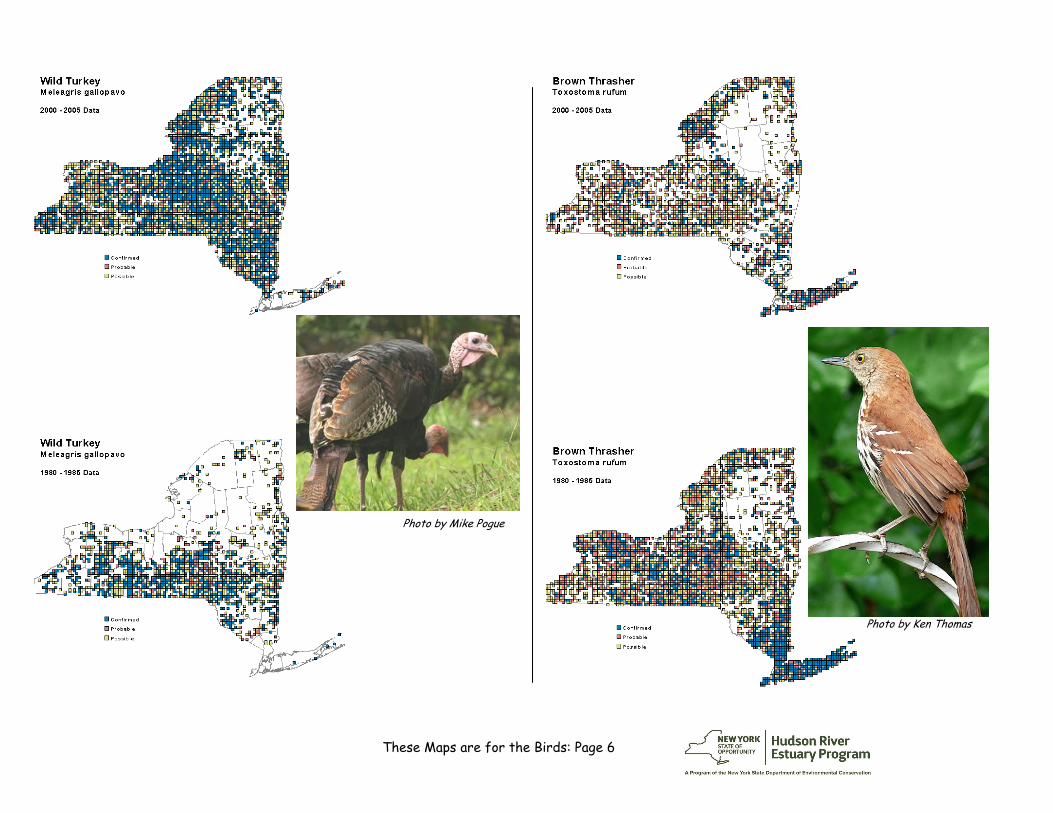
These Maps are for the Birds: Page 6
Photo by Mike Pogue
Photo by Ken Thomas
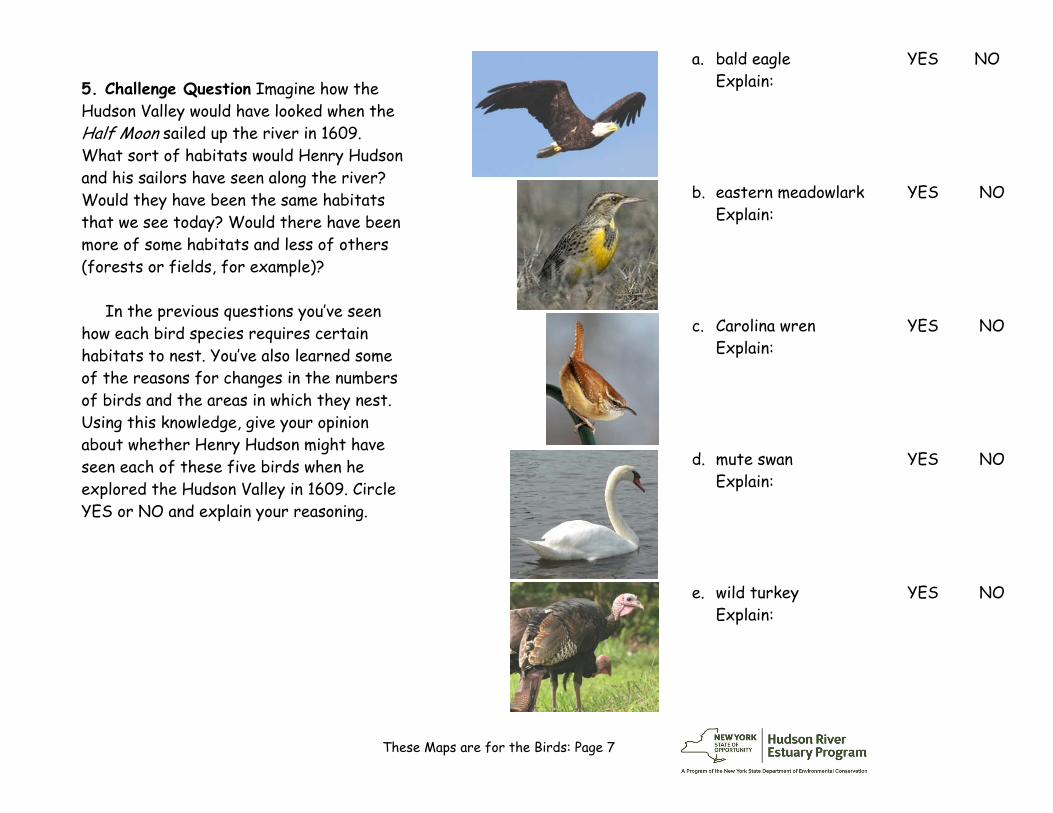
These Maps are for the Birds: Page 7
5. Challenge Question Imagine how theHudson Valley would have looked when the Half Moon sailed up the river in 1609. What sort of habitats would Henry Hudson and his sailors have seen along the river? Would they have been the same habitats that we see today? Would there have been more of some habitats and less of others (forests or fields, for example)?
In the previous questions you’ve seen how each bird species requires certain habitats to nest. You’ve also learned some of the reasons for changes in the numbers of birds and the areas in which they nest. Using this knowledge, give your opinion about whether Henry Hudson might have seen each of these five birds when he explored the Hudson Valley in 1609. Circle YES or NO and explain your reasoning.
a. bald eagle YES NO Explain:
b. eastern meadowlark YES NO Explain:
c. Carolina wren YES NO Explain:
d. mute swan YES NO Explain:
e. wild turkey YES NO Explain:
ESSEX
ERIE
ST LAWRENCE
LEWIS
ONEIDA
ULSTER
STEUBEN DELAWARE
OTSEGO
CLINTON
OSWEGOWARREN
ORANGE
BROOMEGREENE
WAYNE
TIOGA
FULTON
FRANKLIN
HAMI
LTON
HERK
IMER
JEFFERSON
ALLEGANY
SULLIVAN
CAYU
GACATTARAUGUS CHENANGO
SUFFOLK
DUTCHESS
CHAUTAUQUA
SARATOGAMONROEONTARIO ONONDAGA
ALBANY
MADISON
COLUMBIA
WYOMING
WASHINGTON
YATES
NIAGARA
GENESEE
SCHOHARIE
RENSSELAERSE
NECA
LIVI
NGST
ON
CORTLAND
TOMPKINS
ORLEANS
CHEMUNG
SCHUYLER
WESTCHESTER
NASSAU
MONTGOMERY
PUTNAM
ROCKLANDSUFFOLK
SCHENECTADY
QUEENS
KINGS
BRONX
RICHMOND
NEW YORK
Lake
Cha
mpl
ain
Hudso
n
Adirond
ack Mo
untains
Lake Ontario
Lake ErieFinger
Lakes
Long Island Sound
Atlantic Ocean
Catskill Mountains
New York State Relief Map With County Boundaries
River
St. Law
renceRiver
Recommended