Investment outlook 2013
William HobbsHead of Equity Strategy
January 2013

4
Outline of presentation
2013 outlook
Risk #1: the euro crisis
Risk #2: US & UK austerity
The global context
How to invest

5
2013 Outlook
Source: Google Images, Barclays

6
Clouds begin to lift
Most visible clouds:
1: The euro’s existential crisis
2: Fiscal austerity in the US and UK
Rays of sunshine?
1: The ECB (and, if needed, the BoE)
2: US New Year deal & UK history
3: The bigger picture: ‘Customer no. 1’ and Asia

7
Key barometer: manufacturing surveys stabilising
Source: Bloomberg, Datastream, Barclays Research
-5
-4
-3
-2
-1
0
1
2
Jan-07 Jan-08 Jan-09 Jan-10 Jan-11 Jan-12China US UK Germany Japan
Standard deviations from trend

8
Risk #1: the euro crisis

How to view it:
“One must imagine Sisyphus happy” – Camus

10
The ECB’s safety net at work
Source: Bloomberg, Barclays
0
1
2
3
4
5
6
7
0.0
0.5
1.0
1.5
2.0
2007 2008 2009 2010 2011 2012 2013
Euro interbank - OIS spread (lhs) Germany-Spain 10 year bond spread (rhs)
(%) (%)
11
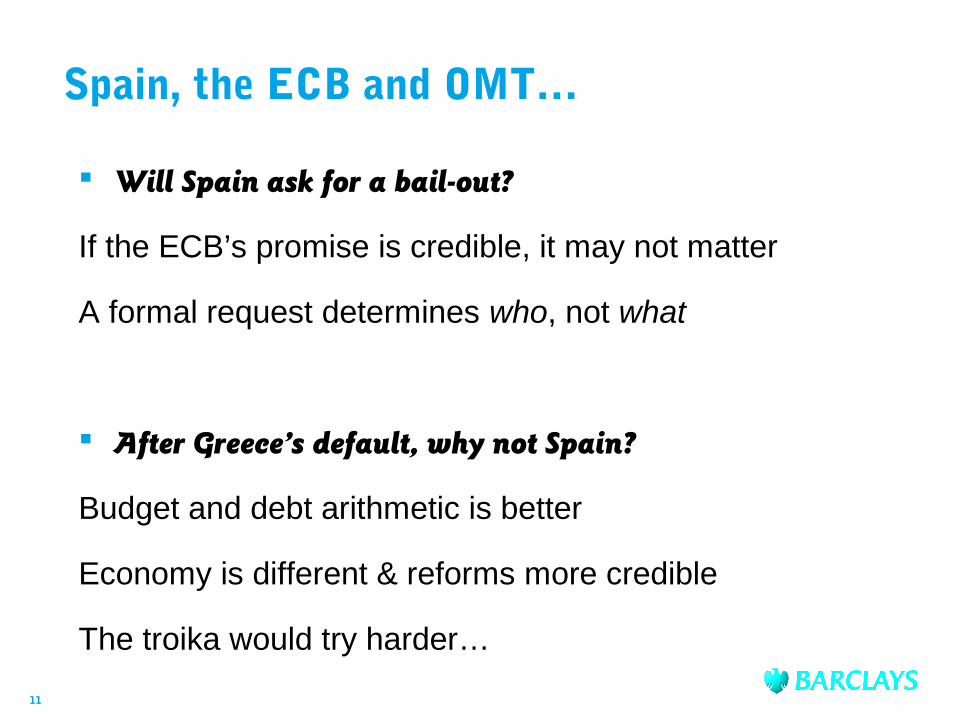
Spain, the ECB and OMT…
Will Spain ask for a bail-out?
If the ECB’s promise is credible, it may not matter
A formal request determines who, not what
After Greece’s default, why not Spain?
Budget and debt arithmetic is better
Economy is different & reforms more credible
The troika would try harder…

12
Plausible timescale for a definitive euro fix
Source: Blackrock, Barclays Wealth Strategy
Safeguard banks, tackle
deficits & insolvent
sovereigns
Co-ordinate deposit
insurance, supervision,
rescue facilities
Greater fiscal integration, joint bond issuance
More competitive peripheral economies
Lasting solution
2012… 2017?? 2022???2013-15?

13
Risk #2: US & UK fiscal austerity

14
US fiscal cliff has been turned
New Year compromise was a big deal
‘American Taxpayer Relief Act’ keeps a lid on taxes
Tax hit in 2013: $190bn, or 1.2% GDP (cf: $650bn, 4.1%)
TBD (March?): spending cuts & debt ceiling
Spending sequestration: $90bn, or 0.6% GDP
Credit ratings matter less than ‘fundamentals’

15
Govt. borrowing (rolling 12 mths, % GDP)
Source: Datastream, Barclays Research
-6
-4
-2
0
2
4
6
8
10
12
Q1 1994 Q1 1999 Q1 2004 Q1 2009
US UK

16
Structural government deficits (IMF, % GDP)
Source: IMF WEO; Barclays
-12
-10
-8
-6
-4
-2
0
2
4
6
8
2007 2009 2011 2013F Change 2009-2013
UK Euro area US Japan

17
“How 364 economists got it totally wrong”Daily Telegraph, March 2006 – a 25th anniversary
Precedent: a brief UK history lesson

18
Sterling is competitive & real rates are low
Source: Datastream, Barclays Research
-6
-5
-4
-3
-2
-1
0
1
2
3
02/11/2002 02/11/2004 02/11/2006 02/11/2008 02/11/2010 02/11/2012
75
80
85
90
95
100
105
Real interest rates (%, LHS) Real exchange rate (index, RHS)

19
The global context

20
US housing market gathering momentum
Source: Factset, Barclays Research
400
500
600
700
800
900
1000
1100
1200
1300
Jan-08 Jan-09 Jan-10 Jan-11 Jan-12
100
150
200
250
300
350
400
450
500
550
Building permits Private housing starts Stock of new homes for sale (RHS)

21
US consumer spending: life after debt
Source: Datastream, Barclays Research
100
105
110
115
120
125
15/12/2005 15/12/2007 15/12/2009 15/12/2011
250
300
350
400
450
500
550
600
650
700
US household spending (nominal, index) Unemployment claims (000, RHS)
Index: Dec 2005=100 000s per w eek

22
Total US liabilities are large…
Source: Datastream, Federal Reserve, Barclays Research
0.0
0.5
1.0
1.5
2.0
2.5
3.0
3.5
Q2 1962 Q2 1972 Q2 1982 Q2 1992 Q2 2002 Q2 2012
Consumer + Government
+ Non-financial business + Financial sector = Total domestic
Debt/GDP

23
… but consumer assets are larger
Source: Factset, Barclays Wealth Strategy
0.0
0.5
1.0
1.5
2.0
2.5
3.0
3.5
4.0
4.5
5.0
Q2 1962 Q2 1972 Q2 1982 Q2 1992 Q2 2002 Q2 2012
Debt Financial assets Tangible assets Net worth
X GDP

2424
Asian growth: structural underpinnings
Source: US Bureau of Census, MSCI, Barclays
0
10
20
30
40
50
60
Stocks now Bonds now Real GDP now Population in 2041
Asia’s weight in the world, %

25
Barclays’ key macroeconomic projections
Real GDP (%)Global 3.8 3.0 3.2 4.0
Emerging 6.5 5.0 5.4 6.0
US 1.8 2.3 2.1 2.5
Euro area 1.5 -0.4 0.1 1.4UK 0.9 -0.1 1.3 2.2
Inflation (CPI,%)Global 3.9 2.9 3.0 3.3
Emerging 6.4 4.8 5.1 5.1
US 3.2 2.1 2.0 2.5
Euro area 2.7 2.5 1.8 1.7UK 4.5 2.8 2.8 2.4
Official interest rates (end-year, %)US 0.0–0.25 0.0–0.25 0.0–0.25 n/a
ECB 1.0 0.75 0.5 n/a
Bank of England 0.5 0.5 0.5 n/a
Barclays Forecasts
2011 2012(E) 2013(F) 2014(F)

26
How to invest
27
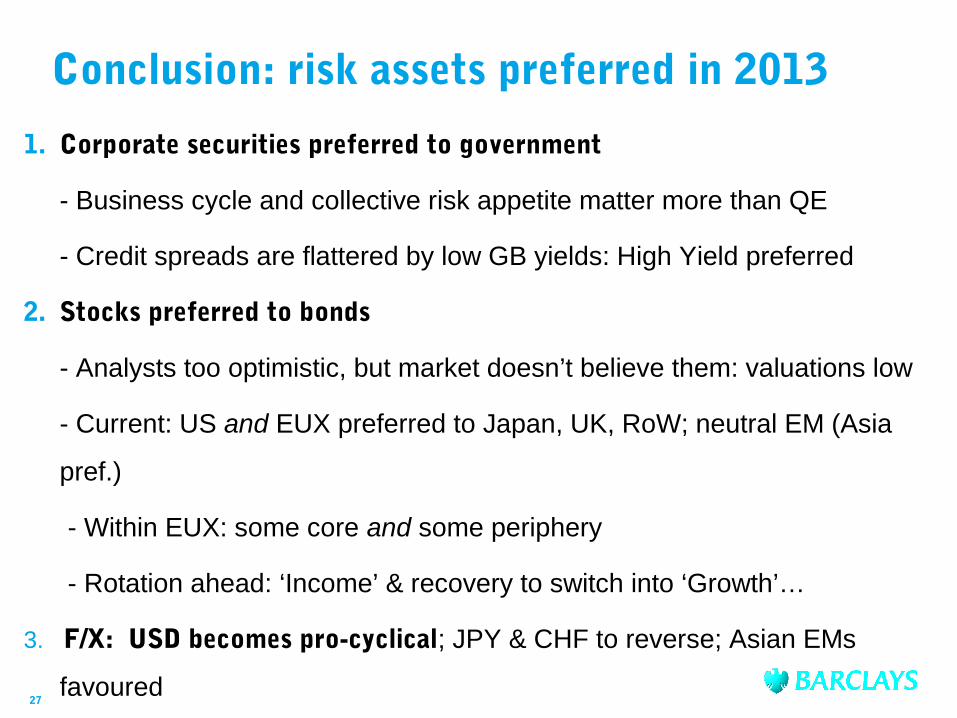
Conclusion: risk assets preferred in 2013
1. Corporate securities preferred to government
- Business cycle and collective risk appetite matter more than QE
- Credit spreads are flattered by low GB yields: High Yield preferred
2. Stocks preferred to bonds
- Analysts too optimistic, but market doesn’t believe them: valuations low
- Current: US and EUX preferred to Japan, UK, RoW; neutral EM (Asia
pref.)
- Within EUX: some core and some periphery
- Rotation ahead: ‘Income’ & recovery to switch into ‘Growth’…
3. F/X: USD becomes pro-cyclical; JPY & CHF to reverse; Asian EMs
favoured
28
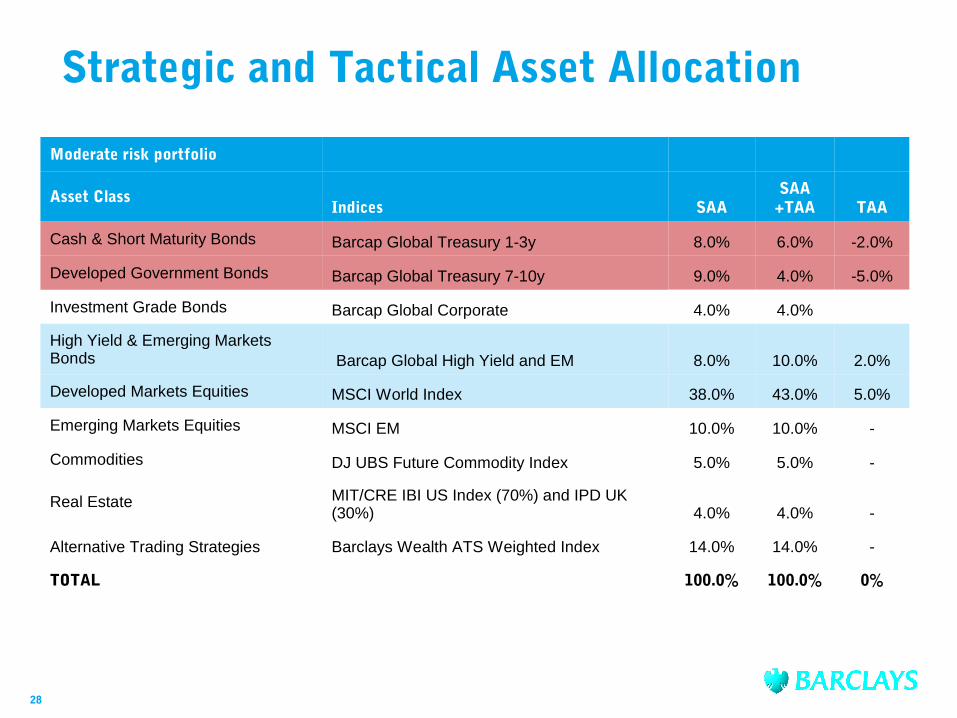
Strategic and Tactical Asset Allocation
Moderate risk portfolio
Asset ClassIndices SAA
SAA +TAA TAA
Cash & Short Maturity Bonds Barcap Global Treasury 1-3y 8.0% 6.0% -2.0%
Developed Government Bonds Barcap Global Treasury 7-10y 9.0% 4.0% -5.0%
Investment Grade Bonds Barcap Global Corporate 4.0% 4.0%
High Yield & Emerging Markets Bonds Barcap Global High Yield and EM 8.0% 10.0% 2.0%
Developed Markets Equities MSCI World Index 38.0% 43.0% 5.0%
Emerging Markets Equities MSCI EM 10.0% 10.0% -
Commodities DJ UBS Future Commodity Index 5.0% 5.0% -
Real Estate MIT/CRE IBI US Index (70%) and IPD UK (30%) 4.0% 4.0% -
Alternative Trading Strategies Barclays Wealth ATS Weighted Index 14.0% 14.0% -
TOTAL 100.0% 100.0% 0%

Developed profitability is not extreme (real ROE, %)
Source: MSCI, Datastream, FactSet, Barclays
-2
0
2
4
6
8
10
12
14
16
Dec-74 Dec-79 Dec-84 Dec-89 Dec-94 Dec-99 Dec-04 Dec-09inflation adjusted RoE 10 year moving average
Please note that past performance is not necessarily a reliable indicator of future performance
30
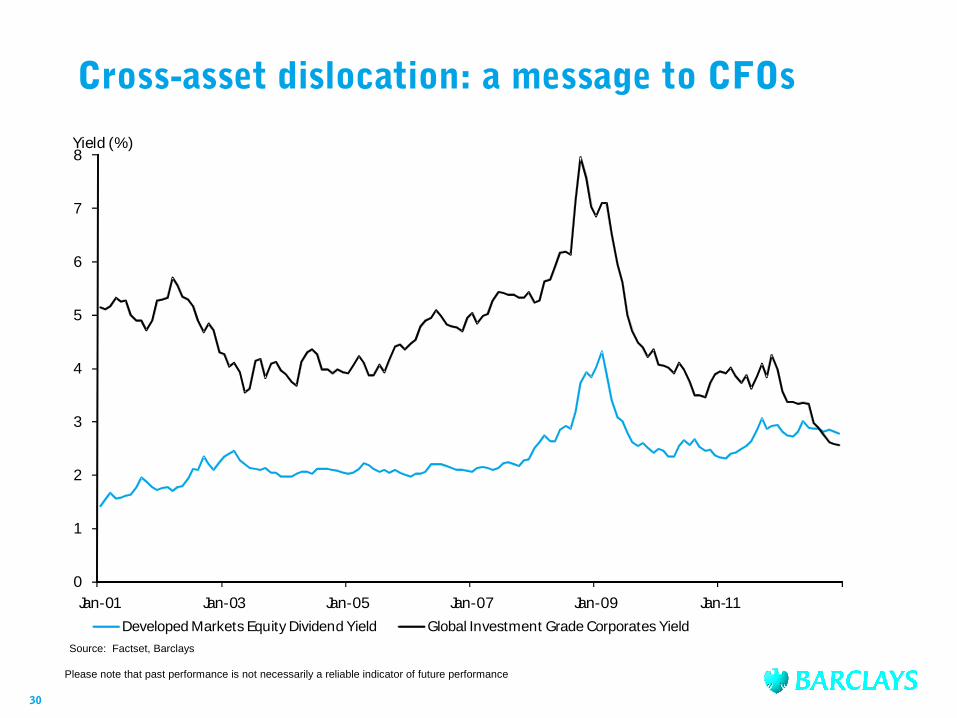
Cross-asset dislocation: a message to CFOs
Source: Factset, Barclays
0
1
2
3
4
5
6
7
8
Jan-01 Jan-03 Jan-05 Jan-07 Jan-09 Jan-11
Developed Markets Equity Dividend Yield Global Investment Grade Corporates Yield
Yield (%)
Please note that past performance is not necessarily a reliable indicator of future performance
Disclaimer
This document has been issued and approved by Barclays Bank PLC. Although information in this document has been obtained from sources believed to be reliable, we do not represent or warrant its accuracy, and such information may be incomplete or condensed. This document does not constitute a prospectus, offer, invitation or solicitation to buy or sell securities and is not intended to provide the sole basis for any evaluation of the securities or any other instrument, which may be discussed in it. All estimates and opinions included in this document constitute our judgement as of the date of the document and may be subject to change without notice. This document is not a personal recommendation and you should consider whether you can rely upon any opinion or statement contained in this document without seeking further advice tailored for your own circumstances. This document is confidential and is being submitted to selected recipients only. It may not be reproduced or disclosed (in whole or in part) to any other person without our prior written permission. Law or regulation in certain countries may restrict the manner of distribution of this document and persons who come into possession of this document are required to inform themselves of and observe such restrictions. We or our affiliates may have acted upon or have made use of material in this document prior to its publication. You should seek advice concerning any impact this investment may have on your personal tax position from your own tax adviser.
Barclays offers wealth and investment management products and services to its clients through Barclays Bank PLC and its subsidiary companies.Barclays Bank PLC is registered in England and authorised and regulated by the Financial Services Authority. Registered number is 1026167 and its registered office is 1 Churchill Place, London E14 5HP.
© Barclays Bank PLC 2012. All rights reserved. Issued for companies including Barclays Bank PLC (Reg. No. 1026167), Barclays Stockbrokers Limited (Reg. No. 1986161), a member of the London Stock Exchange and PLUS, Barclays Sharedealing (Reg. No. 2092410), Barclays Bank Trust Company Limited (Reg. No. 920880) and Gerrard Investment Management Limited (Reg No. 2752982), a member of the London Stock Exchange. All of these companies are registered in England and have their registered office at: 1 Churchill Place, London E14 5HP. All of these firms are authorised and regulated by the Financial Services Authority.

Recommended