DEVELOPMENT OF 'LOOK-UP' ENVIRONMENTAL
VALUE ESTIMATES FOR INITIAL APPRAISAL
WITHIN COST-BENEFIT ANALYSIS
Technical Report
For Department for Environment, Food & Rural Affairs (Defra)
October 2015
eftec
73-75 Mortimer Street
London W1W 7SQ
tel: 44(0)2075805383
fax: 44(0)2075805385
www.eftec.co.uk

Development of Look-Up Environmental Value Estimates Technical Report
eftec i October 2015
This document has been prepared for the Department for Environment, Food and Rural Affairs
(Defra) by:
Economics for the Environment Consultancy Ltd (eftec)
73-75 Mortimer Street
London
W1W 7SQ
www.eftec.co.uk
Study team:
Allan Provins
Sarah Krisht
Rob Tinch
Rohit Mistry
Erin Gianferrara
Phil Cryle
Ece Ozdemiroglu
Peer reviewer
Prof. Ian Bateman (University of East Anglia)
Acknowledgements
The study team would like to thank Prof. Ian Bateman for his review comments and input, along
with the project steering group, the Natural Value and Economics Group (NVEG) and analysts within
Defra and other Government departments who contributed to the consultation phase of the
project, and the pilot testing of the Environmental Value Look-up Tool. Thanks also to Adam Dutton
(RSPB).
This study also benefits from inputs from: Shannon Anderson, Angela Doku, and Adams Koshy (all
eftec).
eftec offsets its carbon emissions through a biodiversity-friendly voluntary offset purchased from
the World Land Trust (http://www.carbonbalanced.org) and only prints on 100% recycled paper.

Development of Look-Up Environmental Value Estimates Technical Report
eftec ii October 2015
CONTENTS
EXECUTIVE SUMMARY ................................................................................ iv
1. INTRODUCTION ................................................................................... 1
1.1 Background ............................................................................................... 1
1.2 Project objectives ...................................................................................... 2
1.3 Environmental value look-up tool .................................................................... 3
1.4 Project outputs .......................................................................................... 4
1.5 Report structure ......................................................................................... 5
2. USE OF INDICATIVE VALUES IN APPRAISAL .................................................. 6
2.1 Review of impact assessments ........................................................................ 6
2.2 User consultation........................................................................................ 9
2.3 Illustrative valuation contexts ....................................................................... 12
3. COMPILING INDICATIVE VALUES ..............................................................14
3.1 Screening valuation studies .......................................................................... 14
3.2 Classifying valuation studies ......................................................................... 16
3.3 Consolidating valuation evidence ................................................................... 18
3.4 Coverage of indicative values in the EVL Tool .................................................... 21
4. CONCLUSIONS AND RECOMMENDATIONS ....................................................23
4.1 Summary ................................................................................................. 24
4.2 Findings .................................................................................................. 25
4.3 Recommendations...................................................................................... 26
GLOSSARY ..............................................................................................28
REFERENCES ...........................................................................................29
ANNEX 1: SURVEY RESPONSES – DESCRIPTIVE STATISTICS ....................................33
ANNEX 2: SCREENED VALUATION STUDIES .......................................................36
ANNEX 3: CRITERIA FOR CLASSIFYING VALUATION STUDIES ..................................45

Development of Look-Up Environmental Value Estimates Technical Report
eftec iii October 2015
LIST OF ABBREVIATIONS
Cefas Centre for Environment, Fisheries and Aquaculture
CBA Cost-benefit analysis
BERR Department for Business, Enterprise and Regulatory Reform
BIS Department for Business, Innovation and Skills
DCMS Department for Culture, Media and Sport
Defra Department for Environment, Food and Rural Affairs
DFID Department for International Development
DfT Department for Transport
DCLG Department of Communities and Local Government
DECC Department of Energy and Climate Change
EA Environment Agency
EVL Tool Environmental Value Look-up Tool
EVRI Environmental Valuation Reference Inventory
FCO Foreign and Commonwealth Office
FSA Food Standards Agency
FC Forestry Commission
HMRC Her Majesty’s Revenue and Customs
HO Home Office
HSE Health and Safety Executive
JNCC Joint Nature Conservation Committee
MCZ Marine Conservation Zone
MOJ Ministry of Justice
NE Natural England
NWEBS National Water Environment Benefits Survey
RBMP River Basin Management Plan
RSPB Royal Society for the Protection of Birds
TEEB The Economics of Ecosystems and Biodiversity
TIM The Integrated Model
UK NEA UK National Ecosystem Assessment
UK NEAFO UK National Ecosystem Assessment Follow-On
WebTAG Web Transport Appraisal Guidance
WTP Willingness to pay

Development of Look-Up Environmental Value Estimates Technical Report
eftec iv October 2015
EXECUTIVE SUMMARY
The aim of this study is to develop a set of (default) ‘look-up’ values to help analysts take better
(monetary) account of environmental impacts in Government appraisals. The focus is on cases
where primary valuation or detailed value transfer analysis would be disproportionate to the scale
of the impacts being appraised.
The role for such look-up values was identified in the study for Defra ‘Baseline Evaluation of
Environmental Appraisal and Sustainable Development Guidance’ (eftec and Cascade Consulting,
2014). This highlighted the need to: (i) supplement environmental appraisal guidance with strong
and effective training in its use; and (ii) provide ‘default’ values for some environmental impacts,
to be applied where they might otherwise be overlooked.
The look-up values are intended to be used at the early stage of an appraisal, helping to establish
an indication of the possible scale of costs and benefits. This ‘first cut’ assessment will complement
- rather than replace – the option for more detailed analysis of environmental costs and benefits.
Further analysis will be required where the effort of doing this is proportionate to the type and
scale of impacts considered in the appraisal.
Whilst the primary audience is Government analysts, the outputs of this project may also be
relevant to private sector and non-government organisations with an interest in using valuation
evidence; for example for investment appraisals and corporate natural capital accounting
exercises. In general, where there is a requirement to measure and value environmental impacts
and/or the provision of ecosystem goods and services, the look-up values may provide a useful
‘entry-point’ to valuation.
ES.1 Environmental Value Look-up Tool
The look-up values are presented in an Excel-based appraisal tool – the Environmental Value Look-
Up (EVL) Tool – with an accompanying User Guide. The EVL Tool comprises three main components:
Database: the set of look-up values drawn from the available valuation evidence. In the tool
and User Guide the look-up values are referred to as ‘indicative’ values. This is to emphasise
that they represent broad generalisations of the value of different environmental goods and
impacts.
User interface: that allows users to select indicative values according to: (i) the type of
environmental impact/good; and (ii) the broad habitat they choose.
Aggregation: a worksheet for calculating aggregate environmental benefit and cost estimates
based on the selected indicative value. The user can specify the time period for calculating
equivalent annual values and present value costs and benefits, which are discounted in line
with HM Treasury (2003) Green Book guidance.
The User Guide describes the structure of EVL Tool and provides guidance on the interpretation and
use of the indicative values in appraisals. This includes: (i) the policy and appraisal contexts in
which the indicative values can be applied; (ii) the appropriate interpretation of the values in
informing decision-making; and (iii) worked examples demonstrating how the indicative values may
be used.
Other project outputs are detailed in Section 1.4 of the Technical Report.

Development of Look-Up Environmental Value Estimates Technical Report
eftec v October 2015
ES.2 Designing the Environmental Value Look Up Tool
The development of the EVL Tool was informed by an initial scoping exercise, which included
consultation with a group of potential users. This entailed:
Review of impact assessments: approximately 350 impacts assessments for the period 2008 –
2015 were screened. This identified 85 that considered environmental impacts. The main
findings were:
Most environmental impacts identified in the sample were typically assessed to be
‘insignificant’ and not subject to formal assessment.
The impacts most likely to be monetised included air quality regulation and climate
regulation, reflecting the well-established guidance for these topic areas (Defra, 2013;
DECC, 2014). This suggests that ease of access to environmental values is a primary factor
for their actual use in appraisals.
Cultural services (e.g. recreation, aesthetics) were found to be frequently identified in
assessments but were usually not valued in monetary terms.
User consultation: interviews were carried out with potential users of the EVL Tool to help
understand: (i) the varying levels of experience among analysts in assessing environmental
impacts; (ii) the types of impacts typically assessed; and (iii) the types of impacts that they had
been able to value in monetary terms. In total 12 interviews were undertaken, supplemented
by an online survey which provided a further 16 responses (from over 100 invites).
Overall, a key barrier that was identified was analysts’ lack of familiarity with the ecosystem
services framework. Some interviewees also suggested that the existence and accessibility of
carbon guidance hindered further valuation because analysts thought they had covered
environmental impacts if they had valued changes in greenhouse gas emissions. A further
barrier was a lack of both scientific and economic evidence to inform the valuation of
environmental impacts. This was reinforced by feedback from survey responses that indicated a
lack of valuation evidence and low confidence in the robustness of available evidence as the
most common reasons for not valuing environmental impacts in monetary terms.
ES.3 Compiling indicative values
The EVL Tool includes approximately 40 indicative values. In addition to these, there are
approximately 40 entries that relate to environmental impacts covered by existing Government
guidance (e.g. climate regulation, air quality regulation, etc.). The process for compiling the
indicative values for the EVL Tool is illustrated in Figure ES. 1 and described below.
Figure ES. 1: Evidence review process
1. Screening: over 350 UK-relevant studies published since the year 2000 were screened in the
evidence review process (excluding existing Government guidance). Table ES. 1 provides a
count of studies classified by habitat type.
1. Screening 2. Classification 3. Consolidation 4. Indicative values

Development of Look-Up Environmental Value Estimates Technical Report
eftec vi October 2015
Table ES. 1: Summary of scope of evidence review by habitat type1
Habitat type No. identified
studies No. screened
studies No. classified
studies
Enclosed farmland 56 13 7
Freshwater, wetlands and floodplains 46 32 8
Marine and coastal margins2 54 19 11
Mountains, moors and heaths 59 12 6
Semi-natural grasslands 55 12 6
Urban (green space) 29 11 4
Woodland 100 15 8
Note: Excludes existing Government guidance. 1A study that covers multiple habitat types is counted more than once. 2Valuation evidence for marine and coastal margins is combined because these two habitat types tend to be covered or discussed simultaneously in the literature.
2. Classification: a subset of the screened studies were taken forward to the classification step.
Studies were selected based on assessment of their suitability for being interpreted in a broad
and generalised way. The selection was guided by the scoping activities described in Section
ES.2, and good practice principles for valuation such as those set out in Defra’s value transfer
guidelines.
3. Consolidation: classified studies were consolidated to produce a single range of indicative
values (high, central, low) for each combination of broad habitat and environmental
impact/good. For some combinations the classification stage was sufficient; i.e. cases where
there is single source study for the indicative values. For others, multiple valuations from
different source studies were consolidated to provide indicative values.
4. Indicative values: the indicative values in the EVL Tool are presented as broad generalisations
of the values for impact / habitat combinations that have been captured in the literature.
Accompanying guidance notes in the tool explain the interpretation of the range of values (low,
central high). Specifically, they are not conventional statistical ranges, but instead reflect
some of the context-specific factors that are found to influence valuations in the source
studies, allowing users to incorporate these into their analyses.
ES.4 Conclusions and recommendations
The use of indicative values will be appropriate in a select set of policy and appraisal contexts,
which can accommodate the level of uncertainty associated with the valuations. The EVL Tool can
help analysts move from a position of taking no monetary account of environmental impacts to
demonstrating indicative monetary values in appraisals. As a ‘first cut’ assessment, this can inform
the level of further effort that is warranted for appraising environmental impacts.
The findings from the study indicate that further challenges remain. These include:
Barriers to valuing environmental impacts in general: the main barriers faced by analysts
relate to understanding and interpreting the various existing frameworks that are described in
current guidance (e.g. ecosystem services, wider environmental impacts, etc.). The volume of
guidance and the level of technical detail are obstacles to ‘non-specialists’ attempting to value
environmental impacts.
Gaps in valuation evidence: key areas that may require further valuation effort to support the
use of indicative values include urban green space, mountains, moors and heaths, and semi-

Development of Look-Up Environmental Value Estimates Technical Report
eftec vii October 2015
natural grasslands, as well as regulating ecosystem services (e.g. pest regulation, waste
regulations) across the majority of UK NEA habitat types.
Valuing biodiversity: this issue is examined in detail in the accompanying discussion paper
(‘Valuing Biodiversity’), which highlights the complexities faced, the difficulty in applying
valuation methods in this context, and the limited nature of the UK-focused evidence. The
paper concludes that, at present, it is not appropriate for the EVL Tool to contain specific values
for biodiversity and further research effort is required to develop a workable approach for
practical policy analyses. In the interim, the EVL Tool includes a list of existing biodiversity
valuation studies to assist interested users in undertaking more formal value transfer analysis.
Applying indicative environmental values in ecosystem accounting: indicative values could be
used in an ecosystem accounting context, even though the focus for the development of the EVL
Tool has been policy and project appraisals. A key issue to address, however, is improving the
understanding of the actual and likely uses of ecosystem accounts and their interpretation by
stakeholders, since these will determine the acceptability of indicative values in this setting.
Further recommendations are provided in the accompanying discussion paper (‘Applying Values
in Ecosystem Accounting’).
In conclusion, a number of recommendations are outlined with respect to the practical use of the
EVL Tool:
Review current appraisal guidance: for the EVL Tool to be effective in increasing the practical
use of environmental values in Government appraisals, the route to using the tool must be
clear, allowing users to circumvent (non-essential) technical guidance. Links between current
guidance and the EVL Tool should be mapped in a concise fashion and this ‘route map’ should
be the first document that analysts encounter.
Develop further practical appraisal tools for specific environmental impacts: there is scope
for improving the valuation evidence base in several policy areas, and these developments
could then be used to update the evidence included in the tool. This may be the case for
recreation where the evidence base is relatively rich. There may also be a case for developing a
valuation tool relating to the water environment. This will likely require further primary
valuation but the research could be undertaken in a way that also yields indicative values that
could be applied more generally.
Maintain and update the EVL Tool: the EVL Tool should be periodically updated. Routine
updates to the tool should include updating the price base on a yearly basis. More substantive
updates to the tool will also be required such as incorporating new valuation evidence as it
becomes available. Consideration should also be given to continuing consultation with users of
the tool to gain live feedback and log ‘lessons learnt’ to help improve the functionality of the
tool.
Availability of the EVL Tool: the EVL Tool should be made widely available for applications
beyond public policy appraisals. It potentially provides an entry-point for environmental
valuation in a number of contexts both within Government and beyond. There will also be
opportunities for organisations to adapt the tool and database for use in their own assessment
contexts.

Development of Look-Up Environmental Value Estimates Technical Report
eftec 1 October 2015
1. INTRODUCTION
1.1 Background
The Natural Environment White Paper ‘The Natural Choice’ (HM Government, 2011) stated the case
for growing a sustainable economy in which the benefits of nature would be recognised and valued.
Included within this was a commitment to fully consider the value of nature in all relevant impact
assessments. Subsequently, the Natural Capital Committee has highlighted that there are
substantial economic benefits to be gained from maintaining and improving natural assets; however
the benefits will only be realised if their full value is incorporated into decision-making (Natural
Capital Committee, 2014).
Following the White Paper, the supplementary guidance ‘Accounting for Environmental Impacts in
Policy Appraisal’ (HM Treasury and Defra, 2012) was published. This set out in more detail the
application of non-market valuation methods outlined in the HM Treasury Green Book (HM Treasury,
2003). The guidance recommends the use of an ecosystem services framework and it is intended to
support the appraisal of policies that have specific environmental outcomes and also those with a
different focus but include impacts on the environment. The guidance includes a checklist for
‘wider environmental effects’ (including air quality, landscape/townscape, water pollution, flood
risk, waste management and climate change) and ecosystem services (described in terms of
provisioning, regulating and cultural services). It also draws on the more detailed practical
guidance that is provided by Defra’s value transfer guidelines, ‘Valuing Environmental Impacts:
Practical Guidelines for the Use of Value Transfer in Policy and Project Appraisal’ (eftec, 2009).
The support available for appraisal practitioners has more recently been supplemented by guidance
in 2013 for valuing air quality impacts on health and the environment (Defra, 2013), as well as
updates in 2014 to the more established guidance for valuation of energy use and greenhouse gas
emission in policy appraisals (DECC, 2014).
Despite the progress made in developing more formal guidance for undertaking the appraisal of
environmental impacts, there remain challenges in establishing this as routine practice across
Government departments and agencies. These challenges were highlighted in the ‘Baseline
Evaluation of Environmental Appraisal and Sustainable Development Guidance’ study for Defra
(eftec and Cascade Consulting, 2014). This examined the use of environmental appraisal and
sustainable development guidance in impact assessments across Government. It highlighted the
following as the two key challenges for increased uptake and use of guidance:
Establishing a culture across Government departments and agencies that expects
environmental and social impacts to be taken seriously and addressed on an even-footing with
other (especially economic/business) impacts; and
Improving evidence and methods for presenting environmental and social impacts in monetary
terms, where appropriate and feasible.
Recommendations from the study included: (i) supplementing the environmental appraisal guidance
with strong and effective training in its use; and (ii) providing ‘default’ values for some
environmental impacts, to be applied where otherwise they might be overlooked. These
recommendations are particularly relevant for the majority of appraisal cases, where significant
valuation effort for any particular impact would be likely to be disproportionate, but where there is
potential for multiple small to moderate impacts to add up together (either within that appraisal or
across several) to have a high impact. At present, many of these impacts are ignored, or treated

Development of Look-Up Environmental Value Estimates Technical Report
eftec 2 October 2015
only briefly in qualitative terms in appraisals. The challenge is to help analysts take better
(monetary) account of these impacts, without incurring the disproportionate effort of primary
valuation or detailed value transfer analysis.
1.2 Project objectives
The aim of this study – ‘Development of look-up environmental value estimates for initial appraisal
within cost-benefit analysis’ – is to address these challenges, with the primary purpose of
increasing the practical use of environmental values in Government appraisals. This is to be
achieved by developing a set of (default) ‘look-up’ values that are consistent with existing guidance
and Green Book principles. The look-up values are intended to be used in the initial assessment of
environmental impacts in an appraisal, helping establish an indication of the possible scale of costs
and benefits. This initial assessment will complement - rather than replace – the option for more
detailed analysis of environmental costs and benefits through formal valuation methods. More
detailed analysis will be required where the effort of doing this is appropriate and proportionate to
the type and scale of impacts considered in the appraisal.
The project specification sets out the following objectives for the development of the look-up
values and the associated guidance for analysts:
1. Assess the policy and project contexts in which look-up values can be applied;
2. Develop a user-friendly format for presenting the look-up values for a range of ecosystem
services and environmental impacts;
3. Provide accompanying guidance and training for users of the look-up values including: (i) the
policy and appraisal contexts in which the values can be applied; (ii) the appropriate
interpretation of the values in informing decision-making; (iii) the consistency and link to the
value transfer guidelines and other supplementary Green Book guidance for environmental
appraisal; and (iv) worked examples demonstrating how the look-up values may be used
(including when it is proportionate to use them);
4. Review the potential for developing look-up values for biodiversity by assessing alternative
options based on willingness-to-pay metrics (demand-based values) and target- and
opportunity-cost- based metrics (cost-based values); and
5. Provide guidance to Defra on related issues to the look-up values: (i) how the valuation data
and guidance should be updated in the future; (ii) the extent to which the values can be used
in ecosystem accounting applications; and (iii) opportunities for developing further practical
appraisal tools for specific ecosystem services and/or environmental impacts.
The development of the look-up values covers all (non-market) environmental impacts and
ecosystem services as is practically feasible given the currently available evidence. The values are
primarily intended to be used in an economic appraisal setting, providing an input to cost-benefit
analyses. However, there are potentially wider applications for environmental values including
demonstrating the importance of an issue (e.g. policy briefings), policy, programme or project
evaluation, setting priorities within a sector or across sectors, determining socially desirable levels
for taxes, subsidies, permits and other instruments, and determining compensation when economic
or environmental damages are caused. Look-up values will not be appropriate in all of these
contexts, particularly the setting of incentives and compensatory damages as the type and scale of
impacts are likely to be significant and warrant more detailed analyses.

Development of Look-Up Environmental Value Estimates Technical Report
eftec 3 October 2015
A further potential application for look-up values is environmental accounting applications,
including natural capital and ecosystem accounts (ONS and Defra, 2014). The suitability of using
look-up values in ecosystem accounting applications and their consistency with associated guidance
such the SEEA-EEA1 framework (2012) is considered in a separate discussion paper that accompanies
this report (see Section 1.4). The paper takes a broad view and considers the key principles for
applying environmental valuations in ecosystem accounts.
The valuation of biodiversity (and of impacts on biodiversity) is a complex issue and this is also
addressed in a separate discussion paper, which considers the underlying principles and reviews
alternative approaches to biodiversity valuation.
Finally, whilst the primary audience for the look-up values is Government analysts, the outputs of
this project may also be relevant to wider organisations, including the private sector and non-
government organisations (e.g. for investment appraisals and corporate natural capital accounting
exercises). Indeed there are several initiatives that are seeking to draw the full value of natural
assets into decision-making, including for example, the Natural Capital Protocol2. In general, where
there is a requirement to measure and value environmental impacts and/or the provision of
ecosystem goods and services, the look-up values may provide a useful ‘entry-point’ to valuation.
1.3 Environmental value look-up tool
The key practical output of the project is an ‘Environmental Value Look-up Tool’ (EVL Tool). An
early example of a look-up table format that supports appraisal guidance for valuing environmental
impacts is the Department of Communities and Local Government (DCLG) ‘Valuing the External
Benefits of Undeveloped Land’ publication (eftec and Entec, 2001). This informs DCLG appraisals
concerning land development and remediation of contaminated land3 and the Department of
Transport (DfT) methodology for monetary valuation of landscape impacts (DfT, 2013). The 2001
report is based on valuation studies published before 2000 and the evidence base is now dated.
More recent examples include Defra (2013) valuation of air quality impacts, DECC (2014) valuation
of energy use and greenhouse gas emissions, DfT (2014) WebTAG databook (DfT), and Environment
Agency’s ‘Economic Valuation of Environmental Effects’ (EVEE) handbook (eftec, 2010). With the
exception of the WebTAG databook, the format for these look-up references is largely based
around written guidance documents with accompanying tables of default values to be applied in
appraisals.
The approach taken in this project has been to develop the look-up values in a specifically designed
Excel-based ‘appraisal tool’, with an accompanying User Guide document outlining its use. The EVL
Tool comprises three main components:
Database: this contains the set of look-up values drawn from the available valuation evidence.
In the tool and User Guide, the ‘look-up’ values are referred to as ‘indicative’ environmental
values. This is to emphasise the ‘first-cut’ nature of the analyses that are intended to be
supported by the tool. The process of compiling the indicative values is described subsequently
in this report. Summaries of the indicative values are included in the database, structured in a
format that is consistent with Defra’s value transfer guidelines (eftec, 2010) to help support
any subsequent and more detailed analysis that is required.
1 System of Environmental Economic Accounts – Experimental Ecosystem Accounting (SEEA-EEA, 2012). 2 See: http://www.naturalcapitalcoalition.org/natural-capital-protocol.html [Accessed July 2015]. 3 Pers comm. DCLG, June 2015.
Development of Look-Up Environmental Value Estimates Technical Report
eftec 4 October 2015
User interface: this helps users of the tool select indicative values based on a set of search
criteria. The criteria are specified in terms of type of environmental impact/good and broad
habitat. Links to supplementary Green Book guidance for environmental appraisal are also
included, but the guidance itself is not reproduced in the tool.
Aggregation: this provides users of the tool with a function for calculating aggregate benefit
and cost estimates for environmental impacts based on the indicative value they have
selected. Results are reported in a standard table format that details the parameters used in
calculating the aggregate value estimates.
The User Guide document describes the use of the EVL Tool and provides guidance on the
interpretation and use of the indicative values in appraisals. This includes: (i) the policy and
appraisal contexts in which the indicative values can be applied; (ii) the appropriate interpretation
of the values in informing decision-making; and (iii) worked examples demonstrating how the
indicative values may be used.
1.4 Project outputs
Overall, the various project objectives set out in Section 1.2 are addressed through several project
outputs. These are described in Table 1.1.
Table 1.1: Summary of project outputs
Project output Objective(s)
Environmental Value Look-
up (EVL) Tool
Develop a user-friendly format for presenting indicative (look-up)
values for a range of ecosystem services and environmental impacts.
User Guide Accompanying guidance for users of the EVL Tool.
Technical Report
(this document)
Assess the policy and project contexts in which indicative (look-up)
values can be applied.
Provide guidance on related-issues to the indicative values: (i) how the
valuation data and guidance should be updated in the future; and (ii)
opportunities for developing further practical appraisal tools for
specific ecosystem services and/or environmental impacts.
Valuing Biodiversity
Discussion Paper
Review the potential for developing indicative (look-up) values for
biodiversity by assessing alternative options based on willingness-to-
pay metrics (demand-based values) and target- and opportunity cost-
based metrics (cost-based values).
Applying Values in
Ecosystem Accounting
Discussion Paper
Provide guidance to Defra on related-issues to the indicative (look-up)
values including the extent to which the values can be used in
ecosystem accounting applications.
Training material
(presentation and
webinar)
Provide accompanying guidance for users of the EVL Tool.
This document (Technical Report) is accompanied by the EVL Tool and User Guide, and two
discussion papers that address the specific project objectives concerning the valuation of
biodiversity and the use of indicative values in ecosystem accounting application, respectively.
Training material is also available to assist users of the EVL Tool in the form an accompanying slide
pack.

Development of Look-Up Environmental Value Estimates Technical Report
eftec 5 October 2015
1.5 Report structure
The remainder of this report is structured as follows:
Section 2 summarises an initial scoping exercise that examined the potential role for and use
of indicative values in Government appraisals, including a review of recent impact assessments
and consultation with potential users of the EVL Tool;
Section 3 summarises the approach taken to compiling the indicative (look-up) values,
including the evidence review and process of identifying and classifying source studies, and
consolidating this evidence into a set of indicative values included in the EVL Tool; and
Section 4 concludes with recommendations stemming from this study including the
development of the EVL Tool and indicative values, and the accompanying discussion papers on
applying values in ecosystem accounting and on valuing biodiversity.
The content of the report is also supported by three supplementary annexes, which include:
Evidence to support the user consultation as part of the scoping exercise (Annex 1);
A list of screened valuation studies in the evidence (Annex 2); and
The criteria used for classifying source studies (Annex 3).

Development of Look-Up Environmental Value Estimates Technical Report
eftec 6 October 2015
2. USE OF INDICATIVE VALUES IN APPRAISAL
The scope for using indicative values in appraisals is potentially broad, covering most Government
departments and agencies, as well non-government organisations and sectors that make use of
economic value evidence in decision-making processes. Understanding the potential use of
indicative environmental values provides a helpful framing for developing the EVL Tool and User
Guide, particularly in terms of establishing the ‘target’ audience.
The initial scoping work for the project sought to examine the potential use of the EVL Tool and
requirements for the accompanying guidance through: (i) reviewing recent Government appraisals
and impact assessments to identify prominent policy contexts and environmental impacts; and (ii)
consultation with a diverse potential user group of Government and non-government analysts. The
main findings are summarised in the following.
2.1 Review of impact assessments
The purpose of the review of impact assessments was to provide an overview of prominent policy
areas that have been the subject of Government appraisal in order to inform where the look-up
tool may be usefully applied.
A sample of impact assessments were reviewed as part of the ‘Baseline Evaluation of
Environmental Appraisal and Sustainable Development Guidance’ study for Defra (eftec and
Cascade Consulting, 2014). This review was revisited and updated to include more recent impact
assessments. Overall, nearly 350 impact assessments were screened based on the coverage of
environmental impacts to produce a final list of 85 for the period 2008 - 2015. Impact assessments
with no clear relation to the environment (e.g. those related to the reduction of red tape in
implementing a policy) were screened out. A broad interpretation of “environmental impacts” was
used – based on Defra’s supplementary guidance - including ecosystem services, noise and other
disamenity impacts.
Overall, just over one-third of the 85 impact assessments that passed the screening phase were
from Defra (Table 2.1). This reflects the fact that Defra deals more closely with policies with
environmental impacts. Other departments with a notable number of impact assessments passing
the screening phase were DfT (13), DECC (9) and DCLG (8).
Table 2.1: Impact assessments review by Government department (2008 – 2015)
Government department/organisation No. impact assessments
Department for Business, Enterprise and Regulatory Reform (BERR) 1
Department for Business , Innovation and Skills (BIS) 1
Department for Communities and Local Government (DCLG) 8
Department for Culture, Media and Sport (DCMS) 3
Department for Energy and Climate Change (DECC) 9
Department for Environment, Food and Rural Affairs (Defra) 29
Department for International Development (DFID) 1
Department for Transport (DfT) 13
Foreign and Commonwealth Office (FCO) 2
Forestry Commission (FC) 4

Development of Look-Up Environmental Value Estimates Technical Report
eftec 7 October 2015
Government department/organisation No. impact assessments
Food Standards Agency (FSA) 4
Her Majesty’s Revenue and Customs (HMRC) 1
Home Office (HO) 3
Health and Safety (HSE) 2
Marine Management Organisation (MMO) 3
Ministry of Justice (MOJ) 1
Total 85
As part of the screening process, impact assessments were classified in terms of their treatment of
environmental impacts as shown in Table 2.2. In practice, most of the environmental impacts
across the sample were found to be ‘insignificant’, with few policies explicitly identified as having
impacts on the environment.
Table 2.2: Classification criteria for impact assessments
Treatment of environ-
mental impact(s) Description
Insignificant No reference to environmental impacts, but this is proportionate for the
case considered in the impact assessment.
Not covered
No reference to an environmental impact that could potentially be
deemed significant; i.e. that may be considered a possible outcome of a
policy. Hence it is unclear whether this was missed or considered not
sufficiently relevant to include.
Noted Environmental impacts are recognised, but no detail is given.
Described Environmental impacts are described in some detail in qualitative terms.
Measured The change in ecosystem service provision is quantified but not
monetised.
Monetised The change in ecosystem service provision is valued in monetary terms.
Table 2.3 presents an overview of how ecosystem service impacts deemed ‘significant’ were
treated within the impact assessments reviewed. In general, ‘marine’, ‘water’ and ‘waste’ policy
areas were found to have not covered environmental impacts most frequently. However as there
were no quotas set for different policy areas considered as part of the review, this finding may be
the result of ‘marine’, ‘water’ or ‘waste’ impact assessments being over-represented within the
sample considered.

Development of Look-Up Environmental Value Estimates Technical Report
eftec 8 October 2015
Table 2.3: Treatment of ‘significant’ impacts in reviewed impact assessments
Ecosystem service No. of impact assessments
Not
covered Noted Described Measured Monetised Total
Pro
vis
ionin
g
Food 4 12 1 0 1 18
Fibre and Fuel 0 0 0 0 3 3
Genetic Resources 4 6 0 0 2 12
Biochemicals, medicine/pharma. 1 2 0 0 0 3
Ornamental resources 0 0 0 0 0 0
Freshwater 7 4 0 0 1 12
Regula
ting
Air quality regulation 2 4 2 0 16 24
Climate regulation 2 5 5 0 13 25
Water regulation 4 6 3 0 1 14
Natural hazard regulation 1 2 3 0 1 7
Pest regulation 1 2 1 0 0 4
Disease regulation 1 9 2 0 3 15
Erosion regulation 0 2 1 0 0 3
Water purif. & waste treatment 8 5 2 0 1 16
Pollination 2 0 0 0 0 2
Cult
ura
l
Cultural heritage 7 11 2 1 1 22
Recreation and tourism 10 9 6 2 3 30
Aesthetic values 13 9 5 0 3 30
Support
ing
Soil formation 1 2 0 0 n/a 3
Primary production 0 0 0 0 n/a 0
Nutrient cycling 4 1 0 0 n/a 5
Water cycling 2 2 0 0 n/a 4
Photosynthesis 0 0 0 0 n/a 0
Total 74 93 33 3 49 252
Note: The classification of ecosystem services used here is consistent with the Defra ecosystem services guide (Defra, 2007).
The review of impact assessments also examined the ecosystem services most/least frequently
addressed and how the addressed ecosystem services were treated. Cultural services (e.g.
recreation, aesthetics) were found to be a key potential application for the EVL Tool. They were
both frequently missed and also the most likely to be noted and described in appraisals, but not
valued in monetary terms. Other frequently missing impacts included water purification and waste
treatment, and freshwater impacts. Food, genetic resources, water regulation, pollination, and
nutrient cycling impacts were missing within more than one impact assessments reviewed.
Impacts most likely to be monetised included air quality regulation and climate regulation,
reflecting the well-established guidance that is available for these topic areas (Defra, 2013; DECC,
2014). In general, these results align with those from the review of impact assessments in the
baseline evaluation of guidance study (eftec and Cascade Consulting, 2014), suggesting that ease of
access to environmental values is indeed a primary factor for their actual use in appraisals. Hence
despite there being a well-established evidence base for some types of environmental
impacts/ecosystem services (e.g. non-market recreation benefits), the absence of an easy to use
central reference point for analysts – particularly those outside of Defra – results in lower coverage
of these impacts in monetary terms than might be expected.

Development of Look-Up Environmental Value Estimates Technical Report
eftec 9 October 2015
2.2 User consultation
The user consultation phase of the study sought to understand the:
Varying levels of experience among analysts of the appraisal of environmental impacts;
Types of impacts they typically assess;
Types of impacts they have been able to value in monetary terms;
Types of impacts they have not been able to value in monetary terms; and
Reasons for not valuing impacts in monetary terms.
The consultation consisted of a combination of interviews with analysts from different Government
departments, as well as an online survey that was sent to previous interviewees from the ‘Baseline
Evaluation of Environmental Appraisal and Sustainable Development Guidance’ study and a wider
network of Government officials.
2.2.1 Interviews
The interviews undertaken to inform the baseline evaluation study were reviewed and summarised
in conjunction with 12 additional (telephone and in-person) interviews conducted in February and
March 2015. Individuals from the following Government departments and agencies were
interviewed:
Centre for Environment, Fisheries and Aquaculture (Cefas);
Department for Business, Innovation and Skills (BIS);
Department for Environment, Food and Rural Affairs (Defra);
Department for Transport (DfT);
Department of Communities and Local Government (DCLG);
Department of Energy and Climate Change (DECC);
Environment Agency (EA);
Food Standards Agency (FSA);
Forestry Commission (FC);
Health and Safety Executive (HSE); and
Natural England (NE);
A representative from the Royal Society for the Protection of Birds (RSPB) also participated in the
interviews, providing an external non-governmental organisation perspective.
The interviews focused on the barriers to quantifying and monetising environmental impacts and
recommendations for the EVL tool.
Table 2.4 provides a summary of the main themes in the feedback from interviewees. Overall, a
key barrier identified through the interviews was analysts’ lack of familiarity with the ecosystem
services framework. In particular, interviewees reported not being able to value environmental
impacts because the net impact of different policies/impacts could not be determined (i.e. the
impact of a policy relative to a baseline or counterfactual. An additional barrier identified in the
interviews undertaken as part of the baseline evaluation of guidance study (eftec and Cascade
Consulting, 2014) was that the existence and accessibility of carbon guidance hindered further
valuation because analysts thought they had covered environmental impacts if they had valued
carbon.

Development of Look-Up Environmental Value Estimates Technical Report
eftec 10 October 2015
Another significant barrier to valuing environmental impacts highlighted by interviewees was a lack
of both scientific and economic evidence. The examples given by interviewees are consistent with
the findings from Section 2.1, particularly as impact assessments categorised as ‘marine’ or ‘water’
were frequently found to have ‘missed’ environmental impacts.
Table 2.4: Feedback from interviews
Key points Feedback from interviewees
Screening out
impacts in ‘cross-
cutting’ policies
Environmental impacts associated with ‘cross-cutting’ policies tend to be difficult
to deal with.
Trade-offs between policies were also noted as posing difficulties when it came to
assessing environmental impacts such as water, litter and noise in the context of
the marine environment.
Analysts tend to focus on their area of expertise and screen out some negative
environmental impacts, covered by other policies, in lieu of a more integrated
approach to valuing environmental impacts.
Familiarity with the
ecosystem services
framework
A common reason for not valuing certain environmental impacts was linked to
analysts’ lack of familiarity with the concept of ecosystem services.
For some departments, the ecosystem services approach was not explicit in
working processes and presented a barrier to the valuation of environmental
impacts.
Certain environmental impacts are therefore not valued because the net impact
from different pressures and/or policies on ecosystem service provision is not
known or understood.
Lack of evidence
(scientific and
economic)
For many impacts, the link between the policy and the environmental impact was
deemed to be unclear particularly where a counterfactual or baseline scenario
needed to be defined (e.g. designation of MCZs, impacts on landscapes).
For impacts where the science is relatively more advanced, monetary evidence is
either available but not appropriate for the policy context or not available at all.
An example of the former is found in the context of marine policy where existing
data do not allow for a distinction between marine and terrestrial habitats. An
example of the latter was mentioned in a case where the option value of
groundwater needed to be valued but no suitable monetary evidence was
available.
Concerns with
proportionality of
effort
A key reason for not valuing certain impacts was indicated to be ‘proportionality’
of effort when undertaking appraisals. Generally judgements of ‘proportionality’
depend on precedents set within Government departments.
A lack of precedents (e.g. previous impact assessments) where environmental
impacts were valued, made analysts uncertain over how much effort to put into
valuing certain impacts.
Some interviewees stated that the default view was not to tackle such issues,
leading to an implicit ‘zero value’ for wider environmental benefits.
Recommendations
for the development
of the look-up tool
Interviewees were unanimous in saying that all indicative values need to be
accompanied by context-specific information from original source studies (e.g. in a
format consistent with the Defra value transfer guidelines).
The inclusion of caveats for the use of valuations was also noted as being a
necessary requirement for the look-up tool. In addition, it would be helpful for key
sensitivities to be set out to support sensitivity analysis in appraisals.
If an ‘uncertainty scale’ was included with the indicative values, this would need
to be explained in the user guide and user interface.
It was also noted that the look-up tool should make links to existing guidance to
avoid potential duplication (e.g. air quality guidance, carbon guidance, etc.).
One specific suggestion was to consider including an ecosystem services ‘checklist’
similar to the appraisal summary table used in the Environment Agency’s Water
Appraisal Guidance (Environment Agency, 2013). This would help ensure that users
are aware of the range of possible environmental impacts before selecting the
appropriate indicative value from the look-up tool.

Development of Look-Up Environmental Value Estimates Technical Report
eftec 11 October 2015
2.2.2 Survey responses
Over 100 individuals were contacted to take part in the online survey. In total, 16 responses were
received: 8 from economists, 4 from scientists, and 4 from policy advisors. The majority of
respondents were from the Environment Agency followed by Defra and the Joint Nature
Conservation Committee (JNCC). Due to the small sample size, responses are not assumed to be
representative of the breadth of potential users of the EVL Tool. Responses do, however, provide
insights that can be usefully combined with findings from the other scoping tasks. The summary of
findings from the online survey set out below are supplemented by the descriptive statistics
provided in Annex 1.
Respondents were asked to identify the environmental impacts that they had experience assessing,
as defined by Defra’s supplementary Green Book guidance. Further questions asked respondents to
detail whether they had monetised any of these impacts as well as which impacts they had tried
but had not been able to monetise. Respondents’ experiences ranged across different environment
impacts (see Annex 1; Table A1. 2):
60% had experience in assessing water quality, abstraction and flood risk;
50% had experience in assessing vulnerability to climate change, and biodiversity;
40% had experience in assessing landscapes; and
30% had experience in assessing waste management, air quality and noise pollution.
Monetary valuation of environmental impacts was highest for biodiversity, air quality, and
landscape impacts followed by vulnerability to climate change, water quality, abstraction and flood
risk. Waste management and noise pollution were the least monetised impacts by respondents.
Interestingly, of all the wider environmental impacts, respondents reported having the most
experience assessing biodiversity even though the majority indicated not being able to express
biodiversity impacts in monetary terms. This suggests that, while economic valuation evidence to
value biodiversity impacts exists, analysts may not be aware of this or how to use it in value
transfer applications, or it may be particularly policy/context specific.
Similarly, respondents were asked to provide feedback on the ecosystem service impacts that they
had experience assessing (Table A1.3). Generally, respondents had the most experience assessing
(all types of) cultural service impacts. This is somewhat contradictory to the findings from the
impacts assessment review, but may be explained due to the small survey sample size and range of
experience. Other experience by respondents included climate regulation, water regulation, and air
quality regulation, water purification and waste treatments, and water cycling.
Experience with the monetary assessment of ecosystem service impacts was highest for recreation.
This is in contrast to findings from the review of impact assessments where cultural services were
most likely to be noted and described in appraisals, but not valued in monetary terms. Survey
responses also indicated that air quality impacts were also frequently assessed in monetary terms,
as in the impacts assessment review. Respondents most frequently stated that they had not been
able to value other cultural and supporting ecosystem services. In general, though, there is a
relatively even spread across the different ecosystem services that respondents stated they were
not able to monetise.
Finally, respondents were asked to identify and/or specify the main reasons why they had not been
able to monetise certain ecosystem service impacts (Figure A1. 1). A lack of valuation evidence and
a lack of confidence in the robustness of evidence were the most commonly stated reasons for not
valuing environmental impacts in monetary terms. Other reasons included uncertainty over the

Development of Look-Up Environmental Value Estimates Technical Report
eftec 12 October 2015
scale of impact and a lack of scientific evidence. These findings are consistent with responses to
the consultation interviews.
2.3 Illustrative valuation contexts
Based on the scoping and consultation activities outlined in Sections 2.1 and 2.2, a set of
illustrative valuation contexts was identified to guide the task of compiling indicative values for the
EVL Tool. These contexts provide a guide on the types of appraisal contexts (e.g. scenarios) in
which indicative environmental values might be used, helping to frame the content and design of
the tool. They span multiple habitats including terrestrial and marine across provisioning,
regulating, cultural and supporting ecosystem services. They reflect the prominent policy areas
where analysts have either been undertaking economic valuation of environmental impacts or have
not been able to do so for various reasons. Note, however, that it follows that the identified
scenarios are indicative and do not represent an exhaustive list of all policy areas that need to be
assessed by Government analysts, or the breadth of economic valuation evidence requirements
associated with this.
Figure 2.1 maps these scenarios broken down by ecosystem service type (provisioning, regulating,
cultural or supporting) across the eight broad habitat types identified in the UK National Ecosystem
Assessment (UK NEA, 2011). Blank spaces/cells within the matrix are policy areas that were not
identified through the scoping and consultation tasks. As shown in Figure 2.1, some of the
identified scenarios cut across multiple ecosystem services and/or habitat types, with a few cutting
across either all ecosystem services or all habitat types such as “biodiversity”4. The interviews
conducted confirmed that the cross-cutting nature of some of these valuation contexts is an
understandable barrier to inclusion in impact assessments.
4 Biodiversity in particular represents a challenge for practical analysis in appraisals. This is a common theme that was reflected in the review of impact assessments, interviews and survey responses undertaken in this project. For further discussion see the accompanying biodiversity discussion paper, which reviews the valuation of biodiversity in a policy appraisal context.

Development of Look-Up Environmental Value Estimates Technical Report
eftec 13 October 2015
Figure 2.1: Valuation contexts identified in the scoping and consultation tasks1
NEA habitat type
Freshwater, wetlands &
floodplains
Coastal
margins Marine Woodland Enclosed farmland
Urban (green
space)
Semi-
natural
grasslands
Mountains,
moors &
heaths
Pro
vis
ionin
g
Wetland
creation
Fisheries Marine
Conservation
Zones
(MCZs)
Plant
health
Regula
ting
RBMPs2
Groundwater
remediation Air quality
Flood risk protection
Eutrophication
Diffuse pollution from agriculture Contaminated land and clean-up
Cult
ura
l
Landscapes
Recreation and tourism
Biodiversity
Loss of green space
Greening aspects of
agriculture
Support
ing
Soil quality improvements
Notes: 1Shading is used to ensure clarity of presentation. Dark (blue) shaded cells are valuation contexts that cut across either all habitat types of all ecosystem services (provisioning, regulating, cultural and supporting). Light (blue) shaded cells are valuation contexts that do not cut across all habitats or all ecosystem services. Blank spaces/cells within the matrix are valuation contexts that were not identified through the scoping and consultation tasks. They represent areas for further consideration in conducting the evidence review.2RBMPs: River Basin Management Plans.

Development of Look-Up Environmental Value Estimates Technical Report
eftec 14 October 2015
3. COMPILING INDICATIVE VALUES
The population of the database that underpins the EVL Tool is based on a review of the available
valuation evidence. The review of source studies was structured using a four-step process as
depicted in Figure 3.1.
Figure 3.1: Evidence review process
3.1 Screening valuation studies
The first step of the evidence review was to identify economic valuation studies through a review
of existing sources and literature. This included:
The EVRI (Environmental Valuation Reference Inventory) database5;
Habitat-specific chapters as part of the UK NEA (National Ecosystem Assessment);
Additional literature reviews as part of the UK NEA follow-on;
Publically available Government-funded research studies;
The Economics of Ecosystems and Biodiversity (TEEB) database (Van der Ploeg and de Groot;
2010);
Recent work from the Natural Capital Committee on building the economic case for investing
in natural capital (eftec et al., 2015); and
Existing Government guidance on valuing environmental impacts (e.g. DECC, 2014; Defra,
2011; etc.)6.
Available studies and evidence were organised based on the eight broad habitat types identified in
the UK NEA: (i) coastal margins; (ii) enclosed farmland; (iii) freshwater, wetlands and floodplains;
(iv) marine; (v) mountains, moors and heaths; (vi) semi-natural grasslands; (vii) urban (green
space); and (viii) woodland.
The screening task focused on primary valuation studies and relevant analyses (e.g. meta-analysis
studies) from the last 15 years (i.e. post-2000) 7. Whilst this is a relatively arbitrary cut-off point for
excluding older studies, it is intended to reflect the evolution in valuation methods and analysis
since the 1990s. Moreover, based on empirical evidence, roughly a 10 – 15 year horizon is a
reasonable limit for assuming that the underlying preferences that are captured in valuation studies
remain consistent and are therefore appropriate sources for value transfer8.
5 Screened valuation studies were cross-referenced against studies in the EVRI database (www.evri.ca) to determine any gaps in the evidence review. 6 In particular, the objective of evidence review was to identify existing Government guidance on valuing specific environmental impacts. The purpose of doing so was not to reproduce the guidance and valuations in the look-up tool. Rather, these are referred to in the look-up tool and User Guide and users are directed to the relevant guidance. 7 Value transfer (secondary) studies were considered for the purpose of identifying further source (primary valuation) studies from which unit values could be obtained. 8 Various sources in the economic literature have examined the validity and reliability of the ‘temporal transfer’ of environmental values. See for example: Loomis and White (1996); Brouwer and Bateman (2005); Brouwer (2006); Rolfe and Brouwer (2011); Bliem et al. (2012); Dupont and Price (2014); Brouwer and Logar (2014). Whilst findings are not unequivocal, the empirical evidence tends to suggest that individuals’ preferences for environmental quality improvements do not vary significantly over the short term. Over longer
1. Screening 2. Classification 3. Consolidation 4. Indicative values

Development of Look-Up Environmental Value Estimates Technical Report
eftec 15 October 2015
Finally, only UK studies (or meta-analyses including UK studies) were taken forward in the evidence
review. This criteria is based on Defra value transfer guidelines (eftec, 2010) and to ensure that
source studies reflect broader cultural constructs that influence environmental valuations, which
are not necessarily consistent across countries.
Error! Reference source not found. presents a summary of the scope of the evidence review in
terms of:
The number of studies identified through the evidence review;
The number of screened studies (UK relevant from 2000 onwards); and
The number of ‘classified’ studies that input to the look-up value tool (see Section 3.2).
The evidence review covers over 350 UK-relevant studies from 2000 onwards (excluding existing
Government guidance). The summary Table 3.1 provides a count of studies by habitat type; i.e. a
study that covers multiple habitat types is counted more than once. For this reason, the number of
identified, screened, and classified studies should not be summed and/or reported across habitat
types.
Table 3.1: Summary of scope of evidence review by habitat type1
Habitat type No. identified
studies No. screened
studies No. classified
studies
Enclosed farmland 56 13 7
Freshwater, wetlands and floodplains 46 32 8
Marine and coastal margins2 54 19 11
Mountains, moors and heaths 59 12 6
Semi-natural grasslands 55 12 6
Urban (green space) 29 11 4
Woodland 100 15 8
Note: Excludes existing Government guidance. 1A study that covers multiple habitat types is counted more than once; i.e. once for each relevant habitat type. 2For the purpose of the evidence review, valuation evidence for marine and coastal margins is combined because these two habitat types tend to be covered or discussed simultaneously in the literature. Indicative values are however presented separately for each habitat type in the look-up tool.
A full list of references for the set of screened studies is provided in Annex 2.
The evidence review and Table 3.1 provide some useful insights about the coverage of different
habitat types in the valuation literature:
Freshwater has the highest ratio of screened-to-identified studies compared to other habitat
types. This implies that, while there are relatively fewer freshwater studies than woodland
studies, for example, the former tend to be relatively recent and UK-focused. This likely
reflects the underlying policy context where the EU Water Framework Directive (WFD)
explicitly recognises the role of economic analysis in the implementation of water environment
quality targets. This has provided the stimulus for a number of research projects by academic
institutions and also required the development of valuation evidence to inform national and
waterbody level planning.
time periods real WTP (i.e. accounting for changes in the purchasing power of money) can change by statistically significant amounts, but this is primarily related to factors that constrain WTP in the shorter term (e.g. household income). The underlying economic factors that determine WTP are found to remain stable over the short – medium term. Around 10 years would be a reasonable interpretation of the ‘short – medium’ term.

Development of Look-Up Environmental Value Estimates Technical Report
eftec 16 October 2015
Enclosed farmland, marine and coastal margins habitats are not extensively covered in the
literature. For enclosed farmland, this finding is not unexpected given that provisioning
ecosystem services from this habitat type are captured in existing markets. For marine and
coastal margins, this is consistent with findings from research on coastal and marine ecosystem
services as part of the UK NEAFO (WP4b: Turner et al., 2014), which noted that the main gaps
in the literature were for biodiversity and seascape values (namely existence values).
Woodlands are well covered in the valuation literature, particularly with regards to the
provision of cultural services such as recreation and tourism. However, studies tend to be less
recent, which explains the number of screened studies for woodland being among the lowest.
Urban green space has the least number of identified studies and among the lowest number of
screened studies compared to other habitat types. This is likely explained by the fact that,
while there has been a growth in this area of research, it is still a relatively new field of
investigation with limited evidence especially at the UK level. Further, when quantitative
evidence does exist, it is often not in the form of transferable unit values given the spatially
dependent nature of benefits from urban green space. This is particularly the case given the
difficulty in explicitly establishing the contribution of green infrastructure when it is included
as part of larger regeneration schemes (Evans and Shaw, 2004; Tyler et al., 2013).
Semi-natural grasslands and mountains, moors and heaths are seemingly well covered in the
literature. However, very few studies pass the screening criteria which implies that studies
tend to be less recent and/or not UK-focused.
Overall, the evidence review suggests that key areas that may require further valuation effort to
build the evidence base include urban green space, which generates significant benefits due to its
proximity to beneficiary populations. In addition there are notable gaps with respect to mountains,
moors and heaths, which include sub-habitats such as peatland that provide important regulating
services, and semi-natural grasslands that can provide significant cultural ecosystem service
benefits among others (e.g. ‘landscape values’).
3.2 Classifying valuation studies
Following the screening phase of the evidence review, the subset of UK-relevant, post-2000 studies
were taken forward for potential inclusion in the EVL Tool database. These studies were
summarised in line with the Defra value transfer guidelines to capture the important contextual
factors that are shown as being important drivers of values that individuals place on environmental
changes. By summarising this information when compiling indicative environmental values, a
consistent basis is provided for presenting the valuation evidence and related information in the
EVL Tool database. As such, evidence is summarised in a way that is readily comparable to
appraisal contexts and can inform the decision-making process of users when choosing between
multiple indicative values. It also frames the appraisal analysis in a structure that is consistent with
the good practice principles set out in Defra’s value transfer guidelines, and hence provides a basis
for further detailed analysis if this is required (either through value transfer or primary valuation).
Annex 3 presents further detail on the structure for classifying studies, which uses a tabular format
to summarise the key contextual factors and information from the source studies. The structure (as
summarised in Table 3.2) is based on the value transfer criteria set out in eftec (2010).

Development of Look-Up Environmental Value Estimates Technical Report
eftec 17 October 2015
Table 3.2: Classification criteria for valuation studies
Broad habitat Habitat type(s) covered in the study based on the UK NEA habitat types
(see Section 3.1).
Environmental impact/
good
Environmental impact(s)/good(s) covered in the study based on the
classification of ecosystem services and impacts in the Defra ecosystem
services guide (Defra, 2007) and the supplementary guidance to the
Green Book on valuing environmental impacts (Defra, 2012)
respectively.
Value Low Valuation evidence provided by the study including ranges of values
that are driven by different factors including scenario analysis, types of
users, etc.
Central
High
Units The unit of the valuation(s). This information is needed when
aggregating values. For example using number of visits to a habitat type
to aggregate a £/visit value.
Method(s) Method(s) used in the study to estimate valuations.
Quality Covers the following:
Whether the valuation/policy context, the good and the change in
provision are described;
Whether the affected population is defined with accompanying
information on sampling; and
Whether the validity of results and their robustness (including
econometric analysis and validity testing) are discussed.
Definition of good Information about (dis)benefits provided by the broad habitat(s),
physical characteristics, and components of total economic value
measured.
Change in provision Qualitative and/or quantitative description of the change in terms of
nature, direction, timing and scale.
Location Specific geographical area (e.g. region, area of habitat, etc.)
Affected population User/non-user beneficiary population including size, patterns of use
and/or socio-economic profile.
Substitutes The number and quality of substitutes and whether they are accounted
for in the selected indicative value(s)
Market construct Whether the good is a private good, public good, etc.
Notes for value transfer Explains the robustness and use of the indicative value(s) in terms of
the limitations of method(s) and sampling of studies and applicability of
values across different locations and populations. Some guidance on
how values can be aggregated is also recorded including for the purpose
of more detailed value transfer, if required.
In moving from the screening of studies to classifying them for the purposes of the EVL Tool, a
degree of informed judgement has been applied. This has been guided by the scoping activities
described in Section 2 and good practice principles for valuation such as those set out in Defra’s
value transfer guidelines. In particular, greater emphasis has been placed on large-scale studies –
for example Government-funded research studies developed to inform practical policy decisions -
judged to have a reasonable degree of validity, robust results and that are widely used by
practitioners in the field. The latter point is partly confirmed by the interviews with Government
analysts and potential users of the tool. It is, however, noted that wide use of a study’s results is
not necessarily an endorsement of its validity or suitability for value transfer. Observations on the
coverage of the classified evidence base and its suitability for informing the look-up tool are
provided in Section 4.

Development of Look-Up Environmental Value Estimates Technical Report
eftec 18 October 2015
3.3 Consolidating valuation evidence
3.3.1 Overall approach
The final step in compiling indicative values consisted of 'consolidating' the valuation evidence to
produce one range of indicative values (high, central, low) for each combination of broad habitat
and environmental impact/good where valuation evidence exists. The resulting ‘indicative values’
that are presented in the EVL Tool should be interpreted as broad generalisations of the values that
have been observed for different environmental goods and impacts in the review of valuation
studies.
The need for the consolidation step arises from the structure of EVL Tool’s user interface which
requires users to select (i) the broad habitat followed by (ii) the environmental impact relevant to
their application, in order to obtain a range of indicative values for that particular combination9. In
this way, the consolidation of source evidence for populating the tool ensures that each
combination of broad habitat and environmental impact is associated with a single range of values.
The development of the user interface for the EVL Tool was subject to consultation and refined
through the user consultation (Section 2.2) and a pilot testing workshop that took place with
potential users on the structure of the look-up tool (June 2015).
For some valuations, the classification stage (Section 3.2) may be sufficient in preparing the values
for inclusion in the look-up tool; i.e. having one set of indicative values per environmental
impact/good. ‘Impact B’ in Figure 3.2 is an illustration of such a case where an impact is covered
by a single valuation ‘Study 3’, and no further consolidation of evidence is required.
Figure 3.2: Example of environmental impact requiring ‘consolidation’ of values
However, for impacts such as ‘impact A’ multiple valuations from different source studies exist,
and a further step is required involving the ‘consolidation’ of values. This additional step is needed
in the following cases:
1. Multiple studies cover the same impact and provide valuations in the same unit: for certain
habitat types there are multiple studies that estimate the benefits in the same per unit terms.
9 For further detail on the practical use of the EVL tool, refer to the accompanying User Guide document.
Study 1
Value(s) for
Impact A
Study 2
Value(s) for
Impact A
Study 3
Value(s) for
Impact B
Indicative
Values
Impact A
Indicative
Values
Impact B
Indication of the potential values for impact A
Indication of the potential values for impact B
Source studies EVL Tool
Development of Look-Up Environmental Value Estimates Technical Report
eftec 19 October 2015
A prime example is woodland recreation, where £ per visit values for both general and
specialist users are available from more than one valuation study (e.g. Scarpa, 2003; Christie et
al., 2006; Sen et al., 2014). These values can therefore be used to compile a range of indicative
values for recreational benefits from woodlands, such that lower end values reflect values for
general users and upper end values reflect values for specialist users. In this way, the evidence
from multiple studies is combined. Values within the range presented in the EVL Tool are not
calculated/averaged across these multiple studies; rather the range incorporates the variation
in values.
2. Multiple studies cover the same impact but provide valuations in different units: for
example, a given type of benefit (e.g. amenity value due to an increase in urban green space)
or dis-benefit may be covered by more than one classified study. ‘Consolidating’ values may
involve a simple comparison of values which requires the conversion of estimates to a common
unit (e.g. from £/household to £/ha). As in (1) above, each value within the range is still taken
from an individual study and values within a range are not calculated/averaged across multiple
studies.
For each set of indicative values representing a combination of broad habitat and environmental
impact, accompanying guidance notes are provided in the EVL Tool user interface to help steer
users in applying the appropriate value(s). This includes guidance on the interpretation of the range
of values presented. In particular, the selection within a range of a single (low, central, or high)
value depends on the key driver(s) of that range. In the example of woodland recreational benefits
in (1) above, the driver of the range of indicative values is the type of beneficiary population
(general vs. specialist recreation user). In this way, the range of values is not intended to be
applied in conventional sensitivity analysis using lower and upper bound values, but to help users
incorporate some context specific factors that are expected to influence unit values. This is
intended to reflect some of the good practice principles that are highlighted in Defra’s value
transfer guidelines, which highlights the limitation of analyses that do not control for context
specific factors in appraisals, such as location and scope of beneficiary populations.
All values reported in the EVL Tool are in 2014 prices. Valuations from source studies are inflated to
2014 prices using the Consumer Price Index (CPI)10 and are rounded to the nearest £10, £100,
£1,000, etc., depending on the order of magnitude of the source value.
3.3.2 Water environment valuation studies
A particular area of focus highlighted in the project specification is valuation evidence concerning
the quality of the water environment. This is due to the considerable evidence that exists in this
area due to the need for economic analysis in implementing water environment quality targets (see
Section 3.1).
The evidence review identified a range of valuation studies examining changes in water
environment quality. These include values from academic studies over the last 15 years (e.g.
Bateman et al., 2006, Ferrini et al., 2014; Hanley et al., 2006; Lawrence and Spurgeon, 2007;
10 The use of the CPI is consistent with the Green Book (2003) and the Defra value transfer guidelines (eftec, 2009). The Green Book states that “over a long-term period, the Bank of England’s annual inflation target is the appropriate measure of prices to use as a general deflator”. The inflation target of 2% is expressed in terms of an annual rate of inflation based on the CPI (see: http://www.bankofengland.co.uk/monetarypolicy/Pages/framework/framework.aspx). The Defra value transfer guidelines state that the “choice of index may be influenced by the type of policy good, for example non-market goods valued in terms of willingness to pay may be more reflective of consumer purchases, and hence the CPI is an appropriate index”.

Development of Look-Up Environmental Value Estimates Technical Report
eftec 20 October 2015
Rayment et al., 2014). Also included in the literature is the Environment Agency’s National Water
Environment Benefit Survey (NWEBS) (Nera Economic Consulting, 2007; Metcalfe, 2012).
Valuations in the literature tend to be expressed in different units, with most presented in
£/household/year terms for a defined improvement in the water environment at a specific site or
set of locations. The exception is the NWEBS catchment values that have been converted to in
£/km/year terms for rivers and £/km2/year for lakes, coastal water and transitional waters, in
order to support economic analyses that underpin implementation of the Water Framework
Directive via RBMPs.
As part of the evidence review consolidation task, broad comparisons were drawn between the
range of potential source studies included in the EVL Tool. In particular, the NWEBS catchment
values were compared to studies by Bateman et al. (2006), Ferrini et al. (2014); Hanley et al.
(2006); Lawrence and Spurgeon (2007) and Rayment et al. (2014). The studies reflect a variety of
changes in water environment quality in different locations for both users and non-user population.
Using readily available information – either reported in the studies, or sourced separately,
valuations were converted to £/km/hh/year terms to provide a ready comparison to the NWEBS
values. Household population information provided by the Environment Agency was used to convert
the NWEBS catchment values also to £/km/hh/year terms. An example of the comparison is
provided in Table 3.3.
Table 3.3: Comparing water environment valuation studies
Data used Hanley et al. (2006) NWEBS - Wear Catchment
(Metcalfe, 2012)
Unit values Improvement in water body status
from ‘fair’ to good status*:
approx. £30/hh/yr
Moderate to good status:
approx. £24.8k/km/yr
Poor to good status:
approx. £46.1/km/yr
Supporting information Length of River Wear: 96 km Beneficiary population:
Approx. 891,000 (no. household
within 30 miles)
Converted unit values Approx. £0.3/km/hh/yr
[Calculation: unit value / river length]
Moderate to good status:
approx. £0.03/km/hh/yr
Poor to good status:
approx. 0.05/km/hh/yr
[Calculation: unit value /
beneficiary population]
Notes: Values are reported in 2014 prices. Hh = household. Yr = year. *: as described in the study.
Figure 3.3 provides a comparison across the potential source studies. In all cases, the converted
unit values (blue data points) are an order of magnitude higher than the NWEBS values (red data
points) for the relevant catchment.

Development of Look-Up Environmental Value Estimates Technical Report
eftec 21 October 2015
Figure 3.3: Comparison of water environment valuations
Source studies: 1 = Bateman et al. (2006) (Tame Anker and Mease); 2 = Ferrini et al. (2014) travel cost estimate (Aire and Calder); 3 = Ferrini et al. (2014) contingent valuation payment card estimate (Aire and Calder); 4 = Ferrini et al. (2014) contingent valuation dichotomous choice estimates (Aire and Calder); 5 = Hanley et al. (2006) (Wear); 6 = Laurence and Spurgeon (2007) (Derwent (NW); North West Wales; Test and Itchen; Medway; Mersey Estuary; Ribble; Severn Vale; South East Valleys; South West Wales; Maidenhead to Sunbury; Wye; Wyre); 6 = Rayment et al. (2014) (Louth Grimsby and Ancholme; Medway; Maidenhead to Sunbury). WTP = willingness to pay. Hh = household. Yr = year.
The comparison illustrated in Figure 3.3 is limited, since it does not control for various factors that
influence water environment valuations (e.g. scope of improvement, availability of substitutes,
characteristics of beneficiary populations), nor differences in study methodology. However, it does
illustrate that further analysis is required to reconcile the current evidence base concerning water
environment values. As a pragmatic response, the EVL Tool reports the national average NWEBS
values in order to ensure consistency with the valuation evidence that underpins RBMPs11. Users of
the tool are recommended to contact the Environment Agency for further guidance in applying
NWEBS values in appraisals.
3.4 Coverage of indicative values in the EVL Tool Overall, the EVL Tool includes approximately 40 indicative values. In addition to these, there are
approximately 40 entries that relate to environmental impacts covered by existing Government
guidance (e.g. climate regulation, air quality regulation, etc.). An overview of the current coverage
of the EVL Tool is presented in Figure 3.4. The figure reflects how environmental impacts
(provisioning, regulating, cultural) are covered across different broad habitats. Note that
supporting ecosystem services are not covered in the tool as they constitute intermediate rather
than final ecosystem services which, when valued with other final services, can lead to double
counting of environmental impacts.
11 A potential update of the indicative values would be to specify ‘rural’ and ‘urban’ values for the EVL Tool, based on NWEBS. In particular scope of beneficiary population is a key driver of the NWEBS values and it would be desirable to reflect this sensitivity in the EVL Tool indicative values if possible.

Development of Look-Up Environmental Value Estimates Technical Report
eftec 22 October 2015
Figure 3.4: Overview of indicative values in the EVL Tool
Note: Supporting ecosystem services are not covered in the EVL Tool as they constitute intermediate rather than final ecosystem services which, when valued with other final services, can lead
to double counting of environmental impacts.
Urban Woodland Enclosed farmland Semi-natural grasslandsMountains, moors &
heathsFreshwater Coastal margins Marine
Pro
vis
ionin
gRegula
ting
Cult
ura
lSupport
ing
Bundled ecosytemservice provision
Food
Amenity value (local environmental amenity, recreation, cultural)
Biomass
Food
Recreation
Water environment quality
Local environmental amenity (noise, litter, disturbance)
Fibre and fuel
Air quality
Climate regulation
Bundled ecosystemservice provision
Flood risk regulation
Human health impacts

Development of Look-Up Environmental Value Estimates Technical Report
eftec 23 October 2015
Figure 3.4 can be compared to the range of ecosystem services that are provided by habitat types
as presented in the UK NEA (2011)12. This comparison highlights the following gaps in the coverage
of the look-up tool:
Provisioning services for urban green space; mountains, moors and heaths; coastal margins are
not covered by evidence in the tool. For urban green space, for example, this relates to the
provision of trees and fresh water. Overall though, most provisioning services can be valued
using market prices which feature in the EVL Tool (e.g. for enclosed farmland, semi-natural
grasslands, woodland, etc.).
Regulating services including pest regulation; waste regulation; pollination are not covered by
evidence in the tool. This gap is due to a lack of evidence, which warrants further research
given the importance of these ecosystem services across all habitat types.
12 See Figure 5 in UK NEA (2011: 11) on the ‘relative importance of Broad Habitats in delivering ecosystem services and overall direction of change in service flow since 1990’.

Development of Look-Up Environmental Value Estimates Technical Report
eftec 24 October 2015
4. CONCLUSIONS AND RECOMMENDATIONS
4.1 Summary
A lack of readily available environmental values is a recognised gap in the current guidance that
supports the appraisal of environmental impacts in policy analyses. Whilst the key concepts and
principles that underpin the valuation of environmental impacts are well-documented, the
supplementary technical guidelines that are available for more detailed analyses (e.g. value
transfer and primary valuation studies) can serve as a barrier to ‘entry-level’ use of environmental
values. This is particularly the case where appraisal requires an initial screening or brief assessment
of environmental costs and benefits to establish the possible scale of costs and benefits.
The development of the Environmental Value Look-up (EVL) Tool addresses this gap. The tool is
intended to be used in the initial assessment of environmental impacts in an appraisal,
complementing – and not replacing – the option for more detailed analysis through formal valuation
methods. In effect, the tool can help analysts in moving from taking no account for environmental
impacts in monetary terms, to a point from which better informed decisions can be made about the
level of appraisal effort that is warranted for environmental impacts in a given assessment.
The task of developing the EVL Tool has sought to draw on the experiences and views of analysts
across Government departments and agencies. The feedback from this exercise demonstrates that
the potential use of the indicative environmental values spans a diverse set of policy contexts,
covering the breadth of broad habitat types (terrestrial and marine) and the range of provisioning,
regulating, and cultural ecosystem services. A key theme in the feedback received has been the
challenge faced in the valuation of cross-cutting impacts. Multiple factors contribute to this
situation, including lack of familiarity with underpinning valuation concepts, availability of suitable
valuation evidence, and low confidence in the robustness of the available evidence. Indicative
environmental values made available through an entry-point such as the EVL Tool can overcome
these challenges to some extent by making environmental valuations readily useable in a consistent
manner.
It is important, however, to ensure that evidence compiled for the EVL Tool is done so in a reliable
way, and that the caveats concerning the use of indicative environmental values in appraisal are
clearly communicated and factored into subsequent decision-making. In developing the EVL Tool
the approach taken has been to align the evidence review with established principles for value
transfer. This gives a systematic basis for compiling source valuations and means that use of the
tool can also facilitate the scoping of more detailed assessments of environmental impacts, should
this be required.
More fundamental challenges do, though, remain. In particular, in relation to the treatment of
biodiversity in policy analyses. This issue is examined in detail in the accompanying discussion
paper, which highlights the complexities faced, the difficulty in applying valuation methods to
produce robust valuations, and the limited nature of the UK-focused evidence as a consequence.
The paper concludes that, at present, it is not appropriate to incorporate indicative values
specifically for biodiversity in the EVL Tool13. In the main, the available evidence does not lend
itself to being interpreted and presented in the broadly generalised format that the EVL tool
13 Note that - as highlighted in the biodiversity discussion paper - the contribution of biodiversity to final
ecosystem goods and services is expected to be captured in the value of these goods and services. Hence this aspect of biodiversity can be assumed to be incorporated within the relevant indicative values in the EVL Tool. For example, within values for single ecosystem services such as recreational benefits, and also values that reflect bundles of services from particular habitats (e.g. coastal margins).

Development of Look-Up Environmental Value Estimates Technical Report
eftec 25 October 2015
adopts. More considered analysis is required when valuing biodiversity – particularly as a cross-
cutting impact – which at the very minimum implies that formal value transfer approaches should
be applied, and even these may not be sufficient if available evidence does not permit for
appropriate assessment of spatial factors. In this respect, the EVL Tool includes a list of existing
biodiversity valuation studies (in the ‘Biodiversity Values’ tab) as an entry point for users to identify
potentially suitable studies to take forward in more detailed value transfer analysis.
Overall, the development of the database of indicative values for the EVL Tool is the product of the
four-step process to review the current evidence base and compile valuations: (i) screening; (ii)
classification; (iii) consolidation; and (iv) indicative values. Careful application is required when
using the tool in practice. This is due to the inevitable uncertainty associated with taking source
valuations and applying them in a ‘generalised’ way. The User Guide that accompanies the EVL Tool
addresses these points of concern by highlighting the policy and appraisal contexts in which
indicative values can be applied, drawing on the supplementary guidance on valuing environmental
impacts (HM Treasury and Defra, 2012). The guide also covers the interpretation of indicative
values in decision-making and how to present results in line with good practice points; e.g. from
Defra’s value transfer guidelines (eftec, 2009). Worked examples are also provided to illustrate the
practical use of the tool. Hence the User Guide is an essential point of reference for users of the
EVL Tool to ensure its appropriate use.
4.2 Findings
Key findings from the tasks undertaken to develop the EVL Tool include:
Barriers to valuing environmental impacts: the main barriers faced by analysts relate to
understanding and interpreting the various existing frameworks (e.g. ecosystem services, wider
environmental impacts, etc.) that are described in current guidance. The volume of guidance
and the level of technical detail is an obstacle to ‘non-specialists’ attempting to value
environmental impacts.
Gaps in valuation evidence: key areas that may require further valuation effort to support the
use of indicative values include urban green space, mountains, moors and heaths, and semi-
natural grasslands; as well as regulating ecosystem services (e.g. pest regulation, waste
regulations, pollination) across the majority of UK NEA habitat types. Fewer valuations are also
evident for broader cultural services that are supported by these habitats, including those that
may be represented as ‘landscape values’.
Applying indicative environmental values in ecosystem accounting: following the
conclusions in the accompanying ecosystem accounting discussion paper, a potentially
important area for research may be to test the ‘simulated exchange value’ approach using
practical examples. More generally, there are multiple issues to explore regarding selecting
valuations for use in flow and asset accounts, such as the actual and likely uses of the accounts
and their interpretation by users and stakeholders. Regarding the latter issue, if there is
indeed confusion between welfare-based analyses (such as CBA for projects and investments)
and exchange value-based accounts, then the risk of damage to decision-processes should be
considered as part of the exploration of these issues in the future.
High level (top-down) ecosystem accounting exercises are potentially a suitable candidate for
the use of indicative values. Here more emphasis may be placed on understanding the scale of
values in terms of the order of magnitude and tracking these over time; an objective that
could be supported by the use of indicative values. Conversely, if considerable effort is to be

Development of Look-Up Environmental Value Estimates Technical Report
eftec 26 October 2015
expended on developing ecosystem accounts at the national level, then the evidence base for
these accounts might be an ideal source of indicative values (in the future) for use in other
accounting hierarchies (e.g. protected area accounts, corporate accounts, etc.) and in some
appraisals. This is contingent though on resolving/clarifying the exchange value versus welfare
value issue in a way that renders the values relatively compatible.
Valuing biodiversity: further research effort is required to integrate the understanding of the
role of biodiversity in contributing to human wellbeing in a workable approach for practical
policy analyses. More valuation effort is also required to produce robust biodiversity valuation
evidence for use in appraisals, particularly via value transfer analysis. Any new evidence that
is developed will need to be reconciled with existing evidence for other non-biodiversity
impacts to disentangle impacts and ensure that double-counting of biodiversity values is
avoided. Whether this evidence can eventually be included in the EVL Tool or as a separate
database in the future should also be explored.
Further consideration is also required with regard to cost-based biodiversity valuations based
around policy targets. While a key concern is the insensitivity of cost-based approaches to
spatial contexts at local scales, fundamentally the issue of concern is that the relationship
between cost- and welfare-based values is not clear even though the former are intended to
be proxies of the latter. This represents a significant conceptual barrier for the general use of
cost-based values outside of target-based policy. Hence it is evident that a formal policy-led
target-based approach is needed for justifying the use of cost-based measures.
An alternative approach of developing large-scale land use optimisation modelling such as TIM
(Bateman et al. 2014) should be examined as a longer term solution. Whilst not currently a
viable proposition, developments in the short term (e.g. the next five years) could lead to the
use of such models to develop regionally-specific sets of (shadow) values for different kinds of
biodiversity/land-use change (based on the opportunity costs of constraints in the models).
Conceivably these can also take account of some local features, such as beneficiary
populations and substitute sites, and therefore address concerns regarding the spatial context.
The values would require periodic updating but could allow relatively straightforward
estimation of values of changes to ecosystem extent and condition based on actual UK land-use
and the services modelled.
With regards to the EVL Tool, the current conclusion is that where biodiversity is a critical
impact/component of a policy or project, a formal value transfer analysis should be the
starting point for an appraisal (rather than using the tool). A list of UK-based source studies
that value changes in biodiversity is provided in the EVL Tool. The task should be to review
existing evidence in line with good practice principles in order to determine whether current
value evidence can appropriately adapted for the appraisal context being assessed.
4.3 Recommendations
In conclusion, a number of recommendations are outlined with respect to the practical use of the
EVL Tool:
Review current appraisal guidance: the EVL Tool is an ‘entry-point’ for the valuation of
environmental costs and benefits. However current supplementary appraisal guidance appears
to present some barriers to analysts. For the EVL Tool to be effective in increasing the
practical use of environmental values in Government appraisals the route to using the tool
must be clear, allowing users to circumvent (non-essential) technical guidance. Links and

Development of Look-Up Environmental Value Estimates Technical Report
eftec 27 October 2015
pathways between current guidance should be mapped in a concise fashion and this ‘route
map’ should be the first document that analysts encounter.
Develop further practical appraisal tools for specific environmental impacts: the EVL Tool is
database that provides a central reference point for indicative environmental values. There is
scope for improving the valuation evidence base in several specific policy areas and these
developments could then be used to update the evidence included in the tool. This may be the
case for recreation where the evidence base is relatively richer and where current estimates
capture the benefits derived by various types of users across most habitat types. Hence there
is scope to further consolidate this evidence in a more systematic way than currently done so
for the EVL Tool (e.g. via meta-analysis/transferable function). There may also be a case for
developing a valuation tool relating to the water environment. Continued implementation of
the WFD suggests the need to update the current valuation evidence that is available; this will
likely require further primary valuation but the research could be undertaken in a way that
also yields indicative values that could be applied more generally outside of formal water
environment planning appraisals.
Maintaining and updating the EVL Tool: the tool should be periodically updated to ensure its
relevance and functionality with respect to intended users. In doing so, consideration should
be given to continuing consultation with users of the tool to gain live feedback and log ‘lessons
learnt’ over time. Basic updates to the tool should include updating the price base on a yearly
basis, and dealing with minor feedback from users of the tool (e.g. fixing bugs, adding
references to the ‘Useful Links’ tab, etc.). More substantive updates to the tool will also be
required such as incorporating new valuation evidence as it becomes available. This is
particularly relevant for areas where there are currently gaps in the evidence base. In this
respect, it may be appropriate to tie-in updates of the tool with wider valuation evidence
updates, such as continuing to contribute to the EVRI database (which essentially is a
complementary task).
Availability of the EVL Tool: the tool and User Guide should be made widely available for
applications beyond policy appraisals. It potentially provides an entry-point for environmental
valuation in a number of contexts both with Government and beyond. There will be
opportunities for organisations to adapt the tool and database for use in their own assessment
contexts (e.g. investment appraisals and corporate natural capital accounts); for example by
providing their own supplementary guidance for using indicative values, or by using the format
to summarise their own valuation evidence.

Development of Look-Up Environmental Value Estimates Technical Report
eftec 28 October 2015
GLOSSARY
Biodiversity: the variability among living organisms from all sources including, inter alia,
terrestrial, marine and other aquatic ecosystems and the ecological complexes of which they are
part, this includes diversity within species, between species and ecosystems (Convention on
Biological Diversity, Article 2).
Broad habitat: a means of classifying the natural environment. There are eight broad habitats
based on the UK NEA (2011). These include: (i) coastal margins; (ii) enclosed farmland; (iii)
freshwater, wetlands and floodplains; (iv) marine; (v) mountains, moors and heaths; (vi) semi-
natural grasslands; (vii) urban (green space); and (viii) woodland.
Consumer Price Index (CPI): The CPI is a measure of consumer price inflation. It is the inflation
measure used in the Government’s target for inflation. The CPI is also used for purposes such as
uprating pensions, wages and benefits and can aid in the understanding of inflation on family
budgets (ONS, 2013).
Cost-benefit analysis: a decision-making tool that compares costs and benefits of a proposed policy
or project in monetary terms.
Economic appraisal: the process of defining objectives, examining options and weighing up the
costs benefits, risks and uncertainties of proposed polices, programmes or projects before a
decision is made.
Ecosystem accounting: an integrated approach to the assessment of the environment through the
measurement of ecosystems, and measurement of the flows of services from ecosystems into
economic and other human activity (SEEA, 2012).
Ecosystem services: a term that is used to describe a framework for analysing how human
populations are dependent upon the condition of the natural environment. The approach explicitly
recognises that ecosystems and the biological diversity contained within them contribute to
individual and social wellbeing.
Environmental Valuation Reference Inventory (EVRI): a database of economic valuation evidence
(i.e. secondary evidence) for value transfer applications.
Impact assessment: a process to help policy-makers think through fully and understand the
consequences of possible and actual government interventions in the public, private and third
sectors; and a tool to enable the Government to weigh and present the relevant evidence on the
positive and negative effects of such interventions, including by reviewing the impact of policies
after they have been implemented (Department for Business Innovation and Skills, 2015).
Proportionality: the appropriate level of resources to invest in gathering and analysing data for
appraisals and evaluations (Department for Business Innovation and Skills, 2015).
Value transfer: process by which readily available economic valuation evidence is applied in a new
context for which valuation is required.

Development of Look-Up Environmental Value Estimates Technical Report
eftec 29 October 2015
REFERENCES
Bateman, I.J., Cole, M.A., Georgiou, S., Hadley, D.J. (2006) "Comparing contingent valuation and
contingent ranking: A case study considering the benefits of urban river water quality
improvement," Journal of Environmental Management, vol. 79, pp.221-231
Bateman, I., Day, B., Agarwala, M., Bacon, P., Baďura, T., Binner, A., De-Gol, A., Ditchburn, B.,
Dugdale, S., Emmett, B., Ferrini,S., Carlo Fezzi, C., Harwood, A., Hillier, J., Hiscock, K., Hulme,
M., Jackson, B., Lovett, A., Mackie, E., Matthews, R., Sen, A., Siriwardena, G., Smith, P.,
Snowdon, P., Sünnenberg, G., Vetter, S., & Vinjili, S. (2014) UK National Ecosystem Assessment
Follow-on. Work Package Report 3: Economic value of ecosystem services. UNEP-WCMC, LWEC, UK.
Bliem, M.; Getzner, M.; and Rodiga-Laβnig, P. (2012). Temporal stability of individual preferences
for river restoration in Austria using a choice experiment. Journal of Environmental Management,
103, pp. 65 - 73.
Brouwer, R. (2006). Do stated preference methods stand the test of time? A test of the stability of
contingent values and models for health risks when facing an extreme event. Ecological Economics,
60, pp. 399 – 406.
Brouwer, R. and Bateman, I. (2005). Temporal stability and transferability of models of willingness
to pay for flood control and wetland conservation. Water Resources Research, 41(3), pp. 1 - 6.
Brouwer, R. and Logar, I.L. (2014). Do choice experiments produce more stable welfare measure
than contingent valuation? A test-retest. Fifth World Congress of Environmental and Resource
Economists. June 28 - 2 July 2014.
Christie, M., Hanley, N., Garrod, B., Hyde, T., Lyons, N., Bergmann, A., & Hynes, S. 2006, Valuing
Forest Recreation Activities: Final Phase 2 Report. Forestry Commission: Edinburgh
Department for Business Innovation and Skills (2015), Better Regulation Manual: Practical Guidance
for UK Government Officials.
https://www.gov.uk/government/uploads/system/uploads/attachment_data/file/421078/bis-13-
1038-Better-regulation-framework-manual.pdf [Accessed August 2015].
Department for Energy and Climate Change (DECC) (2014). Valuation of energy use and greenhouse
gas emissions, supplementary guidance to the HM Treasury Green Book on Appraisal and Evaluation
in Central Government.
https://www.gov.uk/government/publications/valuation-of-energy-use-and-greenhouse-gas-
emissions-for-appraisal [Accessed July 2015].
Department for Environment, Food and Rural Affairs (Defra) (2007) An introductory guide to valuing
ecosystem services.
https://www.gov.uk/government/uploads/system/uploads/attachment_data/file/191502/Introduc
tory_guide_to_valuing_ecosystem_services.pdf [Accessed October 2015].
Department for Environment, Food and Rural Affairs (Defra) (2013). Valuing Impacts on Air Quality:
Supplementary Green Book Guidance.
https://www.gov.uk/government/uploads/system/uploads/attachment_data/file/197893/pu1500-
air-quality-greenbook-supp2013.pdf [Accessed October 2015].

Development of Look-Up Environmental Value Estimates Technical Report
eftec 30 October 2015
Department for Environment, Food and Rural Affairs (Defra) (2014) Invitation to Tender: Tender for
Development of ‘look-up’ environmental value estimates for initial appraisal within cost- benefit
analysis. Tender Reference: BE0111.
Department for Transport (2013) Value for Money Assessment: Advice Note for Local Transport
Decision Makers.
https://www.gov.uk/government/uploads/system/uploads/attachment_data/file/267296/vfm-
advice-local-decision-makers.pdf [Accessed October 2015].
Department for Transport (DfT) (2014). WebTAG: TAG data book – November 2014.
https://www.gov.uk/government/uploads/system/uploads/attachment_data/file/381897/TAG_dat
a_book_Autumn_2014__FINAL_v1.3b___1_.xls [Accessed October 2015].
Dupont, D. and Price, J. (2014). Temporal stability of water quality values across stated preference
question formats. Fifth World Congress of Environmental and Resource Economists. June 28 - 2 July
2014.
Evans, G., Shaw, P. (2004). The contribution of culture to regeneration in the UK: a review of
evidence. A report to the Department for Culture Media and Sport.
eftec (2009). Valuing Environmental Impacts: Practical Guidelines for the Use of Value Transfer in
Policy and Project Appraisal. Report for the Department for Environment, Food and Rural Affairs.
https://www.gov.uk/government/uploads/system/uploads/attachment_data/file/182376/vt-
guidelines.pdf [Accessed October 2015].
eftec (2010a). Flood and coastal erosion risk management: Economic valuation of environmental
effects. Handbook for the Environment Agency for England and Wales.
eftec (2015a). Applying values in ecosystem accounting. Final discussion paper to Defra.
eftec (2015b). Valuing biodiversity. Final discussion paper to Defra.
eftec and Entec (2001). Valuing the External Benefits of Undeveloped Land: Main Document. Final
report for the Department for Communities and Local Government (DCLG).
eftec & Cascade Consulting (2014). Baseline Evaluation of Environmental Appraisal and Sustainable
Development Guidance Across Government. Final report for Department for Environment, Food and
Rural Affairs.
http://randd.defra.gov.uk/Document.aspx?Document=11937_131003_ERG1222_Appraisals_Final_20
14_03_07.pdf [Accessed October 2015]
eftec, CEH, ABPmer and Regeneris Consulting (2015). Developing Economic Evidence on the Costs
and Benefits of Investing in Natural Capital.
http://nebula.wsimg.com/8755553ec25d9cd0dc9407fa5e4aa408?AccessKeyId=68F83A8E994328D64D
3D&disposition=0&alloworigin=1 [Accessed October 2015].
Ferrini, S., Schaafsma, M., and Bateman, I. (2014) Revealed and stated preference valuation and
transfer: A within-sample comparison of water quality improvement values, Water Resources
Research, Vol. 50, No. 6.

Development of Look-Up Environmental Value Estimates Technical Report
eftec 31 October 2015
Hanley, N., Wright, R. E., & Alvarez-Farizo, B. (2006). Estimating the economic value of
improvements in river ecology using choice experiments: an application to the water framework
directive. Journal of environmental management, 78(2), 183-193.
HM Treasury. (2003). The Green Book: Appraisal and Evaluation in Central Government. London:
HM Treasury.
HM Treasury and Department for Environment, Food and Rural Affairs (2012). Accounting for
environmental impacts: Supplementary Green Book guidance.
https://www.gov.uk/government/uploads/system/uploads/attachment_data/file/191500/Accounti
ng_for_enviornomental_impacts.pdf [Accessed October 2015].
Landers, D.H, and Nahlik, A.M. (2013). Final Ecosystem Goods and Services Classification System
(FEGS-CS). EPA/600/R-13/ORD-004914. U.S. Environmental Protection Agency, Office of Research
and Development, Washington, DC.
Lawrence, K.S., and Spurgeon, J. (2007) ‘Economic evaluation of inland fisheries: Welfare benefits
of inland fisheries in England and Wales – Science Report’, Environment Agency: Bristol, UK.
Loomis, J.B. and White, D.S. (1996). Economic benefits of rare and endangered species: summary
and meta-analysis. Ecological Economics, 18, pp. 197 – 206.
Metcalfe, P.J. (2012) "Update of CRP WFD Benefit Value - Economic Component," report for the Environment Agency.
Millennium Ecosystem Assessment (MEA), 2005. Ecosystems and Human Well-being: General
Synthesis. Island Press, Washington, DC.
NERA Economic Consulting (2007). The Benefits of Water Framework Directive Programmes of
Measures in England and Wales. Final report to Defra.
Office for National Statistics (ONS) (2013). Consumer price indices: a brief guide.
http://www.ons.gov.uk/ons/guide-method/user-guidance/prices/cpi-and-rpi/consumer-price-
indices--a-brief-guide.pdf [Accessed October 2015].
Office for National Statistics (ONS) and Department for Environment, Food and Rural Affairs (Defra)
(2014). Principles of Ecosystem Accounting. http://www.ons.gov.uk/ons/guide-method/user-
guidance/natural-capital/related-publications/principles-of-ecosystems-accounting.pdf [Accessed
October 2015].
Rayment, M.; Conway, M.; Bartrakova, S.; McNeil, D.; Christie, M.; and Remoundou, K. (2014)
"Estimating the Impact on Public Benefits from Changes in Investment in the Environment Agency
Waterways: Final Report" Submitted by ICF GHK
Rolfe, J. and Brouwer, R. (2011). Testing for value stability with a meta-analysis of choice
experiments: River health in Australia. Australian National University, Environmental Economics
Research Hub.
Scarpa, R. (2003) "The recreation value of Woodlands". Report for the Forestry Commission

Development of Look-Up Environmental Value Estimates Technical Report
eftec 32 October 2015
SEEA (2012) Experimental Ecosystem Accounting, System of Environmental-Economic Accounting
2012, European Commission, Organisation for Economic Co-operation and Development, United
Nations, World Bank, 2013.
Sen, A., Harwood, A. R., Bateman, I. J., Munday, P., Crowe, A., Brander, L., Raychaudhuri, J.,
Lovett, A.A., Foden, J. & Provins, A. (2014). Economic assessment of the recreational value of
ecosystems: Methodological development and national and local application. Environmental and
Resource Economics, 57(2), 233-249.
Turner, K., Schaafsma, M., Elliott, M., Burdon, D., Atkins, J., Jickells, T., Tett, P., Mee, L., van
Leeuwen, S., Barnard, S., Luisetti, T., Paltriguera, L., Palmieri, G., & Andrews, J. (2014) UK
National Ecosystem Assessment Follow-on. Work Package Report 4: Coastal and marine ecosystem
services: principles and practice. UNEP-WCMC, LWEC, UK.
Tyler, P., Warnock, C., Provins, A., and Lanz, B. (2013). Valuing the Benefits of Urban
Regeneration. Urban Studies. Volume 50, Issue 1.
UK National Ecosystem Assessment (2011). The UK National Ecosystem Assessment: Synthesis of the
Key Findings. UNEP-WCMC, Cambridge.
Van der Ploeg, S. and R.S. de Groot (2010) The TEEB Valuation Database – a searchable database of
1310 estimates of monetary values of ecosystem services. Foundation for Sustainable Development,
Wageningen, The Netherlands.
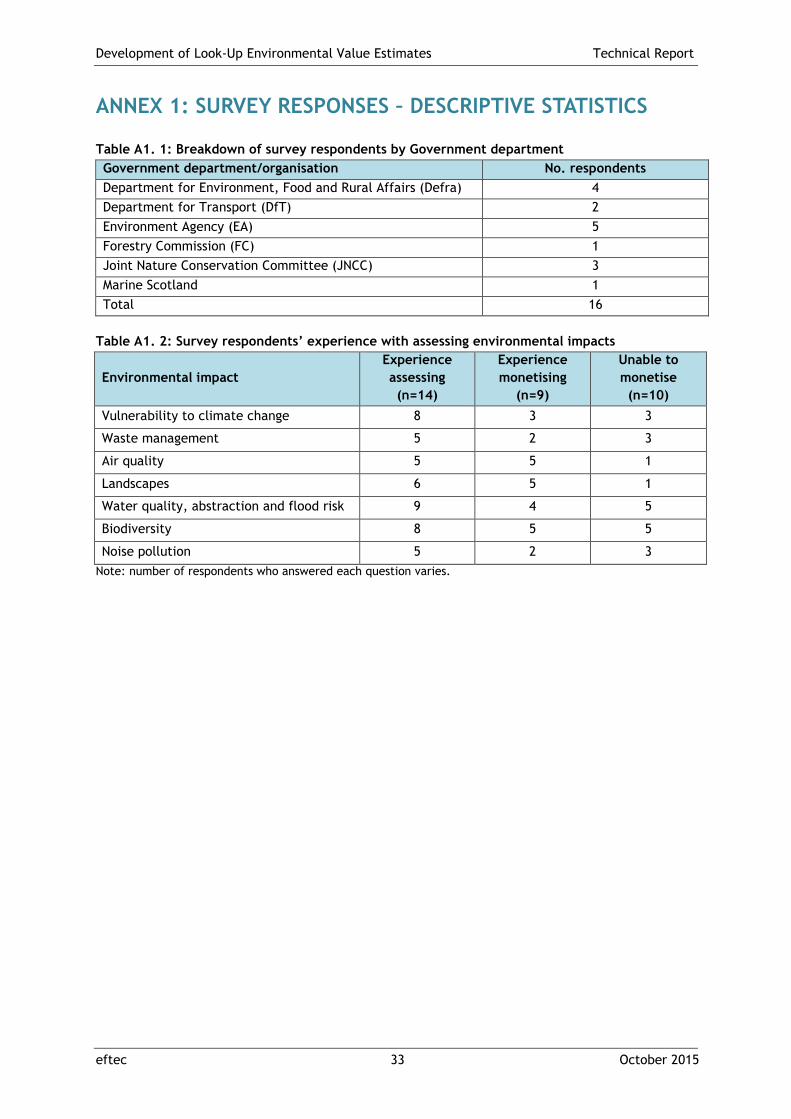
Development of Look-Up Environmental Value Estimates Technical Report
eftec 33 October 2015
ANNEX 1: SURVEY RESPONSES – DESCRIPTIVE STATISTICS
Table A1. 1: Breakdown of survey respondents by Government department
Government department/organisation No. respondents
Department for Environment, Food and Rural Affairs (Defra) 4
Department for Transport (DfT) 2
Environment Agency (EA) 5
Forestry Commission (FC) 1
Joint Nature Conservation Committee (JNCC) 3
Marine Scotland 1
Total 16
Table A1. 2: Survey respondents’ experience with assessing environmental impacts
Environmental impact
Experience
assessing
(n=14)
Experience
monetising
(n=9)
Unable to
monetise
(n=10)
Vulnerability to climate change 8 3 3
Waste management 5 2 3
Air quality 5 5 1
Landscapes 6 5 1
Water quality, abstraction and flood risk 9 4 5
Biodiversity 8 5 5
Noise pollution 5 2 3
Note: number of respondents who answered each question varies.

Development of Look-Up Environmental Value Estimates Technical Report
eftec 34 October 2015
Table A1. 3: Overview of online survey respondent experience with assessing ecosystem
service impacts
Ecosystem service
No. respondents
Experience
assessing
Experience
monetising
Unable to
monetise
Pro
vis
ionin
g
Food 4 2 4
Fibre and Fuel 6 3 1
Genetic Resources 2 0 3
Biochemicals, medicines, pharmaceuticals 1 0 3
Ornamental resources 1 0 2
Fresh water 6 2 4
Regula
ting
Air quality regulation 6 4 1
Climate regulation 7 5 2
Water regulation 6 2 4
Natural hazard regulation 4 1 2
Pest regulation 3 0 2
Disease regulation 3 1 2
Erosion regulation 1 1 3
Water purification and waste treatment 6 2 3
Pollination 3 1 0
Cult
ura
l Cultural Heritage 6 3 6
Recreation and tourism 12 7 6
Aesthetic value 9 3 6
Support
ing
Soil formation 1 - 2
Primary production 1 - 2
Nutrient cycling 3 1 4
Water cycling 5 1 6
Photosynthesis 1 - 2
Note: number of respondents who answered each question varies.
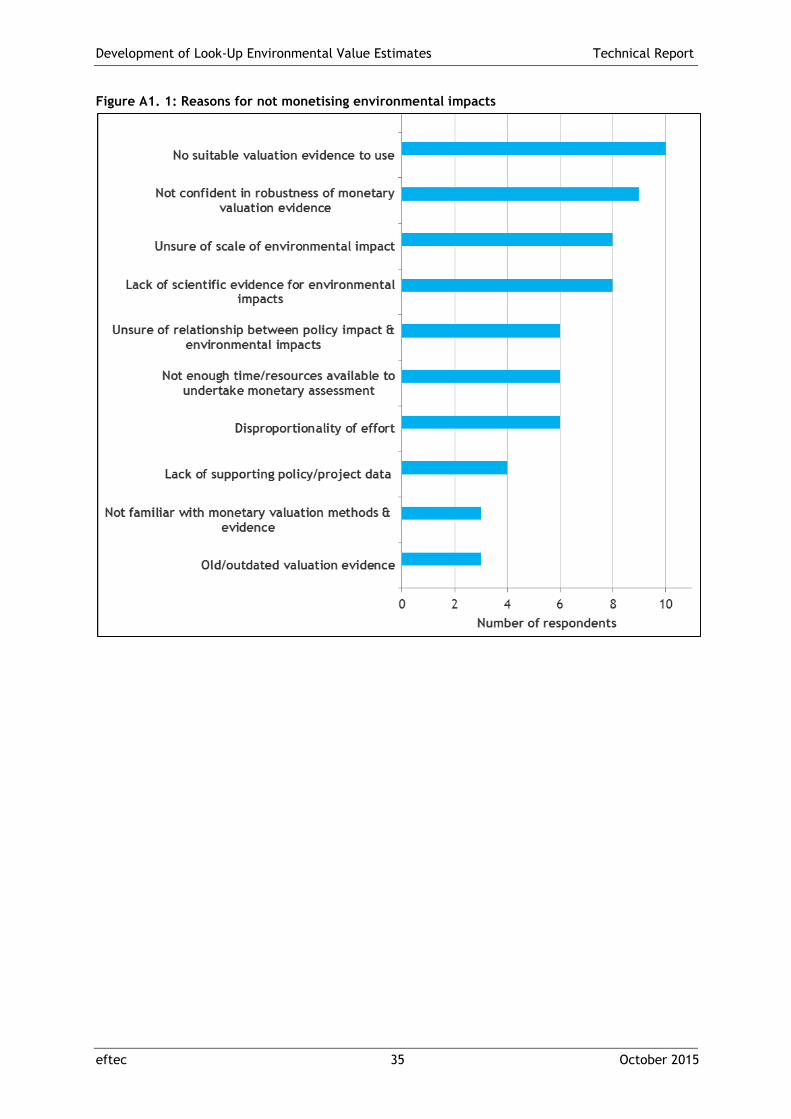
Development of Look-Up Environmental Value Estimates Technical Report
eftec 35 October 2015
Figure A1. 1: Reasons for not monetising environmental impacts

Development of Look-Up Environmental Value Estimates Technical Report
eftec 36 October 2015
ANNEX 2: SCREENED VALUATION STUDIES
A2.1 Enclosed farmland
Boatman, N., and Willis, K. (2010). Estimating the Wildlife and Landscape Benefits of
Environmental Stewardship. Final report for Defra.
Christie, M., Hanley, N., Warren, J., Hyde, T., Murphy, K., and Wright, R. (2006). Valuing changes
in farmland biodiversity using stated preference techniques. Environmental Valuation in Developed
Countries: Case Studies (pp. 50-76).
Christie, M., Hyde, A., Cooper, R., Fazey, I., Dennis, P., Warren, J. M., Colombo, S., and Hanley,
N. (2011). Economic Valuation of the Benefits of Ecosystem Services delivered by the UK
Biodiversity Action Plan (Defra Project SFFSD 0702).
Christie, M., J. Warren, N. Hanley, K. Murphy, R. Wright, T. Hyde and N. Lyon (2004). Developing
Measures for Valuing Changes in Biodiversity. Department for Environment, Food and Rural Affairs
(DEFRA), London, UK.
Christie, M., Hanley, N., Warren, J., Murphy, K., Wright, R., & Hyde, T. (2006). Valuing the
diversity of biodiversity. Ecological economics, 58(2), 304-317.
eftec (2006). Economic Valuation of Environmental Impacts in the Severely Disadvantaged Areas.
For Defra.
Fezzi, C., Hutchins, M., Rigby, D., Bateman, I. J., Posen, P., & Hadley, D. (2010). Integrated
assessment of water framework directive nitrate reduction measures. Agricultural Economics,
41(2), 123-134.
Garratt, M. P. D., Breeze, T. D., Jenner, N., Polce, C., Biesmeijer, J. C., & Potts, S. G. (2014).
Avoiding a bad apple: Insect pollination enhances fruit quality and economic value. Agriculture,
ecosystems & environment, 184, 34-40.
GHK Consulting (2011). Benefits of Sites of Special Scientific Interest. Final report to Defra.
Gibbons, S., Mourato, S., & Resende, G. M. (2014). The amenity value of English nature: a hedonic
price approach. Environmental and Resource Economics, 57(2), 175-196.
Nix, J. (2014). The John Nix farm management pocketbook (No. Ed. 44). The Andersons Centre.
Sen, A., Harwood, A. R., Bateman, I. J., Munday, P., Crowe, A., Brander, L., Raychaudhuri, J.,
Lovett, A., Foden, J., Provins, A. (2014). Economic assessment of the recreational value of
ecosystems: Methodological development and national and local application. Environmental and
Resource Economics, 57(2), 233-249.
Tinch, D., S. Colombo, and N. Hanley (2014). The Impacts of Elicitation Context on Stated
Preferences for Agricultural Landscapes. Journal of Agricultural Economics, 66 (1), pp. 87-107.

Development of Look-Up Environmental Value Estimates Technical Report
eftec 37 October 2015
A2.2 Freshwater, wetlands and floodplains
ADAS Consulting Ltd. (2003). ‘Survey of Rod Licence Holders 2003 – R&D Technical Report’,
Environment Agency: Bristol, UK
Atkinson, G., Morse-Jones, S., Mourato, S., Provins, A. 92012). "When to Take 'No' for an Answer'?
Using Entreaties to Reduce Protests in Contingent Valuation Studies," Environmental Resource
Economics, vol. 51, pp.497-523
Bateman, I., Georgiou, S., Lake, I., (2006). The Aggregation of Environmental Benefit Values: A
Spatially Sensitive Valuation Function Approach. CSERGE Working Paper EDM 05-04
Bateman, I.J., Cole, M.A., Georgiou, S., Hadley, D.J. (2006). "Comparing contingent valuation and
contingent ranking: A case study considering the benefits of urban river water quality
improvement," Journal of Environmental Management, vol. 79, pp.221-231
Bateman, I.J., Brouwer, R., Ferrini, S., Schaafsma, M., Barton, D.N., Dubgaard, A., Hasler, B.,
Hime, S., Liekens, I., Navrud, S., De Nocker, I., Sceponaviciute, R., Semeniene, D. (2011). Making
Benefit Transfers Work: Deriving and Testing Principles for Value Transfers for Similar and
Dissimilar Sites Using a Case Study of the Non-Market Benefits of Water Quality Improvements
Across Europe. Environmental Resource Economics, vol. 50: 365-387
Bateman, I.J., Cooper, P., Georgiou, S., Navrud, S., Poe, G.L., Ready, R., Riera, P., Ryan, M.,
Vossler, C.A. (2004). 'Scope Sensitivity Tests for Preference Robustness: An Empirical Examination
of Economic Expectations Regarding the Economic Valuation of Policies for Reducing Acidity in
Remote Mountain Lakes", CSERGE Working Paper EDM 04-03
Black, A., Colombo, S., Hanley, N., Tinch, D., Aftab, A., & Bergmann, A. (2006). Transferring the
benefits of water quality enhancements in small catchments. In 2006 Annual Meeting, August 12-
18, 2006, Queensland, Australia (No. 25790). International Association of Agricultural Economists.
Brander, L.M., Ghermandi, A., Kuik, O., Markandya, A., Nunes, P.A.L.D., Schaafsma and M.,
Wagtendonk, A. (2008) Scaling up ecosystem services values: methodology, applicability and a case
study. Final Report, EEA May 2008.
Cooper, P., Gregory, L.P., Bateman, I.J. (2004). "The structure of motivation for contingent values:
a case study of lake water quality improvement, " Ecological Economics, Vol. 50, pp.69-82
Entec UK Limited (2004). Valuing Water Use in Scotland and Northern Ireland for WFD
Implementation Process. Report for the Scotland and Northern Ireland Forum for Environmental
Research.
Ferrini, S., Schaafsma, M., and Bateman, I. (2014). Revealed and stated preference valuation and
transfer: A within-sample comparison of water quality improvement values, Water Resources
Research, Vol. 50, No. 6.
Gibbons, S.; Mourato, S.; and Mendes Resende, G. (2014) The amenity value of English nature: a
hedonic price approach. Environmental and Resource Economics, 57 (2). pp. 175-196.
Glenk, K., Lago, M., & Moran, D. (2011). Public preferences for water quality improvements:
implications for the implementation of the EC Water Framework Directive in Scotland. Water
Policy, 13(5), 645-662.
Development of Look-Up Environmental Value Estimates Technical Report
eftec 38 October 2015
Hanley, N., Wright, R. E., & Alvarez-Farizo, B. (2006). Estimating the economic value of
improvements in river ecology using choice experiments: an application to the water framework
directive. Journal of environmental management, 78(2), 183-193.
Johnstone, C., and Markandya, A. (2006), ‘Valuing river characteristics using combined site choice
and participation travel cost models’, Journal of Environmental Management, 80: 237-247.
Lawrence, K.S., and Spurgeon, J. (2007). ‘Economic evaluation of inland fisheries: Welfare benefits
of inland fisheries in England and Wales – Science Report’, Environment Agency: Bristol, UK.
Metcalfe, P.J. (2012). "Update of CRP WFD Benefit Value - Economic Component," report for the
Environment Agency.
Peirson, G., Tingley, D., Spurgeon, J., & Radford, A. (2001). Economic evaluation of inland fisheries
in England and Wales. Fisheries Management and Ecology, 8(4‐5), 415-424.
Radford, Al, Riddington, G., Anderson, J. (2004), ‘Technical Report: The Economic Impact of Game
and Coarse Fishing in Scotland,’ Scottish Environment and Rural Affairs Division: 1-144
Radford, A. Riddington, G. and Gibton, H. (2007). ‘Economic evaluation of inland fisheries: Welfare
benefits of inland fisheries in England and Wales – Science Report’, Environment Agency: Bristol,
UK.
Radford, A.F., G. Riddington and D. Tingley, ‘Economic Evaluation of Inland Fisheries: Economic
Evaluation of Fishing Rights’, Report, 2001-01-01
Radford, Al, Riddington, G., Anderson, J. (2004), ‘Technical
Rayment, M., Conway, M., Bartrakova, S., McNeil, D., Christie, M., and Remoundou, K. (2014).
"Estimating the Impact on Public Benefits from Changes in Investment in the Environment Agency
Waterways: Final Report" Submitted by ICF GHK
Sen, A., Harwood, A. R., Bateman, I. J., Munday, P., Crowe, A., Brander, L., Raychaudhuri, J.,
Lovett, A.A., Foden, J. & Provins, A. (2014). Economic assessment of the recreational value of
ecosystems: Methodological development and national and local application. Environmental and
Resource Economics, 57(2), 233-249.
Simpson, D. and Mawle, G. (2001), ‘Survey of Rod Licence Holders: R&D Technical Report),
Environment Agency: Bristol, UK
Simpson, D. and Mawle, G. (2005), ‘Public Attitudes to Angling 2005: A survey of attitudes and
participation in England and Wales’, Environment Agency: Bristol, UK
Simpson, D. and Willis, K. (2004). ‘Method for Assessing the Heritage Value of Net Fisheries,’
Environment Agency: Bristol, UK
Spash, C.L., Urama, K., Burton, R., Kenyon, W., Shannon, P., Hill, G (2006). "Motives behind
willingness to pay for improving biodiversity in a water ecosystem: Economics, ethics and social
psychology." Ecological Economics, vol. 68, pp. 955-964
Development of Look-Up Environmental Value Estimates Technical Report
eftec 39 October 2015
Soliño, M., Joyce, J., & Farizo, B. A. (2013). Improving water quality in England and Wales: local
endowments and willingness to pay. International Journal of Environmental Research, 7(3), 623-
632.
Spash, C.L.; Urama, K.; Burton, R.; Kenyon, W.; Shannon, P;, Hill, G (2006) "Motives behind
willingness to pay for improving biodiversity in a water ecosystem: Economics, ethics and social
psychology." Ecological Economics, vol. 68, pp. 955-964
Spurgeon, J., G. Colarullo, A.F. Radford and D. Tingley ‘Economic Evaluation of Inland Fisheries
Module B: Indirect Economic Values Associated with Fisheries – General Public Survey’, Report,
2001-01-01
Willis, K. Garrod, G. & Scarpa, R. (2013). Customer preferences, Willingness to Pay and Willingness
to Accept changes in water service measures: a choice experiment. Final report submitted to
Yorkshire Water, March 2013
A2.3 Marine and coastal margins
Bateman, I.J., Turner, R.K., Adger, W.N., Boar, R., Brouwer, R., Crooks, S., Dockerty, T.,
Georgiou, S., Jones, A., Langford, I.H., Ledoux, L., Nishikawa, N., Powe, N., Wright, J. and Wright,
S.D., (2001). Management of a Multi-Purpose Coastal Wetland: The Norfolk and Suffolk Broads, in
Turner, R.K., Bateman, I.J. and Adger, W.N. (eds.). Economics of Coastal and Water Resources:
Valuing Environmental Functions, Kluwer, Dordrecht, The Netherlands, pp 159-214.
Bateman, I.J., Turner, R.K., Klein, R.J.T. and Langford, I.H. (2001). The Application of the Cost
Benefit Method to Sea Defence and Coastal Protection Management in England. In R.K. Turner, I.J.
Bateman and W.N. Adger, eds. Economics of Coastal and Water Resources: Valuing Environmental
Functions. Dordrecht, Kluwer Academic, 113-142.
Birol, E., & Cox, V. (2007). Using choice experiments to design wetland management programmes:
The case of Severn Estuary Wetland, UK. Journal of Environmental Planning and
Management, 50(3), 363-380. Brander, L. M., Van Beukering, P., and Cesar, H. S. (2007). The
recreational value of coral reefs: A meta-analysis. Ecological Economics 63(1): 209–218.
Brander, L.M., Ghermandi, A., Kuik, O., Markandya, A., Nunes, P.A.L.D., Schaafsma and M.,
Wagtendonk, A. (2008). Scaling up ecosystem services values: methodology, applicability and a case
study. Final Report, EEA May 2008.
Chae, D. R., Wattage, P., & Pascoe, S. (2012). Recreational benefits from a marine protected area:
A travel cost analysis of Lundy. Tourism Management,33(4), 971-977.
Drew Associates Ltd. (2003). Research into the economic contribution of sea angling. Final report to
Defra
Georgiou, S., Bateman, I. J., Langford, I. H., & Day, R. J. (2000). Coastal bathing water health
risks: developing means of assessing the adequacy of proposals to amend the 1976 EC directive.
Risk Decision and Policy, 5(01), 49-68.
Gibbons, S.; Mourato, S.; and Mendes Resende, G. (2014) The amenity value of English nature: a
hedonic price approach. Environmental and Resource Economics, 57 (2). pp. 175-196.

Development of Look-Up Environmental Value Estimates Technical Report
eftec 40 October 2015
eftec (2002). Valuation of Benefits to England and Wales of a Revised Bathing Water Quality
Directive and Other Beach Characteristics Using the Choice Experiment Methodology. Final report
to Defra.
Jacobs (2004). Environment Group Research Report: An Economic Assessment of the Costs and
Benefits of Natura 2000 Sites in Scotland, 2004 Final Report, The Scottish Government.
http://www.scotland.gov.uk/Resource/Doc/47251/0014580.pdf
Jobstvogt, N., Hanley, N., Hynes, S., Kenter, J., and Witte, U. (2014). Twenty thousand sterling
under the sea: Estimating the value of protecting deep-sea biodiversity. Ecological Economics, 97,
10-19.
Kenter, J. O., Bryce, R., Davies, A., Jobstvogt, N., Watson, V., Ranger, S., Solandt, J. L., Duncan,
C., Christie, M., Crump, H., Irvine, K. N., Pinard, M. and Reed, M. S. (2013). The value of potential
marine protected areas in the UK to divers and sea anglers. UNEP-WCMC, Cambridge.
Lawrence, K.S. (2005). Assessing the value of recreational sea angling in South West England.
Fisheries Management and Ecology, 12, 369–375.
Luisetti T, Turner R K, Hadley D and Morse-Jones S (2010). Coastal and marine ecosystem services
valuation for policy and management. CSERGE Working Paper EDM 10-04
Luisetti, T., R.K. Turner and I.J. Bateman. (2008). An ecosystem services approach to assess
managed realignment coastal policy in England. CSERGE Working Paper ECM 08-04, CSERGE,
University of East Anglia, Norwich, UK.
Luisetti, T., Turner, R.K., Bateman, I.J., Morse-Jones, S., Adams, C. and Fonseca, L. (2011).
Coastal and marine ecosystem services valuation for policy and management: managed realignment
case studies in England. Ocean & Coastal Management, 54, 212-224.
McVittie, A., and Moran. D. (2010). Valuing the non-use benefits of marine conservation zones: An
application to the UK Marine Bill. Ecological Economics 70: 413–424.
MMO (2013). UK Sea Fisheries Statistics 2013. Edited by Lucy Radford. London: MMO.
https://www.gov.uk/government/uploads/system/uploads/attachment_data/file/358342/UK_Sea_
Fisheries_Statistics_2013_online_version.pdf [Accessed April 2015].
Sen, A., Harwood, A. R., Bateman, I. J., Munday, P., Crowe, A., Brander, L., Raychaudhuri, J.,
Lovett, A.A., Foden, J. & Provins, A. (2014). Economic assessment of the recreational value of
ecosystems: Methodological development and national and local application. Environmental and
Resource Economics, 57(2), 233-249.
A2.4 Mountains, moors and heaths
Cambridge Econometrics, in association with eftec and WRc (2003), "A Study to Estimate the
Disamenity Costs of Landfill in Great Britain", Report for the Department for Environment, Food and
Rural Affairs.
http://webarchive.nationalarchives.gov.uk/20130402151656/http:/archive.defra.gov.uk/environm
ent/waste/strategy/legislation/landfill/documents/landfill_disamenity.pdf [Accessed August 2015].

Development of Look-Up Environmental Value Estimates Technical Report
eftec 41 October 2015
Christie, M., Hyde, T., Cooper, R., Fazey, I., Dennis, P., Warren, J., Colombo, S., and Hanely, N.,
2011. Economic valuation of the Benefits of ecosystem services delivered by the UK Biodiversity
Action Plan. London, Report to Defra NE0112.
eftec (2006). “Economic valuation of environmental impacts in severely disadvantaged areas”,
Report to Defra.
Gibbons, S.; Mourato, S.; and Mendes Resende, G. (2014) The amenity value of English nature: a
hedonic price approach. Environmental and Resource Economics, 57 (2). pp. 175-196.
GHK Consulting (2011). Benefits of Sites of Special Scientific Interest. Final report to Defra.
Ham, Y. J., Maddison, D. J., & Elliott, R. J. (2013). The valuation of landfill disamenities in
Birmingham. Ecological Economics, 85, 116-129.
Hanley, N., G. Koop, B. Alvarez-Farizo, R.E. Wright and Ceara Nevin (2001), An Application of
Recreation Demand Models to Rock Climbing, Journal of Agricultural Economics, 52(1): 36-52.
Holden, J., Walker,J., Evans,M.G. ,Worrall,F. and Bonn,A.(2008). A compendium of peat
restoration and management projects. Report to Defra SP0556.
http://randd.defra.gov.uk/Default.aspx?Menu=Menu&Module=More&Location=None&Completed=0&
ProjectID=14620
Jacobs Ltd. (2004). “An Economic Assessment of the Costs and Benefits of Natura 2000 Sites in
Scotland”. Scottish Executive Environment and Rural Affairs Department (SEERAD), Edinburgh,
United Kingdom
Martin-Ortega, J., Allott, T.E.H., Glenk, K., Schaafsma, M. (2014). Valuing water quality
improvements from peatland restoration: Evidence and challenges. Ecosystem Services. Volume 9
pp 34-43
Oglepthorpe, D. R. (2005), “Environmental Landscape Features (ELF). Model Update”, Report to
Defra.
Sen, A., Harwood, A. R., Bateman, I. J., Munday, P., Crowe, A., Brander, L., Raychaudhuri, J.,
Lovett, A.A., Foden, J. & Provins, A. (2014). Economic assessment of the recreational value of
ecosystems: Methodological development and national and local application. Environmental and
Resource Economics, 57(2), 233-249.
A2.5 Semi-natural grasslands
Atkinson, G., Day, B., Mourato, S., & Palmer, C. (2004). ‘Amenity’or ‘eyesore’? Negative willingness
to pay for options to replace electricity transmission towers. Applied Economics Letters, 11(4), 203-
208.
Burgess, D.E., Jackson, N., Hadley, D., Turner, K., Georgiou, S., Day, B. (2004), “Assessing the
value of a scientifically important wetland ecosystem: the case of the Culm Grasslands”, CSERGE
report.
Cambridge Econometrics, in association with eftec and WRc (2003), "A Study to Estimate the
Disamenity Costs of Landfill in Great Britain", Report for the Department for Environment, Food and
Rural Affairs.

Development of Look-Up Environmental Value Estimates Technical Report
eftec 42 October 2015
http://webarchive.nationalarchives.gov.uk/20130402151656/http:/archive.defra.gov.uk/environm
ent/waste/strategy/legislation/landfill/documents/landfill_disamenity.pdf [Accessed August 2015].
Christie, M., & Rayment, M. (2012). An economic assessment of the ecosystem service benefits
derived from the SSSI biodiversity conservation policy in England and Wales. Ecosystem
Services, 1(1), 70-84.
Defra (2014). Wide Scale Enhancement of Biodiversity (WEB). Final report on phase 2, and
overview of the whole project. Project BD5208.
eftec (2006). “Economic valuation of environmental impacts in severely disadvantaged areas”,
Report to Defra.
GHK Consulting, "Benefits of Sites of Special Scientific Interest", Report, 2011-06-01
Gibbons, S., Mourato, S., and Mendes Resende, G. (2014). The amenity value of English nature: a
hedonic price approach. Environmental and Resource Economics, 57 (2). pp. 175-196.
Ham, Y. J., Maddison, D. J., & Elliott, R. J. (2013). The valuation of landfill disamenities in
Birmingham. Ecological Economics, 85, 116-129.
Hanley, N., Salt, C.A., Wilson, M. and Culligan-Dunsmore, M. (2001), Evaluating alternative
"countermeasures" against food contamination resulting from nuclear accidents, Journal of
Agricultural Economics, 52(2): 92-109.
Nix, J. (2011, 2012, 2013, 2014). Farm Management Handbook. Agro Business Consultants Ltd,
41st, 42nd, 43rd, 44th editions.
Sen, A., Harwood, A. R., Bateman, I. J., Munday, P., Crowe, A., Brander, L., Raychaudhuri, J.,
Lovett, A., Foden, J., Provins, A. (2014). Economic assessment of the recreational value of
ecosystems: Methodological development and national and local application. Environmental and
Resource Economics, 57(2), 233-249.
A2.6 Urban (green space)
Alberini, A., Riganti, P., and Longo, A. (2003). Can people value the aesthetic and use services of
urban sites? Evidence from a survey of Belfast residents. Journal of Cultural Economics, 27(3-4),
193-213.
Brander, L.M., and Koetse, M.J. (2011). The value of urban open space: Meta - analyses of
contingent valuation and hedonic pricing results. Journal of Environmental Management, 92,
pp.2763-2773.
CABE (2005). Does money grow on trees? Available Online:
http://webarchive.nationalarchives.gov.uk/20110118095356/http:/www.cabe.org.uk/files/does-
money-grow-on-trees.pdf
Cambridge Econometrics, in association with eftec and WRc (2003), "A Study to Estimate the
Disamenity Costs of Landfill in Great Britain", Report for the Department for Environment, Food and
Rural Affairs.
http://webarchive.nationalarchives.gov.uk/20130402151656/http:/archive.defra.gov.uk/environm
ent/waste/strategy/legislation/landfill/documents/landfill_disamenity.pdf [Accessed August 2015].

Development of Look-Up Environmental Value Estimates Technical Report
eftec 43 October 2015
Day, B., Bateman, I., & Lake, I. (2006). Estimating the demand for peace and quiet using property
market data (No. 06-03). CSERGE Working Paper EDM.
Gensler and the Urban Land Institute (2011). Open Space: An asset without a champion? Report for
the Urban Investment Network. Available Online:
http://www.gensler.com/uploads/documents/Open_Space_03_08_2011.pdf
Ham, Y. J., Maddison, D. J., & Elliott, R. J. (2013). The valuation of landfill disamenities in
Birmingham. Ecological Economics, 85, 116-129.
Jones, A., Hillsdon, M. and Coombes, E. (2009). Greenspace access, use, physical activity and
obesity: understanding the effects of area deprivation. Preventive Medicine, 49 (6), pp.500-505.
Mell, I., Keskin, B., Hehl-Lange, S., and Henneberry, J. (2012). Valuing Attractive Landscapes in
the Urban Economy, Action 4.2, Level II Report, A Contingent Valuation of Green Investments in
The Wicker Riverside, Sheffield.
Perino, G., Andrews, B., Kontoleon, A., and Bateman, I. (2012). The value of urban green space in
Britain: a methodological framework for spatially referenced benefit transfer.
Sen, A., Harwood, A. R., Bateman, I. J., Munday, P., Crowe, A., Brander, L., Raychaudhuri, J.,
Lovett, A.A., Foden, J. & Provins, A. (2014). Economic assessment of the recreational value of
ecosystems: Methodological development and national and local application. Environmental and
Resource Economics, 57(2), 233-249.
A2.7 Woodland
Bateman, I. and Jones, A. (2003). Estimating the value of informal recreation at British Woodlands:
A multilevel meta-analysis, Part 2 in Jones, A., Bateman, I. and Wright, J Estimating arrival
numbers and values for informal recreational use of British woodlands, Final report to the Forestry
Commission, CSERGE.
Cambridge Econometrics, in association with eftec and WRc (2003), "A Study to Estimate the
Disamenity Costs of Landfill in Great Britain", Report for the Department for Environment, Food and
Rural Affairs.
http://webarchive.nationalarchives.gov.uk/20130402151656/http:/archive.defra.gov.uk/environm
ent/waste/strategy/legislation/landfill/documents/landfill_disamenity.pdf [Accessed August 2015].
Christie, M., Hanley, N., Garrod, B., Hyde, T., Lyons, N., Bergmann, A., & Hynes, S. 2006, Valuing
Forest Recreation Activities: Final Phase 2 Report. Forestry Commission: Edinburgh
Christie, M., Hyde, T., Cooper, R., Fazey, I., Dennis, P., Warren, J., Colombo, S. and Hanley, H.
(2011), Economic Valuation of the Benefits of Ecosystem Services delivered by the UK Biodiversity
Action Plan. Report to Defra,
Crabtree, B., N. Chalmers, A. Thorburn, D. Macdonald, D. Eiser, J. Potts, D. Colman (2001).
Economic evaluation of the community woodland supplement. Forestry Commission, Edinburgh,
United Kingdom.
Edwards, D., Elliott, A., Hislop, M., Martin, S., Morris, J., O’Brien, L., Peace, A., Sarajevs, V.,
Serrand, M. and Valatin, G. (2009), A Valuation of the Economic and Social Contribution of Forestry

Development of Look-Up Environmental Value Estimates Technical Report
eftec 44 October 2015
for People in Scotland. Forestry Commission Research Report 101, Forestry Commission Scotland,
Edinburgh, 190 pp.
Garrod (2002). Landscape Benefits, Report to Forestry Commission.
Garrod, G.D. (2003), Landscape Values of Forests. Social & Environmental Benefits of Forestry
Phase 2, Report to the Forestry Commission, Edinburgh. Centre for Research in Environmental
Appraisal and Management, University of Newcastle upon Tyne.
Gibbons, S.; Mourato, S.; and Mendes Resende, G. (2014) The amenity value of English nature: a
hedonic price approach. Environmental and Resource Economics, 57 (2). pp. 175-196.
Ham, Y. J., Maddison, D. J., & Elliott, R. J. (2013). The valuation of landfill disamenities in
Birmingham. Ecological Economics, 85, 116-129.
Hill, GW and Courtney, PR (2006). “Demand analysis projections for recreational visits to
countryside woodlands in Great Britain” Forestry, Vol. 79, No. 2, 2006. doi:10.1093/forestry/cpl005
Scarpa, R. (2003). "The recreation value of Woodlands". Report for the Forestry Commission
Sen, A., Harwood, A. R., Bateman, I. J., Munday, P., Crowe, A., Brander, L., Raychaudhuri, J.,
Lovett, A.A. Foden J. and Provins, A. (2014). Economic assessment of the recreational value of
ecosystems: Methodological development and national and local application. Environmental and
Resource Economics, 57(2), 233-249.
Social and Economic Research Group (2008). A Valuation of the Economic and Social Contribution of
Forestry for People in Scotland, Forestry Commission Scotland.
Van-Rensburg, T. M., Mill, G.A., Common, M. and Lovett, J. (2002). Preferences and Multiple Use
Forest Management, Ecological Economics, December - 43(2-3): 231-44.
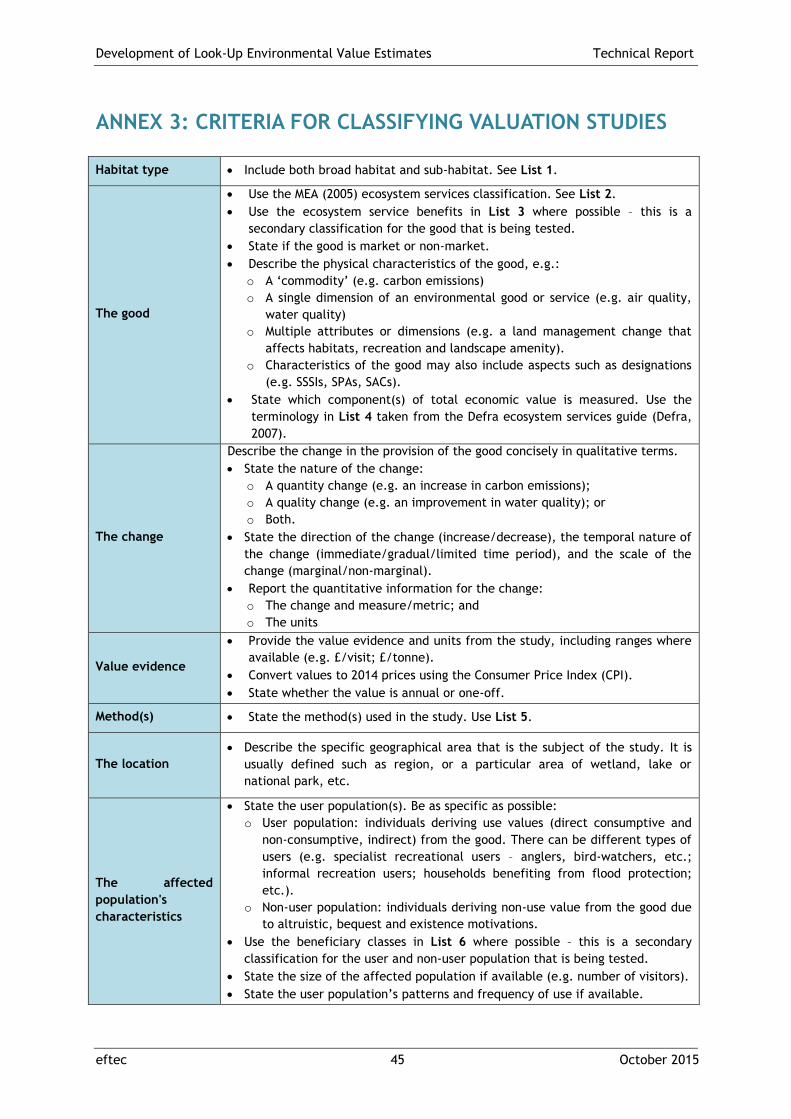
Development of Look-Up Environmental Value Estimates Technical Report
eftec 45 October 2015
ANNEX 3: CRITERIA FOR CLASSIFYING VALUATION STUDIES
Habitat type Include both broad habitat and sub-habitat. See List 1.
The good
Use the MEA (2005) ecosystem services classification. See List 2.
Use the ecosystem service benefits in List 3 where possible – this is a
secondary classification for the good that is being tested.
State if the good is market or non-market.
Describe the physical characteristics of the good, e.g.:
o A ‘commodity’ (e.g. carbon emissions)
o A single dimension of an environmental good or service (e.g. air quality,
water quality)
o Multiple attributes or dimensions (e.g. a land management change that
affects habitats, recreation and landscape amenity).
o Characteristics of the good may also include aspects such as designations
(e.g. SSSIs, SPAs, SACs).
State which component(s) of total economic value is measured. Use the
terminology in List 4 taken from the Defra ecosystem services guide (Defra,
2007).
The change
Describe the change in the provision of the good concisely in qualitative terms.
State the nature of the change:
o A quantity change (e.g. an increase in carbon emissions);
o A quality change (e.g. an improvement in water quality); or
o Both.
State the direction of the change (increase/decrease), the temporal nature of
the change (immediate/gradual/limited time period), and the scale of the
change (marginal/non-marginal).
Report the quantitative information for the change:
o The change and measure/metric; and
o The units
Value evidence
Provide the value evidence and units from the study, including ranges where
available (e.g. £/visit; £/tonne).
Convert values to 2014 prices using the Consumer Price Index (CPI).
State whether the value is annual or one-off.
Method(s) State the method(s) used in the study. Use List 5.
The location
Describe the specific geographical area that is the subject of the study. It is
usually defined such as region, or a particular area of wetland, lake or
national park, etc.
The affected
population's
characteristics
State the user population(s). Be as specific as possible:
o User population: individuals deriving use values (direct consumptive and
non-consumptive, indirect) from the good. There can be different types of
users (e.g. specialist recreational users – anglers, bird-watchers, etc.;
informal recreation users; households benefiting from flood protection;
etc.).
o Non-user population: individuals deriving non-use value from the good due
to altruistic, bequest and existence motivations.
Use the beneficiary classes in List 6 where possible – this is a secondary
classification for the user and non-user population that is being tested.
State the size of the affected population if available (e.g. number of visitors).
State the user population’s patterns and frequency of use if available.

Development of Look-Up Environmental Value Estimates Technical Report
eftec 46 October 2015
Note if information is provided on the following socio-economic and
demographic characteristics of the affected population:
o Income
o Education
o Household Size
o Age/sex distribution
o Employment and/or occupations profile
o Population of cities, towns
o Unemployment rate
o Employment and/or occupations profile
o Population density
The number and
quality of
substitutes
Describe the substitutes for the good (e.g. other recreational sites).
The market
constructs
Describe the market constructs (e.g. an open-access good, a public good, a
private good, etc.)
Study quality
Answer the following 3 questions:
o Is the valuation/policy context, the good and the change in provision
described?
o Is the affected population defined and, is information provided on
sampling (where relevant)?
o Is there a discussion of the validity of results and their robustness
(including econometric analysis and validity testing)?

Development of Look-Up Environmental Value Estimates Technical Report
eftec 47 October 2015
List 1: Broad habitat types and associated sub-habitats
UKNEA broad habitat Associated sub-habitat Scope
Coastal margins
Coastal dunes and sandy shores
Dune systems and the upper zone of sandy shores
Saltmarsh The upper zone of vegetated intertidal habitat - transition into other intertidal habitats
Transitional and coastal waters
Estuaries, coastal lagoons and other near shore waters (Water Framework Directive definition)
Enclosed farmland Enclosed arable farmland Arable, horticultural land and improved grassland as well as associated boundary features e.g. hedgerows
Freshwaters, wetlands and floodplains
Standing open waters Lakes, ponds, reservoirs and canals
Rivers and streams Streams and rivers down to the tidal limit
Groundwaters Aquifers and significant quantities of below ground water
Wetlands Lowland fens, raised bogs, swamps, reedbeds and floodplain wetlands
Marine
Intertidal rock
Bedrock, boulders and cobbles which occur in the intertidal zone. Colonised by mussels/barnacles and seaweeds depending on exposure
Intertidal sediment Shingle (mobile cobbles and pebbles), gravel, sand and mud in the intertidal zone
Subtidal rock
Bedrock, boulders and cobbles in the subtidal zone colonised by seaweeds (infralittoral zone) or animal communities (circalittoral zone)
Shallow subtidal sediment
Shingle (mobile cobbles and pebbles), gravel, sand and mud in the subtidal zone
Deep sea bed The sea bed beyond the continental shelf break
Pelagic water column The water column of shallow or deep sea; beyond the coastal waters
Mountains, moors and heaths
Blanket Bog Rainfall-fed bog in upland environments
Mountains, Moorlands and Upland Heaths
Upland heath, montane habitats and associated wetlands (flushes, fens). Also include rock and scree habitats such as limestone pavements
Lowland Heath Lowland habitats dominated by heather family or dwarf gorse species
Semi-natural grasslands Semi-natural grasslands All grasslands unimproved for agricultural purposes
Urban (green space)
Built urban The built environment elements of urban space e.g. buildings, roads, industrial works
Green space The natural environment elements of built up areas e.g. parks, gardens, towpaths, urban trees
Woodland Woodland Includes broadleaved and coniferous woodlands both natural woods and planted. (Wet woodland included here)

Development of Look-Up Environmental Value Estimates Technical Report
eftec 48 October 2015
List 2: MEA (2005) ecosystem services classification
Provisioning
Food
Fibre and fuel
Genetic resources
Biochemicals, natural medicines, pharmaceuticals
Ornamental resources
Fresh water
Regulating
Air quality regulation
Climate regulation
Waste regulation
Natural hazard regulation
Pest regulation
Disease regulation
Erosion regulation
Water purification and waste treatment
Pollination
Cultural
Cultural heritage
Recreation and tourism
Aesthetic value
Supporting
Soil formation
Primary production
Nutrient cycling
Water cycling
Photosynthesis

Development of Look-Up Environmental Value Estimates Technical Report
eftec 49 October 2015
List 3: Ecosystem service benefits
Ecosystem service
benefit Definition
Food Plant, animal and fungi consumed by people. Both wild and cultivated sources
Fibre Plant and animal materials used by people for building, clothing and other
objects, including timber
Energy All sources of energy used by people (fossil fuels, wind, tidal, wave, hydro,
biomass and solar)
Clean water Water for human use (e.g. drinking, bathing, industrial processes); a combination
of quality and quantity
Clean Air Air quality that has no adverse impact upon human health or wellbeing
Recreation Active enjoyment of the natural environment e.g. walking, fishing, canoeing
Aesthetics Passive enjoyment of the natural environment e.g. landscape appreciation and
views
Wildlife
Wild species diversity and abundance which have aesthetic and recreational
value, and cultural and spiritual significance, including through the conservation
priorities for species and habitats. This is distinct from the natural capital assets,
species and ecological communities, in that these represent the species that are
significant to England and that people care about.
Protection from
hazards
Natural regulation of extreme events such as flooding, drought and landslides.
Equable climate
A comfortable climate that has no adverse impact upon human health or
wellbeing. The result of both global scale and local scale effects (e.g. urban
cooling by trees)

Development of Look-Up Environmental Value Estimates Technical Report
eftec 50 October 2015
List 4: Total economic value component
Direct consumptive use
Direct non-consumptive use
Indirect use
Option value
Non-use value
List 5: Economic valuation methods
Market price / exchange value
Replacement cost
Defensive/avertive expenditure
Expenditure on complements (e.g. to recreation)
Hedonic pricing method
Travel cost method: single-site, multi-site, zonal, individual
Random utility model (RUM)/discrete choice model (also termed multi-site recreation demand
model)
Stated preference: contingent valuation
Stated preference: choice experiment
Meta-analysis
Value transfer

Development of Look-Up Environmental Value Estimates Technical Report
eftec 51 October 2015
List 6: The affected population – beneficiary classes. Source: Landers and Nahlik (2013).
00.01 Agricultural
00.0101 Irrigators
00.0102 CAFO operators
00.0103 Livestock grazers
00.0104 Agricultural processors
00.0105 Aquaculturists
00.0106 Farmers
00.0107 Foresters
00.02 Commercial/ industrial
00.0201 Food extractors
00.0202 Timber, fiber, and ornamental extractors
00.0203 Industrial processors
00.0204 Industrial dischargers
00.0205 Electric and other energy extractors
00.0206 Resource-dependent businesses
00.0207 Pharmaceutical and food supplement suppliers
00.0208 Fur/ hide trappers and hunters
00.03 Government, municipal, and residential
00.0301 Municipal drinking water plant operators
00.0302 Waste water treatment plant operators
00.0303 Residential property owners
00.0304 Military/ coast guard
00.04 Commercial/ military transportation
00.0401 Transporters of goods
00.0402 Transporters of people
00.05 Subsistence
00.0501 Water subsisters
00.0502 Food subsisters
00.0503 Timber, fiber, and fur/ hide subsisters
00.0504 Building material subsisters
00.06 Recreational
00.0601 Experiencers and viewers
00.0602 Food pickers and gatherers
00.0603 Hunters
00.0604 Anglers
00.0605 Waders, swimmers, and divers
00.0606 Boaters
00.07 Inspirational
00.0701 Spiritual and ceremonial participants and participants of celebration
00.0702 Artists

Development of Look-Up Environmental Value Estimates Technical Report
eftec 52 October 2015
00.08 Learning
00.0801 Educators and students
00.0802 Researchers
00.09 Non-use
00.0901 People who care (existence)
00.0902 People who care (option/bequest)
00.10 Humanity
00.01001 All humans
Recommended


![Effects of bracken [Pteridium aquilinum (L.) Kuhn] control ...sciencesearch.defra.gov.uk/Document.aspx?Document=BD1226_1880_… · currently used are application of the selective](https://img.dokumen.tips/doc/110x75/5aff3db57f8b9a864d902ad5/effects-of-bracken-pteridium-aquilinum-l-kuhn-control-used-are-application.jpg)