Forests 2020, 11, 789; doi:10.3390/f11080789 www.mdpi.com/journal/forests
Article
Development of Comprehensive Fuel Management
Strategies for Reducing Wildfire Risk in Greece
Palaiologos Palaiologou 1,*, Kostas Kalabokidis 1, Alan A. Ager 2 and Michelle A. Day 3
1 Department of Geography, University of the Aegean, University Hill, Mytilene,
81100 Lesvos Island, Greece; [email protected] 2 USDA Forest Service, Rocky Mountain Research Station, Missoula Fire Sciences Laboratory,
5775 US Highway 10W, Missoula, MT 59808, USA; [email protected] 3 USDA Forest Service, Rocky Mountain Research Station, 3200 SW Jefferson Way,
Corvallis, OR 97331, USA; [email protected]
* Correspondence: [email protected]; Tel.: +30‐225‐1036‐435
Received: 11 June 2020; Accepted: 18 July 2020; Published: 22 July 2020
Abstract: A solution to the growing problem of catastrophic wildfires in Greece will require a more
holistic fuel management strategy that focuses more broadly on landscape fire behavior and risk in
relation to suppression tactics and ignition prevention. Current fire protection planning is either
non‐existent or narrowly focused on reducing fuels in proximity to roads and communities where
ignitions are most likely. A more effective strategy would expand the treatment footprint to
landscape scales to reduce fire intensity and increase the likelihood of safe and efficient suppression
activities. However, expanding fuels treatment programs on Greek landscapes that are highly
fragmented in terms of land use and vegetation requires: (1) a better understanding of how diverse
land cover types contribute to fire spread and intensity; and (2) case studies, both simulated and
empirical, that demonstrate how landscape fuel management strategies can achieve desired
outcomes in terms of fire behavior. In this study, we used Lesvos Island, Greece as a study area to
characterize how different land cover types and land uses contribute to fire exposure and used
wildfire simulation methods to understand how fire spreads among parcels of forests, developed
areas, and other land cover types (shrublands, agricultural areas, and grasslands) as a way to
identify fire source–sink relationships. We then simulated a spatially coordinated fuel management
program that targeted the fire prone conifer forests that generally burn under the highest intensity.
The treatment effects were measured in terms of post‐treatment fire behavior and transmission. The
results demonstrated an optimized method for fuel management planning that accounts for the
connectivity of wildfire among different land types. The results also identified the scale of risk and
the limitations of relying on small scattered fuel treatment units to manage long‐term wildfire risk.
Keywords: fuel treatment optimization modeling; Calabrian pine; Pinus brutia; European olive;
FlamMap; fire behavior modeling; minimum travel time algorithm; Lesvos Island
1. Introduction
Mediterranean areas are experiencing rapid expansion of communities into rural areas with
multiple adverse impacts in terms of invasive species, deforestation, and human activities that
increase fire ignitions [1]. The expanding intermix of flammable vegetation and low density
development along with a warming climate and more ignitions [2,3] has created a wicked wildfire
problem due to the significant economic burden of wildfire management, incomplete knowledge, the
number of people and opinions involved, and the interconnected nature of these problems with other
governance challenges [4–6]. Risk governance systems have failed to keep pace with the change in

Forests 2020, 11, 789 2 of 31
these anthropogenic fire regimes and new policies [7–13] proposed to address the wildfire problem
have yet to be implemented. These policies aim to improve landscape fuels management but stop
short of identifying specific spatial strategies and their outcome in terms of reducing future losses [3].
The core issue is identifying the scale of risk to ensure that fire management activities consider the
source and key values exposed to large wildfire events. Overlaying the spatial context of risk are the
multiple and complementary strategies that address the pinch points from ignition to containment.
Increasingly, literature from North America [14–19] and Southern Europe [20–22] has shown that
investing more in fuel management and pre‐fire planning is critical to mitigate upcoming challenges
that emerge from climate change and land abandonment effects on fuel patterns.
In Greece, different stakeholders see the wildfire issue as a symptom of a higher order problem
but tend to focus on specific solutions rather than a broad‐spectrum strategy. For example, some
point to poor forest and fuels management, while others argue that wildfire problems could be solved
if there were only more resources for fire suppression. Greece implements minimal levels of fuel
treatments in terms of extent, size, and intensity, and the government funds a broad mix of fire
prevention with local governments with a 2020 budget of 17 million euros, with an additional 2
million euros for fire protection in the Forest Service [23,24]. However, only a fraction of this funding
is applied to treat fuels in forested areas. Rarely do forest management agencies combine forest and
fuel treatments on management units at a scale comparable to the burned area of predicted fire
events. Thus, risk management is entirely dependent on fire suppression to protect people, private
property, and other values‐at‐risk. Managing fuels in Greece has multiple challenges such as rapid
re‐growth of fuels with vegetation that exceeds the flammability of what was removed, and
restrictions that exclude fuel management with prescribed fire. The bulk of the fuel treatments are
fuel breaks around communities and are located without strategic assessment of the likely wildfire
paths from wildlands [25]. Around the fuel breaks, the vegetation has the potential to burn in crown
fires that generate spot fires kilometers ahead of the fire perimeter [26]. By contrast, many studies
have shown that landscape scale programs that are strategically allocated are effective at changing
wildfire behavior before fires arrive at community boundaries [22,27–32]. Much of the evidence is
experimental, obtained through use of scenario planning tools to evaluate alternative management
strategies and estimation of potential trade‐offs [28,33–37]. For instance, previous studies have shown
that reduction in large fire growth is obtainable through the collective effect of many treatment units
occurring on the landscape with specific patterns and densities [27,38,39]. Random treatment patterns
are inefficient in changing large fire growth rates compared with strategic designs, because they
permit fire to easily move laterally around treatments, unless large portions of the landscape are
treated [40]. Several alternative fuel treatment methods exist that can be applied as prescriptions in
pre‐selected units on the landscape, including silvicultural tending with mechanical means (e.g.,
thinning, pruning), prescribed burning, and grazing for reducing surface and ladder fuels.
In this study, we first used wildfire simulation methods to assess the relative contribution of
different land cover types to the overall fire problem on a large and diverse fire prone landscape on
the island of Lesvos, Greece. The goal was to show the connectivity in terms of fire spread and
exposure among the major land types in a typical, highly fragmented Greek landscape. We then used
wildfire and fuel treatment simulation methods to develop an optimized fuel treatment program in
the extensive, fire prone conifer forests. The objective of the fuel treatments design was to effect broad
landscape fire risk reduction in terms of fire severity and control by suppression forces, rather than
fuel breaks focused in a specific location. Fuel treatments consisted of the removal of small trees and
saplings by thinning and cleaning the understory to reduce fuels. We assumed these treatments
would be achieved through grazing or mechanical means since prescribed fire is not legal in Greece.
Forest canopy fuels would be treated with silvicultural improvement methods including thinning
and pruning to increase tree canopy base height and reduce ladder fuels. We assess how the varied
land uses and associated vegetation interact and spread fire and examine how investments in forest
and fuel management can bring about landscape improvements in fire resiliency in the pine forests.
We discuss how the current practice of relying on fuel breaks will not significantly alter the growing
Forests 2020, 11, 789 3 of 31
wildfire risk problem without coupling with more extensive and intensive forest and fuel
management.
2. Materials and Methods
2.1. Study Area
The study area covers 46,800 ha located in the central part of Lesvos Island, Greece (Figure 1),
encompassing the largest continuous Calabrian pine (Pinus brutia) forest among the Aegean Sea
islands (21,000 ha). In terms of forest structure, about 16,500 ha are dense, 2700 ha are sparse, and
1800 ha are young forests. The species typically burns at high severity and regenerates by seed from
serotinous cones [41]. Calabrian pine has a short juvenile phase that leads to an early cone and seed
production that ensures regeneration in cases where fire frequency is relatively high [41]. Factors like
poor soils, steep slopes, post‐fire flash floods, grazing, and new wildfires substantially reduce post‐
fire regeneration success.
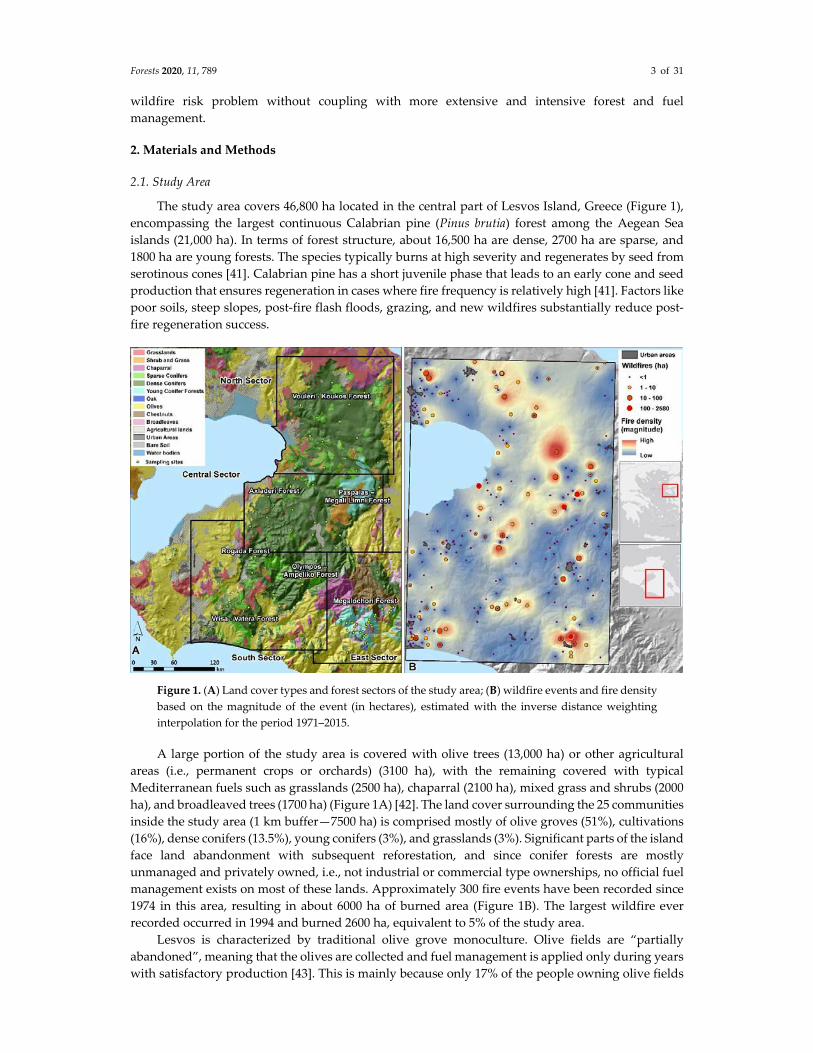
Figure 1. (A) Land cover types and forest sectors of the study area; (B) wildfire events and fire density
based on the magnitude of the event (in hectares), estimated with the inverse distance weighting
interpolation for the period 1971–2015.
A large portion of the study area is covered with olive trees (13,000 ha) or other agricultural
areas (i.e., permanent crops or orchards) (3100 ha), with the remaining covered with typical
Mediterranean fuels such as grasslands (2500 ha), chaparral (2100 ha), mixed grass and shrubs (2000
ha), and broadleaved trees (1700 ha) (Figure 1A) [42]. The land cover surrounding the 25 communities
inside the study area (1 km buffer—7500 ha) is comprised mostly of olive groves (51%), cultivations
(16%), dense conifers (13.5%), young conifers (3%), and grasslands (3%). Significant parts of the island
face land abandonment with subsequent reforestation, and since conifer forests are mostly
unmanaged and privately owned, i.e., not industrial or commercial type ownerships, no official fuel
management exists on most of these lands. Approximately 300 fire events have been recorded since
1974 in this area, resulting in about 6000 ha of burned area (Figure 1B). The largest wildfire ever
recorded occurred in 1994 and burned 2600 ha, equivalent to 5% of the study area.
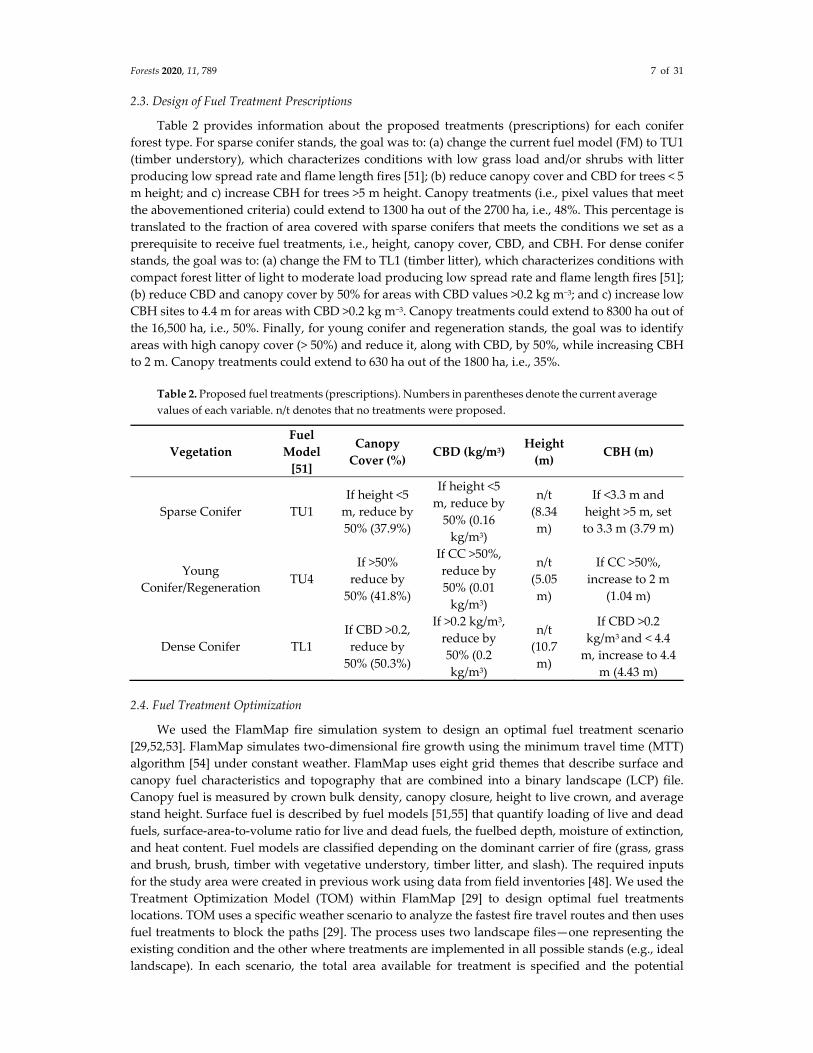
Lesvos is characterized by traditional olive grove monoculture. Olive fields are “partially
abandoned”, meaning that the olives are collected and fuel management is applied only during years
with satisfactory production [43]. This is mainly because only 17% of the people owning olive fields

Forests 2020, 11, 789 4 of 31
are full‐time farmers, with 42% being pensioners who practice farming as extra income, and the
remainder with a second occupation [44]. Regarding the size of the agricultural area, the average unit
is 8.2 ha, with half used for olive plantations. Previous studies [45] framed the typology of olive
cultivation in Lesvos (Figure 2). The abandoned plantations are former olive fields without
cultivation and without harvest for several years with a mixed fuel model comprised of annuals,
litter, and short shrubs that create dense understories (Figure 2C) and produce fast moving fires with
moderate intensity. The neglected plantations (Figure 2B) are shifting between abandonment and
cultivation based on the production of each year. The olive plantation fuel model is comprised of
annuals and short shrubs and produce low‐intensity, fast‐moving fires. Labor‐intensive plantations
(Figure 2A) are managed cultivations using herbicides, pile burning, or grazing, typically planted on
terraces with pruned trees and clear understories limiting available fuels to allow a fire to spread.
This state can be considered as the predominant landscape of Lesvos before the 1920s. Finally,
housing plantations (Figure 2D) are former olive fields, usually with high real estate value, where
one or more buildings are found. Grassy fuels are the primary carrier of fire in housing plantations,
but these are usually non‐transmitted fires that are rapidly extinguished. Changes between these
types are continuous, as cultivated or abandoned fields are cleared for housing, fields are abandoned
or neglected, and abandoned or neglected fields are cleared for cultivation [45], and thus all four
types were lumped into a single fuel model.
Figure 2. The typology of the four types of olive plantations [45]: (A) labor‐intensive plantations; (B)
neglected plantations; (C) abandoned plantations; (D) housing plantations (photos by the authors).
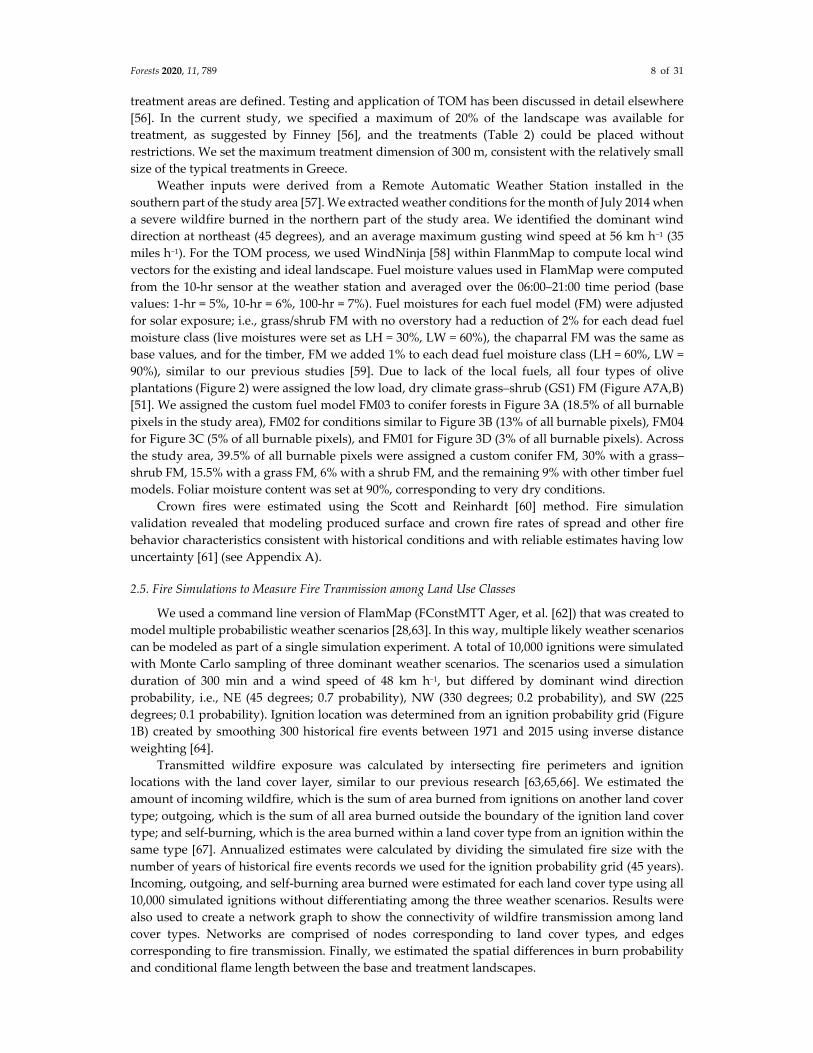
There are four dominant types of dense Calabrian pine forests on Lesvos (Figure 3). First, the
very dense conifers aged between 20–45 years old with deep litter layers and an absence of other tree
or understory species (Figure 3A). These forests are formerly burned forests that regenerated and
reached maturity, but without receiving any type of management. In these stands, mortality due to
severe competition results in natural thinning and reduced understory vegetation [46]. In addition,
dead branches of living trees reduce the crown base height that adds to the vertical continuity of the

Forests 2020, 11, 789 5 of 31
fuelbed. Finally, pine needle litter accumulation in thick undecomposed layers is evident, with a
storage of dead pine needles upon the dead branches of trees or upon understory woody vegetation
[46]. The most frequent dense conifer type is the short shrub understory mixed with litter (Figure 3B).
These are the most frequently burned forests during the past decade. Large parts of the landscape are
dominated by mature conifers where agroforestry or past fires reduced the quantity of fuels, creating
a relatively fire‐resilient forest (Figure 3C). Thirty‐year‐old Calabrian pine are quite resilient to
prescribed burning of understory vegetation since their rhydidome is at an age such that it is thick
enough to protect the cambium from the released heat [46]. Finally, dense mature conifer forests with
tall shrubs (> 2 m) are expected to produce high‐intensity fires if burned. In this older forest structural
stage, the stands are thinned naturally, and their density is decreasing. The understory is formed by
a very dense layer of live herbaceous and woody fuels mixed with conifer litter with very low
moisture content. Although we find all four types in our study area, the most common are those in
Figure 3B,C. In our previous studies [47] we used field inventory data [48] (see next section for more
details) to create four custom fuel models to accurately model the fire behavior in the
abovementioned conifer types. A detailed discussion on the four custom fuel model properties can be
found in Appendix A.
Figure 3. The typology of the four types of dense pine forests: (A) litter understory; (B) short shrub
understory with litter; (C) low‐fuel understory; (D) tall shrub understory with litter (photos by the
authors).
2.2. Field Inventories on Conifer Forests
The main conifer forested complex was divided into four study sectors: north, central, south,
and east (Figure 1A). Wildfires and human‐related activities such as grazing, resin collection,
infrastructure construction, and farming influenced the development and conditions of each sector.
During our previous studies [48], we conducted field inventories (circa 2009) on 52 plots (405 m2 each)
inside mature conifer forests capturing the range of existing vegetation and fuel conditions, with an
additional 30 plots inside post‐fire conifer regeneration sites (circa 2011), to measure or estimate tree
height, diameter at breast height (DBH), canopy base height (CBH) and crown bulk density (CBD),

Forests 2020, 11, 789 6 of 31
along with several other surface and canopy stand level attributes (Table 1) based on well‐established
field inventory and sampling protocols [49,50]. No major disturbances like fire, insects, disease, or
weather damages occurred on the sampled locations or across the study area since the time of field
inventories. On each plot, we measured all overstory dominant trees with their crown part of the
stand canopy, and understory trees or shrubs with DBH > 10 cm, including suppressed or young
trees or shrubs with heights lower than the stand canopy layer.
Table 1. Average vegetation and fuel conditions for the seven forests of the study area, as derived
from the field inventory on 82 plots. n.a.: not available. Basal area was estimated for the dominant
species (Calabrian pine).
Forest Plots Basal
Area
Mean
Tree
Height
Mean
Canop
y Base
Height
Canop
y
Cover
Overstory/
Understor
y Tree
Density
Mean
DBH
Litter
Depth
Dead
Fuel
Load
units n m2 ha−1 meters % n ha−1 cm tons ha−1
Vouleri‐
Koukos 10 38.3 10.6 4.2 59 1034/733 28.4 4 6.72
Paspalas‐
Megali
Limni
10 45.0 11 5 60 1077/533 23.7 10 8.96
Axladeri 9 44.5 11 5 57 790/584 28 4 5.82
Olympus‐
Ampeliko 8 80.6 13 5.6 58 858/599 35 12 18.83
Rogada 8 57.5 14.3 6.1 58 633/469 35 5.5 8.51
Vrisa‐Vatera 7 26.5 13 5 64 490/346 33 8.0 6.51
Megalochori 30 5.1 5.3 2.0 40 1480/n.a. 9.2 n.a. n.a.
The north sector has one forest (Vouleri‐Koukos) with dominant olive plantations east and west
of it, while to the north, grasslands and shrubs prevail. Over 90% of all recorded trees were conifers;
the litter layer was thin, while herbaceous vegetation and the most common shrub species found
elsewhere were absent due to grazing (Figure 3C). The central sector contains two forests (i.e.,
Paspalas‐Megali Limni and Axladeri). The first forest is located on a flat landscape dominated by
young conifers mixed with chaparral and shrubs, resulting from repeated wildfires during the years
1984 and 1992 (Figure 3A). The forest of Axladeri is located on the east side of the gulf of Kalloni,
with elevations spanning from 40 to 350 m, composed of either single story mature (Figure 3B) or
young conifer stands.
Forests in the south sector are comprised of tall and mature conifers (400–800 m), forming multi‐
story stands with early successional regeneration in canopy openings. Olympus‐Ampeliko forest
stands had an average DBH of 35 cm, and due to past management from resin collection activities,
we found stands with average DBH greater than 100 cm. Rogada forest is comprised of a mixture of
mature single or multi‐story conifer stands and farming areas. The Vrisa‐Vatera forest in the south
sector extends to the coastline with either young or mature multistory stands comprised of pine trees,
oak (Quercus macrolepis) and shrubs (Quercus coccifera) (Figure 3D). This forest receives pressure from
urban development and touristic activities, resulting in more than 40 fire incidents during the past
40 years, but fire size was small for each incident, i.e., < 10 ha and only one with 100 ha. Finally, the
east sector is situated on an elevation gradient between 450 and 810 m, dominated by a regenerated
conifer forest resulting from the large wildfire of 1994. Young conifers were usually mixed with oaks,
shrubs (Quercus coccifera), and small shrubs (phrygana). Other large areas were dominated by chestnut
trees, tall shrubs, and olive trees.
Forests 2020, 11, 789 7 of 31
2.3. Design of Fuel Treatment Prescriptions
Table 2 provides information about the proposed treatments (prescriptions) for each conifer
forest type. For sparse conifer stands, the goal was to: (a) change the current fuel model (FM) to TU1
(timber understory), which characterizes conditions with low grass load and/or shrubs with litter
producing low spread rate and flame length fires [51]; (b) reduce canopy cover and CBD for trees < 5
m height; and c) increase CBH for trees >5 m height. Canopy treatments (i.e., pixel values that meet
the abovementioned criteria) could extend to 1300 ha out of the 2700 ha, i.e., 48%. This percentage is
translated to the fraction of area covered with sparse conifers that meets the conditions we set as a
prerequisite to receive fuel treatments, i.e., height, canopy cover, CBD, and CBH. For dense conifer
stands, the goal was to: (a) change the FM to TL1 (timber litter), which characterizes conditions with
compact forest litter of light to moderate load producing low spread rate and flame length fires [51];
(b) reduce CBD and canopy cover by 50% for areas with CBD values >0.2 kg m−3; and c) increase low
CBH sites to 4.4 m for areas with CBD >0.2 kg m−3. Canopy treatments could extend to 8300 ha out of
the 16,500 ha, i.e., 50%. Finally, for young conifer and regeneration stands, the goal was to identify
areas with high canopy cover (> 50%) and reduce it, along with CBD, by 50%, while increasing CBH
to 2 m. Canopy treatments could extend to 630 ha out of the 1800 ha, i.e., 35%.
Table 2. Proposed fuel treatments (prescriptions). Numbers in parentheses denote the current average
values of each variable. n/t denotes that no treatments were proposed.
Vegetation
Fuel
Model
[51]
Canopy
Cover (%) CBD (kg/m3)
Height
(m) CBH (m)
Sparse Conifer TU1
If height <5
m, reduce by
50% (37.9%)
If height <5
m, reduce by
50% (0.16
kg/m3)
n/t
(8.34
m)
If <3.3 m and
height >5 m, set
to 3.3 m (3.79 m)
Young
Conifer/Regeneration TU4
If >50%
reduce by
50% (41.8%)
If CC >50%,
reduce by
50% (0.01
kg/m3)
n/t
(5.05
m)
If CC >50%,
increase to 2 m
(1.04 m)
Dense Conifer TL1
If CBD >0.2,
reduce by
50% (50.3%)
If >0.2 kg/m3,
reduce by
50% (0.2
kg/m3)
n/t
(10.7
m)
If CBD >0.2
kg/m3 and < 4.4
m, increase to 4.4
m (4.43 m)
2.4. Fuel Treatment Optimization
We used the FlamMap fire simulation system to design an optimal fuel treatment scenario
[29,52,53]. FlamMap simulates two‐dimensional fire growth using the minimum travel time (MTT)
algorithm [54] under constant weather. FlamMap uses eight grid themes that describe surface and
canopy fuel characteristics and topography that are combined into a binary landscape (LCP) file.
Canopy fuel is measured by crown bulk density, canopy closure, height to live crown, and average
stand height. Surface fuel is described by fuel models [51,55] that quantify loading of live and dead
fuels, surface‐area‐to‐volume ratio for live and dead fuels, the fuelbed depth, moisture of extinction,
and heat content. Fuel models are classified depending on the dominant carrier of fire (grass, grass
and brush, brush, timber with vegetative understory, timber litter, and slash). The required inputs
for the study area were created in previous work using data from field inventories [48]. We used the
Treatment Optimization Model (TOM) within FlamMap [29] to design optimal fuel treatments
locations. ΤΟΜ uses a specific weather scenario to analyze the fastest fire travel routes and then uses
fuel treatments to block the paths [29]. The process uses two landscape files—one representing the
existing condition and the other where treatments are implemented in all possible stands (e.g., ideal
landscape). In each scenario, the total area available for treatment is specified and the potential
Forests 2020, 11, 789 8 of 31
treatment areas are defined. Testing and application of TOM has been discussed in detail elsewhere
[56]. In the current study, we specified a maximum of 20% of the landscape was available for
treatment, as suggested by Finney [56], and the treatments (Table 2) could be placed without
restrictions. We set the maximum treatment dimension of 300 m, consistent with the relatively small
size of the typical treatments in Greece.
Weather inputs were derived from a Remote Automatic Weather Station installed in the
southern part of the study area [57]. We extracted weather conditions for the month of July 2014 when
a severe wildfire burned in the northern part of the study area. We identified the dominant wind
direction at northeast (45 degrees), and an average maximum gusting wind speed at 56 km h−1 (35
miles h−1). For the TOM process, we used WindNinja [58] within FlanmMap to compute local wind
vectors for the existing and ideal landscape. Fuel moisture values used in FlamMap were computed
from the 10‐hr sensor at the weather station and averaged over the 06:00–21:00 time period (base
values: 1‐hr = 5%, 10‐hr = 6%, 100‐hr = 7%). Fuel moistures for each fuel model (FM) were adjusted
for solar exposure; i.e., grass/shrub FM with no overstory had a reduction of 2% for each dead fuel
moisture class (live moistures were set as LH = 30%, LW = 60%), the chaparral FM was the same as
base values, and for the timber, FM we added 1% to each dead fuel moisture class (LH = 60%, LW =
90%), similar to our previous studies [59]. Due to lack of the local fuels, all four types of olive
plantations (Figure 2) were assigned the low load, dry climate grass–shrub (GS1) FM (Figure A7A,B)
[51]. We assigned the custom fuel model FM03 to conifer forests in Figure 3A (18.5% of all burnable
pixels in the study area), FM02 for conditions similar to Figure 3B (13% of all burnable pixels), FM04
for Figure 3C (5% of all burnable pixels), and FM01 for Figure 3D (3% of all burnable pixels). Across
the study area, 39.5% of all burnable pixels were assigned a custom conifer FM, 30% with a grass–
shrub FM, 15.5% with a grass FM, 6% with a shrub FM, and the remaining 9% with other timber fuel
models. Foliar moisture content was set at 90%, corresponding to very dry conditions.
Crown fires were estimated using the Scott and Reinhardt [60] method. Fire simulation
validation revealed that modeling produced surface and crown fire rates of spread and other fire
behavior characteristics consistent with historical conditions and with reliable estimates having low
uncertainty [61] (see Appendix A).
2.5. Fire Simulations to Measure Fire Tranmission among Land Use Classes
We used a command line version of FlamMap (FConstMTT Ager, et al. [62]) that was created to
model multiple probabilistic weather scenarios [28,63]. In this way, multiple likely weather scenarios
can be modeled as part of a single simulation experiment. A total of 10,000 ignitions were simulated
with Monte Carlo sampling of three dominant weather scenarios. The scenarios used a simulation
duration of 300 min and a wind speed of 48 km h−1, but differed by dominant wind direction
probability, i.e., NE (45 degrees; 0.7 probability), NW (330 degrees; 0.2 probability), and SW (225
degrees; 0.1 probability). Ignition location was determined from an ignition probability grid (Figure
1B) created by smoothing 300 historical fire events between 1971 and 2015 using inverse distance
weighting [64].
Transmitted wildfire exposure was calculated by intersecting fire perimeters and ignition
locations with the land cover layer, similar to our previous research [63,65,66]. We estimated the
amount of incoming wildfire, which is the sum of area burned from ignitions on another land cover
type; outgoing, which is the sum of all area burned outside the boundary of the ignition land cover
type; and self‐burning, which is the area burned within a land cover type from an ignition within the
same type [67]. Annualized estimates were calculated by dividing the simulated fire size with the
number of years of historical fire events records we used for the ignition probability grid (45 years).
Incoming, outgoing, and self‐burning area burned were estimated for each land cover type using all
10,000 simulated ignitions without differentiating among the three weather scenarios. Results were
also used to create a network graph to show the connectivity of wildfire transmission among land
cover types. Networks are comprised of nodes corresponding to land cover types, and edges
corresponding to fire transmission. Finally, we estimated the spatial differences in burn probability
and conditional flame length between the base and treatment landscapes.
Forests 2020, 11, 789 9 of 31
3. Results
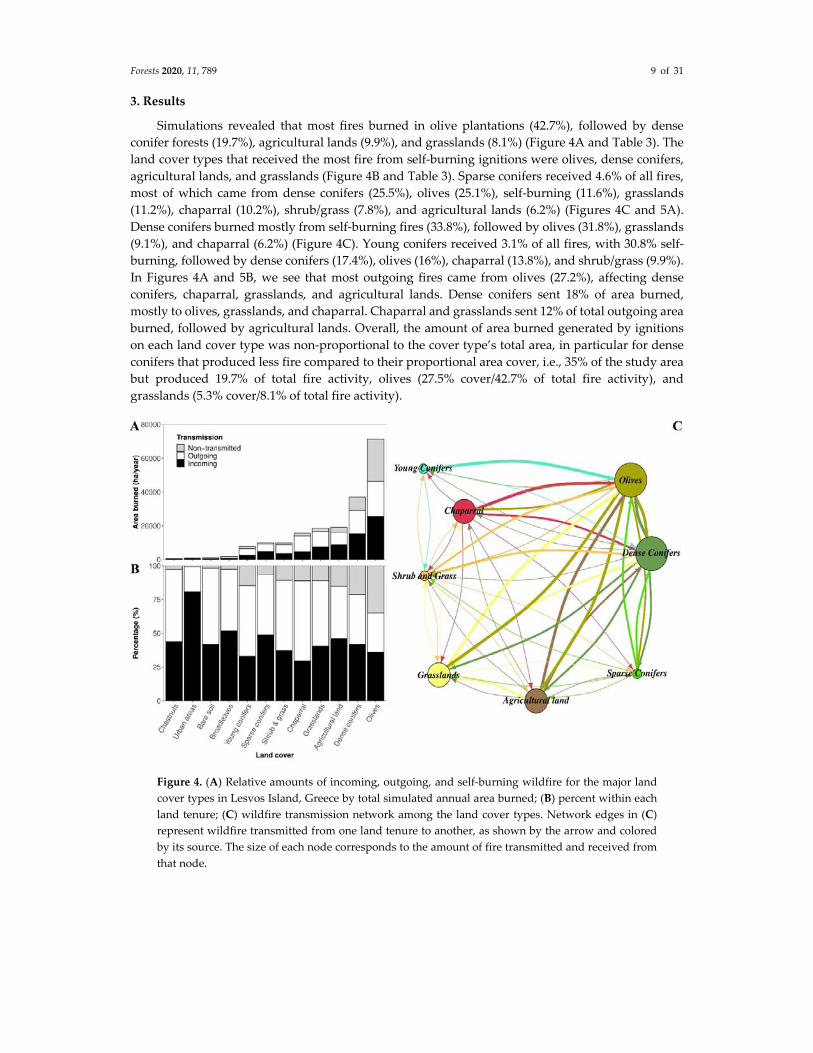
Simulations revealed that most fires burned in olive plantations (42.7%), followed by dense
conifer forests (19.7%), agricultural lands (9.9%), and grasslands (8.1%) (Figure 4A and Table 3). The
land cover types that received the most fire from self‐burning ignitions were olives, dense conifers,
agricultural lands, and grasslands (Figure 4B and Table 3). Sparse conifers received 4.6% of all fires,
most of which came from dense conifers (25.5%), olives (25.1%), self‐burning (11.6%), grasslands
(11.2%), chaparral (10.2%), shrub/grass (7.8%), and agricultural lands (6.2%) (Figures 4C and 5A).
Dense conifers burned mostly from self‐burning fires (33.8%), followed by olives (31.8%), grasslands
(9.1%), and chaparral (6.2%) (Figure 4C). Young conifers received 3.1% of all fires, with 30.8% self‐
burning, followed by dense conifers (17.4%), olives (16%), chaparral (13.8%), and shrub/grass (9.9%).
In Figures 4A and 5B, we see that most outgoing fires came from olives (27.2%), affecting dense
conifers, chaparral, grasslands, and agricultural lands. Dense conifers sent 18% of area burned,
mostly to olives, grasslands, and chaparral. Chaparral and grasslands sent 12% of total outgoing area
burned, followed by agricultural lands. Overall, the amount of area burned generated by ignitions
on each land cover type was non‐proportional to the cover type’s total area, in particular for dense
conifers that produced less fire compared to their proportional area cover, i.e., 35% of the study area
but produced 19.7% of total fire activity, olives (27.5% cover/42.7% of total fire activity), and
grasslands (5.3% cover/8.1% of total fire activity).
Figure 4. (A) Relative amounts of incoming, outgoing, and self‐burning wildfire for the major land
cover types in Lesvos Island, Greece by total simulated annual area burned; (B) percent within each
land tenure; (C) wildfire transmission network among the land cover types. Network edges in (C)
represent wildfire transmitted from one land tenure to another, as shown by the arrow and colored
by its source. The size of each node corresponds to the amount of fire transmitted and received from
that node.

Forests 2020, 11, 789 10 of 31
Figure 5. (A) Predicted annual area burned from fires ignited elsewhere by source of ignition (bar
colors indicate fire source); (B) Outgoing area burned on other land cover types (y‐axis labels indicate
fire source; bar colors indicate recipient of fire).
Table 3. Burned area by land cover type and fire type (incoming or self‐burning). Total burned area
is the sum of incoming and self‐burning area.
Area
(ha)
Incoming
Fire
(ha yr−1)
Self‐
Burning
(ha yr−1)
Total
Burned
Area
(ha yr−1)
Total
Burned
Area
(%)
Incoming
from Total
Burned
Area (%)
Self‐
Burning
from
Total
Burned
Area (%)
Olives 12,800 25,618 24,939 50,557 42.7 50.7 49.3
Dense conifers 16,500 15,481 7898 23,379 19.7 66.2 33.8
Agricultural land 3300 8796 2880 11,676 9.9 75.3 24.7
Grasslands 2500 7603 2030 9633 8.1 78.9 21.1
Sparse conifers 2700 4841 635 5476 4.6 88.4 11.6
Chaparral 2100 4649 1747 6397 5.4 72.7 27.3
Shrub & grass 2000 3698 1064 4762 4.0 77.7 22.3
Young conifers 1800 2574 1145 3720 3.1 69.2 30.8
Broadleaves 550 954 47 1001 0.8 95.3 4.7
Urban areas 400 743 6 749 0.6 99.2 0.8
Bare soil 330 432 18 451 0.4 95.9 4.1
Water 660 267 0 267 0.2 99.8 0.2
Chestnuts 1120 264 16 281 0.2 94.2 5.8
Oak 40 92 2 94 0.1 98.1 1.9
SUM 46,800 76,013 42,428 118,441 100
The proposed combined surface and canopy fuel treatment units inside conifer forests, as
described in Table 2 and derived from TOM simulations, spanned 7600 ha, with 6000 ha located
inside dense, 770 ha inside sparse, and 500 ha inside young conifer forests (Figure 6A). This can be
translated as 35% of all conifer covered lands and 16% of the total simulation landscape (i.e., 46,800
ha). These treatment areas included 75 polygons with an area >10 ha and 64 polygons between 10 and
100 ha. Five treatment units were between 100 and 250 ha, four between 350 and 650 ha, and two
between 800 and 900 ha. Two‐thirds of all treatments were located on ten units, each with area greater
than 200 ha. At the north and eastern parts of the Vouleri‐Koukos forest, we found the largest and
most continuous treatments sites. The Olympus‐Ampeliko forest also had large candidate areas for

Forests 2020, 11, 789 11 of 31
fuel treatments. Smaller treatment units were established inside the Axladeri and Vrisa‐Vatera
forests, while the conifer forest east of the chestnut forests in the Megalochori forest had also great
potential for successful fuel treatment application.
Figure 6. (A) Modifications of canopy cover characteristics for generating the ideal landscape on
dense, sparse, and young conifer forests (red, yellow, and purple areas, respectively); (B) optimum
fuel treatment areas (red dashed polygons) inside conifer forests where the combined canopy and
surface treatments can reduce wildfire behavior, as calculated by TOM.
The percentage of burned area of each land cover type from the total area burned from each
large (> 50 ha) simulated fire was estimated using the outputs of the two stochastic MTT simulations
(pre‐ and post‐fuel treatments modeling), and was compared using boxplots (Figure A5). The number
of large simulated fires were 8470 for the baseline conditions and 5510 after fuel treatment modeling,
with a notable reduction in the percent area burnt by large fires for dense conifers.
Under the assumption that we treated the entire landscape for the stochastic simulations with
the MTT algorithm (Figure 6A), the decrease in burn probability (BP) was greater in the southern
section of the study area and in parts of the Olympus‐Ampeliko and Axladeri forests (Figure 7A),
while conditional flame length (CFL) reduction was moderate for most of the dense conifer forests
and higher in parts of the Olympus‐Ampeliko and Vrisa‐Vatera forests (Figure 7B). We noticed that
conifer fuel treatments influenced the value of burn probability on different land cover types (Figure
7A), but regarding CFL, almost all pixels with a reduction greater than 1 m were inside conifer forests
(Figure 7B). The greatest number of times a pixel could be burned on the base condition simulations
was by 395 (out of the 10,000 fires simulated), and decreased to 319 on the ideal conditions simulation
(burn probabilities were 0.0395 and 0.0319, respectively). Simulations after applying fuel treatments
revealed that sparse conifer forests experienced on average 60 fewer fires and CFL was reduced by
1.17 m; dense conifer forests experienced 50 fewer fires and a CFL reduction of 1.47 m; and young
conifer forests experienced 20 fewer fires and a CFL reduction of 0.09 m. We found that more than a
third (7800 ha) of conifer forests had a minor reduction in CFL (<1 m), while 9500 ha had a moderate
reduction (>1 m up to 2 m), 2300 ha moderate‐high reduction (>2 m up to 3 m), and 1400 ha high to
very high reduction (>3 m). About 14,500 ha of conifer forests were projected to show a moderate or
low decrease in burn probability, 3500 ha a moderate‐high decrease, and 3000 ha a high to very high
reduction. For the treatment sites selected by TOM, the reduction in both BP and CFL was high to

Forests 2020, 11, 789 12 of 31
very high for 20% of their area (approximately 1500 ha), while approximately 50% for both metrics
showed a moderate reduction.
Figure 7. Decrease in: (A) burn probability (BP) and (B) conditional flame length (CFL), as calculated
by stochastic fire simulations with MTT for the entire study area.
4. Discussion
Our results showed the how diverse land cover types and land use practices contribute to fire
spread on a typical Greek landscape, and how a fuel management program targeting the conifer
forests can reduce area burned and fire intensity. One key finding is that olive plantations were
predicted to be a substantial contributor to fire exchange among the land cover types even though
they cover 22% less area compared to the conifer forests. Olive plantations interspersed with
abandoned agricultural lands and grasslands create a fuel mosaic with high rates of overall fire
spread. All the major land cover types showed high fire connectivity as measured by fire transmission
metrics, with more than half of the outgoing area burned originating from olive plantations and dense
conifers. Olives received substantial fire originating on conifer forests, since formerly cultivated olive
groves have been invaded by conifers, and on highly productive lands, farmers expanded their
cultivations through conifer deforestation (Figure A6A). The result of these land transitions is an
increase in shared boundary, and high interdependence in terms of fire spread.
When fuel treatments were located with the TOM optimization process, most of the treatments
were placed near boundaries of conifer forests with olives, underscoring the importance of this
intermixed land type in the management of fire. Most of the conifer forest was of low priority for
receiving fuel treatments because past management practices (agroforestry, silvo‐pastoralism,
grazing, and resin collection) have collectively kept fuel loads lower relative to the olive–pine
intermix. Fuel treatments were also not allocated by the TOM process in areas with a high historical
fire density. Overall, the results of the fuel treatment simulation showed that treatments can reduce
burn probability and fire intensity on both land cover types. Most treatment units were between 200
and 900 ha, creating a network of adjacent units.
The network diagram of fire exchange among the land uses (Figure 4C) supports the need for a
comprehensive fuel treatment program that extends beyond confer forests to consider all land cover
types and their respective contribution to large fires. Limited budgets need to be allocated to

Forests 2020, 11, 789 13 of 31
efficiently address fire risk, considering the spatial pattern of ignitions, fuel loading, weather
patterns, values‐at‐risk, and suppression strategies on the different land cover types [39,68]. An
effective fire risk management strategy should consider the role of direct fire suppression and indirect
fuel management on fire size distributions, and understand how fire regimes will be naturally
affected by climatic changes through changes in fire weather conditions or changes in dominant
forest cover types [69].
In Lesvos, and Greece in general, fire‐resilient landscapes have historically been created and
maintained by land use practices associated with agroforestry and silvo‐pastoralism. These practices
were prevalent until the early 1970s and included abundant and frequent low‐intensity fire. This is a
useful reference condition similar to that used in western US conifer forests to describe resilient
forests maintained by natural fires [70]. However, after thousands of years of human activities in
Greece, natural and anthropogenic influences on fire regimes are inseparable, except for small
enclaves in northern Greece where virgin forests are unaffected by humans with a high‐severity
stand‐replacing fire regime (200–400 years). By contrast, the contemporary fire regime is
characterized by <50 years of high‐severity stand‐replacing human‐ignited fires burning in
abandoned former agricultural areas with live fuel accumulation and spreading into unmanaged
forested areas with dead fuel accumulation. This fire regime resulted from the rural exodus in the
1970s, and aggressive fire suppression policies that created positive feedbacks on the fire regime over
time.
Increasing fuel loadings from land abandonment and afforestation need to be addressed with
expanded use of agroforestry and silvo‐pastoralism [71,72] in the areas surrounding conifer forests.
Agroforestry reduces understory vegetation while also providing revenue from the sale of biomass
as food or fuel [73]. Silvo‐pastoralism can be used to target specific fuels, since grasses and herbaceous
vegetation are preferred by cows, horses, and pigs, while goats have a preference for feeding on
woody shrubs and young trees [71]. Grazing could also be intensified and reinforced with subsidies
to peri‐urban livestock farms in those areas we showed through simulated treatments can reduce fire
spread rate [74]. One strategy to expand these practices is through implementation of the European
Union’s Common Agricultural Policy (CAP), which can be leveraged to reduce fire hazard by: (1)
promoting the reintroduction of livestock grazing in areas prone to abandonment [74], (2) creation of
agricultural low‐hazard belts around urban areas and values‐at‐risk, (3) the regulation of burning by
shepherds and fire use, and (4) directing management to high fire risk areas, giving preference to
agroforestry [75]. The result of these efforts could be heterogeneous agroforestry mosaics that allocate
crops in an aggregated pattern (10 km yr−1 for Lesvos Island), thus providing more opportunities to
suppress fires. CAP could also be leveraged to promote regional plans that sustain rural activities in
remote areas to ensure the maintenance of croplands, orchards, or pastures over time [76].
In terms of community wildfire protection, it is useful to note that there are distinct land use
patterns around developed areas and resulting fire exposure and mitigation strategies. For instance,
the three major activities around the communities of Lesvos Island are olive cultivation, animal
production, and tourism, where each has a typical fuel complex (Figure A6A,B) and optimal strategy
for fuel management. Communities surrounded by conifer forests (Figure A6B) are a high priority
for large landscape fuel management programs as demonstrated in this study. Communities in
Figure A6C,D are surrounded by olive or other cultivations and orchards, in which case fire risk
reduction is dependent on many small landowners managing fuels inside the plantations. The
importance of olive plantations in the exchange of fire among land uses was a key finding in the
study, where one third of all transmitted fire originated from these areas. Fuel management should
be prioritized and spatially coordinated among landowners to create fuel break systems that can
facilitate fire suppression as part of community protection programs.
The dense conifer forests were also a significant source of fire transmission to other land uses
(one fifth of the total) and creating fire resilient forests will require significant expansion of traditional
fuel management practices. The Greek Forest Service has the authority to license individuals from
forested communities to extract forest biomass for household or commercial reasons, a cost‐effective
and socially accepted alternative to fuel treatments performed by contractors. Biomass extraction for

Forests 2020, 11, 789 14 of 31
bioenergy is one solution for Mediterranean policy makers to consider, but these programs need to
be scaled over large areas to substantially reduce area burned during extreme weather events [77],
and treatments need to include unmanaged or abandoned lands and private forests, and targeted to
source areas that cause high exposure with high hazard. Currently, industrial timber production in
high productivity timber stands (>100 m3 ha−1 and DBH ≥ 5 cm) is applied on 400,000 ha across all
Greece, while in less productive stocks (<100 m3 ha−1), it is applied in more than one million ha [72].
The annual timber production is 1.1 million m3, 30% of which comes from private forests; one third
is produced from conifer species, with most of the production (~65%) used as fuelwood. Collaborative
actions between private contractors and the Greek Forest Service to perform silvicultural thinning
could reduce wildfire activity and improve the ecology and health of future forests (e.g., stewardship
contracting; see [78]). For the protection of private conifer forests, compulsory fuel removal on
surrounding fire prone farmlands could help reduce the risk of transmitted wildfire from those lands.
The selection of fuel management projects presents a challenge to forest management agencies
to reduce fuels at landscape scales while addressing, among others, the presence of human
infrastructure and settlements, the smoke effects on human health and recreation, the protection of
highly valued resources, such as wildland habitat and drinking water quality, and constraints such
as timber targets set in forest management plans. Policies, constraints, and regulations that restrict
treatment location, type, and total area treated can significantly degrade the performance of these
strategies [56]. Using modeling approaches as described in this work can provide forest managers
with a number of different potential treatment polygons that, in turn, using on‐ground knowledge
and spatial data, can be selected to design a strategy that will minimize negative effects while
achieving fire risk reduction targets. Newer methods such as scenario planning and trade‐off
analyses can help predict optimal treatment locations to apply to each strategy [79,80].
All fuel management scenarios considered in this study assumed the use of mechanical means
to reduce forest fuels and excluded the use of prescribed fire since it is currently illegal in Greece.
Legislative reforms to allow the careful application of prescribed fire could substantially accelerate
policy to reduce fuel loadings by providing a low‐cost method for fuel management. The
effectiveness of fire in fuel management is widely supported by recent studies that found higher fuel
treatment effectiveness under extreme conditions for treatments included broadcast burning,
compared to thinning and/or pruning alone [32,81–83]. The latter treatments can contribute to surface
fuel biomass accumulation and more severe wildfire effects. While it is still common and legal for
farmers to use fire (pile and burn) in olive groves to remove fuels (Figure A7), frequent burning is
required to maintain low fuels loads under Mediterranean conditions and prevent severe fires
[1,32,84,85]. A recent study in Catalonia suggested that applying prescribed fire treatments (15,000
ha yr−1 in an area of 32,000 km2, i.e., 750 ha yr−1 for Lesvos Island), can greatly contribute to a decrease
in high intensity fire and extreme fire events [86]. In addition, allowing prescribed burning under a
controlled forage burning program administered by an authorized agency would reduce the risk
from frequent illegal fires set by livestock farmers to increase forage production.
We note several limitations and assumptions to this work. Fire behavior modeling of proposed
fuel treatments can overestimate the effectiveness of potential fuels treatment to reduce fire behavior
[87] if fuel models do not accurately reflect the post‐treatment conditions. Fire managers are required
to evaluate and justify the effectiveness of planned fuel treatments resulting from modeling processes
in modifying fire growth, behavior and effects on resources and assets [88]. Validation of fire behavior
modeling outputs was a crucial component of this analysis, and we performed local accuracy
assessments to validate that the modeled fire behavior of each fuel model closely resembles the
observed one (Appendix A). Accuracy and results validation for MTT simulations in Greece have
been assessed during previous studies [47,89,90] (Appendix A). Surface fuel conditions and canopy
cover have not experienced major disturbances within the study area since the time of field
inventories (circa 2009), but a major source of potential simulation error comes from the accuracy of
spatial inputs regarding fuel conditions in the canopy layer, especially regarding crown bulk density.
This is a result from both mapping error (see [48]) and forest growth since the time of field
inventories. Additionally, TOM assumes that reduction in large fire growth is obtainable through the

Forests 2020, 11, 789 15 of 31
collective effect of many units occurring on the landscape [38]. We also assumed that simulated
wildfires were larger than the fuel treatment units to allow the analysis to focus on the directions in
which fires move rather than their start locations [53]. We also did not account for the benefits of the
proposed treatments on fire suppression, and thus we underestimated the reduction in area burned
in the treated landscape. Another assumption is that we estimated the impact of large fires that can
escape initial attack by burning under the most frequent, but also average–extreme weather
conditions (average worst‐case fire potential), thus simulating the proposed treatments to perform
under these target conditions. A limitation of TOM is that it requires a single modeled weather
scenario; thus, we restricted the modeling on a single fire front from one wind direction and speed.
Less frequent weather scenarios and from different fire fronts could potentially highlight different
treatment locations, but with lower probability of experiencing a wildfire. To address this, during
stochastic MTT simulations, we used thousands of ignitions under different weather scenarios to
account for both spatial and weather variability. Although we used three different weather scenarios,
they describe only the current dominant weather conditions without considering the uncertainty
related to climate warming scenarios and how climate change can exacerbate fire risk in
Mediterranean Europe in the coming decades [91]. This makes even more critical the need for
proactive fuel reduction treatments simultaneously combined with other management options (i.e.,
a more proactive and integrative management).
The spatial optimization of fuel treatments in this study assumes that all treatment units will be
implemented at a given instance in time, but in reality, treatments are accomplished on an annual
basis and treatment effects in reducing fire behavior diminish with time, approximately one decade
after implementation [29]. Given the historical treatment rate that the Greek forest management
agencies can implement annually, to effectively treat 7600 ha (16% of the landscape) as simulated
here in the span of a decade, the annual treatment rate must be no lower than 760 ha yr−1 (1.6% of the
landscape), which is actually twice as much as the percentage locally treated with best‐case
administrative conditions in Greece (e.g., the local Forest Service branch of Kassandra in Chalkidiki,
northern Greece, with an area similar to our case study). Finally, we did not exclude high slope (20%
of the proposed treatment is located on slopes >20°), rugged and high elevation sites, which can
substantially decrease the available land for fuel treatments.
5. Conclusions
This study explored the exchange of wildfire among diverse land uses on a typical Greek
landscape and used an optimization approach to demonstrate the potential benefits of a fuel
treatment program that targeted conifer forests. The optimized allocation of 7600 ha of fuel
treatments inside conifer forests can substantially reduce wildfire intensity and burn probability,
mostly on lands with high olive‐conifer connectivity. By identifying major fire travel routes and
attempting to block them through fire behavior modeling exercises, we gained an insight into the
efficiency of current or proposed fuel treatments. The fuel treatment effectiveness presented here was
achieved with an optimized allocation of treatment units with an area greater than 200 ha. While our
study site does not directly address the full range of fuel conditions found in Mediterranean fire‐
prone ecosystems, our methodology can be applied at any geographical extent if the required spatial
inputs for modeling exist. Future work will focus on cooperative landscape fuel management of olive
groves and forested areas to create an olea–pinus landscape fuel management strategy that includes
multiple adjacent treatments that cross vegetation type boundaries. The intensification and support
of traditional land use practices provides an opportunity to reduce risk more efficiently with limited
resources.
Author Contributions: Conceptualization, P.P. and K.K.; methodology, P.P., A.A.A., and K.K.; writing—original
draft preparation, review, and editing, P.P., A.A.A., M.A.D., and K.K. All authors have read and agreed to the
published version of the manuscript.
Funding: This research has been supported by the USDA Forest Service International Programs (grant no. G‐3–
10895).

Forests 2020, 11, 789 16 of 31
Conflicts of Interest: The authors declare no conflict of interest.
Appendix A
Appendix A.1. Fire Simulations Validation
In a landscape, as there are numerous potential combinations of vegetation types, characteristics,
and succession stages, and it is almost impossible to characterize all possible combinations, the most
common approach used for fire‐spread modeling is to generalize and characterize fuels into a finite
number of fuel models [92]. Using fire simulation based on the Rothermel’s model [93] requires the
selection of standard fire behavior fuel models [51], or the calibration of custom fuel model
parameters against observed fire rate of spread or flame length [93–95]. The selection of the standard
fuel models for the simulations presented in this research effort was based on the similarity to actual
fuels in terms of general fire‐carrying fuel type, fuel properties (e.g., depth, live fuel load,
compactness), photo‐guides and expected fire behavior. For each land cover class, except for conifer
forests, we assigned a standard fuel model from the set of 40 fuel models of Scott and Burgan [51].
For conifer forests, we used four previously created custom fuel models that describe the four types
of conifer fuel conditions found in the study area. In this Appendix, we first provide a brief
explanation of the characteristics of the custom conifer fuel models, and then we present the results
of testing and comparison of simulated fire behavior for these four custom fuel models with standard
fuel models [51] under three fuel moisture scenarios. Finally, we provide a comparison of the actual
fire perimeters for five historical fires that occurred on Lesvos island with simulated fire perimeters
using three indices: the Jacard coefficient, the areal association coefficient, and the Sørensen–Dice
coefficient. Three of these fires occurred or burned in conifer forests, and we provide a comparison
from two simulations, one with custom and the other with standard fuel models for conifer‐
dominated areas. The other two fire events occurred and burned in olive groves or grass–shrub‐
dominated areas; thus, no custom fuel models were used. All simulations were conducted with
FARSITE [96] to ensure that the wind variability simulated during all these events will be considered,
since the minimum travel time (MTT) algorithm [54] uses only one set of wind speed and direction
for each simulated fire event. The validation of stochastic fire simulations with MTT was achieved by
comparing the average fire size of all simulated large fires (>50 ha) with historical fires, and by
ensuring that the maximum simulated burned area matched the historical.
Appendix A.2. Methods
Appendix A.2.1. Characteristics of Custom Conifer Fuel Models
During our previous research efforts [47,48], we created four custom fuel models which describe
the fuel conditions that can be found inside Calabrian pine (Pinus brutia) forests (Table A1). The first
fuel model (FM01) describes the fuel conditions of conifer forests with maquis dominating understory
(>20% understory cover) and an average height of over 1.5 m (Pistacia lentiscus, Quercus coccifera,
Arbutus unedo, Phillyrea media), mixed with litter from Calabrian pine. The second fuel model (FM02)
describes the fuel conditions of conifer forests with a mixture of brush and short shrub (phrygana)
dominating understory (>20% understory cover) and an average height lower than 1.5 m (Erica
malipuliflora, Sarcopterium spinosum, Cistus creticus, Cistus savofolius, Genista acanthoclada, Juniperus
oxycedrus), mixed with litter from Calabrian pine. Compared to FM01, shrubs are sparse and shorter,
and fires are transmitted mostly from the combustion of conifer litter. The third fuel model (FM03)
describes the fuel conditions of conifer forests with litter and other downed dead fuels dominating
the understory (>70% cover), mixed with short sparse shrubs (<30% cover). Finally, the fourth fuel
model (FM04) describes the fuel conditions of conifer forests that have been grazed, burned, or
managed (timber or resin collection) with enclaves of regeneration, where the general fire carrier is
low loading of canopy litter mixed with annuals, short brush, seedlings, and saplings.

Forests 2020, 11, 789 17 of 31
Table A1. Parameters of the custom fuel models used in Lesvos simulations. Table adapted from [47].
Sa/V: fuel surface area‐to‐volume ratio; Lh: Live herbaceous; Lw: Live woody.
Fuel
Model
1‐hr
Fuel
Load
10‐hr
Fuel
Load
100‐hr
Fuel
Load
Live
Herba
ceous
Live
Woody
Fuel
Depth
Dead Fuel
Moisture
of
Extinction
1‐hr
Sa/V
Sa/V
Lh
Sa/V
Lw
Live
Moisture
units tons/ acre feet % 1/feet type
FM01 3.53 1.27 1.47 0.03 5.08 1.97 15 750 1800 1600 dynamic
FM02 3.43 1.45 0.73 0.04 1.32 0.82 25 1500 1800 750 dynamic
FM03 3.05 1.09 0.98 0.04 0.88 0.52 35 1800 1800 1600 dynamic
FM04 1.12 1.00 0.49 0.06 0.79 0.49 20 2000 1800 1600 dynamic
Appendix A.2.2. Fire Behavior Estimates of Custom Fuel Models
To test custom fuel model surface fire behavior and assess whether they are indicative of the
actual fire behavior of conifer forests in Lesvos, we used the BehavePlus software [97] to first enter
the necessary inputs to create each fuel model (Table A1) and then produce fire behavior estimates,
keeping all other required variables constant (topography, fuel moisture, and wind speed). We used
three fuel moisture scenarios (FMS) that correspond to the measured fuel moisture conditions of the
fire period (May–September), as retrieved from a network of Remote Automatic Weather Stations in
Lesvos island [57]. A fuel moisture scenario is a set of fuel moisture values representing moisture
conditions of the surface fuel: 1‐hr, 10‐hr, 100‐hr, live herbaceous, and live woody moisture (Table
A2).
Table A2. The three fuel moisture scenarios used to test the simulated fire behavior of the four custom
fuel models. See text for detailed descriptions of each fuel moisture scenario.
Fuel Moisture Scenario
Fuel Moisture Class D1L1 1 (%) M2 (%) D2L2 1 (%)
1‐hr 3 4 6
10‐hr 4 5 7
100‐hr 5 6 8
Live Herbaceous 30 50 60
Live Woody 60 80 90
1 D1L1 and D2L2 are fuel moisture scenario codes from the BehavePlus fire modeling system [98].
The FMS D1L1 describes very low dead fuel moisture conditions with fully cured herbaceous
vegetation, corresponding to weather conditions recorded during the heatwaves at the end of July
and first half of August. The FMS M2 describes very low dead fuel moisture conditions, but with
two‐thirds cured herbaceous vegetation, corresponding to weather conditions recorded during June
and the last days of August–early September. Finally, the FMS D2L2 describes low dead fuel moisture
conditions with two‐thirds cured herbaceous vegetation, corresponding to the typical weather
conditions of May, early June, and late September. For all simulations, we set a constant wind speed
of 24 km hr−1 and a slope of 50%. Results were visualized with a set of fire characteristic chart
diagrams that plots the relationship of rate of spread, heat per unit area, flame length, and fireline
intensity. Each custom fuel model was compared with a set of three standard fuel models [51] that
can potentially describe similar fuel conditions to each of the custom fuel models.
Forests 2020, 11, 789 18 of 31
Appendix A.2.3. Accuracy Assessment Indices
We used three indices to estimate the accuracy of FARSITE simulations, namely the Jacard
coefficient (JC), the areal association coefficient (AAC), and the Sørensen–Dice coefficient (SC). The
JC index [99,100] estimates the similarity between burned and simulated area on a range of 0
(perfectly different) to 1 (perfect similarity) with Equation (A.1):
JCR1
R1 R2 R3 (A.1)
where R1 is the number of cells with burn agreement, R2 is the number of cells with
underestimation, and R3 is the number of cells with overestimation. This index does not account for
cells that define non‐burning agreement (R4). The AAC index [101,102] includes the estimation of
similarity between both burned and unburned areas, with a range of 0 to 1, similar to the JC Index,
estimated with Equation (A.2):
𝐴𝐴𝐶𝑅1 𝑅4
𝑅1 𝑅2 𝑅3 𝑅4 (A.2)
Finally, the SC is a non‐symmetric index that can reveal the correlation between simulated and
actual burned area [103,104] with a range of 0 to 1, similar to the JC Index, estimated with Equation
(A.3):
𝑆𝐶2 𝑋 𝑅1
2 𝑋 𝑅1 𝑅2 𝑅3 (A.3)
Appendix A.2.4. Spatial Validation of Historical Fires
Validation of fire simulations for Lesvos island was based on five large fire events that occurred
on five different parts of the island: southeast, north, central‐north, central and south. The
southeastern fire burned 670 ha on July 19th, 2006 and propagated through conifer fuels mixed with
shrubs in a densely forested area. Fire burned mostly conifer forests, olive groves, and shrublands
over an area with high slopes (~20°) under the influence of strong northern winds. The north fire
occurred on July 4th, 2011 and burned 62 ha in a landscape dominated by grass–shrub, partially
covered by dense shrublands. Winds were of moderate intensity blowing from northwestern
directions. The central‐north fire occurred on July 7th, 2009 and burned 65 ha mostly inside sparse
conifer forests. Fire propagated under the influence of moderate northern winds, mostly through
conifer litter mixed with shrubs which shortly transmitted inside grasslands and neighboring olive
groves through spotting. The central fire occurred on July 31st, 2009 and burned 12 ha inside dense
conifer forests. Fire propagated under the influence of moderate‐low northeastern winds, mostly
through conifer litter mixed with shrubs. Finally, the south fire occurred on August 4th, 2011 and
burned 850 ha. Fire ignited inside olive groves, initially under the influence of northern winds, which
soon changed into northeastern of moderate intensity. The fire burned mostly olive groves and grass–
shrub dominated areas.
Appendix A.3. Results
Appendix A.3.1. Simulated Fire Behavior from Custom Fuel Models
Table A3 shows the cumulative results of the four custom fuel models for the maximum rate of
spread (ROS in m/min), flame length (FL in m), fireline intensity (FI in kW/m), and heat per unit area
(HPUA in kJ m−2). ROS is reduced on average across the three FMS scenarios by 50% when comparing
FM01 to FM04 and by 25% from FM01 to FM03, but FM01 and FM02 have similar values. The average
difference between FM01 and FM02 in terms of FL is 14%, from FM01 to FM03 is 40%, and from FM01
to FM04 is 63%. Differences appear between FM01 and FM02 when we compare them based on FI,
with an average reduction of 33% from FM01 to FM02, and up to 89% reduction when comparing
FM01 to FM04. The average reduction of FI from FM01 to FM03 is 53%, while from FM03 to FM04 to
67%. Similar results were found for HPUA. In the fire characteristics chart (Figure A1), we notice that
FL values from FM01 and FM02 are above the 4.5 m threshold, requiring an indirect approach for
firefighting. Fires burning in forests with FM03 require aerial means to aid suppression efforts, falling

Forests 2020, 11, 789 19 of 31
within the 3.3–4.5 m FL class, while for FM04, mechanical means are adequate to confront a potential
fire event. A scaled increase and a clear separation of fire behavior characteristics is evident when
comparing FM04 to FM03, FM03 to FM02, and FM02 to FM01. These results agree with observed fire
behavior in those four distinct types of conifer forests on Lesvos island.
Figure A1. Fire characteristics chart of the simulated fire behavior of the four custom fuel models for
conifer forests.
Table A3. Fire behavior simulation results using the BehavePlus software for the four custom fuel
models for conifer forests. FMS: Fuel Moisture Scenario.
Maximum Rate of
Spread (m/min) Flame Length (m)
Fireline Intensity
(kW/m)
Heat Per Unit Area
(kJ/m2)
FMS D1L1 M2 D2L2 D1L1 M2 D2L2 D1L1 M2 D2L2 D1L1 M2 D2L2
FM01 32 24.5 20.3 7 6 5.3 18,099 12,979 9825 33,935 31,817 28,987
FM02 29.5 24.6 20.6 5.9 5.2 4.6 12,197 9473 7222 24,787 23,072 21,001
FM03 22.3 18.6 15.7 4.1 3.7 3.3 5717 4511 3486 15,362 14,526 13,321

Forests 2020, 11, 789 20 of 31
FM04 16.4 12.8 10.6 2.6 2.2 2 2062 1480 1116 7543 6925 6289
When FM01 is compared with the standard fuel models, namely the TU5 (Very High Load, Dry
Climate Timber–Shrub), the TL8 (Long‐Needle Litter), and the SH7 (Very High Load, Dry Climate
Shrub) we notice that HPUA and FL are substantially higher compared to TL8, the FL and ROS are
higher compared to TU5, and the ROS are smaller compared to SH7 (Figure A2A). The simulated fire
behavior for FM02 is between the TU5 and TU4 (Dwarf Conifer with Understory) standard fuel
models, and substantially higher compared to TL8. FM03 is closer to the fire behavior of TL8 and
TU4, but with evident differences in terms of ROS, while it is substantially lower compared to TU5
across all fire behavior metrics. Finally, FM04 showed moderate differences compared to the TU1
standard fuel model (Low Load Dry Climate Timber–Grass–Shrub), with similar ROS with TL8, and
important differences across all fire behavior metrics with TU4. These results revealed a good
separation of the four custom fuel models when compared to the standard fuel models and can bridge
the gap of fire behavior modeling discrepancies when compared to the observed fire behavior.
Figure A2. Fire characteristics chart of the simulated fire behavior of: (A) the custom fuel model FM01
with the standard fuel models TL8 (Long‐Needle Litter), TU5 (Very High Load, Dry Climate Timber–
Shrub), and SH7 (Very High Load, Dry Climate Shrub); (B) the custom fuel model FM02 with the
standard fuel models TL8, TU5, and TU4 (Dwarf Conifer with Understory); (C) the custom fuel model

Forests 2020, 11, 789 21 of 31
FM03 with the standard fuel models TL8, TU5, and TU4; (D) the custom fuel model FM04 with the
standard fuel models TL8, TU4, and TU1 (Low Load Dry Climate Timber–Grass–Shrub).
Appendix A.3.2. Spatial Accuracy and Validation of Historical Fires
In Table A4, we report the validation results of each fire from both custom and standard fuel
model simulations using the three indices. The southeastern fire had better indices scores (closer to
1) for custom fuel models, with less burn agreement (R1) and higher underestimation (R2), but with
substantial less overestimation (R3) and better non‐burning agreement (R4) (Figure A3A,B). The
custom fuel models FM01 and FM02 were used in most areas, with smaller parts characterized with
FM03. We used the TU5 and TL3 for the standard fuel model simulations. The central‐north fire had
slightly higher scores for SC and JC, and slightly lower for the AAC. Across all metrics (R1‐R4), values
are similar, but custom fuel models had better burn agreement and higher overestimation (Figure
A3C,D). The custom fuel models FM02 and FM03 were used in most area, while in standard fuel
model simulations we used the TU5. The central fire has higher scores for SC and JC, but substantially
lower AAC score. Standard fuel models underestimated the total burned area, while we noticed an
overestimation across all directions for custom fuel models fire (Figure A3E,F). The custom fuel
models FM02 and FM03 were used in most area, while in standard fuel model simulations, we used
the TL8 and TL3. Since in all simulated fires we have not modeled fire suppression efforts, which
were intense with rapid response for all fires, overestimation is an expected outcome and within our
acceptable sources of error.
Table A4. Validation indices results from FARSITE simulations, comparing simulated with actual fire
perimeter of five historical fires. R1: Burn agreement; R2: burn disagreement (underestimation); R3:
burn disagreement (overestimation); R4: non‐burning agreement. SC: Sørensen–Dice coefficient; JC:
Jacard coefficient; AAC: areal association coefficient. Standard: Scott and Burgan [51] fuel models.
Fire Location Fuel Model Type SC JC AAC R1 R2 R3 R4
Southeast Standard 0.56653 0.395217 0.690489 6297 1159 8477 15200
Custom 0.61509 0.444136 0.813189 4647 2809 3007 20670
Central‐North Standard 0.56253 0.391334 0.78539 578 164 735 2712
Custom 0.57929 0.407743 0.766293 674 68 911 2536
Central Standard 0.31214 0.184932 0.919377 27 109 10 1330
Custom 0.40683 0.255361 0.741192 131 5 377 963
South Standard 0.7736 0.630786 0.896039 8708 752 4345 35223
North Standard 0.47237 0.309217 0.812155 671 21 1478 5810

Forests 2020, 11, 789 22 of 31
Figure A3. FARSITE simulation results comparing the four custom fuel models with the standard
Scott and Burgan [51] fuel models for fires that burned mostly inside conifer fuel types. (A,B):
southeast fire; (C,D): central‐north fire; (E,F): central fire.
Forests 2020, 11, 789 23 of 31
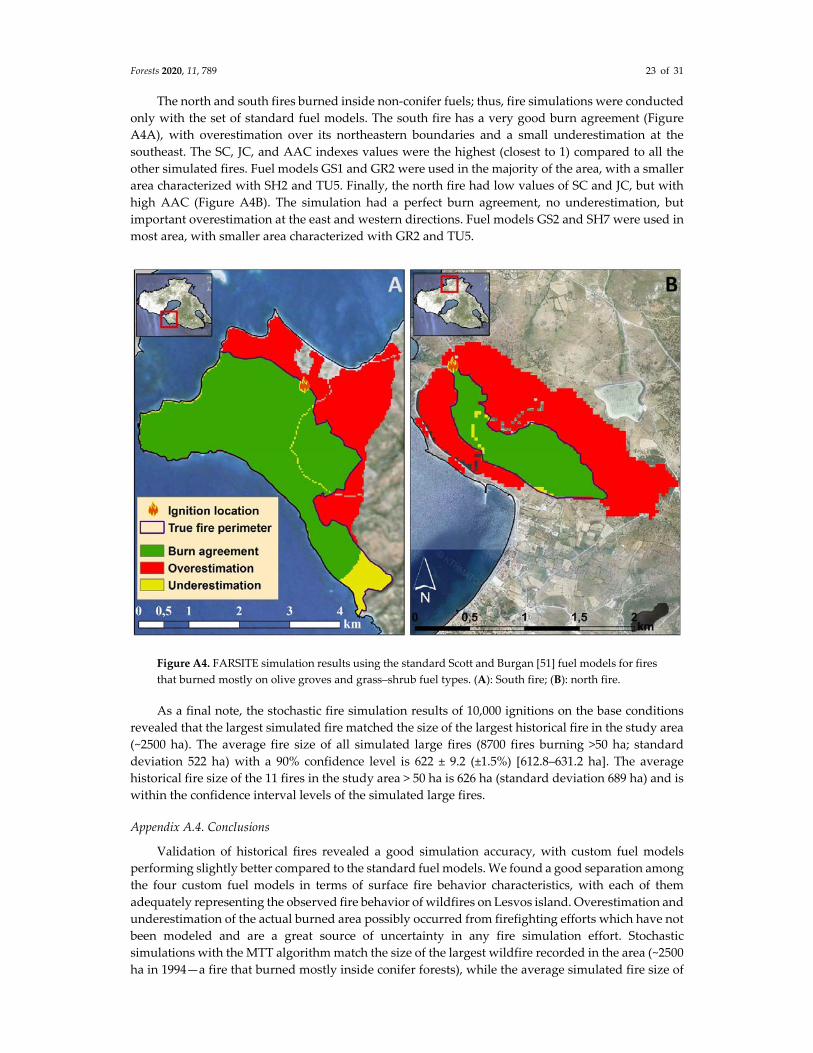
The north and south fires burned inside non‐conifer fuels; thus, fire simulations were conducted
only with the set of standard fuel models. The south fire has a very good burn agreement (Figure
A4A), with overestimation over its northeastern boundaries and a small underestimation at the
southeast. The SC, JC, and AAC indexes values were the highest (closest to 1) compared to all the
other simulated fires. Fuel models GS1 and GR2 were used in the majority of the area, with a smaller
area characterized with SH2 and TU5. Finally, the north fire had low values of SC and JC, but with
high AAC (Figure A4B). The simulation had a perfect burn agreement, no underestimation, but
important overestimation at the east and western directions. Fuel models GS2 and SH7 were used in
most area, with smaller area characterized with GR2 and TU5.
Figure A4. FARSITE simulation results using the standard Scott and Burgan [51] fuel models for fires
that burned mostly on olive groves and grass–shrub fuel types. (A): South fire; (B): north fire.
As a final note, the stochastic fire simulation results of 10,000 ignitions on the base conditions
revealed that the largest simulated fire matched the size of the largest historical fire in the study area
(~2500 ha). The average fire size of all simulated large fires (8700 fires burning >50 ha; standard
deviation 522 ha) with a 90% confidence level is 622 ± 9.2 (±1.5%) [612.8–631.2 ha]. The average
historical fire size of the 11 fires in the study area > 50 ha is 626 ha (standard deviation 689 ha) and is
within the confidence interval levels of the simulated large fires.
Appendix A.4. Conclusions
Validation of historical fires revealed a good simulation accuracy, with custom fuel models
performing slightly better compared to the standard fuel models. We found a good separation among
the four custom fuel models in terms of surface fire behavior characteristics, with each of them
adequately representing the observed fire behavior of wildfires on Lesvos island. Overestimation and
underestimation of the actual burned area possibly occurred from firefighting efforts which have not
been modeled and are a great source of uncertainty in any fire simulation effort. Stochastic
simulations with the MTT algorithm match the size of the largest wildfire recorded in the area (~2500
ha in 1994—a fire that burned mostly inside conifer forests), while the average simulated fire size of

Forests 2020, 11, 789 24 of 31
large fire events also matched the average fire size of the 11 historical fires within study area. Results
enhance confidence in the outputs and conclusions of the main manuscript.
Appendix B
Figure A5. Statistical distributions for the percentage of burned area of each land cover type from the
total area burned from each large simulated fire (>50 ha), obtained after 10,000 simulated fires with
the minimum travel time algorithm for: (A) baseline conditions; (B) after the application of fuel
treatments. The number of large simulated fires for (A) was 8470, while for (B) it was 5510. Values

Forests 2020, 11, 789 25 of 31
less than 5% from the total burned area of each land fire were not included in the statistical
distributions (e.g., when a large fire of a total burnt area of 100 ha burned less than 5 ha in
broadleaves).
Appendix C
Figure A6. The typology of fuels around the communities of Lesvos Island: (A) agricultural
encroachment and conifer deforestation; (B) high‐amenity wildland–urban interface inside dense
conifers and olive cultivations; (C) olive monoculture; (D) mixed broadleaves with conifers, shrubs,
and orchards (source: Google Earth).

Forests 2020, 11, 789 26 of 31
Figure A7. Pile burns of crown reduction residuals and shrubs, removed during the winter with
mechanical means, in labor‐intensive managed olive groves: (A,B) fuel conditions before the
application of fuel removal and pile burning, with olive tree crowns in vertical continuity with tall
shrubs, and understory where shorth dense shrubs mixed with tall grass prevail—fire behavior is
represented with the fuel model GS1; (C) active combustion; (D) smoldering; (E) fuel conditions three
months after the pile burns, where fuelbed consists of short grass and patchy short shrubs (photos by
the authors).
Forests 2020, 11, 789 27 of 31
References
1. Moreira, F.; Viedma, O.; Arianoutsou, M.; Curt, T.; Koutsias, N.; Rigolot, E.; Barbati, A.; Corona, P.; Vaz,
P.G.; Xanthopoulos, G.; et al. Landscape—wildfire interactions in southern Europe: Implications for
landscape management. J. Environ. Manag. 2011, 92, 2389–2402, doi:10.1016/j.jenvman.2011.06.028.
2. Liu, J.; Dietz, T.; Carpenter, S.R.; Alberti, M.; Folke, C.; Moran, E.; Pell, A.N.; Deadman, P.; Kratz, T.;
Lubchenco, J.; et al. Complexity of Coupled Human and Natural Systems. Science 2007, 317, 1513–1516,
doi:10.1126/science.1144004.
3. Scarascia‐Mugnozza, G.; Oswald, H.; Piussi, P.; Radoglou, K. Forests of the Mediterranean region: Gaps in
knowledge and research needs. For. Ecol. Manag. 2000, 132, 97–109, doi:10.1016/s0378‐1127(00)00383‐2.
4. Allen, G.M.; Gould, E.M., Jr. Complexity, wickedness, and public forests. J. For. 1986, 84, 20–23.
5. Chapin, F.S.; Trainor, S.F.; Huntington, O.; Lovecraft, A.L.; Zavaleta, E.; Natcher, D.C.; McGuire, A.D.;
Nelson, J.L.; Ray, L.; Calef, M. Increasing wildfire in Alaska’s boreal forest: Pathways to potential solutions
of a wicked problem. BioScience 2008, 58, 531–540.
6. Carroll, M.S.; Blatner, K.A.; Cohn, P.J.; Morgan, T. Managing Fire Danger in the Forests of the US Inland
Northwest: A Classic “Wicked Problem in Public Land Policy. J. For. 2007, 105, 239–244.
7. Morehouse, B.J.; Henderson, M.; Kalabokidis, K.; Iosifides, T. Wildland Fire Governance: Perspectives from
Greece. J. Environ. Policy Plan. 2011, 13, 349–371, doi:10.1080/1523908x.2011.611678.
8. Curt, T.; Fréjaville, T. Wildfire Policy in Mediterranean France: How Far is it Efficient and Sustainable? Risk
Anal. 2017, 38, 472–488, doi:10.1111/risa.12855.
9. Theodorou, P.; Alexandris, D. IOLAOS: General Plan for Confronting Emergencies due to Wildfires; General
Secretary for Civil Protection: Athens, Greece, 2019; p.173.
10. Moreira, F.; Ascoli, D.; Safford, H.; Adams, M.A.; Moreno, J.M.; Pereira, J.C.; Catry, F.X.; Armesto, J.; Bond,
W.J.; González, M.E.; et al. Wildfire management in Mediterranean‐type regions: Paradigm change needed.
Environ. Res. Lett. 2020, 15, 011001, doi:10.1088/1748‐9326/ab541e.
11. Otero, I.; Nielsen, J.Ø. Coexisting with wildfire? Achievements and challenges for a radical social‐ecological
transformation in Catalonia (Spain). Geoforum 2017, 85, 234–246, doi:10.1016/j.geoforum.2017.07.020.
12. Mateus, P.; Fernandes, P.M. Forest Fires in Portugal: Dynamics, Causes and Policies. In Forest Context and
Policies in Portugal: Present and Future Challenges; Springer International Publishing: Cham, Switzerland,
2014; pp. 97–115.
13. Tedim, F.; Leone, V.; Xanthopoulos, G. A wildfire risk management concept based on a social‐ecological
approach in the European Union: Fire Smart Territory. Int. J. Disaster Risk Reduct. 2016, 18, 138–153,
doi:10.1016/j.ijdrr.2016.06.005.
14. Tubbesing, C.L.; Fry, D.L.; Roller, G.B.; Collins, B.M.; Fedorova, V.A.; Stephens, S.L.; Battles, J.J.
Strategically placed landscape fuel treatments decrease fire severity and promote recovery in the northern
Sierra Nevada. For. Ecol. Manag. 2019, 436, 45–55, doi:10.1016/j.foreco.2019.01.010.
15. Prichard, S.J.; Kennedy, M.C. Fuel treatments and landform modify landscape patterns of burn severity in
an extreme fire event. Ecol. Appl. 2014, 24, 571–590, doi:10.1890/13‐0343.1.
16. Loudermilk, E.L.; Stanton, A.; Scheller, R.; Dilts, T.E.; Weisberg, P.J.; Skinner, C.; Yang, J. Effectiveness of
fuel treatments for mitigating wildfire risk and sequestering forest carbon: A case study in the Lake Tahoe
Basin. For. Ecol. Manag. 2014, 323, 114–125, doi:10.1016/j.foreco.2014.03.011.
17. Lyons‐Tinsley, C.; Peterson, D.L. Surface fuel treatments in young, regenerating stands affect wildfire
severity in a mixed conifer forest, eastside Cascade Range, Washington, USA. For. Ecol. Manag. 2012, 270,
117–125, doi:10.1016/j.foreco.2011.04.016.
18. Ager, A.A.; Day, M.A.; McHugh, C.W.; Short, K.C.; Gilbertson‐Day, J.W.; Finney, M.A.; Calkin, D.E.
Wildfire exposure and fuel management on western US national forests. J. Environ. Manag. 2014, 145, 54–
70, doi:10.1016/j.jenvman.2014.05.035.
19. USDA Forest Service. Towards Shared Stewardship across Landscapes: An Outcome‐Based Investment
Strategy, FS‐118; USDA Forest Service: Washington, DC, USA, 2018.
20. Fernandes, P.M.; Davies, G.M.; Ascoli, D.; Fernández, C.; Moreira, F.; Rigolot, E.; Stoof, C.R.; Vega, J.A.;
Molina, D. Prescribed burning in southern Europe: Developing fire management in a dynamic landscape.
Front. Ecol. Environ. 2013, 11, e4–e14, doi:10.1890/120298.
21. Xanthopoulos, G.; Caballero, D.; Galante, M.; Alexandrian, D.; Rigolot, E.; Marzano, R. Forest fuels
management in Europe. In Proceedings of the Fuels Management‐How to Measure Success, Portland, OR,
USA, 28–30 March 2006.
Forests 2020, 11, 789 28 of 31
22. Salis, M.; Laconi, M.; Ager, A.A.; Alcasena, F.J.; Arca, B.; Lozano, O.; De Oliveira, A.F.; Spano, D. Evaluating
alternative fuel treatment strategies to reduce wildfire losses in a Mediterranean area. For. Ecol. Manag. 2016,
368, 207–221, doi:10.1016/j.foreco.2016.03.009.
23. Greek Government. The 2020 Greek Forest Service Budget. Availabe online:
https://diavgeia.gov.gr/doc/%CE%A8%CE%9B%CE%A6%CE%9A4653%CE%A08‐%CE%95%CE%98%CE
%9A?inline=true (accessed on 7 July 2020).
24. Greek Government. The 2020 Local Government Budget for Wildfire Protection. Availabe online:
https://diavgeia.gov.gr/doc/%CE%A9%CE%9A%CE%93%CE%9446%CE%9C%CE%A4%CE%9B6‐%CE%
9D%CE%A32?inline=true (accessed on 7 July 2020).
25. Rachmawati, R.; Ozlen, M.; Reinke, K.; Hearne, J. An optimisation approach for fuel treatment planning to
break the connectivity of high‐risk regions. For. Ecol. Manag. 2016, 368, 94–104,
doi:10.1016/j.foreco.2016.03.014.
26. Finney, M.; Cohen, J. Expectation and evaluation of fuel management objectives in fire, fuel treatments,
and ecological restoration. In Proceedings of the Fire, Fuel Treatments, and Ecological Restoration, Fort
Collins, CO, USA, 16–18 April 2002; pp. 353–366.
27. Chung, W.; Jones, G.; Krueger, K.; Bramel, J.; Contreras, M. Optimising fuel treatments over time and space.
Int. J. Wildland Fire 2013, 22, 1118–1133, doi:10.1071/wf12138.
28. Ager, A.A.; Mcmahan, A.J.; Barrett, J.J.; McHugh, C.W. A simulation study of thinning and fuel treatments
on a wildland–urban interface in eastern Oregon, USA. Landsc. Urban Plan. 2007, 80, 292–300,
doi:10.1016/j.landurbplan.2006.10.009.
29. Finney, M.A. A computational method for optimising fuel treatment locations. Int. J. Wildland Fire 2007, 16,
702–711, doi:10.1071/wf06063.
30. Salis, M.; Del Giudice, L.; Arca, B.; Ager, A.A.; Alcasena‐Urdiroz, F.; Lozano, O.; Bacciu, V.; Spano, D.; Duce,
P. Modeling the effects of different fuel treatment mosaics on wildfire spread and behavior in a
Mediterranean agro‐pastoral area. J. Environ. Manag. 2018, 212, 490–505, doi:10.1016/j.jenvman.2018.02.020.
31. Wei, Y. Optimize landscape fuel treatment locations to create control opportunities for future fires. Can. J.
For. Res. 2012, 42, 1002–1014, doi:10.1139/x2012‐051.
32. Prichard, S.J.; Povak, N.A.; Kennedy, M.C.; Peterson, D.W. Fuel treatment effectiveness in the context of
landform, vegetation, and large, wind‐driven wildfires. Ecol. Appl. 2020, doi:10.1002/eap.2104.
33. Ager, A.A.; Vogler, K.C.; Day, M.A.; Bailey, J.D. Economic Opportunities and Trade‐Offs in Collaborative
Forest Landscape Restoration. Ecol. Econ. 2017, 136, 226–239, doi:10.1016/j.ecolecon.2017.01.001.
34. Ager, A.A.; Houtman, R.M.; Day, M.A.; Ringo, C.; Palaiologou, P. Tradeoffs between US national forest
harvest targets and fuel management to reduce wildfire transmission to the wildland urban interface. For.
Ecol. Manag. 2019, 434, 99–109, doi:10.1016/j.foreco.2018.12.003.
35. Stockdale, C.A.; Barber, Q.; Saxena, A.; Parisien, M.‐A. Examining management scenarios to mitigate
wildfire hazard to caribou conservation projects using burn probability modeling. J. Environ. Manag. 2019,
233, 238–248, doi:10.1016/j.jenvman.2018.12.035.
36. Narimani, R.; Erfanian, M.; Nazarnejad, H.; Mahmodzadeh, A. Evaluating the impact of management
scenarios and land use changes on annual surface runoff and sediment yield using the GeoWEPP: A case
study from the Lighvanchai watershed, Iran. Environ. Earth Sci. 2017, 76, 5, doi:10.1007/s12665‐017‐6694‐6.
37. Creutzburg, M.K.; Scheller, R.; Lucash, M.S.; LeDuc, S.D.; Johnson, M.G. Forest management scenarios in
a changing climate: Trade‐offs between carbon, timber, and old forest. Ecol. Appl. 2017, 27, 503–518,
doi:10.1002/eap.1460.
38. Finney, M.A. Design of regular landscape fuel treatment patterns for modifying fire growth and behavior.
For. Sci. 2001, 47, 219–228.
39. Ager, A.A.; Vaillant, N.M.; Mcmahan, A. Restoration of fire in managed forests: A model to prioritize
landscapes and analyze tradeoffs. Ecosphere 2013, 4, 1–19, doi:10.1890/es13‐00007.1.
40. Hayes, J.L.; Ager, A.A.; Barbour, R.J. Methods for Integrated Modeling of Landscape Change: Interior
Northwest Landscape Analysis System, General Technical Report PNW‐GTR‐610; Hayes, J.L., Ager, A.A.,
Barbour, R.J., Eds.; USDA Forest Service, Pacific Northwest Research Station: Portland, OR, USA, 2004.
41. Thanos, C.A.; Doussi, M.A. Post‐fire regeneration of Pinus brutia forests. In Ecology, Biogeography and
Management of Pinus halepensis and P. brutia Forest Ecosystems in the Mediterranean Basin; Backhuys Publishers:
Leiden, The Netherlands, 2000; pp. 291–301.

Forests 2020, 11, 789 29 of 31
42. Kalabokidis, K.; Palaiologou, P. Mediterranean Forest Fuels. In Encyclopedia of Wildfires and Wildland‐Urban
Interface (WUI) Fires; Manzello, S.L., Ed.; Springer International Publishing: Cham, Switzerland, 2019; pp.
1–13.
43. Kizos, T.; Koulouri, M. Agricultural landscape dynamics in the Mediterranean: Lesvos (Greece) case study
using evidence from the last three centuries. Environ. Sci. Policy 2006, 9, 330–342,
doi:10.1016/j.envsci.2006.02.002.
44. Giourga, C.; Loumou, A.; Tsevreni, I.; Vergou, A.; Tsevreni, I. Assessing the sustainability factors of
traditional olive groves on Lesvos Island, Greece (Sustainability and traditional cultivation). Geojournal
2008, 73, 149–159, doi:10.1007/s10708‐008‐9195‐z.
45. Kizos, T.; Dalaka, A.; Petanidou, T. Farmers’ attitudes and landscape change: Evidence from the
abandonment of terraced cultivations on Lesvos, Greece. Agric. Hum. Values 2010, 27, 199–212,
doi:10.1007/s10460‐009‐9206‐9.
46. Liacos, L.G. Present Studies and History of Burning in Greece. Fire Ecol. 2015, 11, 3–13,
doi:10.1007/bf03400631.
47. Kalabokidis, Κ.; Palaiologou, P.; Finney, M. Fire Behavior Simulation in Mediterranean Forests Using the
Minimum Travel Time Algorithm. In Proceedings of the Robinson ML (Comp): Proceedings of 4th Fire
Behavior and Fuels Conference, St. Petersburg, Russia, 1–4 July 2014; pp. 468–492.
48. Palaiologou, P.; Kalabokidis, K.; Kyriakidis, P.C. Forest mapping by geoinformatics for landscape fire
behaviour modelling in coastal forests, Greece. Int. J. Remote Sens. 2013, 34, 4466–4490,
doi:10.1080/01431161.2013.779399.
49. Lutes, D.C.; Keane, R.E.; Caratti, J.F.; Key, C.; Benson, N.C.; Sutherland, S.; Gangi, L.J. FIREMON: Fire
Effects Monitoring and Inventory System. Availabe online: https://www.firelab.org/project/firemon
(accessed on 13 January 2020).
50. Brown, J.K. Handbook for Inventorying Downed Woody Material, Gen. Tech. Rep. INT‐16; US Department of
Agriculture, Forest Service, Intermountain Forest and Range Experiment Station: Ogden, UT, USA, 1974;
p. 24.
51. Scott, J.H.; Burgan, R.E. Standard Fire Behavior Fuel Models: A Comprehensive Set for Use with Rothermelʹs
Surface Fire Spread Model, RMRS‐GTR‐153; USDA Forest Service, Rocky Mountain Research Station: Fort
Collins, CO, USA, 2005; p. 72.
52. .Finney, M.A. The challenge of quantitative risk analysis for wildland fire. For. Ecol. Manag. 2005, 211, 97‐
108.
53. Finney, M.A. An overview of FlamMap fire modeling capabilities. In Proceedings of the Fuels
Management—How to Measure Success: Proceedings RMRS‐P‐41, Fort Collins, CO, USA, 28–30 March
2006; pp. 213–220.
54. Finney, M.A. Fire growth using minimum travel time methods. Can. J. For. Res. 2002, 32, 1420–1424,
doi:10.1139/x02‐068.
55. Anderson, H.E. Aids to Determining Fuel Models for Estimating Fire Behavior; INT‐122; Gen. Tech. Rep. INT‐
122; U.S. Department of Agriculture, Forest Service, Intermountain Forest and Range Experiment Station:
Ogden, UT, USA, 1982; p. 22.
56. Finney, M.A.; Seli, R.C.; McHugh, C.W.; Ager, A.A.; Bahro, B.; Agee, J.K. Simulation of long‐term
landscape‐level fuel treatment effects on large wildfires. Int. J. Wildland Fire 2007, 16, 712–727,
doi:10.1071/wf06064.
57. Palaiologou, P.; Kalabokidis, K.; Haralambopoulos, D.; Feidas, H.; Polatidis, H. Wind characteristics and
mapping for power production in the Island of Lesvos, Greece. Comput. Geosci. 2011, 37, 962–972,
doi:10.1016/j.cageo.2010.05.025.
58. Forhofer, J.; Butler, B.; Wagenbrenner, N.S. WindNinja, USDA Forest Service, Rocky Mountain Research
Station, 2019. Availabe online: https://www.firelab.org/project/windninja (accessed on 7 July 2020).
59. Palaiologou, P.; Ager, A.A.; Nielsen‐Pincus, M.; Evers, C.; Kalabokidis, K. Using transboundary wildfire
exposure assessments to improve fire management programs: A case study in Greece. Int. J. Wildland Fire
2018, 27, 501, doi:10.1071/wf17119.
60. Scott, J.H.; Reinhardt, E.D. Assessing Crown Fire Potential by Linking Models of Surface and Crown Fire Behavior;
RMRS‐RP‐29; USDA Forest Service, Rocky Mountain Research Station: Fort Collins, CO, USA, 2001; p 59.
61. Cruz, M.G.; Alexander, M.E. Uncertainty associated with model predictions of surface and crown fire rates
of spread. Environ. Model. Softw. 2013, 47, 16–28, doi:10.1016/j.envsoft.2013.04.004.

Forests 2020, 11, 789 30 of 31
62. Ager, A.A.; Barros, A.M.; Day, M.A.; Preisler, H.K.; Spies, T.A.; Bolte, J. Analyzing fine‐scale spatiotemporal
drivers of wildfire in a forest landscape model. Ecol. Model. 2018, 384, 87–102,
doi:10.1016/j.ecolmodel.2018.06.018.
63. Ager, A.A.; Vaillant, N.M.; Finney, M.A.; Preisler, H.K. Analyzing wildfire exposure and source–sink
relationships on a fire prone forest landscape. For. Ecol. Manag. 2012, 267, 271–283,
doi:10.1016/j.foreco.2011.11.021.
64. ArcGIS Desktop, 10.5.1; ESRI Inc.: Redlands, CA, USA, 2017.
65. Ager, A.A.; Evers, C.R.; Day, M.A.; Preisler, H.K.; Barros, A.M.; Nielsen‐Pincus, M. Network analysis of
wildfire transmission and implications for risk governance. PLoS ONE, 2017, 12, p e0172867. 17.
66. Ager, A.A.; Finney, M.A.; Vaillant, N.M. Analyzing the spatial transmission of wildfire risk from large fires.
In Modelling Fire Behaviour and Risk; Spano, D., Bacciu, V., Salis, M., Sirca, C., Eds.; Nuova StampColor:
Sassari, Italy, 2012; pp. 108‐113.
67. Palaiologou, P.; Ager, A.A.; Evers, C.R.; Nielsen‐Pincus, M.; Day, M.A.; Preisler, H.K. Fine‐scale assessment
of cross‐boundary wildfire events in the western United States. Nat. Hazards Earth Syst. Sci. 2019, 19, 1755–
1777, doi:10.5194/nhess‐19‐1755‐2019.
68. Regos, A.; Hermoso, V.; D’Amen, M.; Guisan, A.; Brotons, L. Trade‐offs and synergies between bird
conservation and wildfire suppression in the face of global change. J. Appl. Ecol. 2018, 55, 2181–2192,
doi:10.1111/1365‐2664.13182.
69. Brotons, L.; Aquilué, N.; De Cáceres, M.; Fortin, M.‐J.; Fall, A. How Fire History, Fire Suppression Practices
and Climate Change Affect Wildfire Regimes in Mediterranean Landscapes. PLoS ONE 2013, 8, e62392,
doi:10.1371/journal.pone.0062392.
70. Kay, C.; Simmons, R.T. Wilderness and Political Ecology: Aboriginal Influences & the Original State of
Nature; University of Utah Press: Salt Lake City, UT, USA, 2002.
71. Damianidis, C.; Santiago‐Freijanes, J.J.; Herder, M.D.; Burgess, P.; Mosquera‐Losada, M.R.; Graves, A.;
Papadopoulos, A.; Pisanelli, A.; Camilli, F.; Rois‐Díaz, M.; et al. Agroforestry as a sustainable land use
option to reduce wildfires risk in European Mediterranean areas. Agrofor. Syst. 2020, doi:10.1007/s10457‐
020‐00482‐w.
72. Papanastasis, V.P.; Mantzanas, K.; Dini‐Papanastasi, O.; Ispikoudis, I. Traditional Agroforestry Systems
and Their Evolution in Greece. In Agroforestry in Europe: Current Status and Future Prospects; Rigueiro‐
Rodróguez, A., McAdam, J., Mosquera‐Losada, M.R., Eds.; Springer: Dordrecht, The Netherlands, 2009; pp.
89–109.
73. Rigueiro‐Rodríguez, A.; Fernandez‐Nuñez, E.; González‐Hernández, P.; McAdam, J.H.; Mosquera‐Losada,
M.R. Agroforestry Systems in Europe: Productive, Ecological and Social Perspectives. In Agroforestry in
Europe: Current Status and Future Prospects; Rigueiro‐Rodróguez, A., McAdam, J., Mosquera‐Losada, M.R.,
Eds.; Springer: Dordrecht, The Netherlands, 2008; pp. 43–65.
74. Colantoni, A.; Egidi, G.; Quaranta, G.; D’Alessandro, R.; Vinci, S.; Turco, R.; Salvati, L. Sustainable Land
Management, Wildfire Risk and the Role of Grazing in Mediterranean Urban‐Rural Interfaces: A Regional
Approach from Greece. Land 2020, 9, 21, doi:10.3390/land9010021.
75. Moreira, F.; Pe’Er, G. Agricultural policy can reduce wildfires. Science 2018, 359, 1001,
doi:10.1126/science.aat1359.
76. Aquilué, N.; Fortin, M.‐J.; Messier, C.; Brotons, L. The Potential of Agricultural Conversion to Shape Forest
Fire Regimes in Mediterranean Landscapes. Ecosystems 2019, 23, 1–18, doi:10.1007/s10021‐019‐00385‐7.
77. Regos, A.; Aquilué, N.; Lopez, I.; Codina, M.; Retana, J.; Brotons, L. Synergies Between Forest Biomass
Extraction for Bioenergy and Fire Suppression in Mediterranean Ecosystems: Insights from a Storyline‐
and‐Simulation Approach. Ecosystems 2016, 19, 786–802, doi:10.1007/s10021‐016‐9968‐z.
78. Neary, D.G.; Zieroth, E.J. Forest bioenergy system to reduce the hazard of wildfires: White Mountains,
Arizona. Biomass‐Bioenergy 2007, 31, 638–645, doi:10.1016/j.biombioe.2007.06.028.
79. Vogler, K.C.; Ager, A.A.; Day, M.A.; Jennings, M.; Bailey, J.D. Prioritization of Forest Restoration Projects:
Tradeoffs between Wildfire Protection, Ecological Restoration and Economic Objectives. Forests 2015, 6,
4403–4420, doi:10.3390/f6124375.
80. Ager, A.A.; Day, M.A.; Vogler, K.C. Production possibility frontiers and socioecological tradeoffs for
restoration of fire adapted forests. J. Environ. Manag. 2016, 176, 157–168, doi:10.1016/j.jenvman.2016.01.033.
81. Fernandes, P.M. Empirical Support for the Use of Prescribed Burning as a Fuel Treatment. Curr. For. Rep.
2015, 1, 118–127, doi:10.1007/s40725‐015‐0010‐z.

Forests 2020, 11, 789 31 of 31
82. Fernandes, P.M. Scientific support to prescribed underburning in southern Europe: What do we know? Sci.
Total Environ. 2018, 630, 340–348, doi:10.1016/j.scitotenv.2018.02.214.
83. Espinosa, J.; Palheiro, P.; Loureiro, C.; Ascoli, D.; Esposito, A.; Fernandes, P.M. Fire‐severity mitigation by
prescribed burning assessed from fire‐treatment encounters in maritime pine stands. Can. J. For. Res. 2019,
49, 205–211, doi:10.1139/cjfr‐2018‐0263.
84. USDA Forest Service. The National Strategy: The Final Phase in the Development of the National Cohesive
Wildland Fire Management Strategy; USDA Forest Service: Fort Collins, CO, USA, 2014; p. 93.
85. Steel, Z.L.; Safford, H.D.; Viers, J.H. The fire frequency‐severity relationship and the legacy of fire
suppression in California forests. Ecosphere 2015, 6, 1–23, doi:10.1890/es14‐00224.1.
86. Duane, A.; Aquilué, N.; Canelles, Q.; Morán‐Ordóñez, A.; De Cáceres, M.; Brotons, L. Adapting prescribed
burns to future climate change in Mediterranean landscapes. Sci. Total Environ. 2019, 677, 68–83,
doi:10.1016/j.scitotenv.2019.04.348.
87. Varner, J.M.; Keyes, C.R. Fuels treatments and fire models: Errors and corrections. Fire Manag. Today 2009,
69, 47–50.
88. McHugh, C.W. Considerations in the use of models available for fuel treatment analysis. In Proceedings of
the Fuels Management—How to Measure Success, Proceedings RMRS‐P‐41, Fort Collins, CO, USA, 28–30
March 2006; pp. 81–105.
89. Palaiologou, P.; Kalabokidis, K.; Ager, A.A.; Nielsen‐Pincus, M.; Bailey, J.; Xanthopoulos, G. Obstacles to
improving wildfire risk governance in Greece. In Proceedings of the Fire Continuum Conference, Missoula,
MT, USA, 21–24 May 2018.
90. Mitsopoulos, I.; Mallinis, G.; Arianoutsou, M. Wildfire Risk Assessment in a Typical Mediterranean
Wildland–Urban Interface of Greece. Environ. Manag. 2015, 55, 900–915, doi:10.1007/s00267‐014‐0432‐6.
91. Turco, M.; Rosa‐Cánovas, J.J.; Bedia, J.; Jerez, S.; Montávez, J.P.; Llasat, M.‐C.; Provenzale, A. Exacerbated
fires in Mediterranean Europe due to anthropogenic warming projected with non‐stationary climate‐fire
models. Nat. Commun. 2018, 1–9, 3821, doi:10.1038/s41467‐018‐06358‐z.
92. Keane, R.E.; Burgan, R.; Van Wagtendonk, J. Mapping wildland fuels for fire management across multiple
scales: Integrating remote sensing, GIS, and biophysical modeling. Int. J. Wildland Fire 2001, 10, 301–319,
doi:10.1071/wf01028.
93. Rothermel, R.C. A Mathematical Model for Predicting Fire Spread in Wildland Fuels; INT‐115; USDA Forest
Service, Intermountain Forest and Range Experiment Station: Ogden, UT, USA, 1972; p. 40.
94. Ascoli, D.; Vacchiano, G.; Motta, R.; Bovio, G. Building Rothermel fire behaviour fuel models by genetic
algorithm optimisation. Int. J. Wildland Fire 2015, 24, 317–328, doi:10.1071/wf14097.
95. Cruz, M.G.; Fernandes, P.M. Development of fuel models for fire behaviour prediction in maritime pine
(Pinus pinaster Ait.) stands. Int. J. Wildland Fire 2008, 17, 194–204, doi:10.1071/wf07009.
96. Finney, M.A. FARSITE: Fire Area Simulator—Model Development and Evaluation; RMRS‐RP‐4; USDA Forest
Service, Rocky Mountain Research Station: Ogden, UT, USA, 1998; p. 47.
97. Heinsch, F.A.; Andrews, P.L. BehavePlus Fire Modeling System, Version 5.0: Design and Features; General
Technical Report RMRS‐GTR‐249; USDA Forest Service, Rocky Mountain Research Station: Fort Collins, CO,
USA, 2010; p. 111.
98. Andrews, P.L. Behaveplus Fire Modeling System, Version 5.0: Variables; General Technical Report RMRS‐GTR‐
213; USDA Forest Service, Rocky Mountain Research Station: Fort Collins, CO, USA, 2009; p. 111.
99. Jaccard, P. The distribution of the flora in the alpine zone.1. New Phytol. 1912, 11, 37–50, doi:10.1111/j.1469‐
8137.1912.tb05611.x.
100. Real, R.; Vargas, J.M. The probabilistic basis of Jaccard’s index of similarity. Syst. Boil. 1996, 45, 380–385.
101. Unwin, D.J. Introductory Spatial Analysis; Taylor & Francis: Boston, UK, 1981.
102. Dent, B.; Torguson, J.; Hodler, T. Thematic Map Design; McGraw‐Hill: New York, NY, USA, 2008.
103. Sørensen, T. A Method of Establishing Groups of Equal Amplitude in Plant Sociology Based on Similarity
of Species Content and Its Application to Analyses of the Vegetation on Danish Commons; I kommission
hos E. Munksgaard, Copenhagen 1948.
104. Greig‐Smith, P. Quantitative Plant Ecology; University of California Press: Berkeley, CA, USA, 1983.
© 2020 by the authors. Licensee MDPI, Basel, Switzerland. This article is an open access
article distributed under the terms and conditions of the Creative Commons Attribution
(CC BY) license (http://creativecommons.org/licenses/by/4.0/).
Recommended