Development of a National ASCE Standard for
Permeable Interlocking Concrete Pavement
David Hein, P. Eng. Vice-President, Transportation Applied Research Associates, Inc. Glenn Herold, P. Eng. Director – Commercial Solutions Oaks by Brampton Brick

Spring 2014: Permeable Pavements Recommended Design Guidelines
ASCE EWRI Committee Report – online only
• Fact sheets • Checklists • Design information • Maintenance • Standards, guide
specs & modeling methods
• Research needs Establishes common terms for all permeable pavements

ASCE PICP Standard Guidelines Content Section 1 – General Scope Section 2 – Preliminary Assessment Section 3 – Design (structural & hydraulic design,
additional considerations) Section 4 – Construction Section 5 – Maintenance Goal: end of 2016 completion Uses Adoption by State, Provincial & Local agencies Design professional & contractor guidance
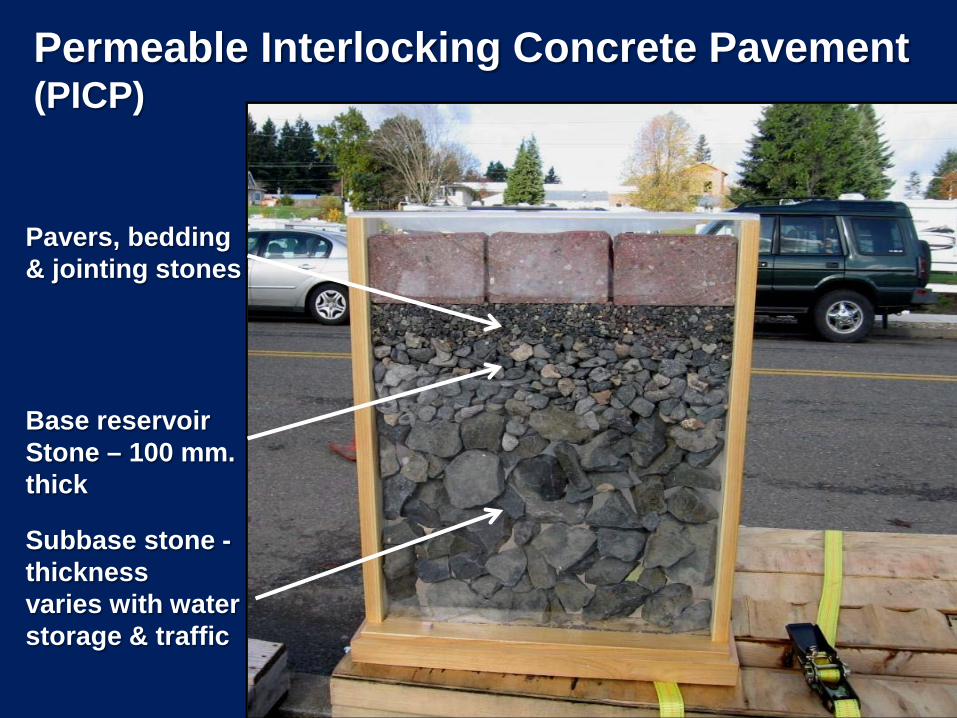
Permeable Interlocking Concrete Pavement (PICP)
Pavers, bedding & jointing stones
Base reservoir Stone – 100 mm. thick
Subbase stone - thickness varies with water storage & traffic
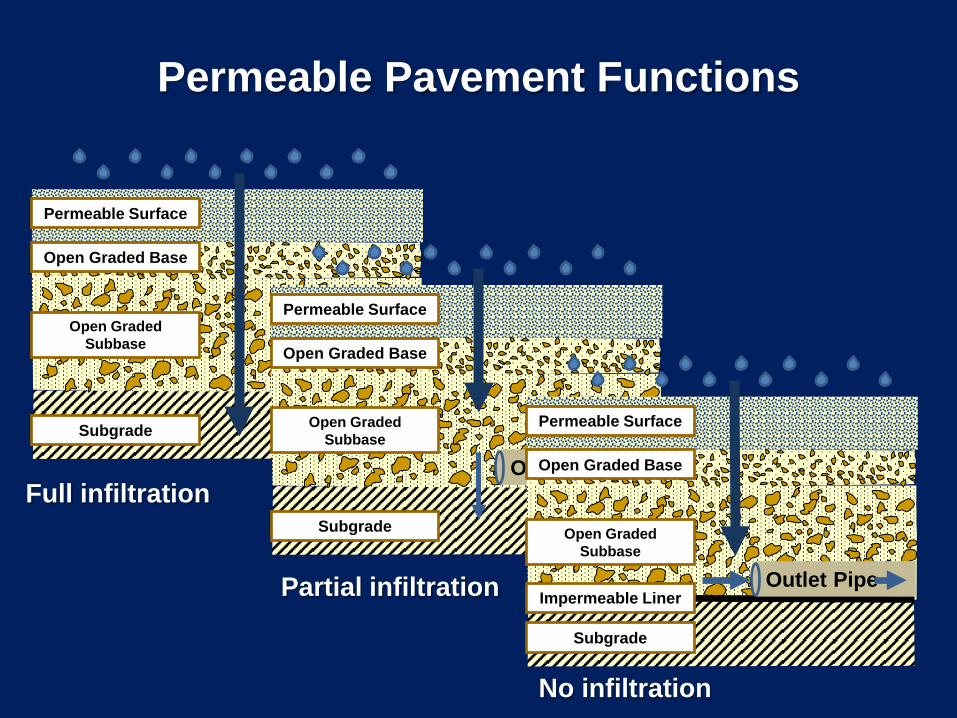
Permeable Pavement Functions
Permeable Surface
Open Graded Base
Open Graded Subbase
Subgrade
Permeable Surface
Open Graded Base
Open Graded Subbase
Subgrade
Outlet Pipe
Permeable Surface
Open Graded Base
Open Graded Subbase
Subgrade
Outlet Pipe Impermeable Liner
Full infiltration
Partial infiltration
No infiltration
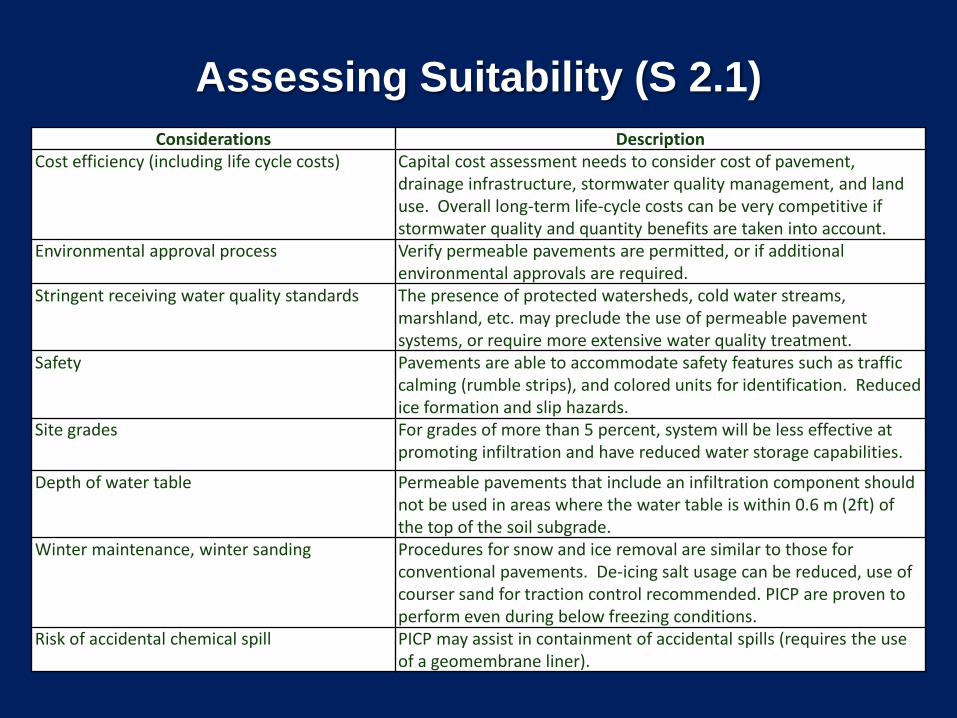
Assessing Suitability (S 2.1) Considerations Description
Cost efficiency (including life cycle costs) Capital cost assessment needs to consider cost of pavement, drainage infrastructure, stormwater quality management, and land use. Overall long-term life-cycle costs can be very competitive if stormwater quality and quantity benefits are taken into account.
Environmental approval process Verify permeable pavements are permitted, or if additional environmental approvals are required.
Stringent receiving water quality standards The presence of protected watersheds, cold water streams, marshland, etc. may preclude the use of permeable pavement systems, or require more extensive water quality treatment.
Safety Pavements are able to accommodate safety features such as traffic calming (rumble strips), and colored units for identification. Reduced ice formation and slip hazards.
Site grades For grades of more than 5 percent, system will be less effective at promoting infiltration and have reduced water storage capabilities.
Depth of water table Permeable pavements that include an infiltration component should not be used in areas where the water table is within 0.6 m (2ft) of the top of the soil subgrade.
Winter maintenance, winter sanding Procedures for snow and ice removal are similar to those for conventional pavements. De-icing salt usage can be reduced, use of courser sand for traction control recommended. PICP are proven to perform even during below freezing conditions.
Risk of accidental chemical spill PICP may assist in containment of accidental spills (requires the use of a geomembrane liner).

Assessing Suitability (cont.) Considerations Description Amount and intensity of precipitation Supplemental quantity control may be required in areas of frequent,
high intensity storms. Complexity of site conditions The design and construction of permeable shoulders may be
problematic in areas where retaining walls, utilities, septic systems, municipal or private wells are present.
Geotechnical Aspects Presence of organics, fill soils, swelling clay soils, karst geology, or shallow bedrock may pose geotechnical risks that introduce added design complexity.
Mandates for water quality control Permeable pavements may contribute substantially to water quality improvement.
Mandates for water quantity control Permeable pavements provide stormwater management alternatives to more costly or complicated practices.
Maintenance protocols Permeable pavement systems require mandatory non-traditional maintenance practices such as vacuum sweeping.
Structural design Design of PICP for moderate to heavy axle loads or high traffic counts may require additional analysis and details.
Interest in innovation Designs that include PICP can provide opportunity for innovation and sustainable benefits.
Owner experience and resources Permeable pavements should be designed to address owners expectations for performance, aesthetics, inspections, maintenance, benefits, costs, etc.
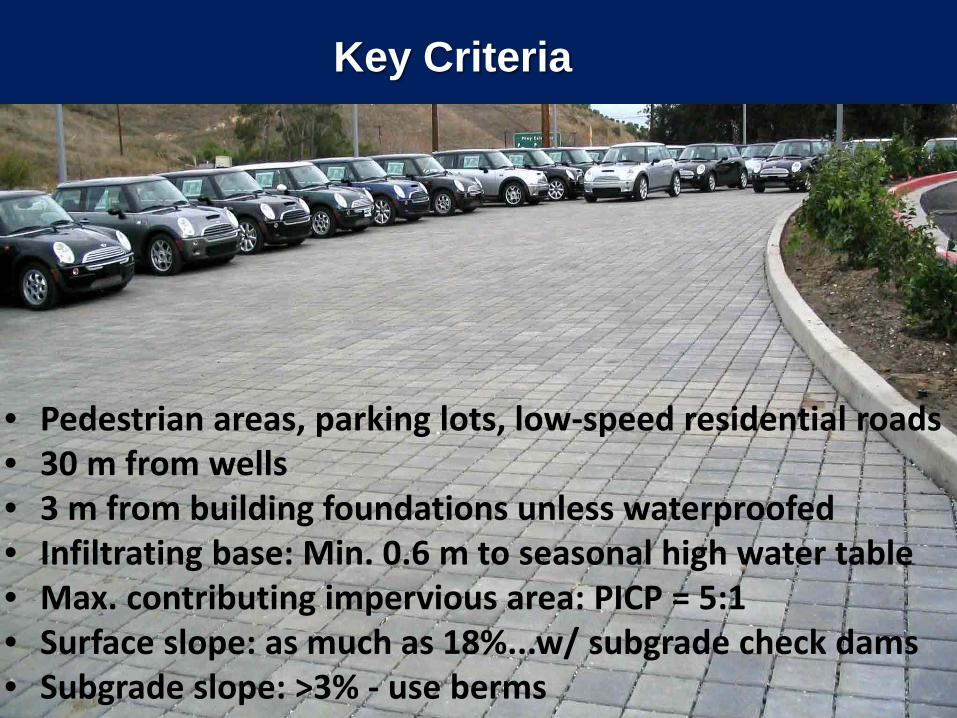
• Pedestrian areas, parking lots, low-speed residential roads • 30 m from wells • 3 m from building foundations unless waterproofed • Infiltrating base: Min. 0.6 m to seasonal high water table • Max. contributing impervious area: PICP = 5:1 • Surface slope: as much as 18%...w/ subgrade check dams • Subgrade slope: >3% - use berms
Key Criteria
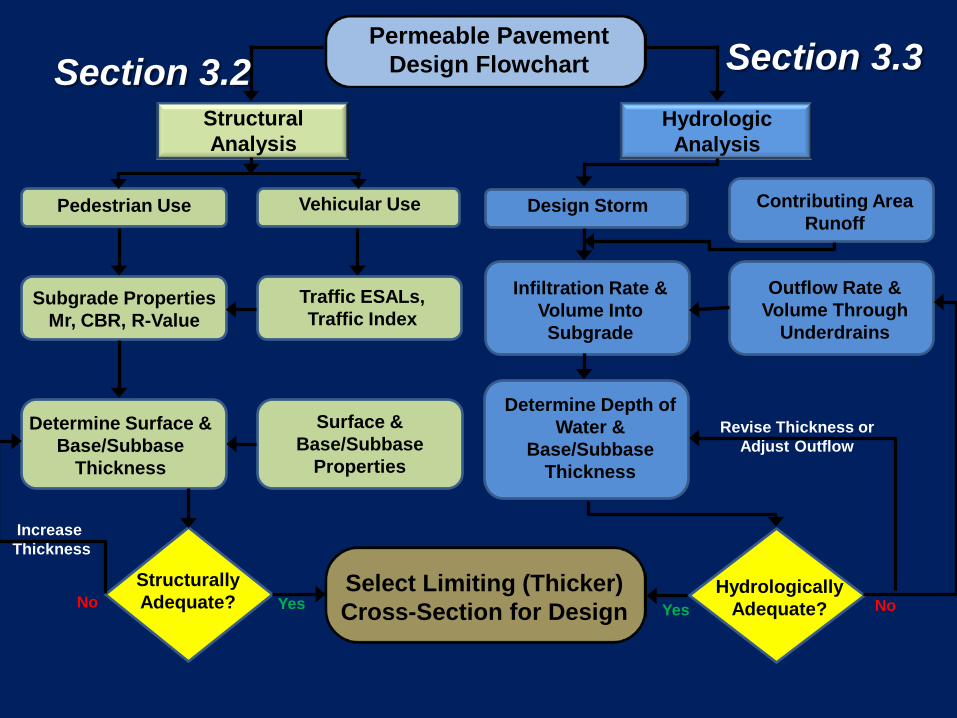
Permeable Pavement Design Flowchart
Structural Analysis
Hydrologic Analysis
Subgrade Properties Mr, CBR, R-Value
Traffic ESALs, Traffic Index
Pedestrian Use Vehicular Use
Determine Surface & Base/Subbase
Thickness
Surface & Base/Subbase
Properties
Design Storm Contributing Area Runoff
Infiltration Rate & Volume Into Subgrade
Outflow Rate & Volume Through
Underdrains
Determine Depth of Water &
Base/Subbase Thickness
Select Limiting (Thicker) Cross-Section for Design
Structurally Adequate?
Hydrologically Adequate? No Yes No Yes
Revise Thickness or Adjust Outflow
Increase Thickness
Section 3.2 Section 3.3

Resilient Modulus or Mr (PSI or MPa) Measures stiffness (resistance to loads) Dynamic test (repeated loads) on a soil or base sample
under simulated confining stresses (from field tests)
California Bearing Ratio (CBR in percent) Tests vertical bearing capacity compared to a high-quality compacted aggregate base
Resistance or R-value (dimensionless number) Tests vertical bearing and horizontal shear Used in California & a few other states Strengths correlate to each other
Characterization of soil strength using AASHTO, ASTM, or State DOT lab tests

Resilient Modulus, Mr AASHTO T-307
CBR ASTM D1883
R-value ASTM D2844
AASHTO Soil Classification AASHTO M-45
Unified Soil Classification
ASTM D2487
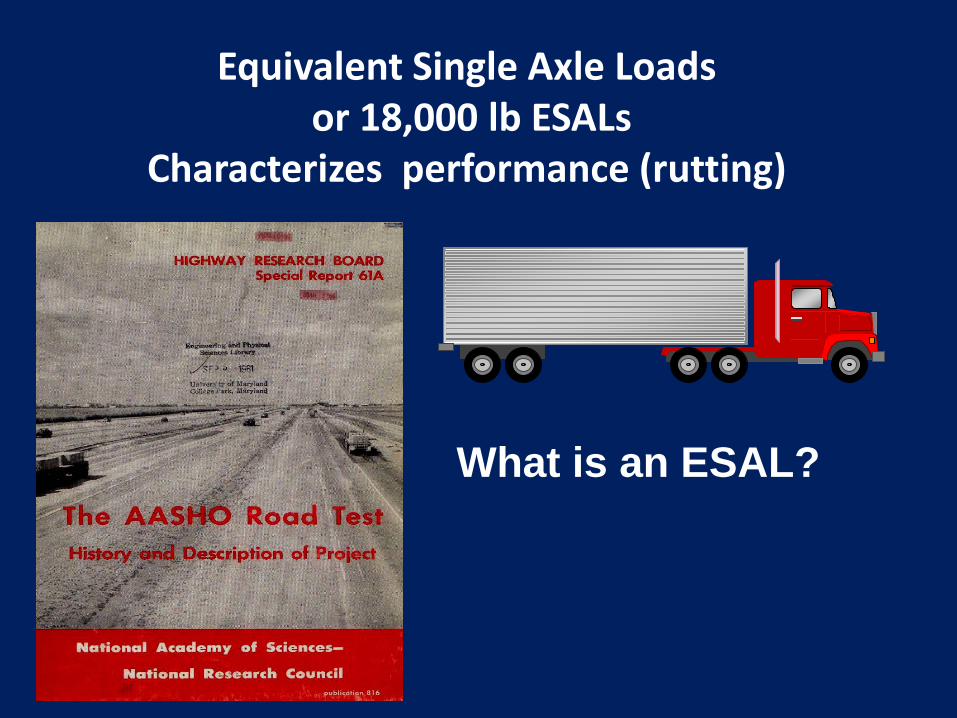
Equivalent Single Axle Loads or 18,000 lb ESALs
Characterizes performance (rutting)
What is an ESAL?

One pass = 2 + 1.2 + 0.14 = 3.34 ESALs
5 Axle Truck
2 x 80 kN 2 x 70 kN 50 kN
LEF = = 1 x 2 LEF = = 0.14
ESALs per Truck LEF: Load Equivalency Factor = axle load 80 kN
50
4 80 ( ) 4 80
80 ( ) LEF = = 0.6 x 2 15 4 70 80 ( )
( ) 4
How many ESALs does one pass of a car equal? Assume 1 axle = 10 kN 0.00015 ESALs
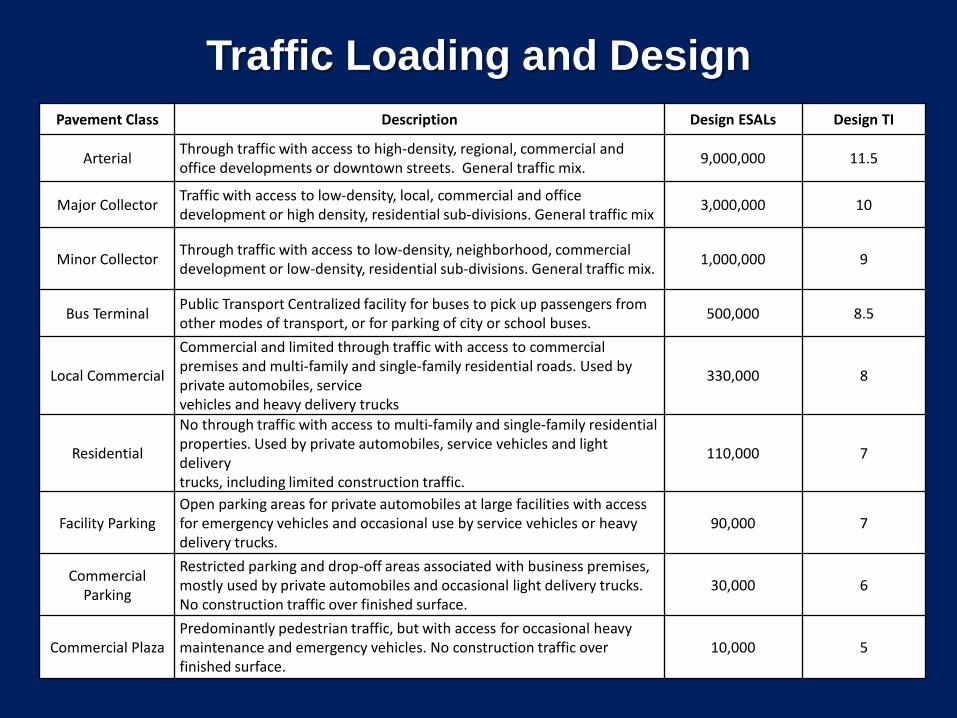
Traffic Loading and Design Pavement Class Description Design ESALs Design TI
Arterial Through traffic with access to high-density, regional, commercial and office developments or downtown streets. General traffic mix. 9,000,000 11.5
Major Collector Traffic with access to low-density, local, commercial and office development or high density, residential sub-divisions. General traffic mix 3,000,000 10
Minor Collector Through traffic with access to low-density, neighborhood, commercial development or low-density, residential sub-divisions. General traffic mix. 1,000,000 9
Bus Terminal Public Transport Centralized facility for buses to pick up passengers from other modes of transport, or for parking of city or school buses. 500,000 8.5
Local Commercial
Commercial and limited through traffic with access to commercial premises and multi-family and single-family residential roads. Used by private automobiles, service vehicles and heavy delivery trucks
330,000 8
Residential
No through traffic with access to multi-family and single-family residential properties. Used by private automobiles, service vehicles and light delivery trucks, including limited construction traffic.
110,000 7
Facility Parking Open parking areas for private automobiles at large facilities with access for emergency vehicles and occasional use by service vehicles or heavy delivery trucks.
90,000 7
Commercial Parking
Restricted parking and drop-off areas associated with business premises, mostly used by private automobiles and occasional light delivery trucks. No construction traffic over finished surface.
30,000 6
Commercial Plaza Predominantly pedestrian traffic, but with access for occasional heavy maintenance and emergency vehicles. No construction traffic over finished surface.
10,000 5
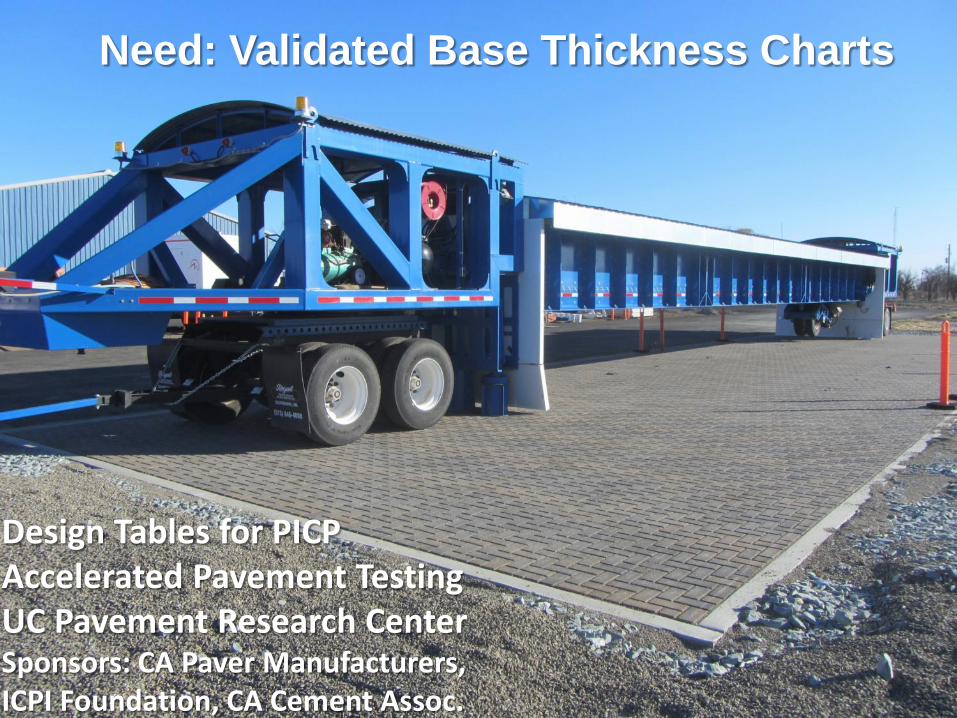
Design Tables for PICP Accelerated Pavement Testing UC Pavement Research Center Sponsors: CA Paver Manufacturers, ICPI Foundation, CA Cement Assoc.
Need: Validated Base Thickness Charts
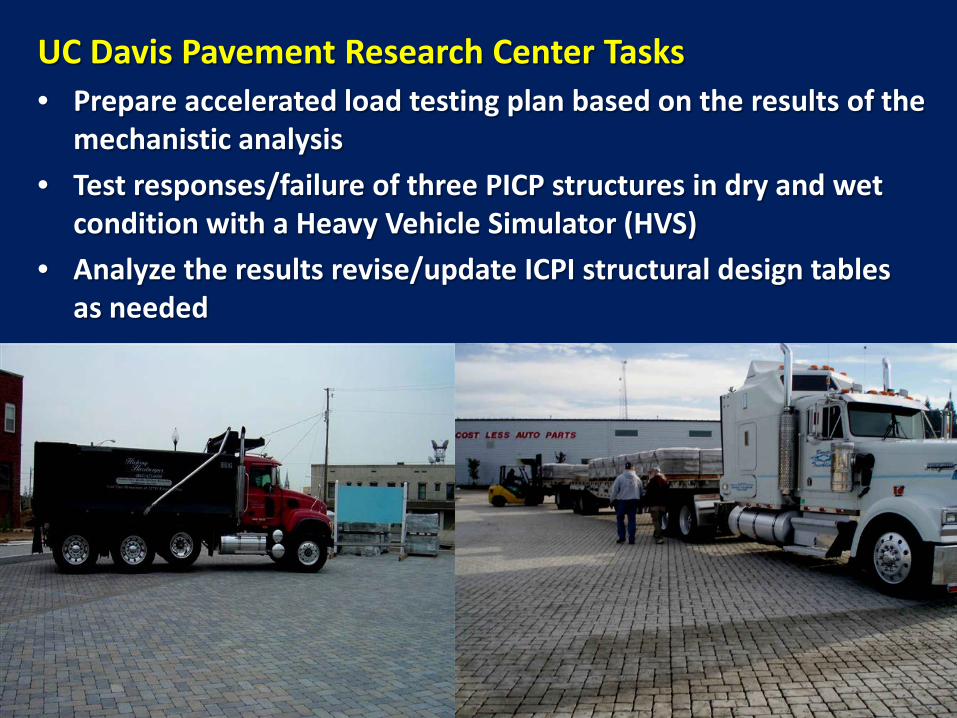
UC Davis Pavement Research Center Tasks • Prepare accelerated load testing plan based on the results of the
mechanistic analysis • Test responses/failure of three PICP structures in dry and wet
condition with a Heavy Vehicle Simulator (HVS) • Analyze the results revise/update ICPI structural design tables
as needed

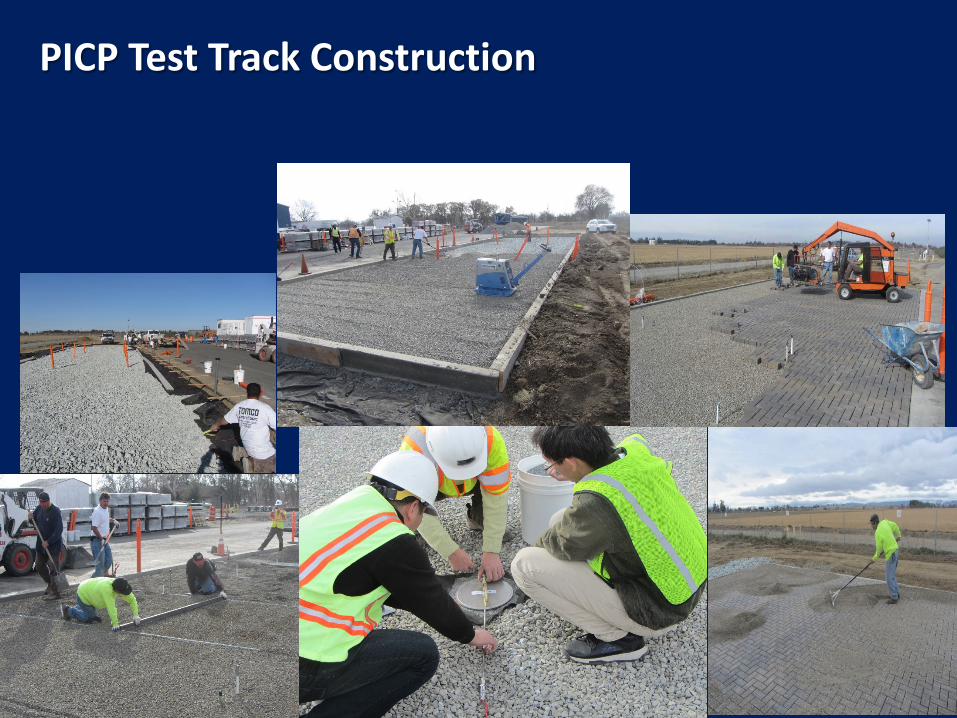
PICP Test Track Construction
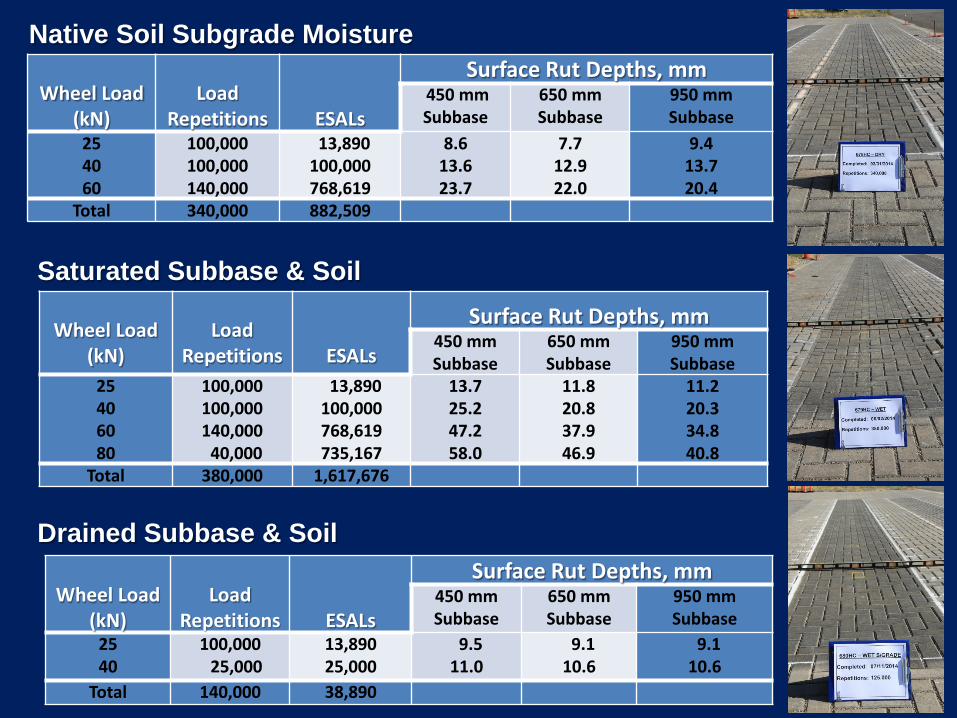
Wheel Load
(kN)
Load
Repetitions
ESALs
Surface Rut Depths, mm 450 mm Subbase
650 mm Subbase
950 mm Subbase
25 40 60
100,000 100,000 140,000
13,890 100,000 768,619
8.6 13.6 23.7
7.7 12.9 22.0
9.4 13.7 20.4
Total 340,000 882,509
Wheel Load
(kN)
Load
Repetitions
ESALs
Surface Rut Depths, mm 450 mm Subbase
650 mm Subbase
950 mm Subbase
25 40 60 80
100,000 100,000 140,000 40,000
13,890 100,000 768,619 735,167
13.7 25.2 47.2 58.0
11.8 20.8 37.9 46.9
11.2 20.3 34.8 40.8
Total 380,000 1,617,676
Wheel Load
(kN)
Load
Repetitions
ESALs
Surface Rut Depths, mm 450 mm Subbase
650 mm Subbase
950 mm Subbase
25 40
100,000 25,000
13,890 25,000
9.5 11.0
9.1 10.6
9.1 10.6
Total 140,000 38,890
Native Soil Subgrade Moisture
Saturated Subbase & Soil
Drained Subbase & Soil

Number of Days in a Year When the Subbase has Standing Water (Wet Days) 0 10 30
Resilient Modulus of Subgrade (MPa)
Dry 40 60 80 100 40 60 80 100 40 60 80 100
Wet 24 36 48 60 24 36 48 60 24 36 48 60
Cohesion (kPa), Internal Friction Angle of Subgrade (°)
Dry 10,
20
15,
25
20,
30
25,
35
10,
20
15,
25
20,
30
25,
35
10,
20
15,
25
20,
30
25,
35
Wet 6,
12
9,
15
12,
22
15,
25
6,
12
9,
15
12,
22
15,
25
6,
12
9,
15
12,
22
15,
25
Lifetime ESALs (Traffic Index) Minimum Subbase Thickness in mm ASTM #2 for 25 mm Allowable Rut Depth
(All designs have 80 mm Paver, 50 mm ASTM #8 Bedding Layer, & 100 mm ASTM #57 Base Layer)
50,000 (6.3) 150 150 150 150 150 150 150 150 150 150 150 150
100,000 (6.8) 150 150 150 150 210 150 150 150 260 150 150 150
200,000 (7.4) 230 150 150 150 315 210 150 150 365 255 160 150
300,000 (7.8) 290 180 150 150 375 265 170 150 425 315 215 150
400,000 (8.1) 330 220 150 150 420 305 210 150 470 350 255 175
500,000 (8.3) 360 250 160 150 450 335 240 160 500 380 280 205
600,000 (8.5) 385 275 185 150 475 360 260 180 525 405 305 225
700,000 (8.6) 410 295 205 150 495 380 280 200 550 425 325 245
800,000 (8.8) 425 310 220 150 515 395 295 215 565 440 340 260
900,000 (8.9) 440 325 235 155 530 410 310 230 585 455 355 270
1,000,000 (9.0) 455 340 250 165 545 425 325 240 600 470 365 285
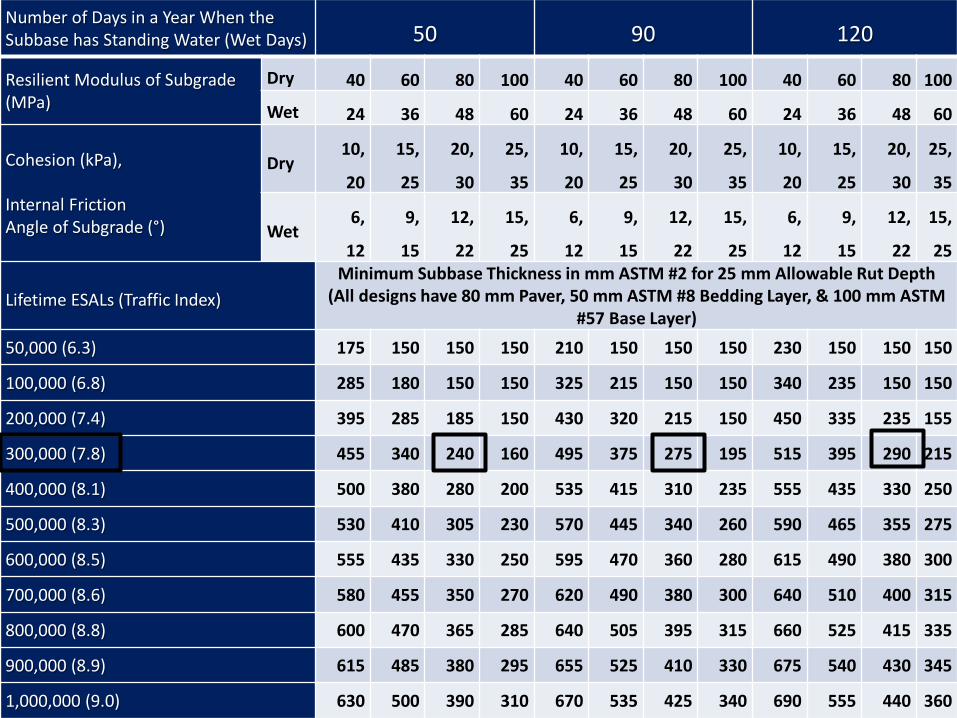
Number of Days in a Year When the Subbase has Standing Water (Wet Days) 50 90 120
Resilient Modulus of Subgrade (MPa)
Dry 40 60 80 100 40 60 80 100 40 60 80 100
Wet 24 36 48 60 24 36 48 60 24 36 48 60
Cohesion (kPa), Internal Friction Angle of Subgrade (°)
Dry 10,
20
15,
25
20,
30
25,
35
10,
20
15,
25
20,
30
25,
35
10,
20
15,
25
20,
30
25,
35
Wet 6,
12
9,
15
12,
22
15,
25
6,
12
9,
15
12,
22
15,
25
6,
12
9,
15
12,
22
15,
25
Lifetime ESALs (Traffic Index) Minimum Subbase Thickness in mm ASTM #2 for 25 mm Allowable Rut Depth
(All designs have 80 mm Paver, 50 mm ASTM #8 Bedding Layer, & 100 mm ASTM #57 Base Layer)
50,000 (6.3) 175 150 150 150 210 150 150 150 230 150 150 150
100,000 (6.8) 285 180 150 150 325 215 150 150 340 235 150 150
200,000 (7.4) 395 285 185 150 430 320 215 150 450 335 235 155
300,000 (7.8) 455 340 240 160 495 375 275 195 515 395 290 215
400,000 (8.1) 500 380 280 200 535 415 310 235 555 435 330 250
500,000 (8.3) 530 410 305 230 570 445 340 260 590 465 355 275
600,000 (8.5) 555 435 330 250 595 470 360 280 615 490 380 300
700,000 (8.6) 580 455 350 270 620 490 380 300 640 510 400 315
800,000 (8.8) 600 470 365 285 640 505 395 315 660 525 415 335
900,000 (8.9) 615 485 380 295 655 525 410 330 675 540 430 345
1,000,000 (9.0) 630 500 390 310 670 535 425 340 690 555 440 360
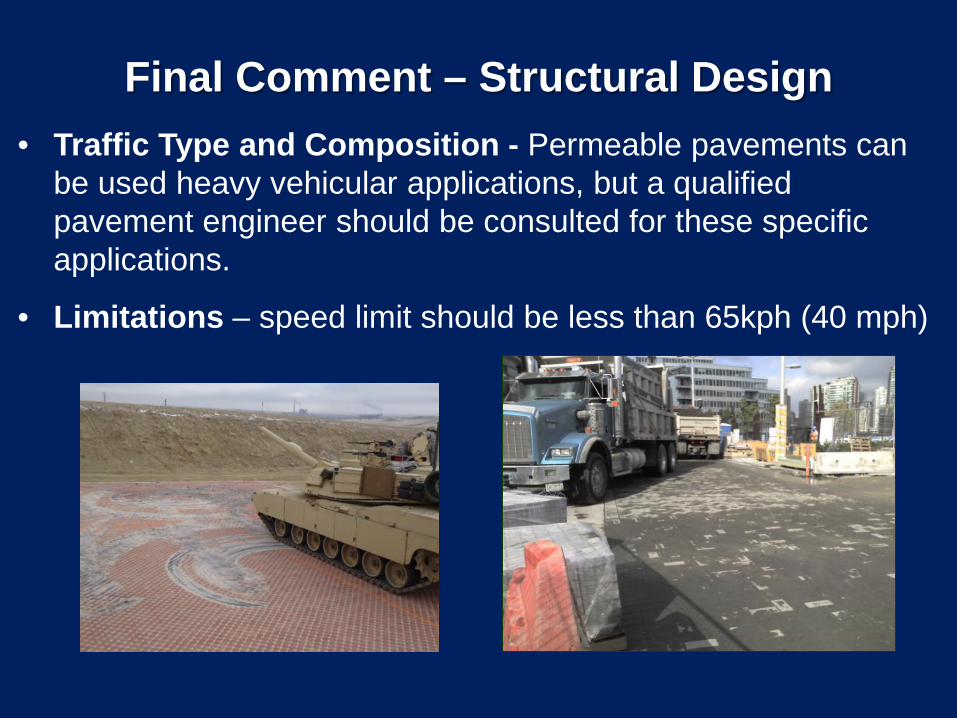
Final Comment – Structural Design • Traffic Type and Composition - Permeable pavements can
be used heavy vehicular applications, but a qualified pavement engineer should be consulted for these specific applications.
• Limitations – speed limit should be less than 65kph (40 mph)

Hydraulic Design (S3.3) Determine Hydraulic Goals
• Volume control (maintain pre-development conditions)
• Water quality (catch first flush)
• Thermal quality
• Peak flow control
• Downstream erosion control
• Infiltration/recharge targets
• Ecosystem/habitat maintenance
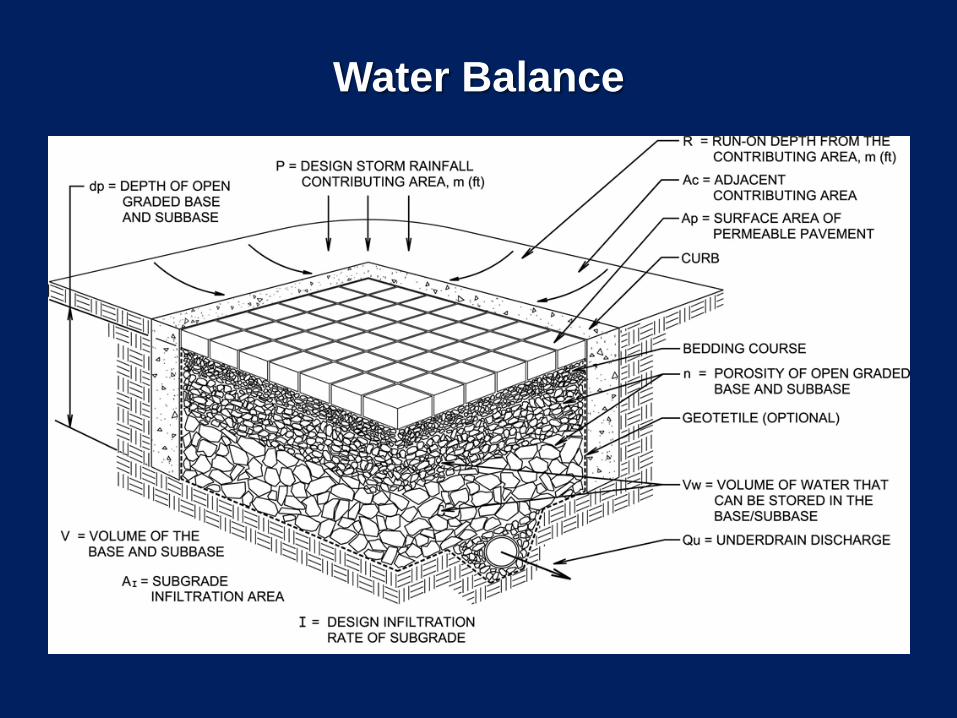
Water Balance
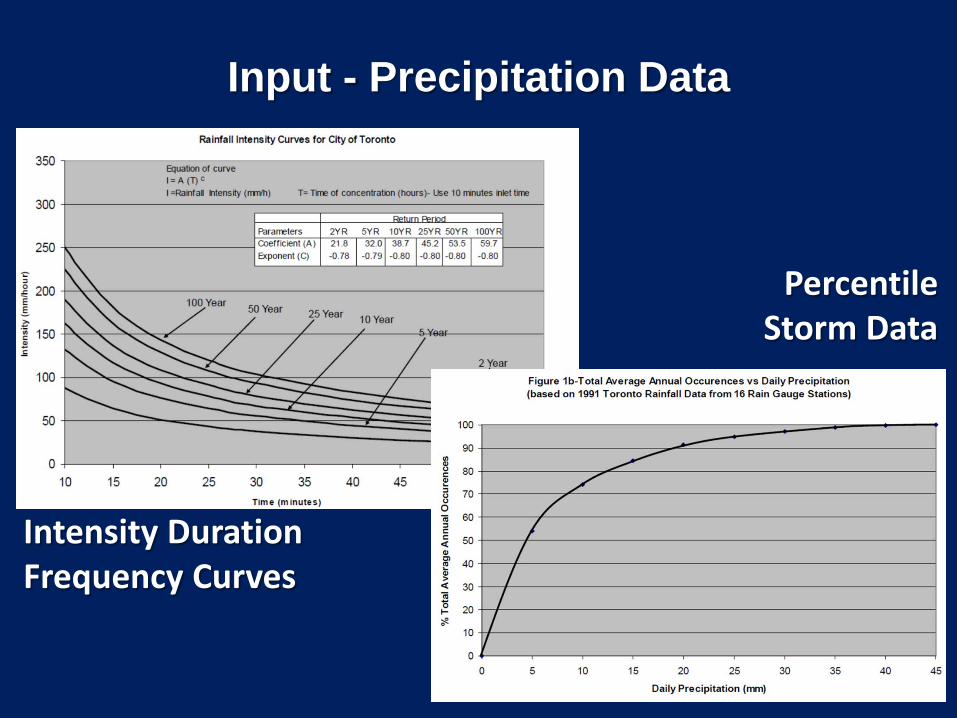
Input - Precipitation Data
Intensity Duration Frequency Curves
Percentile Storm Data
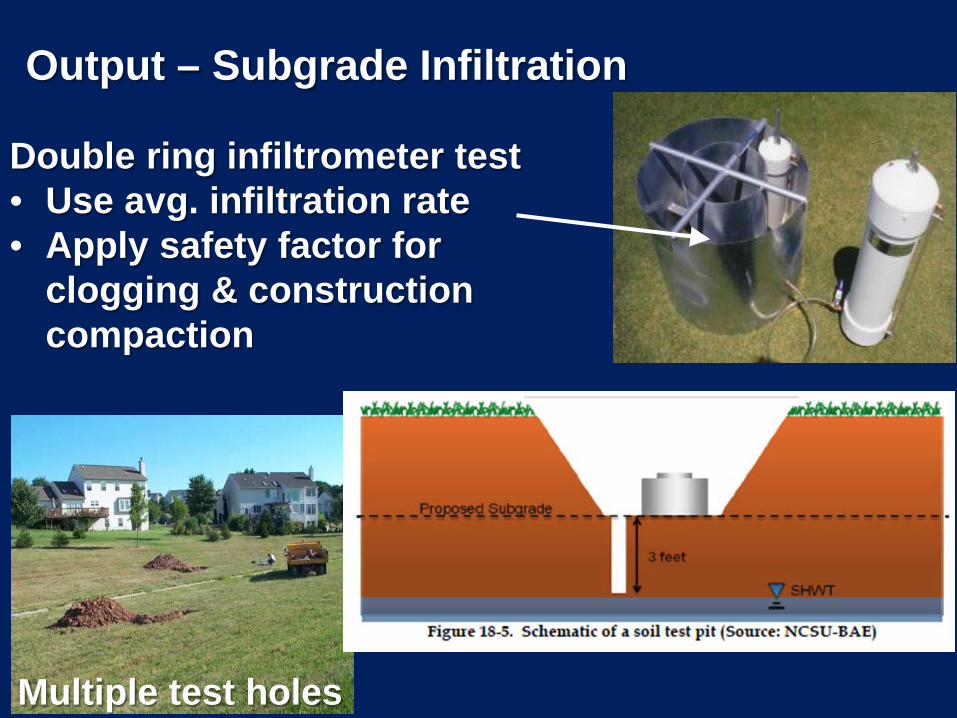
Output – Subgrade Infiltration
Double ring infiltrometer test • Use avg. infiltration rate • Apply safety factor for
clogging & construction compaction
Multiple test holes

Output – Subgrade Infiltration
WHAT IS ENOUGH?
5,251 mm/d
1,469 mm/d
621 mm/d
317 mm/d
165 mm/d
104 mm/d
55 mm/d
31 mm/d
24 mm/d
12 mm/d
37 mm/d
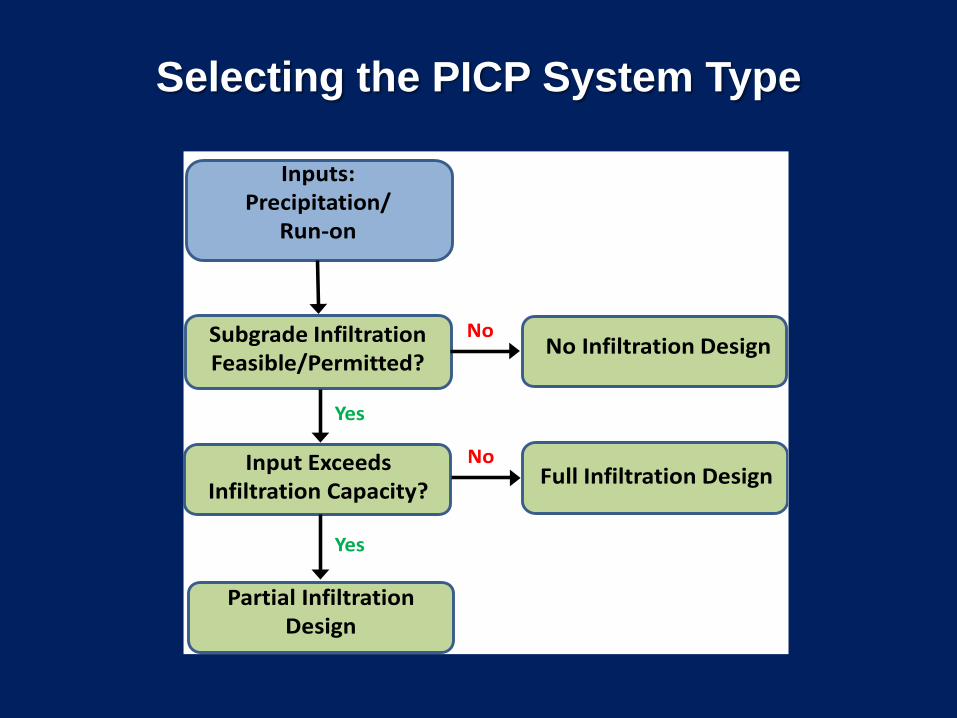
Selecting the PICP System Type
No Infiltration DesignSubgrade Infiltration Feasible/Permitted?
Inputs:Precipitation/
Run-on
No
Yes
Input Exceeds Infiltration Capacity?
Yes
Full Infiltration DesignNo
Partial Infiltration Design
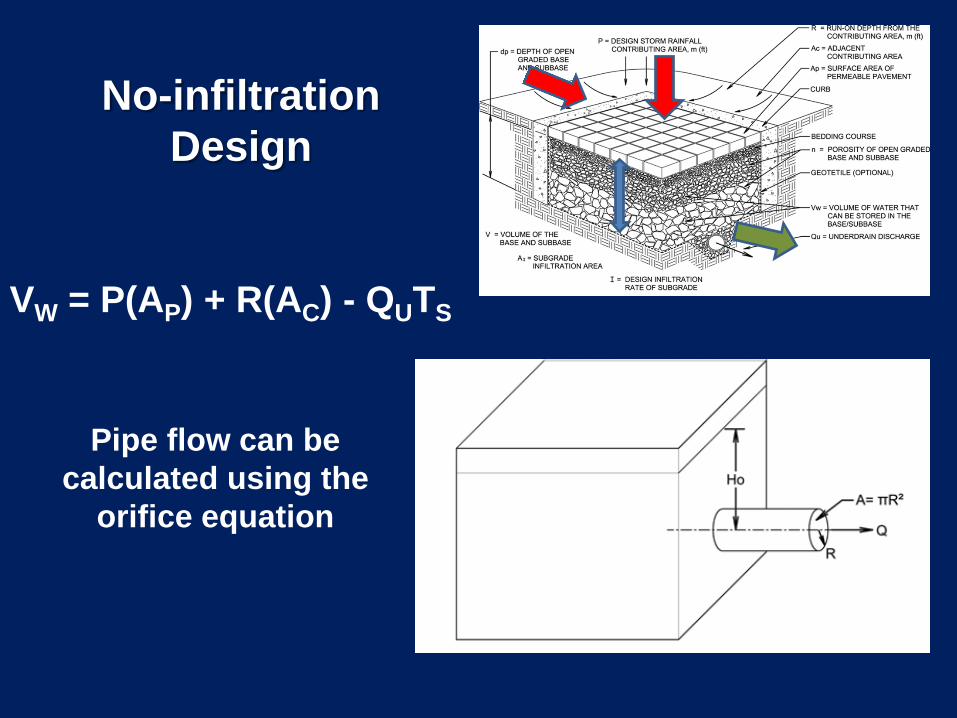
No-infiltration Design
VW = P(AP) + R(AC) - QUTS
Pipe flow can be calculated using the
orifice equation
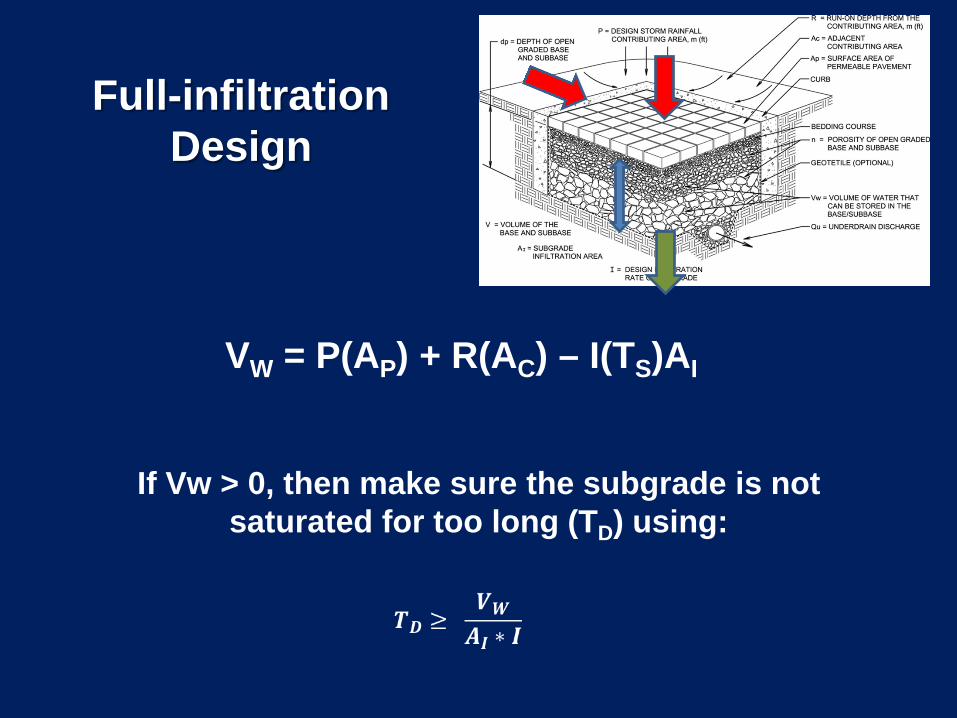
Full-infiltration Design
VW = P(AP) + R(AC) – I(TS)AI
If Vw > 0, then make sure the subgrade is not saturated for too long (TD) using:
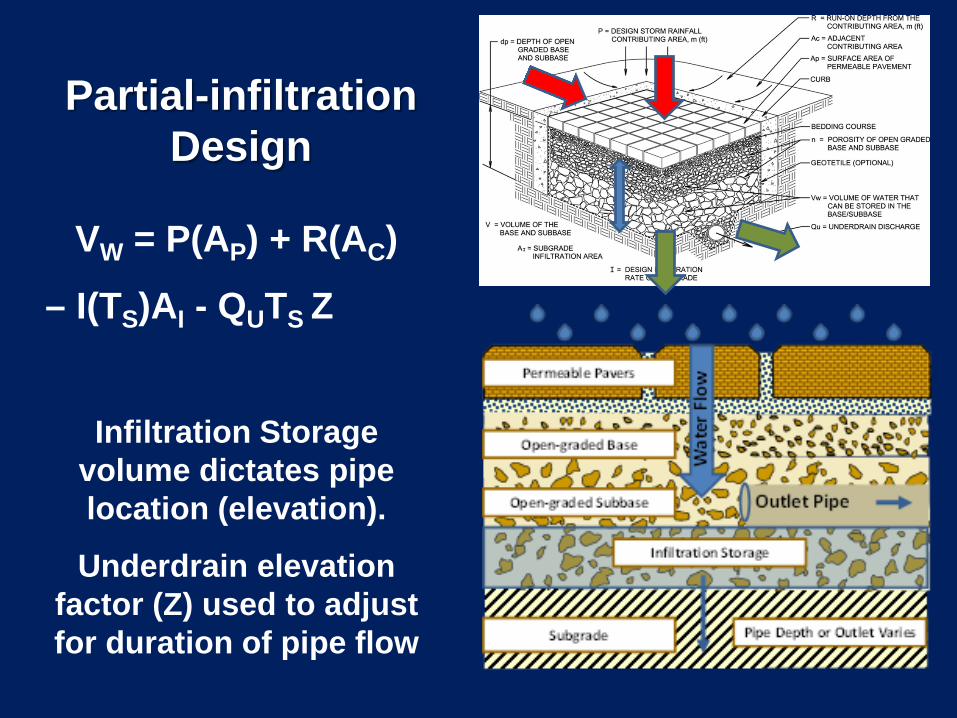
Partial-infiltration Design
VW = P(AP) + R(AC)
– I(TS)AI - QUTS Z
Infiltration Storage volume dictates pipe location (elevation).
Underdrain elevation factor (Z) used to adjust for duration of pipe flow

Additional Design Considerations (S3.5) • Outlet structures provide for future modifications to
the storage depth, and provide a convenient monitoring location.
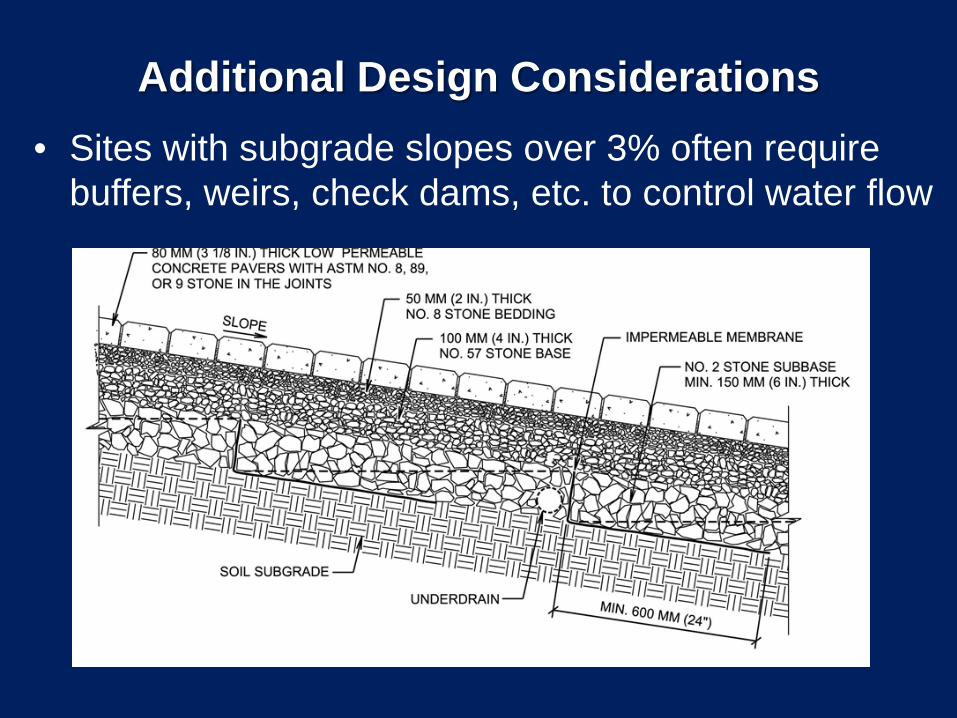
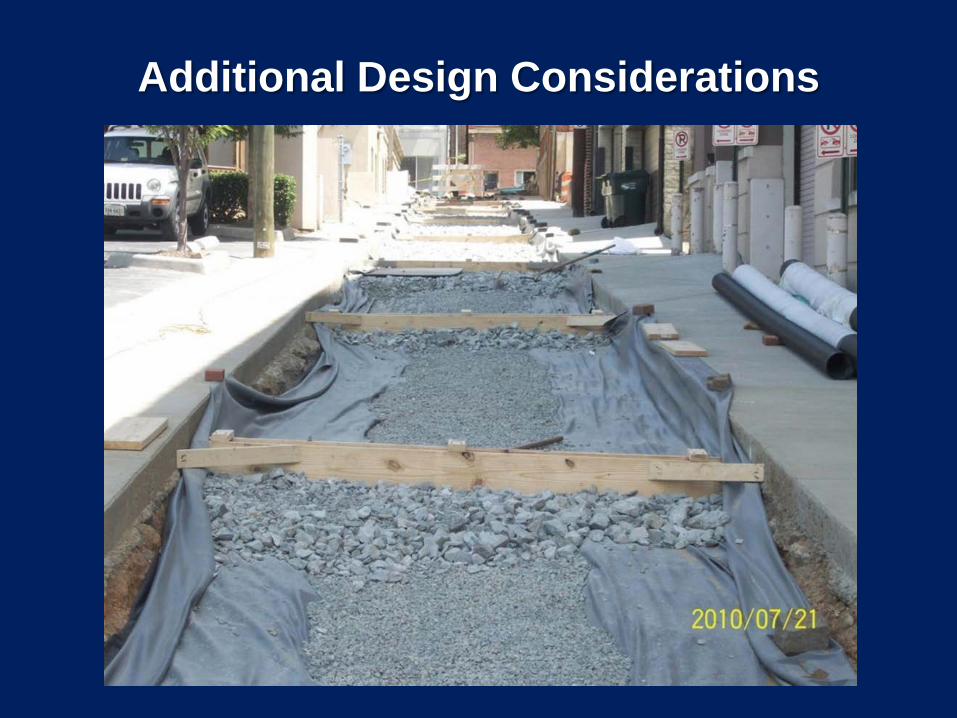
Additional Design Considerations • Sites with subgrade slopes over 3% often require
buffers, weirs, check dams, etc. to control water flow
Additional Design Considerations
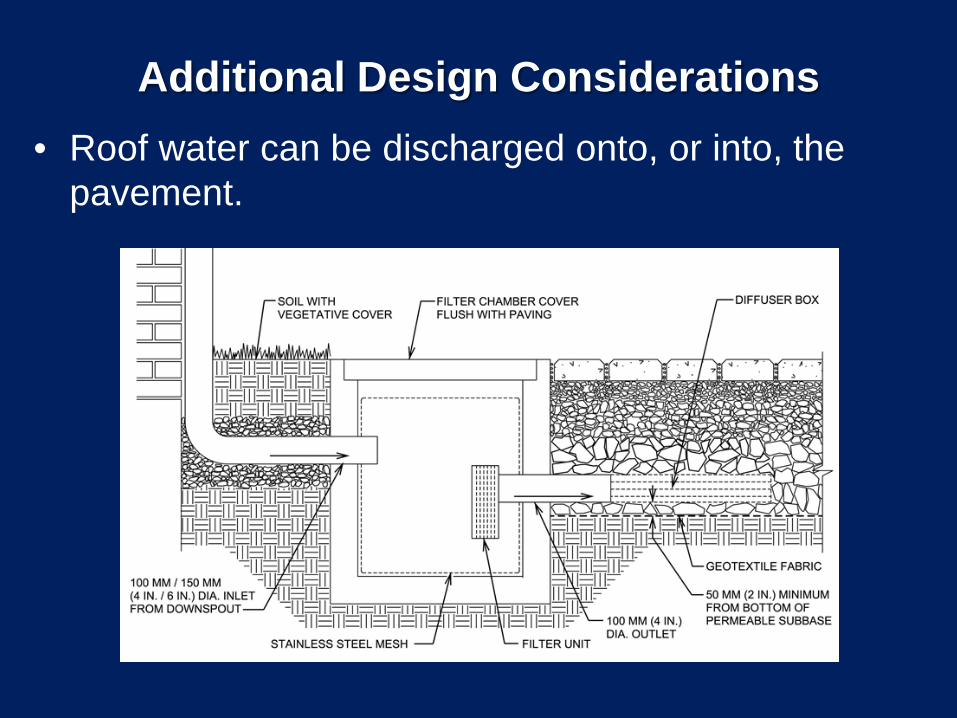
Additional Design Considerations • Roof water can be discharged onto, or into, the
pavement.
Additional Design Considerations
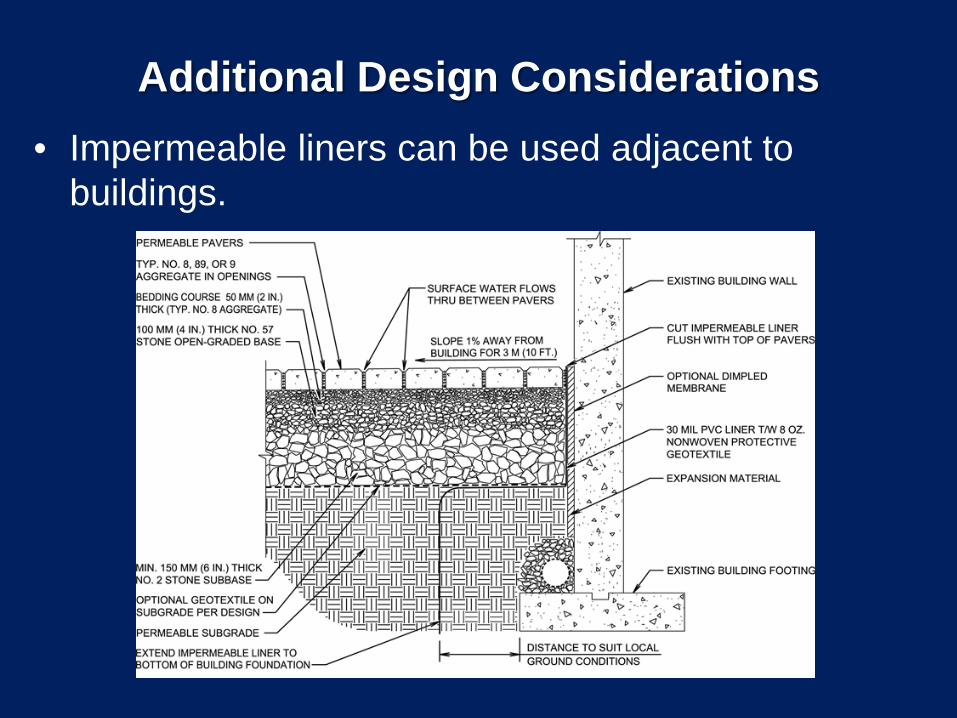
Additional Design Considerations • Impermeable liners can be used adjacent to
buildings.
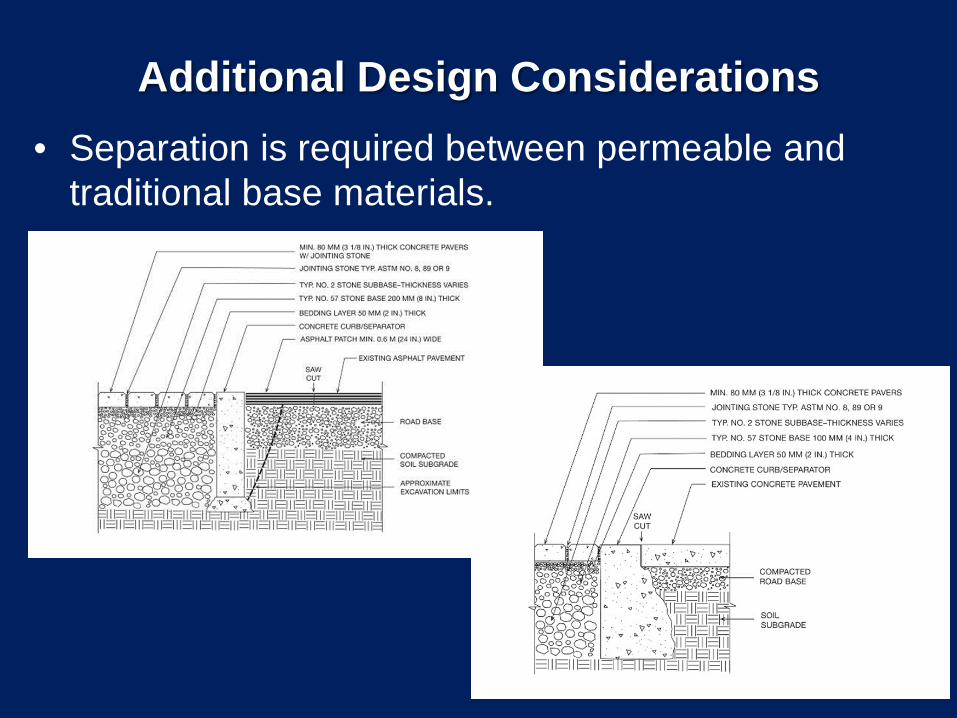
Additional Design Considerations • Separation is required between permeable and
traditional base materials.
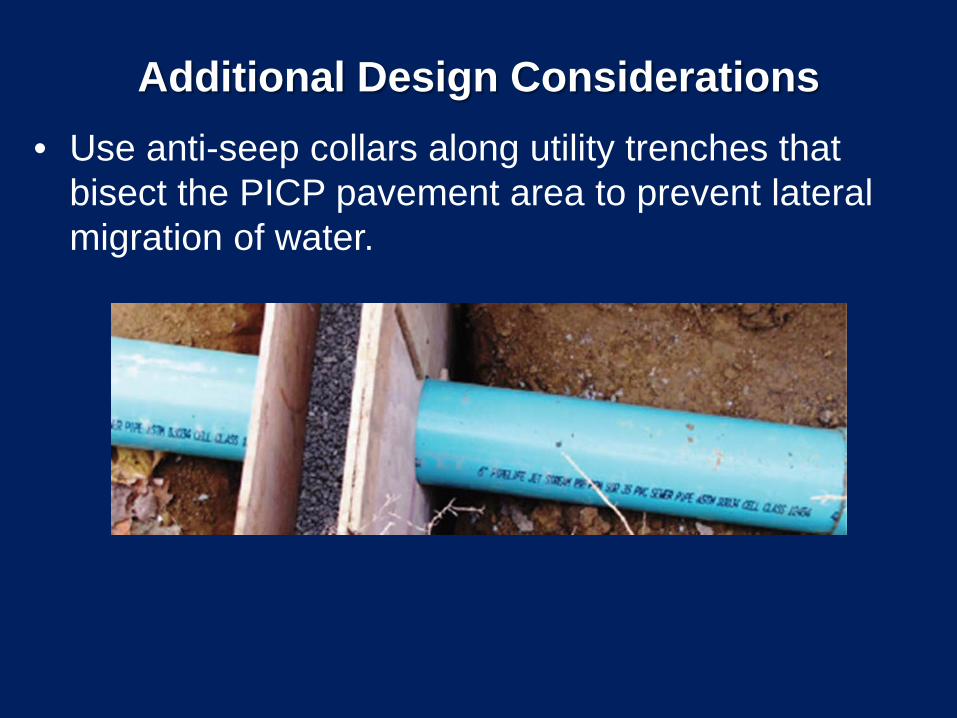
Additional Design Considerations • Use anti-seep collars along utility trenches that
bisect the PICP pavement area to prevent lateral migration of water.

Pre-Construction Meeting (S4.2) • PICP construction
sequence
• Erosion & sediment control plan
• Subgrade protection
• Material storage
• Paver stitching
• Inspection criteria
• Contractor certification

Erosion and Sediment Control (S4.3)

Construction Inspection Checklist (S4.4)
Minimizing compaction
DO NOT scarify
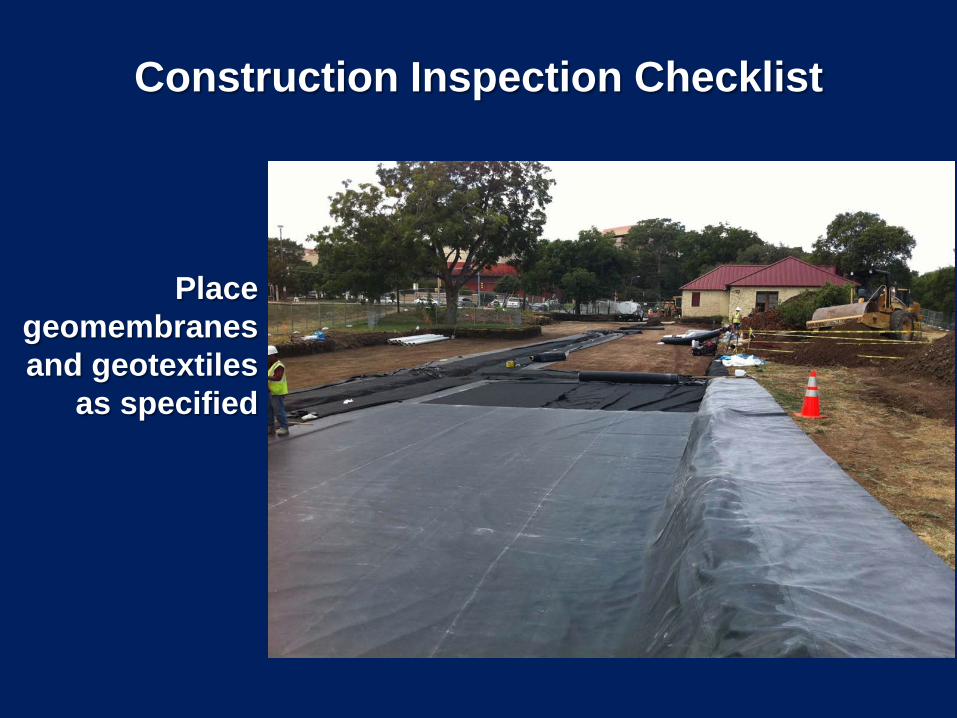
Construction Inspection Checklist
Place geomembranes and geotextiles
as specified

Construction Inspection Checklist
Underdrain placement
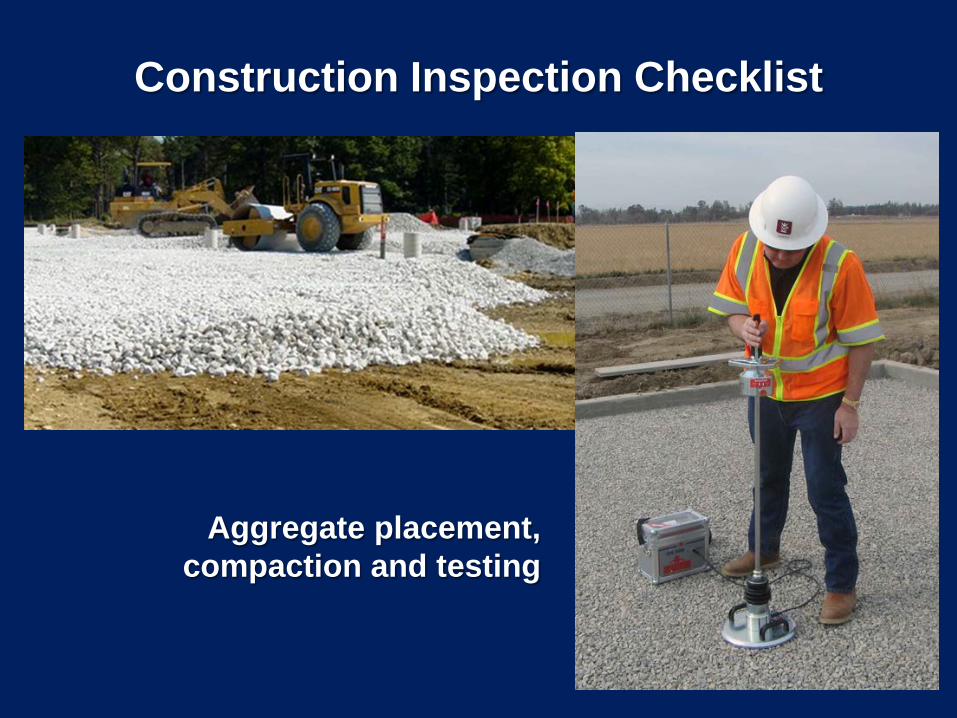
Construction Inspection Checklist
Aggregate placement, compaction and testing

Mechanical PICP Installation
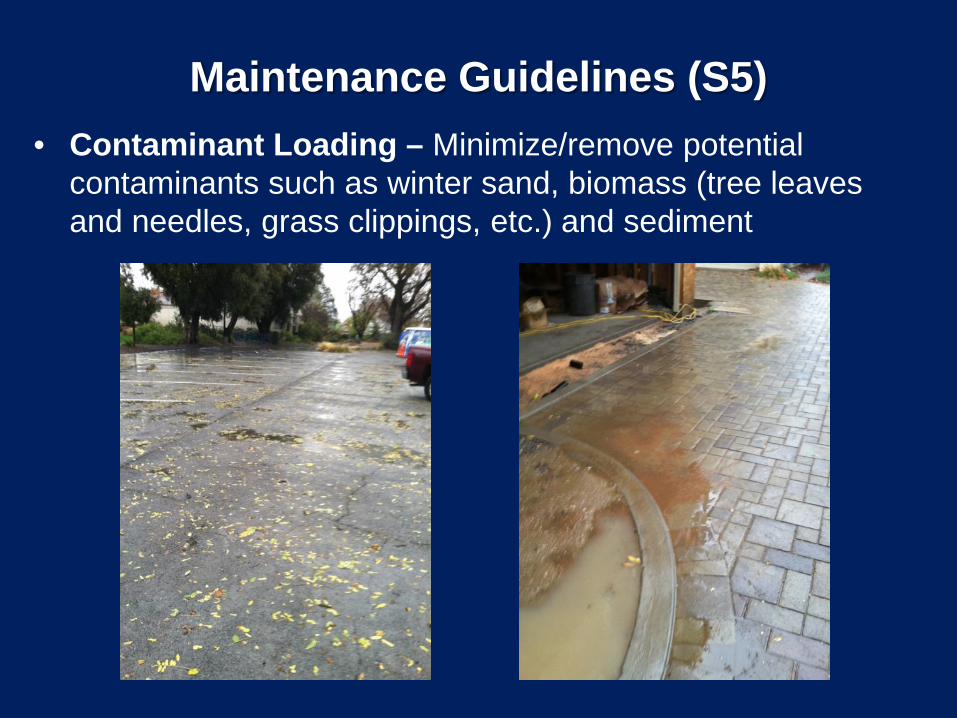
Maintenance Guidelines (S5) • Contaminant Loading – Minimize/remove potential
contaminants such as winter sand, biomass (tree leaves and needles, grass clippings, etc.) and sediment

Maintenance Guidelines • Infiltration Testing – Test surface infiltration rate using
ASTM C1781
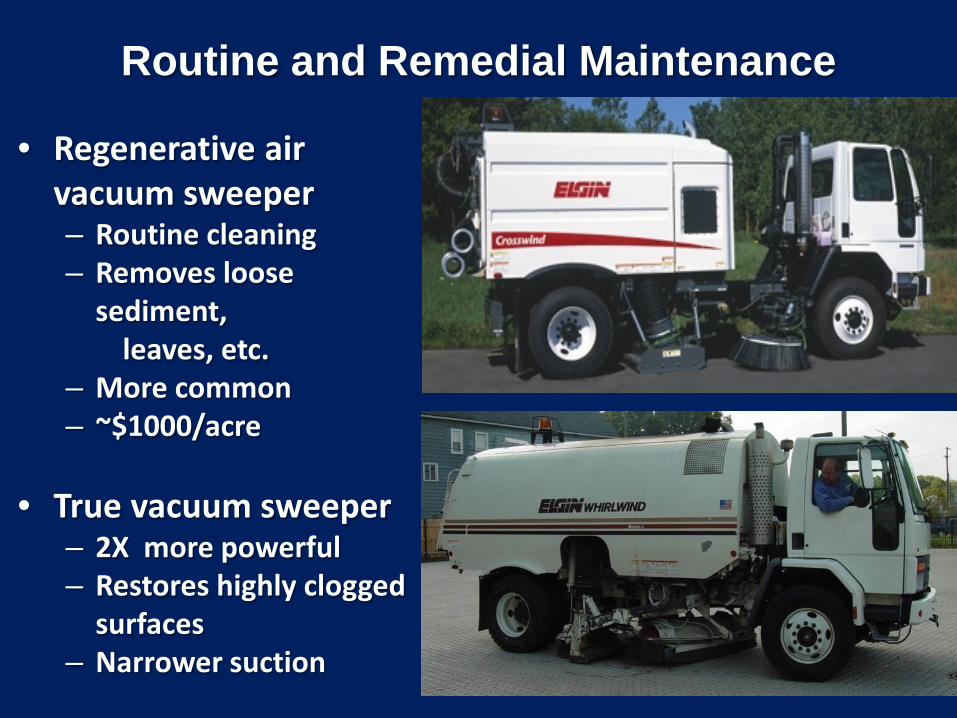
Routine and Remedial Maintenance
• Regenerative air vacuum sweeper – Routine cleaning – Removes loose
sediment, leaves, etc. – More common – ~$1000/acre
• True vacuum sweeper
– 2X more powerful – Restores highly clogged
surfaces – Narrower suction
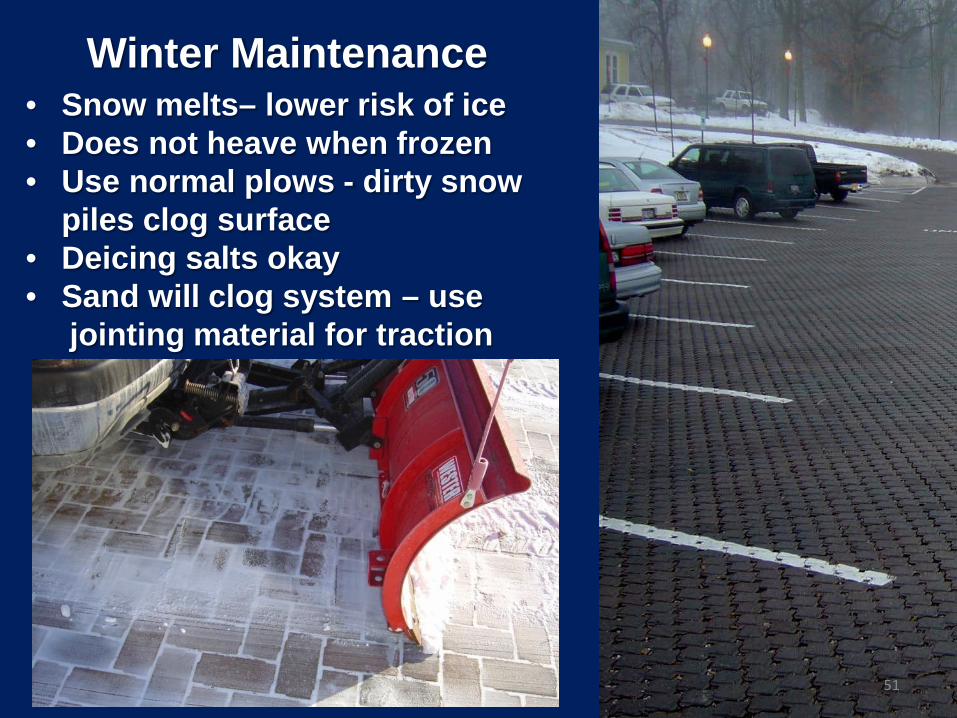
Winter Maintenance • Snow melts– lower risk of ice • Does not heave when frozen • Use normal plows - dirty snow
piles clog surface • Deicing salts okay • Sand will clog system – use jointing material for traction
51

Status of ASCE Standard Guideline
• Final Standard Development Meeting to be held in Houston in June 2016
• Full Standard will undergo editing before going to public comment for 45 days in the summer of 2016
• Intent to publish the standard by the end of 2016

Projections for Euro 2016?
Recommended