PERPUSTAKAAN UMP
11111111111111111111111111111111111111111111111 0000073702
DETERMINATION OF SELECTED HEAVY METAL IN ROAD DUST
ALONG GAMBANG - KUANTAN ROAD
ABU BAKAR BIN ZULKJFLLI
Report submitted in partial fulfillment of the requirements for the award of
Bachelor of Applied Science (Honours) in Industrial Chemistry
Faculty of Industrial Sciences & Technology
UNIVERSITI MALAYSIA PAHANG
2012

ABSTRACT
Some heavy metals help important role in our body but it also can be a dangerous treat if it been taken for too much. The uncontrolled emission of heavy metal that been discharge by human activities can be transported by water, air and deposited to land surface as road dust. Due to we use road almost every day in purpose go to work or any event, the increases of heavy metal concentration in road dust are might affect human health through inhalation. Since 2009 there is much development and construction activities actively grow in kuantan, especially in Kuantan - Gambang road including industrial and residential area. Review from literature showed that heavy metal concentrations are greater at area closer to industrial and construction activities. It also shows that communities who live near highway might be having higher asthma and allergy rate. The objective of this study is to determine the concentration of heavy metal in road dust of Kuantan - Gambang road. Road dust samples were collected from several sites covering residential area, industrial area, airport, campus UMIP, bus terminal and agriculture area. Heavy metals, including Cr (chromium), Mn (manganese), Fe (ferum), Ni (nickel), Zn (zinc), Pb (plumbum), Cu (cuprum) and Cd (cadmium) have been selected in this study. After sampling, the samples were heated in muffle furnace up to 550°C for 4 hours to remove any possible organic matter. After that, the samples were digested using aqua regia and were determined by using atomic absorption spectrometer (AAS). Results showed that heavy metals concentration in road dust samples were ranged from 0.01 tg/g to 60.00 .tg/g. Sampling site with the highest concentration of heavy metals was the road that far from Kuantan. Meanwhile, for site that contain lowest concentration of heavy metals was the mining area at Gambang which located far away from Kuantan. In addition, cadmium and chromium were below the detection limit.
V

ABSTRAK
Sebahagian logam berat memamkan peranan penting dalam badan kita tetapi boleh juga menjadi berbahaya jika diambil terlalu banyak. Pembebasan logam berat yang tidak terkawal oleh aktiviti manusia dapat dipindahkan melalui air, udara dan terutama sekali tanah atau lebih khusus iaitu debu jalan: Disebabkan penggunaan jalan raya hampir setiap hari dengan tujuan untuk pergi bekerja atau peristiwa apapun. mi menyebabkan peningkatan kepekatan logam berat dalam debu jalan berkadar langsung dengan kawasan yang hampir dengan Bandar. Dalam ekonomi baru di mana terdapat banyak pembangunan dan pembinaan yang giat dijalankan bermula tahun 2009 sehingga sekarang, terutamanya di kawasan kuantan-gambang. Kawasan industri, perumahan dan kawasan awam merupakan penyumbang besar pada masalah kesihatan dan pencemaran alam sekitar. Dapat disimpulkan bahawa kepekatan logam berat menjadi semakin tinggi jika semakin hampir dengan kawasan kegiatan industri dan pembinaan. Hal mi juga menunjukkan bahawa masyarakat yang tinggal berdekatan jalan raya kemungkinan besar mengalami asma dan alahan yang tinggi. Objektif utama kajian mi adalah untuk menentukan kepekatan logam berat dalam debu jalan di jalan kuantan-gambang. Sampel debu akan dikumpulkan dan beberapa kawasan yang telah dipersetujui meliputi kawasan perumahan, kawasan industri, lapangan terbang, kampus UMP, terminal bas dan kawasan pertanian sebagai kawasan kawalan. Di dalamnya berkemungkinan mengandungi logam berat seperti Cr (kromium), Mn (mangan), Fe (besi), Ni (nikel), Zn (zink), Pb (plumbum), Cu (tembaga) dan Cd (kadmium). Setelah selesai mengutip sampel, sampel debu jalan dipanaskan dalam tungku sehingga 550°C selama 4 jam untuk membuang kebarangkalian benda organik. Setelah itu, sampel dicerna menggunakan aqua regia dan ditentukan dengan menggunakan spektrometer serapan atom (AAS). Hasil penelitian menunjukkan bahwa konsentrasi logam berat dalam sampel debu jalan di dalam lingkungan 0.01 j.tg/g sehingga 60.00 jig/g. Kawasan ujian dengan konsentrasi tertinggi logam berat adalah jalan yang jauh dari Kuantan. Sementara itu, untuk kawasan yang mengandung konsentrasi terendah logam berat adalah dari area perlombongan di gambang yang terletak jauh dari Kuantan. Tambahan, untuk kadmium dan kromium, kedua dua elemen mi berada di bawah batas deteksi.
VI

VII
TABLE OF CONTENTS
page
SUPERVISOR'S DECLARATION STUDENT'S DECLARATION ACKNOWLEDGEMENTS ABSTRACT ABSTRAK TABLE OF CONTENTS LIST OF TABLES ix LIST OF FIGURES LIST OF SYMBOLS xi LIST OF ABBREVIATIONS
CHAPTER 1 INTRODUCTION
1.1 Background 1
1.2 Problem statements 2
1.3 Research questions 3
1.4 Research objective 3
1.5 Rational and significance 4
CHAPTER 2 LITERATURE REVIEW
2.1 Dust
2.1.1 Road dust 2.2. Heavy metals 7
2.2.1 Sources of heavy metal in environment 7 2.2.2 Health effect of heavy metal 9
2.3 Spectroscopy 10
2.3.1 Atomic Absorption Spectroscopy (AAS) 10 2.3.1a Light source 11 2.3.lbAtomizer 11 2.3.1c Excitation 12 2.3.1d Light separation and detection 12
2.4 Previous studies 12

VIII
CHAPTER 3 METHODOLOGY
3.1 Sampling locations 15
3.1.1 Sampling 16 3.1.2 Sampling preparation 16
3.2 Proceduresto analysis the sample 16
3.2.1 Standard solutions 16 3.2.2 Analysis by AAS 17
CHAPTER 4 RESULT AND DISCUSSION
4.1 Standard calibration curves 18
4.1.1 Standard concentration for lead 18 4.1.2 Standard concentration for zinc 19 4.1.3 Standard concentration for nickel 20 4.1.4 Standard concentration for iron 21 4.1.5 Standard concentration for manganese 22 4.1.6 Standard concentration for copper 23 4.1.7 Standard concentration for chromium 24 4.1.8 Standard concentration for cadmium 25
4.2 Limit Of Detection And Limit Of Quantification 26
4.3 The sample analysis by using AAS 27
4.3.1 Concentration of lead in every sample site 27 4.3.2 Concentration of zinc in every sample site 28 4.3.3 Concentration of nickel in every sample site 29 4.3.4 Concentration of iron in every sample site 29 4.3.5 Concentration of manganese in every sample site 30 4.3.6 Concentration of copper in every sample site 31 4.3.7 Concentration of chromium in every sample site 31 4.3.8 Concentration of cadmium in every sample site 31
4.4 Correlation analysis 32
4.5 Metals concentration in each sampling site 33
4.6 Discussions 34
CHAPTER 5 CONCLUSION AND RECOMMENDATION
5.1 Conclusions 38
5.2 Recommendation 39
REFERENCES 40

IA
LIST OF TABLES
Table No. Page
2.1 List for temperature of some common flame 12
2.2 Table of previous study in different location 13
3.1 Wavelength for lamp 17
4.1 Standard concentration for Lead (Pb) 18
4.2 Standard concentration for Zinc (Zn) 19
4.3 Standard concentration for Nickel (Ni) 20
4.4 Standard concentration for Iron (Fe) 21
4.5 Standard concentration for Manganese (Mn) 22
4.6 Standard concentration for Copper (Cu) 23
4.7 Standard concentration for Chromium (Cr) 24
4.8 Standard concentration for Cadmium (Cd) 25
4.9 List of LOD and LOQ for every metal. 27
4.10 The correlation analysis table between eight heavy metals 32
4.11 Table of metals concentration in each sampling site 33

A
LIST OF FIGURES
Figure No. Page
2.1 The sources of heavy metal 8
2.2 Schematic diagram of atomic absorption spectroscopy (AAS) 11
3.1 The road from gambang to kuantan 15
4.1 The standard solution for concentration of Lead (mg/L) 19
4.2 The standard solution for concentration of Zinc (mg/L) 20
4.3 The standard solution for concentration of Nickel (mg/L) 21
4.4 The standard solution for concentration of Iron (mg/L) 22
4.5 The standard solution for concentration of Manganese (mg/L) 23
4.6 The standard solution for concentration of Copper (mg/L) 24
4.7 The standard solution for concentration of Chromium (mg/L) 25
4.8 The standard solution for concentration of Cadmium (mg/L) 26
4.9 The concentration of lead (.tg/g) at different area 28
4.10 The concentration of Zinc (.tg/g) at different area 28
4.11 The concentration of Nickel (jiglg) at different area 29
4.12 The concentration of Iron (.tg/g) at different area 30
4.13 The concentration of Manganese (tg/g) at different area 30
4.14 The concentration of Copper (tg/g) at different area 31
4.15 The graph of concentration versus distance 34

LIST OF SYMBOLS
mg / L Milligram per Litre
ppm Parts per million
tg / g Microgram per Gram
Al

LIST OF ABBREVIATIONS
AAS Atomic Absorption Spectroscopy
LOD Limit of Detection
LOQ Limit of Quantitation
XII

CHAPTER 1
INTRODUCTION
1.1 Background of Study
Metals generally can be divided into light metals and heavy metals. Light
metals are metals that contain low atomic weight. Lithium, beryllium, sodium,
magnesium and aluminium are harmless light metal in tiny quantity. Metals heavier
than nickel are usually called heavy metals. Light metals are generally less toxic than
heavy metals. Beryllium is toxic, but it is rarely found in large
concentrations. Vanadium, not always counted as a light metal, is also toxic. Other
light metals are toxic in large amounts. Metals are defined chemically as "elements
which conduct electricity, have a metallic luster, are malleable and ductile, form
cations, and have basic oxides" (Atkins and Jones, 1997). Heavy metal can be
described as element that exhibit metallic properties and has an unstable electronic
configuration. Due to its unstable orbital, its tend to donate or sharing electron
between another element to reach equilibrium. Those heavy metal that release freely
will react to atmosphere and some of them are dangerous to health or to the
environment (e.g. cadmium, lead, chromium), some may cause corrosion (e.g. zinc,
lead), and some metals are harmful in other ways. In addition, some of these
elements are actually necessary for humans in tiny amounts (cobalt, copper,
chromium, manganese, nickel) while others are carcinogenic or toxic, affecting,
among others, the central nervous system (manganese, mercury, lead, arsenic), the
kidneys or liver (mercury, lead, cadmium, copper) or skin, bones, or teeth (nickel,
cadmium, copper, chromium).
J.
Heavy metal pollution can arise from many sources but most commonly
arises from the purification of metals, e.g., the smelting of copper, the preparation
of nuclear fuels and electroplating. The sad thing about the pollution of the
environment with heavy metals is that they can't be biologically degraded, they can
only be transformed from one oxidation state or Organic complex to another (Lone et
al., 2008; Jing et al., 2007). Heavy metals are found naturally in the soil mostly in its
complexes or bound form such as in ZnSO 4, ZnCl and Zinc Oxides. They enter the
environment by human activities such as mining, purification of zinc, lead and
cadmium, steel production, coal burning, burning of wastes, discharges from
industrial effluents, excessive use of fertilizer, pesticide application and use of raw
sewage waste in farming, (Lone et al., 2008; Okoronkwo et al., 2005; Jing et al.,
2007). Through precipitation of their compounds or by ion exchange
into soils and mud, heavy metal pollutants can localize and leave hidden in road dust.
Incomplete reaction of inorganic materials from different urban sources is
responsible for surface road dusts contamination with heavy metal.
Automobile exhaust, lubricating oils, atmospheric depositions, power plants,
domestic heating systems, petrol and diesel engines, refuse burning and various
industrial activities, concentrations of heavy metal in street dust are assumed to be
influenced by traffic density and rate of deposition. Diesel vehicle exhaust, tire and
pavement are expected to be the major contributors of heavy metal in road dust in
Pahang state. Unfortunately, it has unconformities that there was a major difference
in the Heavy metal profiles between locations rather than between size-fractions and
sampling times. Heavy metal concentration in road dust was may be different
according to the distance from the source of pollution.
1.2 Problem Statement
Air pollution is composed of many environmental factors. They include
carbon monoxide, nitrates, sulfur dioxide, ozone, lead, secondhand tobacco smoke
and particulate matter. Particulate matter, also known as particle pollution, is
composed of solid and liquid particles within the air. There are different sized dust
Particles. Coarser particles affect the mouth, throat and nostrils but cannot be inhaled.
Fine and very fine particles can be inhaled and enter the lungs and respiratory tract,
which is a health risk. A research professor in the division of atmospheric sciences at
Nevada's Desert Research Institute said that Particles smaller than 2.5 microns go
deeper into the lungs, where they can damage epithelial cells and even pass into the
bloodstream. Particles larger than 2.5 microns can lodge in the upper respiratory
area, where they may cause severe irritation. Effects may be especially pronounced
in infants, the elderly, and those with pre-existing conditions such as asthma.
Particles this size may also be linked to some respiratory cancers. Dust particles this
small can elude all but the most specialized of filters. So those who live near
unpaved roads aren't the only people at risk from these particles but vehicle
passengers also are exposed, even if they ride with their windows rolled up. And the
dust impacts not only the air, but the water as well, as it settles into nearby streams
and rivers. A series of road dust particles will be investigate to evaluate the ratio
between metal content in each fraction of particle size and total metal content.
1.3 Research Questions
This study embraces some research questions, which are;
1. What is a major source of heavy metals deposited on the main road of
kuantan - gambang?
2. What is the relation between human activities and level of contamination of
heavy metals in road dust?
1.4 Objective of the Study
Many heavy metals become bound to the surface of soil and roadside dust.
Elevated emissions and their depositions over time can lead to anomalous
enrichment, causing metal contamination of the surface environment (Pagotto et al.,
2001; Sabiha et al., 2009). The objectives of this study are:
1. To measure the concentration of selected heavy metals in road dust of
kuantan - gambang road
2. To compare distribution of heavy metals at different area (with different daily
activities)
1.5 Rationale and Significance
Gambang - Kuantan road, which is also known as Jalan Gambang and Jalan
Tanah Putih, is the major highway that connects Gambang to Kuantan. At Gambang
exit, the roads interchange with Segamat - Kuantan highway and also the east coast
expressway, connecting KL and Terengganu. Heavy traffic flow at this road has
drawn public concern on the pollution and possible health effect. Therefore this study
will focus on determination of selected heavy metals in road dust along Kuantan -
Gambang road.

CHAPTER 2
LITERATURE REVIEW
2.1 Dust
Dust is an earth or other matter in fine, dry particles. Powdery earth or other
matters in fine, dry particles are easily suspended in air, raised and wafted by the
wind. Airborne particulate matter, ranging in diameter from 10 to 50 microns, is
generated by activities such as cutting, crushing, detonation, grinding, and handling
of organic and inorganic matter such as coal, grain, metal, ore, rock, wood. Industrial
dust generated by cutting, drilling, grinding, or sawing (which are usually less than
10 microns in diameter) can pose health risks if inhaled and would be more
hazardous due to its ability to embed deep into lungs and other tissue (Segerstedt and
Forsberg, 2006). It is true that dust has been around since the dawn of time caused by
wind sweeping across the desolate landscape.
This type of dust is scientifically described as particular matter. This is
airborne debris that can adversely affect the health of people and the environment.
The most common particulate matter is smaller than 10 micron in diameter and is
called PM10. The second most common is PM2.5. This is debris that is smaller than
2.5 microns in diameter.
2.1.1 Road dust
Road dust has been acknowledged as a dominant source of PM1O (Segerstedt
and Forsberg, 2006). Particles are also formed in the mechanical processes in the
tire-road interface, brakes, and engine, but vehicles affect the concentrations of

b
ambient airborne particles through exhaust emissions. Cadmium contaminations in
the process of vulcanization were reported that the cadmium level in car tires is in the
range of 20 to 90 .tg/g (Yu et al., 2003). The emissions from vehicular traffic,
heating systems, building deterioration, construction and renovation, corrosion of
galvanized metal structures, sinking particles in air and etc. contribute directly to the
road dust load (Howari et al., 2004; Al-Khashman, 2004). Particles deposited on or
in the surrounding area of the road may be entering into air through vehicle-induced
turbulence and shearing stress of the tires. A commonly used term for these particles
is 'road dust'.
The quantity of dust that is produced by unpaved roads is five times greater
than two other contributors, which are construction activities and wind erosion. Not
only is dust from these roads a trouble, but they have been cited in many cases of
respiratory illness for humans that live near areas in need of road dust control.
A study was conducted in the state of Iowa (Morgan, 2005) to see exactly
how much an unpaved road without road dust control and associated traffic would
cause particulate air pollution. The results showed that for every vehicle that travels
over an unpaved road for one mile, one ton of dust is created annually. This is
interpreted as for every 500 trucks or cars that travel over 100 miles of these roads
that 50,000 tons of dust is thrown up into the surrounding air every year. This also
means that for every mile of unpaved road lacking road dust control, that a ton of
material from that road is removed every year for every automobile that travels on it.
Without the help of wind, this nuisance dust can travel up to 500 feet from the road
into the air. Not only is this affecting the inhabitants near a busy unpaved road, but
this dust also negatively impacts the growth of plant life. Besides that, study by
Chong (1986) showed that stainless steel and alloy steel contain Fe, Cr, Co, Al and
Cu. Exhaust emission from both gasoline and diesel fueled vehicles contain variable
quantities of these elements
I
2.2 Heavy metals
Metals are defined chemically as "elements which conduct electricity, have a
metallic luster, are malleable and ductile, form cations, and have basic oxides"
(Atkins and Jones, 1997). The term heavy metal refers to any metallic chemical
element that has a relatively high density and is toxic or poisonous at low
concentrations. Examples of heavy metals include mercury (Hg), cadmium (Cd),
arsenic (As), chromium (Cr), thallium (TI), and lead (Pb).
Heavy metal is a general collective term which applies to the group of metals
and metalloids with an atomic density greater than 4 g/cm3 (Duffus, 2002). Although
it is a loosely defined term, it is widely recognized and usually applies to the
common contaminants of terrestrial and freshwater ecosystems. Heavy metals are
elements which occur naturally in the Earth's crust. They are therefore found
naturally in soils and rocks with a following range of natural background
concentrations in soils, sediments, waters and organisms. Anthropogenic releases can
give rise to higher concentrations of the metals relative to the normal background
values. The heavy metals which are included in air pollution information system
(APIS) are cadmium, chromium, copper, mercury, lead, zinc, arsenic, boron and the
platinum group metals, which comprises Platinum, Palladium, Rhodium, Ruthenium,
Osmium, and Iridium.
2.2.1 Sources of heavy metal in environment
Although heavy metals differ in their chemical properties, they are used
widely in electronic components, machinery and materials. Two main sources of
road dust, and consequently of the heavy metals found therein, are deposition of
previously suspended particles (atmospheric aerosols) and displaced soil (Ferreira
and DeMiguel, 2005). Consequently, they are emitted to the environment from a
variety of antlwopogenic sources to supplement natural background geochemical
sources. Some of the oldest cases of environmental pollution in the world were
caused by heavy metal extraction and use, for example, copper, mercury and lead
mining, and smelting.

The amounts of most heavy metals deposited to the surface of the Earth are
many times greater than depositions from natural background sources. Combustion
processes are the most important sources of heavy metals, particularly, power
generation, smelting, incineration and the internal combustion engine (Battarbee et al
1988; Duce et al. 1991; Galloway et al. 1982; Hutton & Symon 1986; Nriagu 1989;
Nriagu & Pacyna 1988).
--
Figure 2.1: The sources of heavy metal
Many heavy metals become bound to the surface of soil and roadside dust.
Elevated emissions and their depositions over time can lead to anomalous
enrichment, causing metal contamination of the surface environment (Pagotto et al.,
2001; Sabiha et al., 2009). The sources of heavy metal are shown in figure 2.1.

2.2.2 Health Effect of heavy metal
Heavy metals are natural components of the Earth's crust. They cannot be
degraded or destroyed. To a small extent they enter our bodies via food, drinking
water and air. As trace elements, some heavy metals (e.g. copper, selenium, zinc) are
essential to maintain the metabolism of the human body. However, at higher
concentrations they can lead to poisoning. Heavy metal poisoning could result, for
instance, from drinking-water contamination, high ambient air concentrations near
emission sources, or intake via the food chain. Heavy metals accumulate in
organisms as a result of direct uptake from the surroundings across the body wall.
Uptake via food is most important in terrestrial organisms and it may also be
important in the aquatic environment. Dietary uptake can include heavy metals
adsorbed on particulates present on the surface of leaves etc, which have not been
absorbed by the plant.
Heavy metals are dangerous because they tend to bioaccumulate. It means an
increase in the concentration of a chemical in a biological organism over time,
compared to the chemical's concentration in the environment. Compounds
accumulate in living things any time they are taken up and stored faster than they are
broken down (metabolized). The free ion is generally the most bioavailable form of a
metal, and the free ion concentration if often the best indicator of toxicity. However,
there are exceptions, such as the well known case of mercury, where the organic
form, (methylmercury) is more toxic than the inorganic ion. Metals apply toxic
effects if they enter into biochemical reactions in the organism and typical responses
are inhibition of growth, suppression of oxygen consumption and destruction of
reproduction and tissue repair.
Metal contamination in street dust has a high vulnerability of causing cough
in both children and adults during inhalation. Inhalation of siliceous dust causes
siliceous disease of the lungs (Leke, 1999). Besides, chromium and its compounds
are known to cause cancer of the lungs, nasal cavity and para nasal sinus and
suspected to cause cancer of the stomach and larynx (ATSDR, 2000).

'U
2.3 Spectroscopy
Spectroscopy is the use of the absorption, emission, or scattering of
electromagnetic radiation by matter to qualitatively or quantitatively study the matter
or to study physical processes. The matter can be atoms, molecules, atomic or
molecular ions, or solids. The interaction of radiation with matter can cause
redirection of the radiation and/or transitions between the energy levels of the atoms
or molecules. The technique is as below:
• Absorption: A transition from a lower level to a higher level with transfer of
energy from the radiation field to an absorber, atom, molecule, or solid.
• Emission: A transition from a higher level to a lower level with transfer of
energy from the emitter to the radiation field. If no radiation is emitted, the
transition from higher to lower energy levels is called nonradioactive decay.
• Scattering: Redirection of light due to its interaction with matter. Scattering
might or might not occur with a transfer of energy, i.e., the scattered radiation
might or might not have a slightly different wavelength compared to the light
incident on the sample.
2.3.1 Atomic Absorption Spectroscopy (AAS)
Atomic-absorption spectroscopy (AAS) uses the absorption of light to
measure the concentration of gas-phase atoms. Since samples are usually liquids or
solids, the analyte atoms or ions must be vaporized in a flame or graphite furnace.
The atoms absorb ultraviolet or visible light and make transitions to higher electronic
energy levels. The analyte concentration is determined from the amount of
absorption. Applying the Beer-Lambert law directly in AAS is difficult due to
variations in the atomization efficiency from the sample matrix, and nonuniformity
of concentration and path length of analyte atoms (in graphite furnace AAS).
Concentration measurements are usually determined from a working curve after
calibrating the instrument with standards of known concentration. Figure 2.2 shows
the schematic diagram of atomic absorption spectroscopy (AAS).

lens lens detector
monochromator hollow atomized
cathode lamp samplereadout I-Famplifier
Figure 2.2: Schematic diagram of atomic absorption spectroscopy (AAS)
2.3.1a Light source
The light source is usually a hollow-cathode lamp of the element that is being
measured. Lasers are also used in research instruments. Since lasers are intense
enough to excite atoms to higher energy levels, they allow AAS and atomic
fluorescence measurements in a single instrument. The disadvantage of these narrow-
band light sources is that only one element is measurable at a time.
2.3.1b Atomizer
AAS requires that the analyte atoms be in the gas phase. Ions or atoms in a
sample must undergo desolvation and vaporization in a high-temperature source such
as a flame or graphite furnace. Flame AAS can only analyze solutions, while graphite
furnace can accept solutions, slurries, or solid samples.
Flame AAS uses a slot type burner to increase the path length, and therefore to
increase the total absorbance (Beer-Lambert law). Sample solutions are usually
aspirated with the gas flow into a nebulizing/mixing chamber to form small droplets
before entering the flame.
The graphite furnace has several advantages over a flame. It is a much more efficient
atomizer than a flame and it can directly accept very small absolute quantities of
sample. It also provides a reducing environment for easily oxidized elements.
Samples are placed directly in the graphite furnace and the furnace is electrically
heated in several steps to dry the sample, ash organic matter, and vaporize the
analyte atoms.
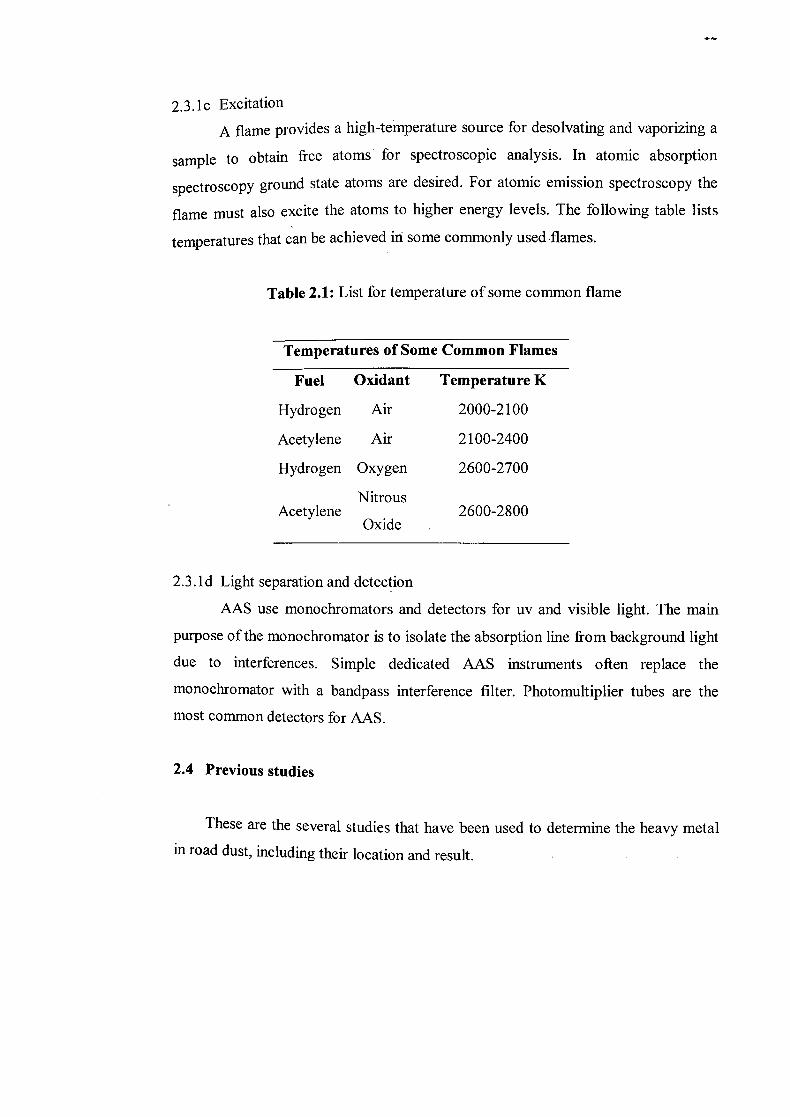
2.3.1c Excitation
A flame provides a high-temperature source for desolvating and vaporizing a
sample to obtain free atoms for spectroscopic analysis. In atomic absorption
spectroscopy ground state atoms are desired. For atomic emission spectroscopy the
flame must also excite the atoms to higher energy levels. The following table lists
temperatures that can be achieved in some commonly used flames.
Table 2.1: List for temperature of some common flame
Temperatures of Some Common Flames
Fuel Oxidant Temperature K
Hydrogen Air 2000-2100
Acetylene Air 2100-2400
Hydrogen Oxygen 2600-2700
Nitrous Acetylene 2600-2800
Oxide
2.3.1d Light separation and detection
AAS use monochromators and detectors for uv and visible light. The main
purpose of the monochromator is to isolate the absorption line from background light
due to interferences. Simple dedicated AAS instruments often replace the
monochiomator with a bandpass interference filter. Photomultiplier tubes are the
most common detectors for AAS.
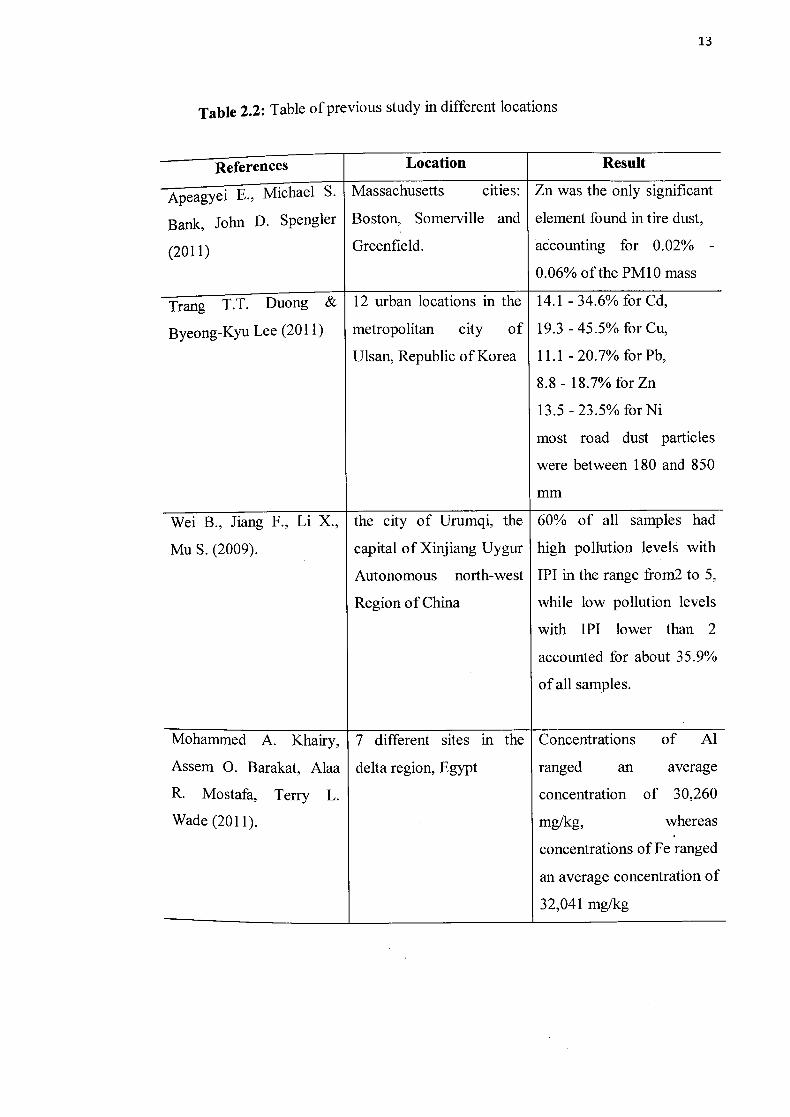
2.4 Previous studies
These are the several studies that have been used to determine the heavy metal
in road dust, including their location and result.
13
Table 2.2: Table of previous study in different locations
- References Location Result
Apeagyei E., Michael S. Massachusetts cities: Zn was the only significant
Bank, John D. Spengler Boston, Somerville and element found in tire dust,
(2011) Greenfield. accounting for 0.02% -
0.06% of the PM1O mass
TrangT.T. DuOng& 12 urban locations in the 14.1 - 34.6% for Cd,
Byeong-KyU Lee (2011) metropolitan city of 19.3 - 45.5% for Cu,
Ulsan, Republic of Korea 11.1 - 20.7% for Pb,
8.8 - 18.7% for Zn
13.5 -23.5% forNi
most road dust particles
were between 180 and 850
mm
Wei B., Jiang F., Li X., the city of Urumqi, the 60% of all samples had
Mu S. (2009). capital of Xinjiang Uygur high pollution levels with
Autonomous north-west IPI in the range from2 to 5,
Region of China while low pollution levels
with IPI lower than 2
accounted for about 35.9%
of all samples.
Mohammed A. Khairy, 7 different sites in the Concentrations of Al
Assem 0. Barakat, Alaa delta region, Egypt ranged an average
R. Mostafa, Terry L. concentration of 30,260
Wade (2011). mg/kg, whereas
concentrations of Fe ranged
an average concentration of
32,041 mg/kg

14
Cumulative frequency distribution graphs showed distribution of Fe, Ba, Cu,
and Mo were similar regardless of road traffic rating. However, Zn, Ti, and Zr varied
significantly (p < 0.05) with traffic ratings of roadways (heavy > moderate > low
traffic). Fe, Ba, Cu, and Mo also had similar distributions regardless of road class
while composition of Zn, Ti, and Zr varied significantly across road class (p < 0.05)
(Major roads> Minor roads > highway). In comparing urban road dust to rural road
dust (Apeagyei, 2011). The concentrations of heavy metals in the road dust from the
circulation roads were dependent upon their traffic volume, vehicle speeds and the
surrounding environment which may have included industrial emissions. The lowest
heavy metal concentrations among the different rotary areas were identified in the
samples from the riverside rotary which had high atmospheric dispersion of dust to
the riverside and air dilution by winds from the riverside (Trang, 2011).
Most of the road dust samples were in low levels of pollution in the new
urban area and city side. Moreover, the areas closed to manufactories were also in
high levels of pollution. These trends can be attributed to urbanization, distribution
of industrial areas and commercial areas. The integrated pollution index (IPI) is
defined as the mean value of the pollution index (P1) of an element. It is classified as:
IPI1 low level of pollution; 1bIPI2 middle level of pollution; IPIN2 high level of
pollution. Extremely high pollution levels with IPI higher than 5. These road dust
sample sites with extremely high pollution levels were all located in the areas closed
to manufactories such as petrochemical factory, power plant, tire manufacturing
plant, cement plant, textile mill or others (Wei, 2009).
High concentrations of trace metals were observed in the road dust samples
from Delta region, Egypt, which were higher than concentrations recorded
worldwide in major developed cities for most of the investigated metals. The output
of the PCA revealed that Al, Fe, Be and Mn are produced from natural sources and
that all the other metals were produced from anthropogenic activities such as
industrial, construction and traffic emissions. Road dust samples were found to be
heavily to extremely contaminate with Cd, Pb, Sri and Zn when compared to the
background values reflecting the influence of the traffic and industrial activities on
alteration of the atmospheric quality of the Delta region (Mohammed, 2011).

Tamn Imbi
13
/ T.iri 1/ In
k4"
CHAPTER 3
METHODOLOGY
3.1 Sampling locations
Several sites were selected for the study along the major roads from gambang
to kuantan. Several replicate samples were collected from the sampling sites as
shown in Figure 1. It shows the major roads. Street dust samples were taken from bus
terminal, airport, industrial area, residential areas and agricultural area.
(I
f 1' S'fd fl
Whkota "P
Fti Siq Br.ir IIdcn
PncPnç c•tI1 I, / .
C.tdemwn'h ro^
A
AV
! t 4 .St pi
TA Perkampunpo e • • •' cIflN ;IJfl --
Krnpung
GadGllda^q Rasa
Kampung
78B '̂Iatu Lapjn Tam.6 Seri
h
Perkampunpn
<Ir prn
KuIa
01 1rAJ09, Rhi 8onkàk
Knmpung Krnpvng, Stma Ow
Kampungsi"1
Figure 3.1: The road from gambang to kuantan
Recommended


![NUCL 1 [512295]: Determination of heavy metals and …prosper.cofc.edu/~nuclear/2002Orlando223Abstracts.pdfNUCL 1 [512295]: Determination of heavy metals and their leaching characteristics](https://img.dokumen.tips/doc/110x75/5b2ba5ac7f8b9a594c8b7390/nucl-1-512295-determination-of-heavy-metals-and-nuclear2002orlando223abstractspdfnucl.jpg)