1
Designing the State for Essentially Digital Governance and the Era of Big Data
Helen Margetts*, Scott Hale*
Patrick Dunleavy+, Jane Tinkler+
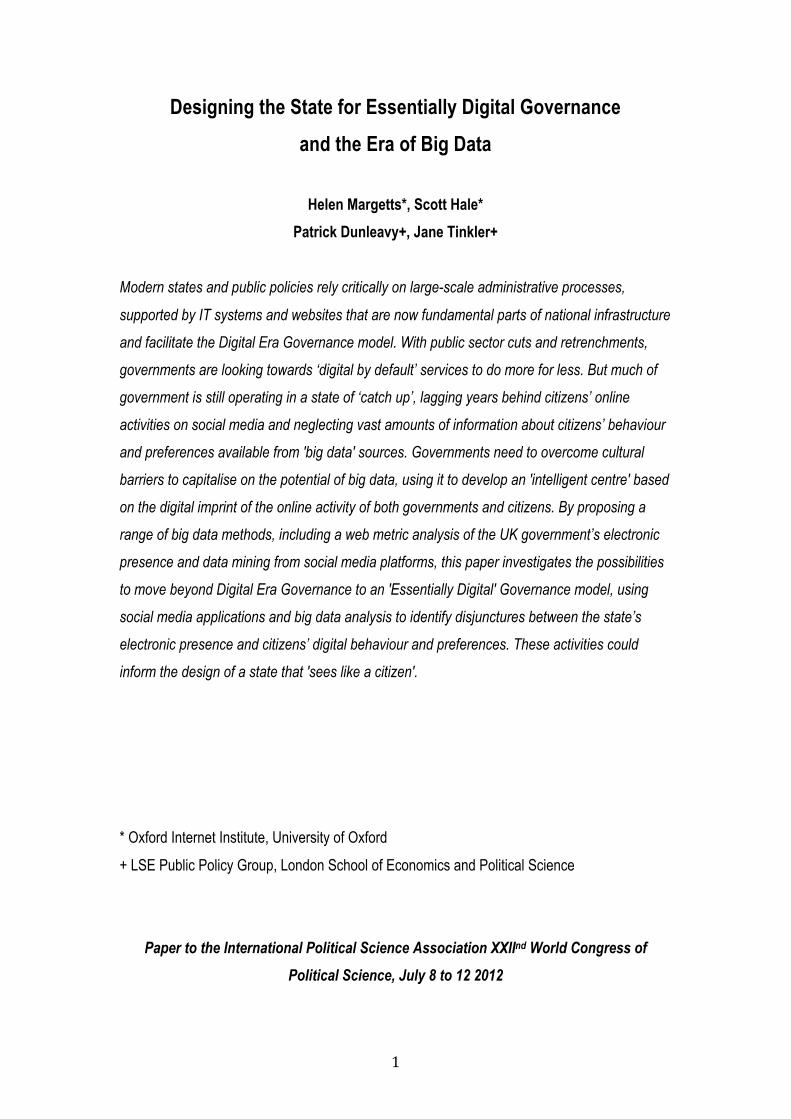
Modern states and public policies rely critically on large-scale administrative processes,
supported by IT systems and websites that are now fundamental parts of national infrastructure
and facilitate the Digital Era Governance model. With public sector cuts and retrenchments,
governments are looking towards ‘digital by default’ services to do more for less. But much of
government is still operating in a state of ‘catch up’, lagging years behind citizens’ online
activities on social media and neglecting vast amounts of information about citizens’ behaviour
and preferences available from 'big data' sources. Governments need to overcome cultural
barriers to capitalise on the potential of big data, using it to develop an 'intelligent centre' based
on the digital imprint of the online activity of both governments and citizens. By proposing a
range of big data methods, including a web metric analysis of the UK government’s electronic
presence and data mining from social media platforms, this paper investigates the possibilities
to move beyond Digital Era Governance to an 'Essentially Digital' Governance model, using
social media applications and big data analysis to identify disjunctures between the state’s
electronic presence and citizens’ digital behaviour and preferences. These activities could
inform the design of a state that 'sees like a citizen'.
* Oxford Internet Institute, University of Oxford
+ LSE Public Policy Group, London School of Economics and Political Science
Paper to the International Political Science Association XXIInd World Congress of Political Science, July 8 to 12 2012
2
Designing the State for Essentially Digital Governance and the Era of Big Data
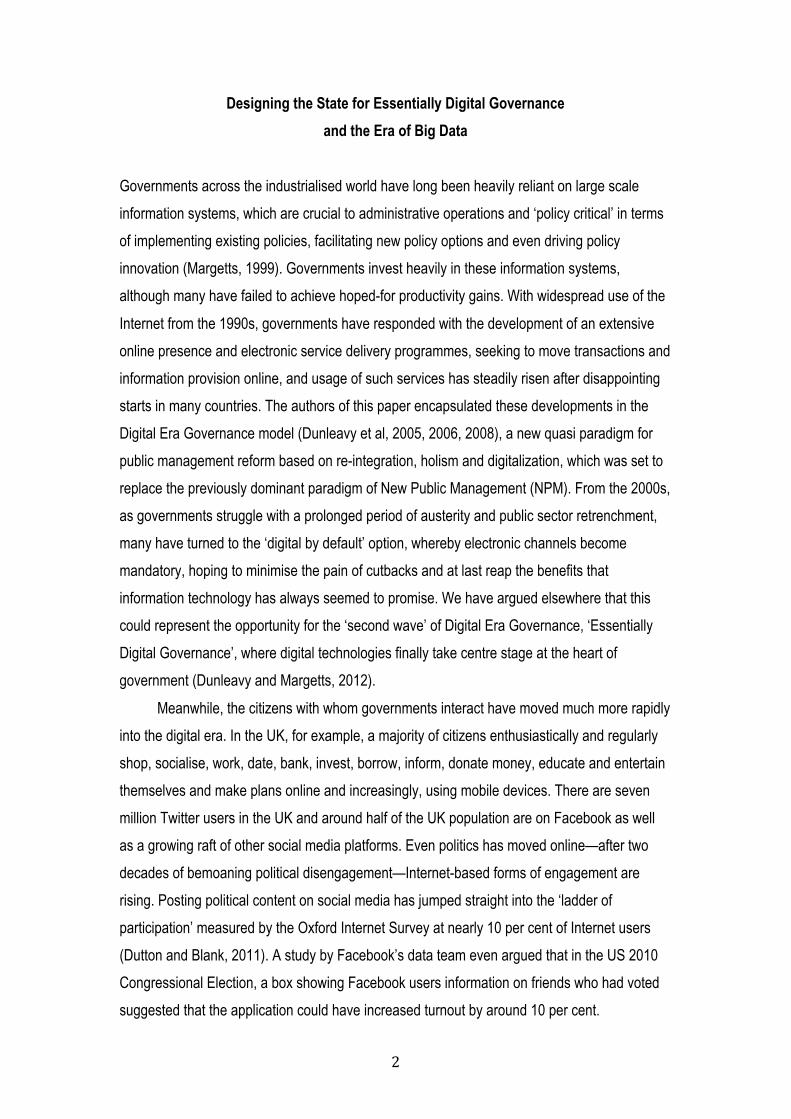
Governments across the industrialised world have long been heavily reliant on large scale
information systems, which are crucial to administrative operations and ‘policy critical’ in terms
of implementing existing policies, facilitating new policy options and even driving policy
innovation (Margetts, 1999). Governments invest heavily in these information systems,
although many have failed to achieve hoped-for productivity gains. With widespread use of the
Internet from the 1990s, governments have responded with the development of an extensive
online presence and electronic service delivery programmes, seeking to move transactions and
information provision online, and usage of such services has steadily risen after disappointing
starts in many countries. The authors of this paper encapsulated these developments in the
Digital Era Governance model (Dunleavy et al, 2005, 2006, 2008), a new quasi paradigm for
public management reform based on re-integration, holism and digitalization, which was set to
replace the previously dominant paradigm of New Public Management (NPM). From the 2000s,
as governments struggle with a prolonged period of austerity and public sector retrenchment,
many have turned to the ‘digital by default’ option, whereby electronic channels become
mandatory, hoping to minimise the pain of cutbacks and at last reap the benefits that
information technology has always seemed to promise. We have argued elsewhere that this
could represent the opportunity for the ‘second wave’ of Digital Era Governance, ‘Essentially
Digital Governance’, where digital technologies finally take centre stage at the heart of
government (Dunleavy and Margetts, 2012).
Meanwhile, the citizens with whom governments interact have moved much more rapidly
into the digital era. In the UK, for example, a majority of citizens enthusiastically and regularly
shop, socialise, work, date, bank, invest, borrow, inform, donate money, educate and entertain
themselves and make plans online and increasingly, using mobile devices. There are seven
million Twitter users in the UK and around half of the UK population are on Facebook as well
as a growing raft of other social media platforms. Even politics has moved online—after two
decades of bemoaning political disengagement—Internet-based forms of engagement are
rising. Posting political content on social media has jumped straight into the ‘ladder of
participation’ measured by the Oxford Internet Survey at nearly 10 per cent of Internet users
(Dutton and Blank, 2011). A study by Facebook’s data team even argued that in the US 2010
Congressional Election, a box showing Facebook users information on friends who had voted
suggested that the application could have increased turnout by around 10 per cent.
3
So, what could be done to match these online citizens up with their online governments,
so that citizens get what they want and expect from government, and government gets the cost
savings and efficiency gains it has hoped for from Digital by Default? This paper investigates
this question from both perspectives. First, it looks at the current status of Digital Era
Governance, and investigates ways that political science researchers—and government—
might use web metric and visualization tools to understand the nature and structure of
government online, putting forward a tool for visualizing government online, which will be
demonstrated during the presentation of this paper. Second, it discusses new ways that we can
understand citizen activity online, using so-called ‘big data’ derived from the Internet. Third, it
discusses how these two data sources might feed into each other, so that government and
services are better matched to citizens’ needs, preferences and behaviour in the digital era.
Digital Era Governance We have written elsewhere of how digital changes made feasibly by Internet and web-based
technologies are increasingly vital to executive government operations in all advanced
industrial states, albeit with a ‘culture lag’ compared with business and civil society (Dunleavy,
Margetts et al, 2005, 2006). To encapsulate this shift, we proposed the Digital Era Governance
(DEG) model as a ‘quasi-paradigm’ for public management reform, which was set to replace
the previously dominant New Public Management (NPM), the cohort of changes aimed at
injecting managerialism and private sector practice into the public sector that became popular
across governments of industrialised nations from the 1980s onwards. DEG is based on three
macro-themes of reintegration, needs-based holism and digitalization. Reintegration involves
organizational and budgetary shifts towards reversing the fragmentation resulting from New
Public Management (NPM) years in many states, joining up, de-siloing and simplifying public
sector processes. Holism involves creating client-focused structures and end-to-end redesign
of services from a client perspective. Digitalization involves the adaptation of the public sector
to completely embrace and embed electronic delivery at the heart of the government business
model. More recently, we have argued that with widespread use of social media and web-
based platforms that rely on user generated content, all three of these themes have the
potential to accelerate in a ‘second wave’ of DEG, resulting in an ‘Essentially Digital’ form of
Governance (Dunleavy and Margetts, 2010, 2012).
Digital Era Governance is an ideal type or ‘quasi-paradigm’. There is nothing inevitable
about the processes of reintegration, holism and digitalization that make up the model and we
outlined a number of scenarios as to how DEG might (or might not) develop in governments
4
that do not prioritise these main themes, or revert to the New Public Management as a model
for reform (see Dunleavy and Margetts, 2000). In the very early phases of computerization in
the 1950s and 1960s, governments in developed nations were innovators, leading the way in
developing systems well suited to governmental administration of the time (charted in Margetts,
1999). From that time onwards, governments in most industrialized nations made large
investments in information technology, typically around 1 per cent of GDP. Progressively over
the 1980s and 1990s, markets of computer services providers to government developed, so
that most governments were involved in a number of important contract relationships with both
global and domestic companies, although in very different ways in different countries (see
Dunleavy, Margetts et al, 2006 for a discussion of these developments). During this period,
many governments fell behind the private sector in the extent to which their information
systems were modern, effective, and competitively costed. In the UK in particular, the history of
government IT is littered with high profile disasters, troubled contractual partnerships, spiralling
costs and major losses of personal data (Margetts, 1999; Dunleavy, Margetts et al, 2006;
Public Administration Committee, 2011). With the Internet and particularly the social web, the
gap between government and other sectors widened: citizens and companies were innovating
with new technologies much faster than states could respond. Although there are examples of
the spread of rich media and social web technologies into the public sector in smaller countries,
particularly in Scandinavia, this development remains muted in bigger states, and is vulnerable
to austerity pressures. Although all OECD countries expound ‘digital economy’ strategies for
fast broadband and increased skills development, the intra-government component has mostly
attracted insufficient attention so far, outside of a few countries such as South Korea. The
widespread use of the Internet and social media put pressure on government organizations to
innovate in catch-up mode and modernize their dealings with citizens. The widening gulf in
‘look and feel’ for public websites compared to business best practice has led to concerns for
the increasing societal marginalization of the public sector online estate and declining
government ‘nodality’ (Hood and Margetts, 2007, Escher et al, 2006).
Meanwhile, in the aftermath of the financial crisis from 2008 onwards, many
governments started to look to digital technologies as a way to deal with a period of public
sector cuts and retrenchment and to do ‘more for less’. The DEG model predicted three
possible scenarios for a period of austerity; a systematic revival of NPM approaches, and
abandonment for the DEG; an austerity squeeze beginning a pause of DEG change that could
lead to a permanent lag in the organization of public services; and a short-lived austerity pause
where digital technologies are used to meet the need to continuously boost government
5
productivity (Dunleavy and Margetts, 2012). So far, there is some evidence for the third
scenario in a number of countries. In the UK, the incoming coalition government in the UK from
2010 introduced a ‘Digital by Default’ programme in which all government services are to be
concentrated in a single portal and through which, it has been argued, shifting 30 per cent of
government service delivery contracts to digital channels could deliver annual savings of £1.3
billion. The programme includes the aim of making digital channels the preferred option of both
government and citizens and the so-called ‘G-cloud’ will lead to new ways of joining up
digitalization across departments. In Canada, as part of a systematic programme of public
sector cuts in support of a deficit reduction plan that includes the elimination of some 19,000
federal public service jobs, the federal government have turned to ‘Shared Services’, a new
agency mandated to streamline information technology across the whole of government by
centralizing functions that are at present under the control of over 40 departments and
agencies, with planned savings rising from $75 million in 2013 to $150 million in 2015, although
Shared Services is estimated to cost $1.5 billion in its first year of implementation. So although
in the UK at least there have been some moves to slash IT spending, with a moratorium on all
projects over £100 million, levels of IT expenditure have continued to rise and it seems that
austerity has also brought moves in a DEG rather than an NPM direction; indeed, the UK
Cabinet Secretary Francis Maude observed at the Government Digital Service in April 2012
that ‘the deficit is our friend’ when it comes to pursuing a ‘digital by default’ agenda1.
The current state of Digital Era Governance So what does ‘Digital Era Governance’ look like, and what can it tell us about the nature
and structure of government? During their first fifty years, the information systems making up
the backbone of government administration were largely invisible. In the largest departments,
multiple projects and tranches of system improvements and releases, overlaid with interfaces
and new systems led to the operation of complex networks of systems in what a US official
described to one of the authors as a ‘rats’ nest of logic’ (Margetts, 1999). Multiple layers of
contract relationships further complicates the picture within many governments, with markets of
computer services providers involved in multiple prime and sub-prime contractor relationships
across departments and agencies. This complex array of systems and providing organizations
was largely hidden to most citizens until the advent of the Internet, and any attempt to depict
them graphically was opaque to even the most ardent of public administration specialists. With
1 First meeting of the Advisory Board of the Government Digital Service, 25th
6
the Internet, however, so-called ‘electronic government’ finally developed a visible component,
far more accessible to the majority of UK citizens than a building. By the mid-2000s citizens
with Internet access could easily ‘see’ what government looks like online, can search for
specific information and services, undertake transactions, contact representatives and even, if
interested, can find what policies are in force and what legislation is being considered, all from
their own home. By 2010, as discussed below, many governments embarked upon ‘open
data’ and transparency initiatives allowing citizens to scrutinize government spending and
comment on policy initiatives.
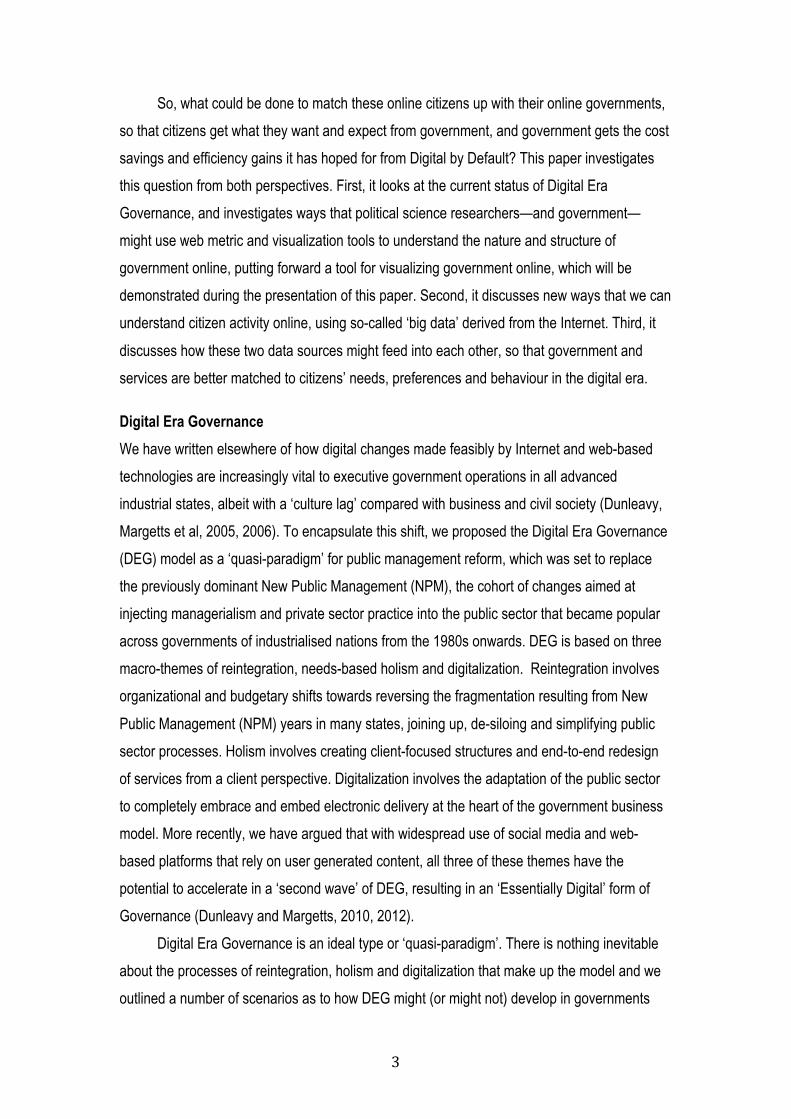
Thus Internet-based government offers new opportunities for researchers and scholars
of government to understand what it looks like. By crawling the web and mapping the patterns
of inlinks and outlinks and links between sites, researchers can now produce visualizations of
what government looks like online. Figure 1 shows the result of a webcrawl of the UK central
government, carried out in November 2011, showing both single and reciprocal links between
departments. Because the visualization is developed as an interactive tool, it is not possible to
demonstrate in its full glory in this paper, so only the perspective from the point of view of one
department—the Foreign and Commonwealth office is shown.
Figure 1. UK Government on the Internet shown from the perspective of the Foreign and Commonwealth Office
7
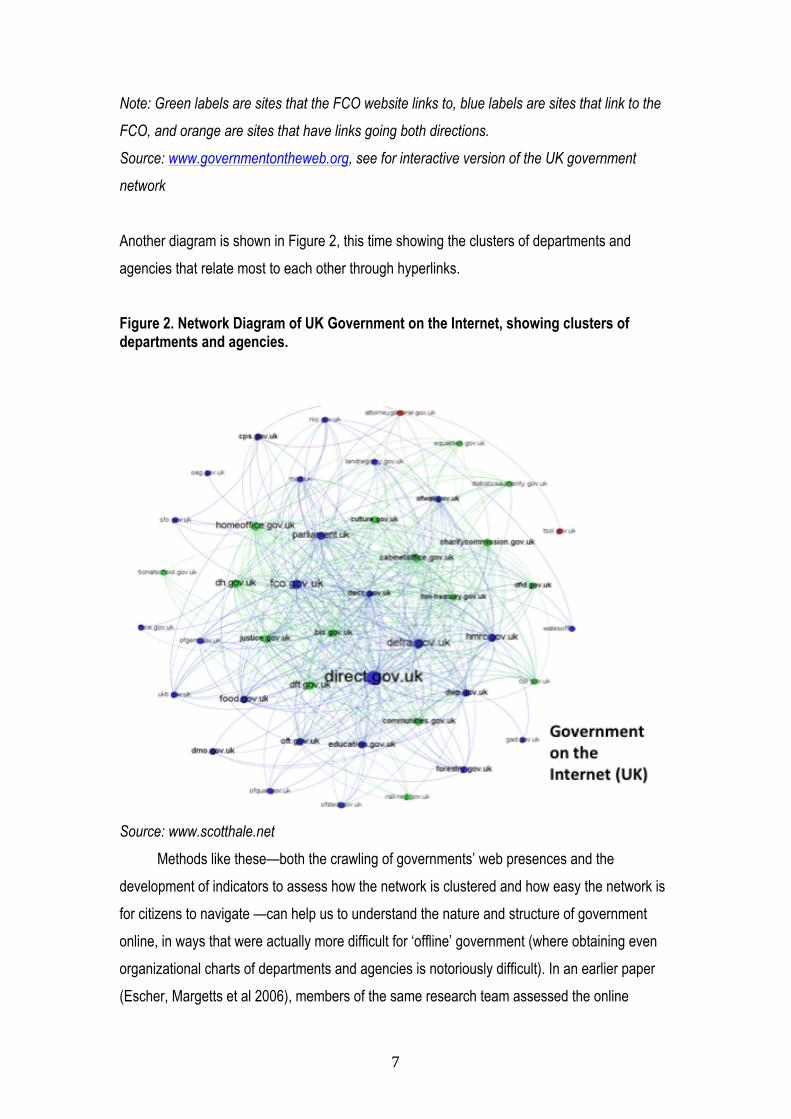
Note: Green labels are sites that the FCO website links to, blue labels are sites that link to the
FCO, and orange are sites that have links going both directions.
Source: www.governmentontheweb.org, see for interactive version of the UK government
network
Another diagram is shown in Figure 2, this time showing the clusters of departments and
agencies that relate most to each other through hyperlinks.
Figure 2. Network Diagram of UK Government on the Internet, showing clusters of departments and agencies.
Source: www.scotthale.net
Methods like these—both the crawling of governments’ web presences and the
development of indicators to assess how the network is clustered and how easy the network is
for citizens to navigate —can help us to understand the nature and structure of government
online, in ways that were actually more difficult for ‘offline’ government (where obtaining even
organizational charts of departments and agencies is notoriously difficult). In an earlier paper
(Escher, Margetts et al 2006), members of the same research team assessed the online
8
presence of three foreign affairs departments in different governments along the criteria of
visibility, outward-lookingness, navigability, accessibility and competition, arguing that the
combination of these criteria could provide an assessment of ‘nodality’, a key tool in
government’s policy toolkit (Hood and Margetts, 2007). Similarly Dunleavy and Margetts (2007)
involved assessing UK central government departments along the dimensions of visibility,
navigability and outwardlookingness, as well as measuring the size of government’s electronic
presence. The work reported above will build on this earlier work by carrying out and
visualizing web crawls and measuring these criteria for seven case study governments in a
new programme of research into the relationship between governance and the internet both
across countries and over time. 2
Online Citizens and Big Data Just as governments have moved online, so have citizens. As noted in the first section, large
tranches of economic, social and political life now take place on the Internet, via a wide range
of increasingly ‘rich’ social media. The digital imprint left behind all this digital activity can be
mined from the Internet to generate large-scale data sets, which make it easier to design
government and services that are matched to citizens’ preferences and behaviour. This is ‘big
data’, a new sort of data for the social sciences—not survey data that tells us what people think
they might do, or think they did—but real-time transactional data about what they really did or
really think. This is data of the kind more habitually available to scientists; that is, it is not based
on a sample, but could allow us to understand the social dynamics of entire populations. Of
course, it also presents challenges to social science research; it has no demographics
attached, we do not know where people came from or where they are going and it is huge;
social scientists must get used (like scientists) to the idea of having ‘too much’ data, rather than
the usual problems of worrying about sample sizes and ‘small numbers’ problems. For
example, Loubser (2010) downloaded the entire edit history of the English edition of Wikipedia
(6 terrabytes at the time), furthering understanding of how the governance arrangements for
Wikipedia are working in practice—and how they might work better in the future. Gonzalez-
Bailon, et al (2011) downloaded half a million tweets to map the structures of networks of
demonstrators in the protests against government in Spain during 2011, finding that rather than
a core of activists as in traditional interest groups—those who ‘seed’ the recruitment process
are scattered all over the network. Analysis of an archive of the UK government domain over
15 years (40 terrabytes of compressed data) currently taking place at the Oxford Internet
2 See www.governmentontheweb.org

9
Institute will allow us to use the methods outlined above to map the changing structure of
‘government on the Internet’ over time: a task that has never before been attempted. Big data
ushers in a new kind of social science which could prove increasingly important for policy and
public service design.
Figure 3. Petitions submitted to No. 10 Downing St ‘e-petitions’ site, 2009-10
As an example of ‘big data’, Figure 3 shows what citizens on the Internet, engaging with
the UK state look like. This graph maps the joining curve of 8,326 petitions to the No. 10
Downing Street web site during 2009-10. This site—and the one that followed it—allowed any
citizen to submit a petition and to use whatever they like, such as social media—to gather
signatories. The No. 10 Petitions website ran from 2006 to 2010, and was perhaps the largest
non-partisan democracy site by volume of users ever, with over 8 million signatures from over
5 million unique email addresses, 10 per cent of the entire UK population. One of the petitions
to the site—against government’s road pricing policy—gathered 1.8 signatures and was a clear
factor in the government’s eventual decision to abandon the policy. Petitioning is one of the
most frequently undertaken participatory acts apart from voting (about 20 per cent of the UK
public according to the Oxford Internet Survey). This data was automatically generated by
scraping the site every day, gathering the number of signatures so that we can plot daily
10
change. Because it is not fine grained enough to analyse what turn out to be the critical first
days of a petition, we are now gathering data from the site’s successor hourly.
Interpretation of data like this is challenging. Hale and Margetts (2012) analysed the rate
of growth in petition signatures per day and tested the hypothesis that the distribution of daily
change will be leptokurtic (rather than normal) as previous research on agenda setting would
suggest. This hypothesis was confirmed, suggesting that Internet-based mobilization is
characterized by tipping points (or punctuated equilibria) and explaining some of the volatility in
online collective action. The findings also show that most successful petitions grow quickly and
that the number of signatures a petition receives on its first day is the most significant factor
explaining the overall number of signatures a petition receives during its lifetime. These
findings could have implications for the strategies of those initiating petitions and the design of
web sites with the aim of maximising citizen engagement with policy issues.
The private sector is already using this kind of data. A recent McKinsey report argues
that a retailer using big data to the full could increase its operating margin by more than 60 per
cent and that governments across Europe stood to gain 150 billion euros in administrative cost
savings from the use of big data (although the methodology for costing this out is rather
unclear) (Manyika et al, 2011). Transactional data in digital form provide more accurate and
detailed performance information—exposing variability and boosting performance; they allow
controlled experiments to make better management decisions; basic low-frequency forecasting
to high-frequency “nowcasting” to adjust business levers just in time. Big data allows ever-
narrower segmentation of customers and more precisely tailored products or services.
Sophisticated analytics can substantially improve decision-making and allow preventive
measures that take place before failure occurs or is noticed or at the very least before
problems escalate—Netflix, for example, monitors data in social media platforms among other
sources as an indicator of the quality of its content delivery network (Augustine, et al 2012). US
banks such as Citi, SunTrust, First Tennessee and ING Direct use ‘conversations’ on social
media to understand how they are perceived in terms of customer service, monitor reactions to
updates on their account management and to identify which new products their customers love
or hate. According to the burgeoning array of company reports on big data, the use of big data
will become a key basis of competition and growth for individual firms. Obviously, there are
many issues that will have to be addressed in a big data world; privacy, security, intellectual
property, and even liability take on new dimensions, as well as identifying the talent and
technology to analyse large-scale data and structuring workflows and incentives to optimize the

11
use of big data and integrate information from multiple data sources, often from third parties.
But the payoffs for government could indeed make consideration of these issues worthwhile.
Matching government and citizens For the ‘second wave’ of DEG to emerge, future design of governmental arrangements and
policy would involve using the kind of data discussed in the previous section to match digital
government to the needs, preferences and behaviour of digital citizens. This section outlines
two ways of increasing the linkages and feedback loops between the two.
Using Social Media
First, as noted above, government has tended to lag behind citizens in its use of Internet
based technologies in general and social media in particular. Now, citizens are participating
politically in new ways using social media so if governments aim for online engagement with
citizens, they need to reach out to them using the same tools in the same places. They are
starting to try—the newly formed Government Digital Service (GDS) in the UK Cabinet Office
has recently released its guidelines to civil servants for using social media. As the minister for
the Civil Service put it: ‘When civil servants, policy makers and service delivery units alike,
open themselves to dialogue with the public they can glean a much better understanding of the
real needs and concerns of citizens’ (digital.cabinetoffice.gov.uk, 17th May 2012). GDS have a
Digital Engagement Strategy to foster collaboration in policy development and service design
which has included the ‘Spending Challenge’ which attracted 36,000 users and 45,000 ideas
on how the Government could cut public spending and ‘Your Freedom’, a crowd-sourcing
exercise for the Freedom Bill which gained 47,000 users and over 97,000 comments. There
has been some success with social media content from individual public servants and
ministers: recently a Department for International Development (DfID) blogger publicised relief
efforts in Pakistan with pictures of trees in Pakistan covered in cobwebs due to the scale and
persistence of recent flooding, which went viral, attracting over 500,000 views on DfID’s Flickr
channel and were republished in over 50 media outlets internationally.
However, these initiatives face massive cultural resistance in many areas of
government. The informality, the lack of organizational boundaries, the different style, the lack
of control that Internet-based activity engenders (see Margetts and Dunleavy, 2002 for a
discussion) - all these characteristics of Internet-based interaction pose cultural barriers to
government officials anyway and are exacerbated by the development of social media. In
Canada, the Treasury Board Secretariat has also published guidelines on ‘External Use of Web
12
2.0’, but the 18 pages of formal guidelines received much media criticism; most departments
were already using social media - going "rogue" in the absence of formal rules—so, this
reactive move seemed aimed at stopping rather than facilitating greater use of such platforms.
In the UK DWP in 2009, only 0.2 interactions with DWP’s customers (which include a massive
proportion of the UK population) took place electronically, even though 38 per cent of their
customers were enthusiastic about online services (NAO, 2009). At a time when about half of
UK citizens are on Facebook, the direct.gov Facebook page (the biggest node with the most
content on the government map shown in Figure 1) has just 5,500 likes expressed and 525
comments for posts over the last 2 years (if Facebook had a dislike button, of course, it might
be rather higher!). It has 38,000 followers on Twitter (from the 7 million UK Twitter users).
These numbers are very small. It is always going to be a challenge to government to be agile
enough to keep up with what citizens are doing, shifting between platforms such as YouTube,
Facebook, Twitter and Tumbler—all of these came from seemingly nowhere in very short
periods of time, different platforms in different countries at different times.
However, it is no good hoping that citizens are going to go where governments are.
Figure 3 showed people signing petitions, the most frequently undertaken act of political
participation after voting. Petitions are mobilizations, but not social movements or interest
groups—there may be some kind of organizational involvement but in general these are
individual acts of participation, mostly spread virally through social networks—someone posts
the link to the petition on Facebook and it is advertised to their friends, who then might sign and
so on. It is also a particular sort of engagement that takes place outside government and is to
some extent confrontational, rather than collaborative. Other confrontational engagement
includes organized campaigns by online interest groups such as the UK 38 Degrees or the
global Avaaz, which ministers now take very seriously - 38 Degrees is widely credited with
reversing a policy move to privatize forests and to bringing change to (although not successful
in reversing) controversial NHS reforms. More collaborative policy-making would be citizens
providing government with rankings, ratings, feedback, comments, complaints or policy ideas.
Platforms such as Amazon, Trip Advisor, and YouTube run on people’s willingness to do things
like this. And people have proved themselves willing to do these things in a political context, as
noted above; posting political content on a social media site has jumped into the ‘ladder’ of
participation, joint second after petitions (Dutton and Blank, 2011). Real engagement would
involve a kind of co-creation of public services, where citizens enter the front office of
government through online means, as the ‘holistic’ theme of the Digital Era Governance model
suggests. Using social media effectively to reach out to citizens where they are carrying out
13
their lives, as in the smattering of examples starting to emerge above, would be vital to this
kind of collaborative engagement with policy and service delivery. For example, in Spain
Criado (2010: 290-1) notes low usage of and ‘social demand’ for e-services, with 72 per cent of
survey respondents preferring transaction with people in public agencies rather than telephone
or Internet. But Spanish use of social media is reasonably high: of the 26 million Internet users
in Spain, there were in March 2012 16 million users of Facebook, with a penetration of 34 per
cent of the population and 61 per cent of Internet users, and growing rapidly (by 1.4 million
between September 2011 to February 2012)3. So one key to achieving greater engagement
with government’s online presence could be to reach out to this group.
Using Big Data
Second, as noted above, the transfer of social, economic and political life to online
contexts is generating large-scale datasets on citizens’ preferences and behaviour. Another
methodological principal for designing the state in this context is to use this kind of big data in
the same kind of ways that the private sector is already doing. Big data can give government a
much better understanding of citizens' needs for and usage of hospitals and schools, about tax
and social welfare, about initiatives that could—or do—make up civil society or the ‘big’
society—making the most of citizens’ willingness to act collectively and engage with
government. Large scale datasets on public services can highlight problems: mortality rates
can reveal failing organizational units or individual professionals, for example. Big data can be
used to match policy to preferences, match services to what citizens are willing—and are not
willing—to do, in terms of managing their own affairs, for example, as they do with their bank
accounts. It gives information about riots, demonstrations, protest and unrest. Research shows
how online mobilizations are likely to be more volatile, with possible flash mobilizations or
tipping points—those that succeed grow exponentially and rapidly in unpredictable ways. As
noted above, governments can struggle to 'catch up' with citizens using and switching between
increasing arrays of social media platforms (from Facebook to Twitter to Tumblr to Pinterest
and beyond)—different in different countries. Autocratic regimes have fallen into disarray
amidst the demonstrations, mobilizations, riots and generalized unrest of the Arab Spring. In
democratic regimes, the financial crash and crisis has brought social backlash and protest
against state retrenchment, public sector cutbacks and even market capitalism itself—to the
surprise of policy-makers and institutions, from governments to police to the Church of
3 www.latevaweb.com/web-design-news/usodefacebook.html, 12 March 2012

14
England. All these mobilizations are larger, more effective, more public and more volatile
because of the Internet, and big data can help governments to understand their causes and
implications.
At the time of writing, any moves towards capitalising upon the potential of big data are
somewhat recent. Several governments have embarked on ‘Open Data’ initiatives, with the aim
of increasing transparency and making public data available for re-use, including the UK, the
US, Canada and Australia. In the UK, Open Data was initiated by the inventor of the Web, Tim
Berners Lee, who with Nigel Shadbolt (now leaders of the Open Data Institute) collaborated
with Gordon Brown’s Labour government to persuade departments to open up data and make
it available for public and commercial use from a single web source (www.data.gov.uk). The
incoming Conservative administration from 2010 continued this programme enthusiastically
under the ‘Transparency’ mantra, creating a Transparency Board (led by Tim Kelsey) and a
Transparency and Open Data team in the Cabinet Office. From 2009, a similar initiative in the
US federal government, www.data.gov, managed by the General Services Administration with
the US CIO and CTO, was set up with the aim of ‘democratizing public sector data and driving
innovation’ and by 2012 was making available 450,000 data sets from 172 federal agencies.
Both these programmes were clearly innovative and exciting and represented a major shift,
particularly in the UK with its history of a cultural resistance to ‘opening up’. Some releases of
open data have been extremely popular: in the UK, a police crime map website had an
estimated 47 million visits between February and December 2011, while the Department for
Education reported an 84 per cent increase in the use of its comparative schools data (NAO,
2012). But they have also been criticised for being developer led and commercially oriented,
with little accessibility for citizens, given that the datasets although fully open source compliant,
are in spreadsheet form, with complex coding records and unlikely to appeal to the average
citizen; four fifths of visitors to the data.gov.uk web site leave the site immediately without
accessing any further link. Crucially, there are hardly any examples of data released through
open data initiatives being corrected and improved and fed back to government4. A highly
critical National Audit Office report in 2012 suggested a number of ways in which the UK
government’s transparency and open data agenda was falling between the linked but separate
aims of opening up government to citizens, and capitalising on the potential of big data. It may
be that there is an inevitable tension between these two aims for releasing large scale datasets
for public or commercial consumption, perhaps reflected in the fact that the UK government’s
4 Discussion with Cabinet Office officials, April 2012
15
‘Open Data White Paper’ published in June 2012 (Cabinet Office, 2012) made no mention of
big data.
The US open data initiative has moved more towards the side of big data, and a
glance at the ‘data.gov’ site in 2012 suggests little attempt to appeal to citizens, with data sets
presented for a number of ‘communities’ within the federal government. In March 2012, the US
federal government invested $200 million in big data projects, involving the National Institutes
for Health, the Department of Energy, the National Science Foundation, the Department of
Defense and the US Geological Survey, with the aim of advancing the ‘state of the art core
technologies needed to collect, store, preserve, manage, analyse and share huge quantities of
data and to expand the workforce needed to develop and use Big Data technologies’ (ZD Net,
29th March 2012). An accompanying statement from the White House Office of Science and
Technology Policy claimed that ‘In the same way that past Federal investments in information-
technology R&D led to dramatic advances in supercomputing and the creation of the Internet,
the initiative we are launching today promises to transform our ability to use Big Data for
scientific discovery, environmental and biomedical research, education, and national security.’
As Forbes.com put it, ‘The White House is spending ‘big money on big data’. But other
commentators were more critical, with the editor of Information Week observing that the
speakers at the launch from the federal agencies involved ‘seemed more intent on talking
about their unique initiatives and less focused on how they could collaborate with other
agencies’ (Henschen, 2012). It is too early to judge the extent to which this latest initiative will
reap the kind of benefits of big data for government that are being claimed by private sector
organizations, but certainly the strongly scientific (rather than social scientific) and single
‘mega-agency’ focus of the initiative takes it away from both the ‘reintegration’ and ‘needs-
based holism’ themes of the Digital Era Governance model.
In summary, there are recent internet-based developments – widespread use of social
media, and the increasing potential for generating large-scale ‘big data’ from internet-based
platforms - which could facilitate greater engagement between governments and citizens in the
digital era. Capitalising on these developments would allow governments to progress the
Digital Era Governance model to the ‘second wave’ and austerity pressures can even aid,
rather than hinder this development, as governments look to achieve efficiency savings by
shifting services to digital channels. But there are also indications that there remains a lag
between governments’ and citizens’ capacity to be innovative with social media and barriers to
their ability to realise the potential of big data which leave governments hovering between the
16
‘permanent lag’ and ‘investment pause’ scenarios outlined in Dunleavy and Margetts (2012),
and may work against the realisation of an ‘Essentially Digital Governance’ model.
Conclusion This paper has discussed ways that social science research can both understand ‘digital
governments’ and ‘digital citizens’, and contribute to the future design of ‘Digital Era
Governance’ to increase linkages and feedback loops between the two, enabling greater
citizen engagement and a move towards ‘Essentially Digital Governance’: the use of social
media by government, and the use of ‘big data’ to match public policy to citizens’ needs,
preferences and behaviour. Just before the Internet got famous, in 1998, the political
anthropologist James Scott wrote a book called ‘Seeing Like a State’, where he bemoaned the
tendency of states to impose high modernist top-down hierarchical plans on their citizenries
and environments. If they dare, the Internet allows governments to move away from this model.
By using ‘big data’, accepting blurred boundaries between government and society, being agile
enough to anticipate and work with massive shifts between social media platforms,
governments can use the Internet to ‘see like a citizen’, rather than ‘seeing like a state’.
References Augustine, E., Cushing, C., Dekhtyar, A., McEntee, K., Paterson, K., & Tognetti, M. (2012).
Outage detection via real-time social stream analysis: Leveraging the power of online
complaints. Proceedings of the 21st International Conference Companion on World Wide Web
(pp. 13-22). New York, NY, USA: ACM. doi:10.1145/2187980.2187983
Cabinet Office (2012) Open Data White Paper: Unleashing the Potential, Report presented to
Parliament by the Cabinet Office and Paymaster General (London: The Stationary Office).
Criado, J. I. (2010) ‘The Politics of E-government in Spain: Between Recent Innovations and
Old Inertias’, C.G. Reddick (ed.) Comparative E-Government, Integrated Series in Information
Systems 25. Springer Science and Business Media.
Dunleavy, P. and Margetts, H. (2012) ‘The Second Wave of Digital Era Governance: a Quasi-
paradigm for Government on the Web’, Philosophical Transactions of the Royal Society, A
17
Dunleavy, Patrick and Margetts, Helen, The Second Wave of Digital Era Governance (2010).
APSA 2010 Annual Meeting Paper. Available at SSRN: http://ssrn.com/abstract=1643850
Dunleavy, P. and Margetts, H. (2000) ‘The Advent of Digital Government: Public Bureaucracies
and the State in the Internet Age’, Paper to the Annual Conference of the American Political
Science Association, Omni Shoreham Hotel, Washington, 4 September 2000
Dunleavy, P., Margetts, H. Bastow, S. Tinkler, J. (2006) Digital-era Governance: IT
Corporations, the State and E-government (Oxford University Press, 2006, rev. paperback
edition 2008)
Dunleavy, P., Margetts, H. Bastow, S. Tinkler, J. (2005) ‘NPM is Dead – Long-live Digital Era
Governance’, Journal of Public Administration Research and Theory, 16(3): 467-494,2006.
Dunleavy, P., Margetts, H., Goldchluk, S., Khan, M.K., Tinkler, J., Towers, E. and Escher, T.
(2009) Department for Work and Pensions. Communicating with Customers. Report by the
Comptroller and Auditor General, HC 421 Session 2008-2009. London: The Stationery Office.
Dunleavy, P., Margetts, H., Bastow, S., Escher, T., Pearce, O. and Tinkler, J. (2007)
Government on the Internet. Report by the Comptroller and Auditor General, HC 529 Session
2006-2007, 13 July 2007. London: The Stationery Office.
Escher, T. Margetts, H. Petricek, V. and Cox, I. (2006) ‘Governing from the Centre: comparing
the nodality of digital governments’, paper to American Political Science Association
conference, Philadelphia, Sept. See: papers.ssrn.com/sol3/papers.cfm?abstract_id=1755762 Gonzalez-Bailon, S., Borge-Holthoefer, J., Rivero, A. and Moreno, Y. (2011) The Dynamics of
Protest Recruitment Through an Online Network. Scientific Reports 1, 197. DOI:
10.1038/srep00197
Hale, S. and Margetts, H. (2012) ‘Understanding the Mechanics of Online Collective Action
Using ‘Big Data’’, Available at SSRN: http://ssrn.com/abstract=2041856 or
http://dx.doi.org/10.2139/ssrn.2041856
18
Henschen, D. (2012) ‘Big Data Initiative or Big Government Boondoggle’, Information Week,
2nd April 2012.
Hood, C. and Margetts, H. (2007) The Tools of Government in the Digital Age (Palgrave)
Loubser, M. (2010) Organisational Mechanisms in Peer Productions: The Case of Wikipedia,
DPhil Thesis, Oxford Internet Institute, University of Oxford.
Manyika, James, Chui, M. Brown, B. Bughin, J. Dobbs, R. Roxburgh, C. Byers, A. (2011) Big
data: The next frontier for innovation, competition, and productivity, McKinsey Global Institute.
Margetts, H. (1999) Information Technology in Government: Britain and America (London:
Routledge).
Margetts, H. and Dunleavy, P. (2002) Cultural Barriers to E-Government. Academic article for
the report: 'Better Public Services Through e-government'. London: National Audit Office, 2002,
HC 704-III.
National Audit Office (NAO) (2012) Implementing Transparency, Report by the Comptroller and
Auditor General, HC 1833 Session 2010-2012, 18 April.
Public Administration Committee (2012) Government and IT – “A Recipe for Rip-Offs: Time for
a New Approach, Twelfth Report (London: The Stationary Office).
Scott, J. (1998) Seeing Like a State: How Certain Schemes to Improve the Human Condition
have Failed (New Haven: Yale University Press).
Wind-Cowie, M. and Lekhi, R. (2012) The Data Dividend (London: Demos).
Recommended