Delta Volume Calculation
Subir Saha
Bay-Delta Office
Department of Water Resources
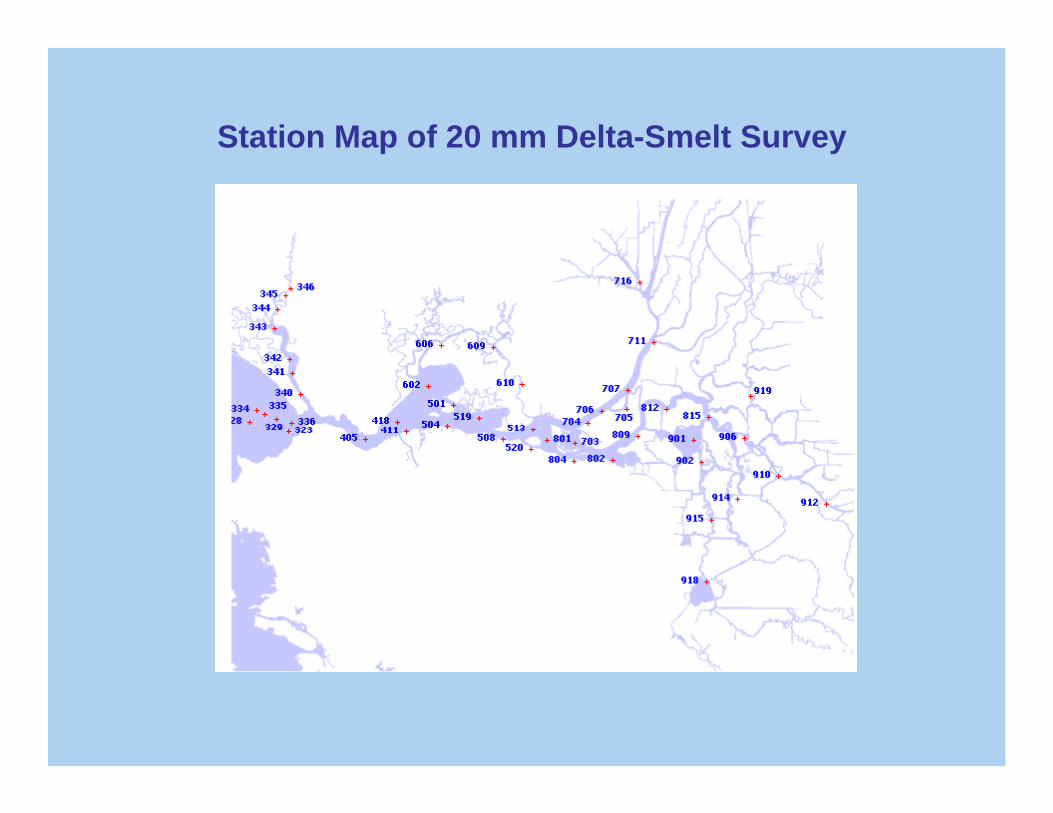
Station Map of 20 mm Delta-Smelt Survey

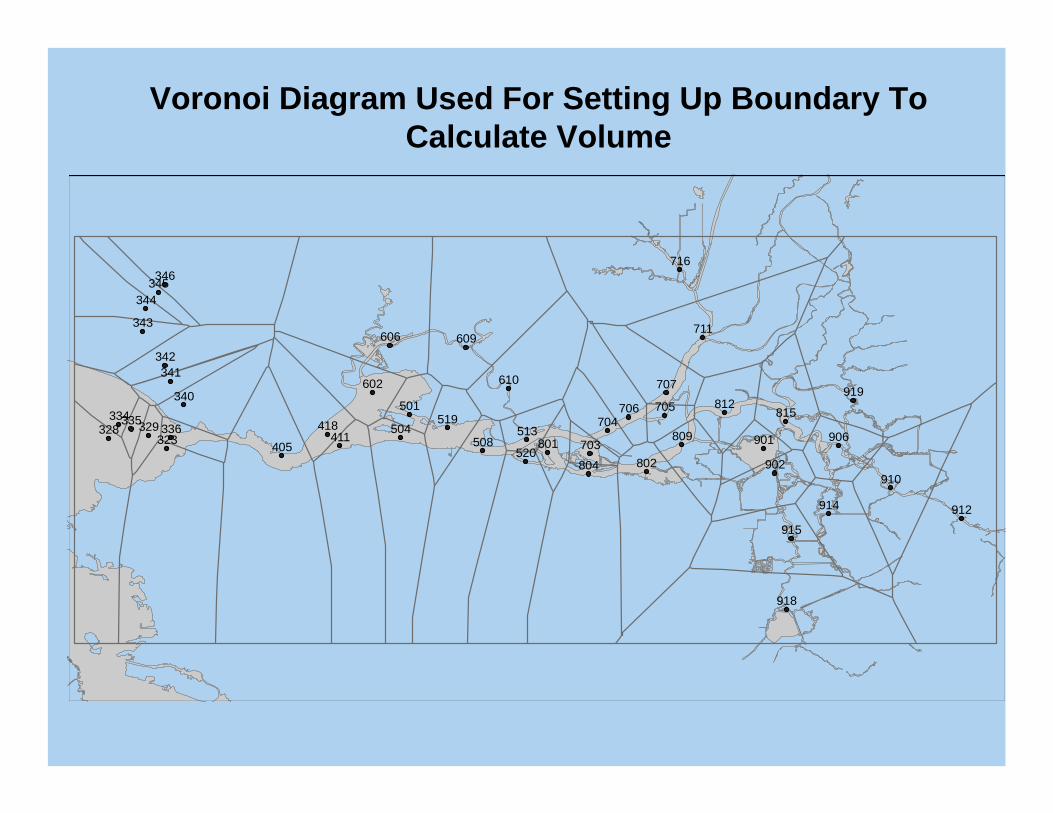
Voronoi Diagram
If these dots represent the locations of survey stations, the Voronoi diagram partitions space into cells around each station.
Voronoi diagrams represent the region of influence around each of a given set of sites.
919
918
915
914 912
910
906
902
901
815812
809
804 802801
716
711
707
706
703
610
609606
602
519513
508504
501418
405
346
343
342
340
336335334
705704
520411
345344
341
329328323
Voronoi Diagram Used For Setting Up Boundary To Calculate Volume
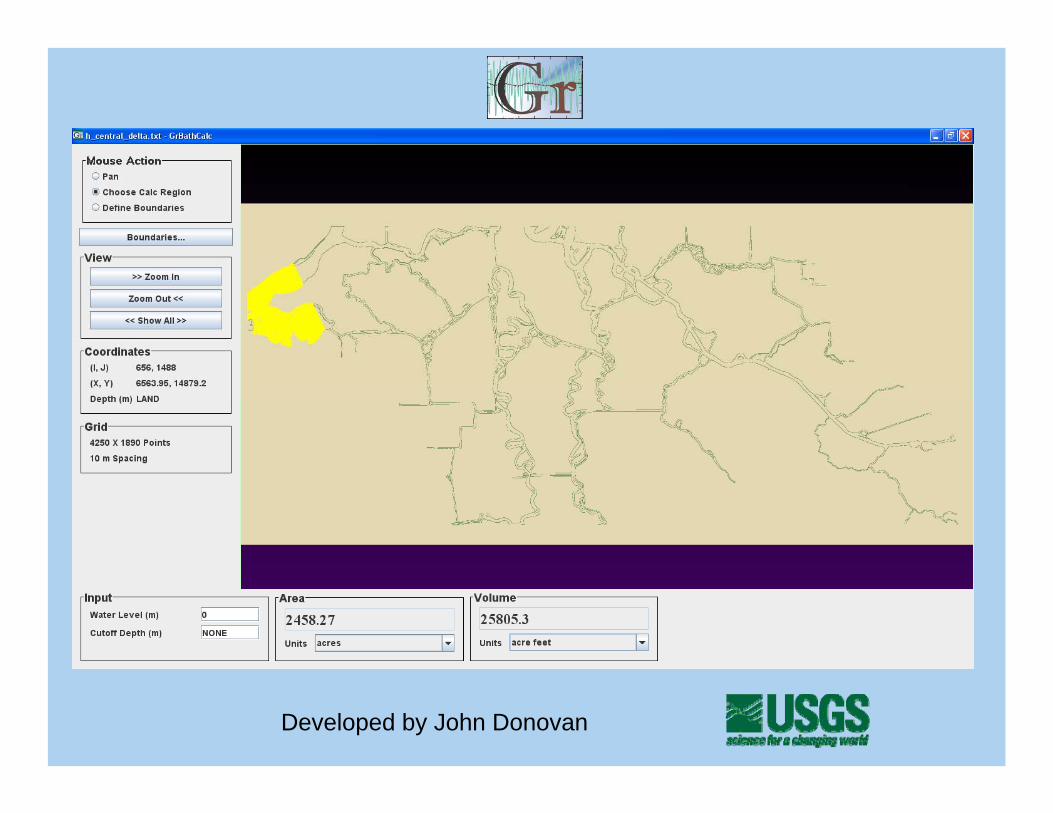
Developed by John Donovan
328
334 335
329
323
340
336
342343
405
341
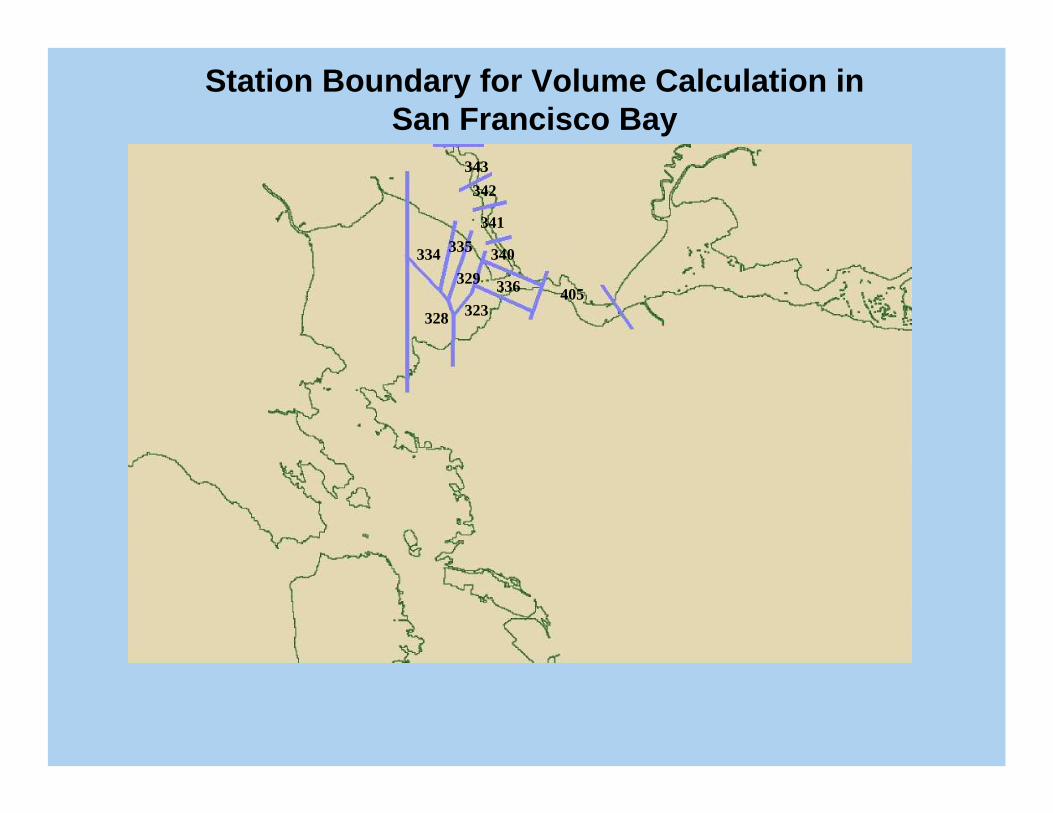
Station Boundary for Volume Calculation in San Francisco Bay
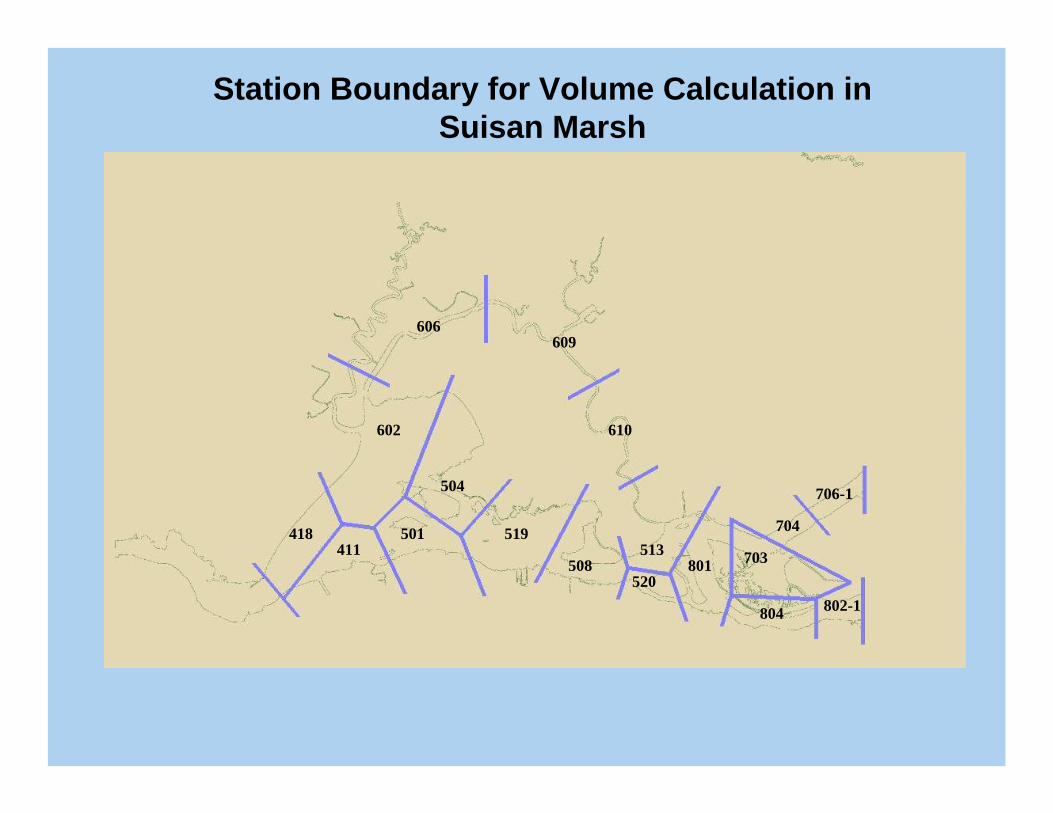
418411
504
501
602
508513
520
704
606
610
519
609
802-1
703801
706-1
804
Station Boundary for Volume Calculation in Suisan Marsh
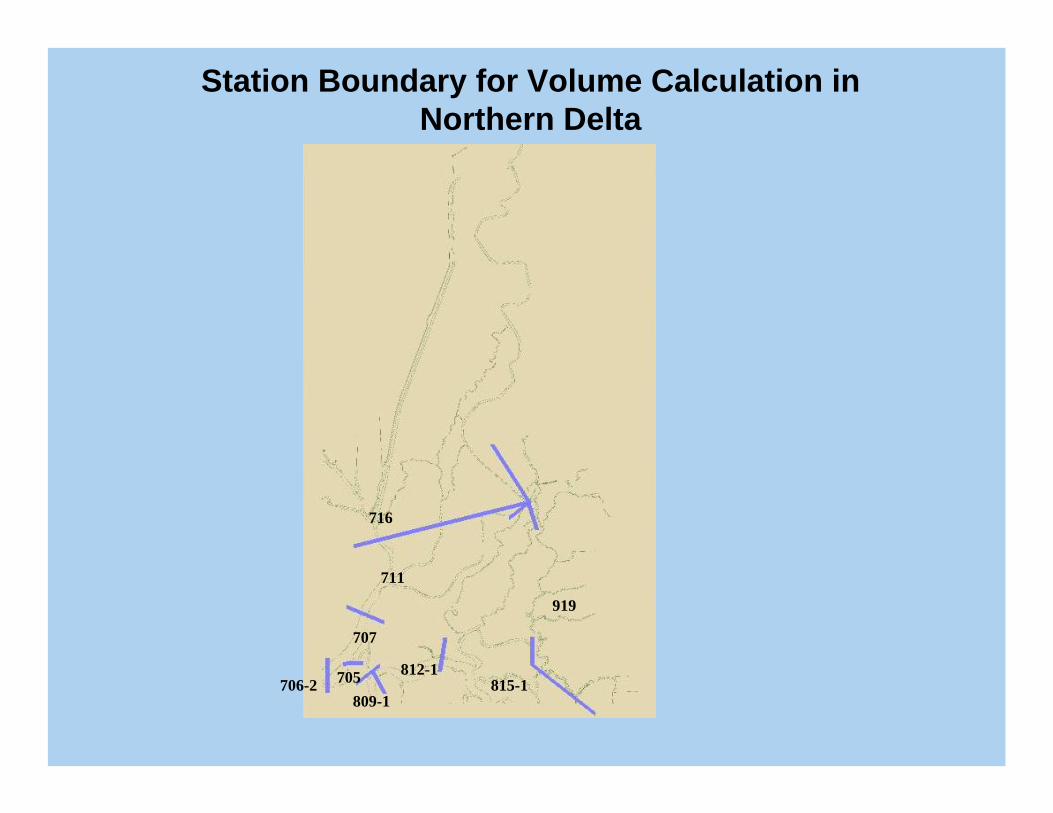
705
707
815-1
716
706-2809-1
919
812-1
711
Station Boundary for Volume Calculation in Northern Delta

802-2
809-2812-2 901
915-1
912-1
910
906
914-1
815-2
Station Boundary for Volume Calculation in Central Delta
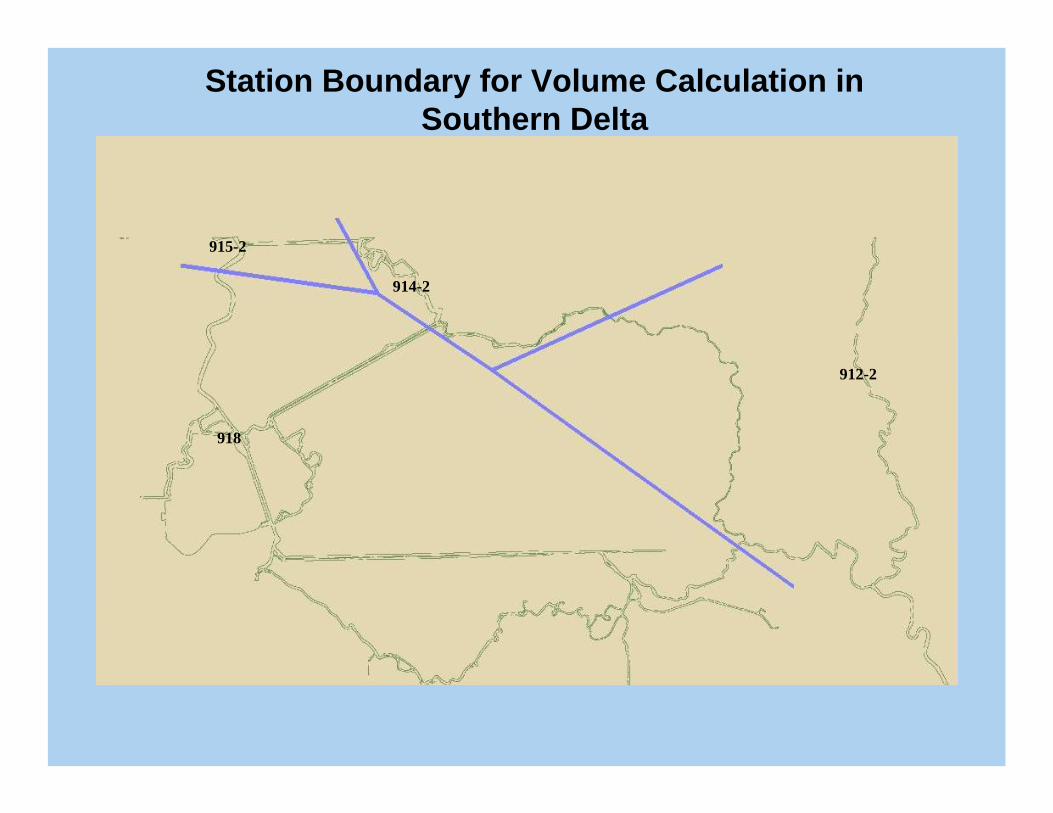
915-2
912-2
918
914-2
Station Boundary for Volume Calculation in Southern Delta

12,130438520
41,9211,703513
53,3442,296508
67,9424,101519
3,156259610
8,114727609
17,6851,332606
72,8527,361602
44,0462,403504
36,8563,692501
37,3442,119411
63,1862,756418
139,8043,547405
9,792552340
9,213617341
6,243713342
7,0551,156343
87,5912,604336
49,4753,945323
43,5083,060329
17,7472,316335
37,1776,746334
125,5948,323328
Volume (acre-feet)
Surface Area (acre)
Survey Station
14,6851,601918
13,3021,146915
23,5521,554914
13,7471,225912
25,7601,925910
32,6941,780906
22,0951,744902
33,8553,822901
20,7022,043919
720534023815
43,8101,767812
33,5621,392809
103,5926,219716
39,3911,994711
37,0761,859707
3,741277705
24,539931706
15,952605704
45,0943,546802
32,1191,195804
25,8532,091703
45,6622,226801
Volume (acre-feet)
Surface Area (acre)
Survey Station
Calculated Surface Area and Volume of 20 mm Delta-Smelt Survey Stations
Thank You
Recommended