International Research Journal of Pure and Applied Physics
Vol.8, No.1, pp.22-36,2021
Published by ECRTD-UK
ISSN 2055-009X(Print),
ISSN 2055-0103(Online)
22 @ECRTD-UK/(www.ea-journals.org)
DELINEATING GROUND WATER POTENTIAL USING ELECTRICAL
RESISTIVITY METHOD IN ADAMAWA STATE UNIVERSITY
PERMANENT SITE, MUBI NORTH –EASTERN NIGERIA.
1Sunday, A. and 2Usman, A.
1 Department of Applied Physics, Federal Polytechnic Mubi, Adamawa State North
Eastern Nigeria. 2Department of Science Laboratory Technology, Federal Polytechnic Mubi,
Adamawa State North Eastern Nigeria.
Abstract: Delineating ground water potential using electrical resistivity method in
Adamawa State University permanent site, Mubi North – Eastern Nigeria was carried
out to determine depth to the groundwater potential zones, the lithology of the area and
possible best site for drilling bore holes. Ten VES points were sounded in the study area
with the ABEM SAS 1000 Terameter. The maximum electrode spacing was
100m.Schlumberger array was used during the acquisition of data. Two methods were
also used for interpretation of the result which are qualitative and quantitative methods,
1XD interpex software was used to interpret the raw data. Possible groundwater
potential areas were detected. Out of the ten VES points; VES 11,12 and 20 were found
to be potential zone for ground water exploration due to the presence of
fracture/weathered zone and low resistivity, it has a depth ranging from 40m to 70m
while VES points 13,14, 15,16,17,18 and 19 do not possess ground water potentials
because they have high resistivity values.
KEY WORDS: groundwater, vertical electrical sounding (VES), Terameter, Lithology
and Schlumberger array.
INTRODUCTION
Water is one of the essentials that supports all forms of plant and animal life (Vanloon
and Duffy, 2005) and it is generally obtained from two principal natural sources;
Surface water such as fresh water lakes, rivers, streams, etc. and Ground water such as
borehole water and well water (McMurry and Fay, 2004; Mendie, 2005). Water is
probably the most important resource in the world, since without it life will be non-
existence and industrial activities cannot take place. It plays a vital role in the
development of communities because a reliable supply of water is an essential pre-
requisite for establishment of a permanent community. Groundwater is a mysterious
nature’s hidden treasure. Its exploration and exploitation have continued to remain an
important issue due to its unalloyed needs. Though there are other sources of water, like
streams, rivers, ponds, etc., none is as hygienic as ground water because groundwater
has an excellent natural microbiological quality and generally adequate chemical
quality for most uses (Okpoli, 2017).
International Research Journal of Pure and Applied Physics
Vol.8, No.1, pp.22-36,2021
Published by ECRTD-UK
ISSN 2055-009X(Print),
ISSN 2055-0103(Online)
23 @ECRTD-UK/(www.ea-journals.org)
Study of groundwater geology is much useful for all the activities of human life.
Groundwater is more advantageous than the surface water. Water scarcity problem
affects the human chain and other living things. To meet out the demand of water,
people are depending more on aquifers (Srinivasan et al., 2013). There are two end
members in spectrum of types of aquifers; confined and unconfined (with semi confined
aquifer being in between them) (Niwas, 2003).
A lot of research work has been carried out in finding groundwater successfully using
geophysical methods (Worthington,1977; Olorunfemi et al., 1999; Olorunfemi et al.,
1993, Akintorinwa and Olowolafe, 2013, Mogaji et al., 2011) and/or remote sensing
method (Odeyemi et al., 1999,Mogaji et al., 2011, Anifowose and Kolawole,
2012,Yenne, 2015, Dibal et al, 2016). Exploration for groundwater requires a vivid
understanding of both surface and subsurface characteristics of the area (Mogaji et al.,
2011).
This research is aimed at Delineating Ground Water Potential Using Electrical
Resistivity Method In Adamawa State University Permanent Site , Mubi North –
Eastern Nigeria. The objectives are: to determine possible best site for drilling bore
hole, Lithology of the area (apparent resistivity, thickness of layers and the depth to
bedrock), as well as fractured zones.
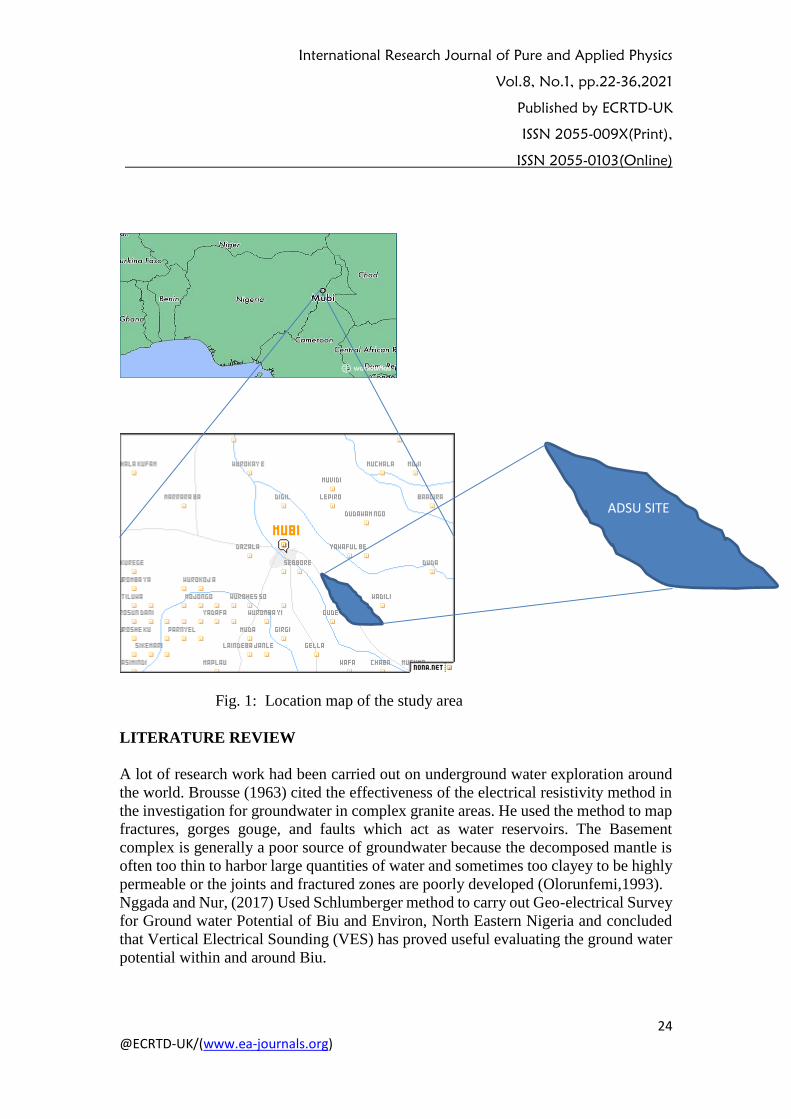
The study area The area lies within Latitude 100 015ꞌN and 100 025′N and Longitude 130 015ꞌE and 130
025′E. The area is 10km2 and is quite accessible. The topography of the area is typically
of steep hills, undulating slopes and gentle escarpment. The landform is the
consequence of geological and geomorphological processes.
The town is located within the Precambrian Basement Complex in the Northern part of
Adamawa State. The rocks in the area are the Migmatite-gneisses and the Older
granites. Some parts of the study area overlying the basement rocks are the alluvial
deposits,which are derived from the weathering of the basement rock uphill and in situ.
Geologic log data indicate that the thickness of the alluvial deposits to the bedrock range
from about 5m to 25m along the river Yedsarem. The area is made up of two aquifer
systems based on geological reconnaisance, the nature of the water and analysis of
borehole lithologic logs. These are the fractured basement mainly magmatic (Obiefuna
et al., 1999).
International Research Journal of Pure and Applied Physics
Vol.8, No.1, pp.22-36,2021
Published by ECRTD-UK
ISSN 2055-009X(Print),
ISSN 2055-0103(Online)
24 @ECRTD-UK/(www.ea-journals.org)
Fig. 1: Location map of the study area
LITERATURE REVIEW
A lot of research work had been carried out on underground water exploration around
the world. Brousse (1963) cited the effectiveness of the electrical resistivity method in
the investigation for groundwater in complex granite areas. He used the method to map
fractures, gorges gouge, and faults which act as water reservoirs. The Basement
complex is generally a poor source of groundwater because the decomposed mantle is
often too thin to harbor large quantities of water and sometimes too clayey to be highly
permeable or the joints and fractured zones are poorly developed (Olorunfemi,1993).
Nggada and Nur, (2017) Used Schlumberger method to carry out Geo-electrical Survey
for Ground water Potential of Biu and Environ, North Eastern Nigeria and concluded
that Vertical Electrical Sounding (VES) has proved useful evaluating the ground water
potential within and around Biu.
ADSU SITE a
International Research Journal of Pure and Applied Physics
Vol.8, No.1, pp.22-36,2021
Published by ECRTD-UK
ISSN 2055-009X(Print),
ISSN 2055-0103(Online)
25 @ECRTD-UK/(www.ea-journals.org)
Kasidi and Lazarus (2017) Application of vertical electrical sounding (VES)
delineating ground water potentials in some part of Jalingo , Taraba state North eastern
Nigeria and were able to locate the ground water potential zones .
Mohammed et al. (2007) In a regional geo-electrical investigation for groundwater
exploration in Minna Area North west Nigeria, the result from this study has provided
a useful guide towards locating sites of productive bore hole
MATERIALS AND METHODS
The geophysical methods adopted for this research was Vertical Electrical Sounding
using the equipments ABEM SAS-1000 Terameter, electrodes, wire, car battery ,
umbrella, hammer and tape. Schlumberger array of the electrical resistivity method was
used in carrying out the geophysical survey. Apparent resistivity measurements were
made by systematically varying electrode spacing. A total of 5 VES points were
occupied on the study area with maximum electrode spacing of 100m.The Vertical
Electrical Sounding which is a 1-D resistivity approach was used to measure the vertical
variations in electrical properties beneath the earth surface using the Schlumberger
electrode configuration. It involves the use of a pair of current electrodes and a pair of
potential electrodes to measure the resultant potential difference within the subsurface.
Data are obtained by increasing the electrode spacing linearly about a central position
whose vertical resistivity variation is sought.
E
A M N B
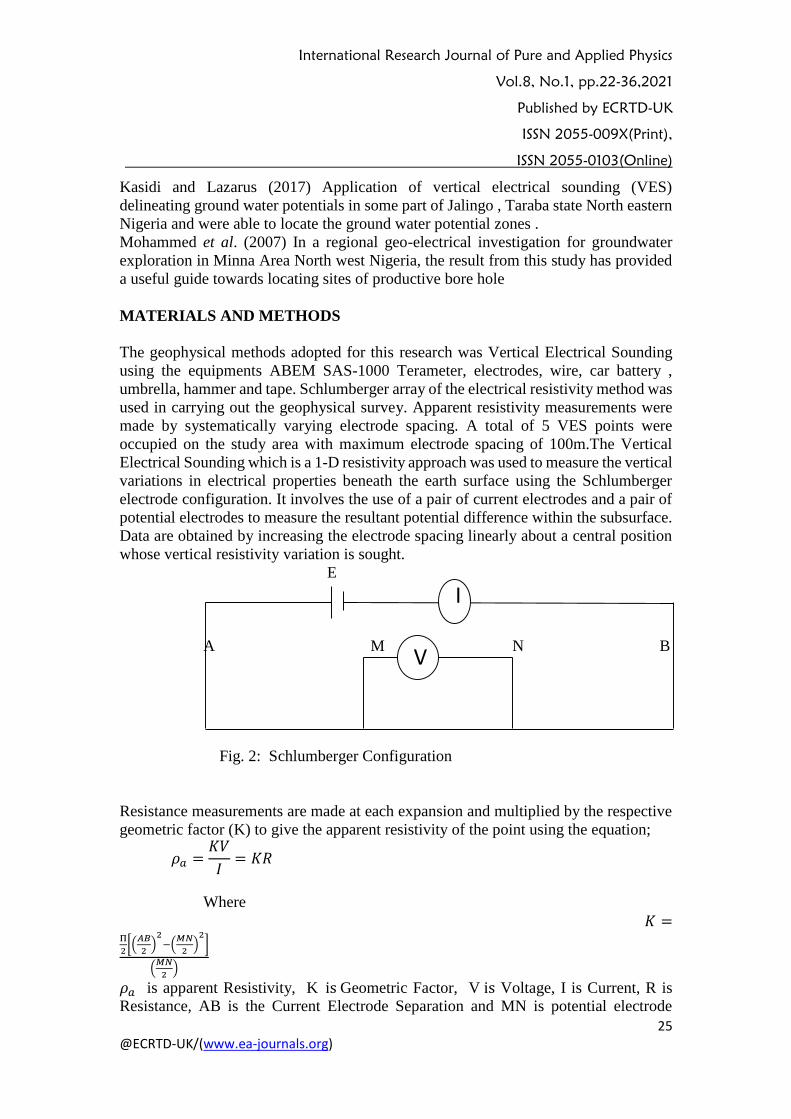
Fig. 2: Schlumberger Configuration
Resistance measurements are made at each expansion and multiplied by the respective
geometric factor (K) to give the apparent resistivity of the point using the equation;
𝜌𝑎 =𝐾𝑉
𝐼= 𝐾𝑅
Where
𝐾 =Π
2[(
𝐴𝐵
2)
2−(
𝑀𝑁
2)
2]
(𝑀𝑁
2)
𝜌𝑎 is apparent Resistivity, K is Geometric Factor, V is Voltage, I is Current, R is
Resistance, AB is the Current Electrode Separation and MN is potential electrode
V
I
International Research Journal of Pure and Applied Physics
Vol.8, No.1, pp.22-36,2021
Published by ECRTD-UK
ISSN 2055-009X(Print),
ISSN 2055-0103(Online)
26 @ECRTD-UK/(www.ea-journals.org)
separation. During data acquisition the electrodes were connected appropriately to their
respective terminals on the Terameter through cables and hammered to make good
contact with the earth. During the sounding, the instrument sends down direct current
into the earth subsurface through the pair of steel current electrodes, while the
established subsurface potential difference across the subsurface under investigation
was measured by the Terameter through the steel potential electrodes. For each
sounding, the Terameter computes and displays a mean digital value of the apparent
resistivity of the subsurface under investigation (Lazarus et al., 2020).
RESULT
The apparent resistivity data were processed by Interpex IXD resistivity software using
one dimensional (1D) inversion to model the vertical variations of subsurface resistivity
at different depths. This software allows the user to enter apparent resistivity data in a
standard geo-soft format. It also smoothens the field curve through the process of
filtering technique that involves single point correction and vertical curve segment shift.
This package is capable of converting the values of apparent resistivity as function of
electrode spacing acquired as the field data to values of true resistivity as function of
depth of individual layer for the actual condition in the ground to be interpreted. The
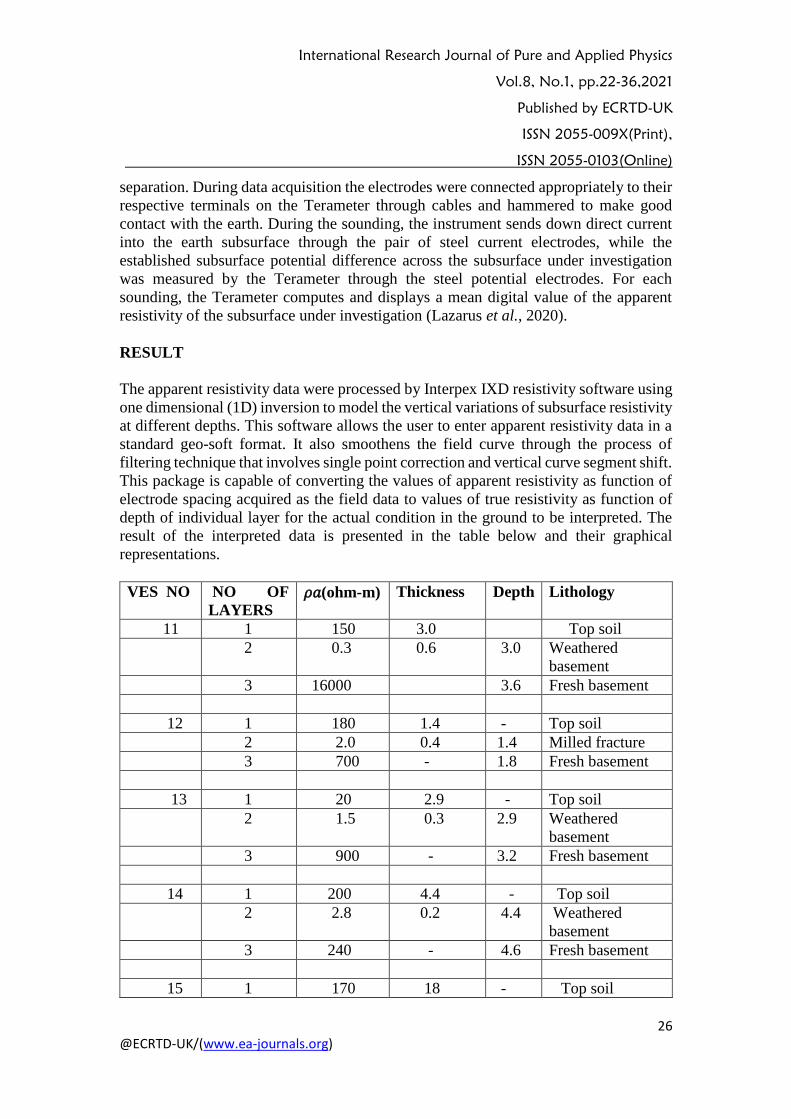
result of the interpreted data is presented in the table below and their graphical
representations.
VES NO NO OF
LAYERS
𝜌𝑎(ohm-m) Thickness Depth Lithology
11 1 150 3.0 Top soil
2 0.3 0.6 3.0 Weathered
basement
3 16000 3.6 Fresh basement
12 1 180 1.4 - Top soil
2 2.0 0.4 1.4 Milled fracture
3 700 - 1.8 Fresh basement
13 1 20 2.9 - Top soil
2 1.5 0.3 2.9 Weathered
basement
3 900 - 3.2 Fresh basement
14 1 200 4.4 - Top soil
2 2.8 0.2 4.4 Weathered
basement
3 240 - 4.6 Fresh basement
15 1 170 18 - Top soil
International Research Journal of Pure and Applied Physics
Vol.8, No.1, pp.22-36,2021
Published by ECRTD-UK
ISSN 2055-009X(Print),
ISSN 2055-0103(Online)
27 @ECRTD-UK/(www.ea-journals.org)
2 4.0 1.0 18 Fresh Weathered
3 310 - 19 Fresh basement
16 1 25 3.0 - Top soil
2 8 0.1 3.0 Weathered
basement
3 50000 - 3.1 Fresh basement
17 1 30 20 - Top soil
2 50000 - 20 Fresh basement
18 1 60 2.2 - Top soil
2 12 0.1 2.2 Weathered
basement
3 100600 - 2.3 Fresh basement
19 1 270 8.2 - Topsoil
2 150000 - 8.2 Fresh basement
20 1 500 2.6 - Top soil
2 5.0 0.1 2.6 Weathered
basement
3 200,000 - 2.7 Fresh basement
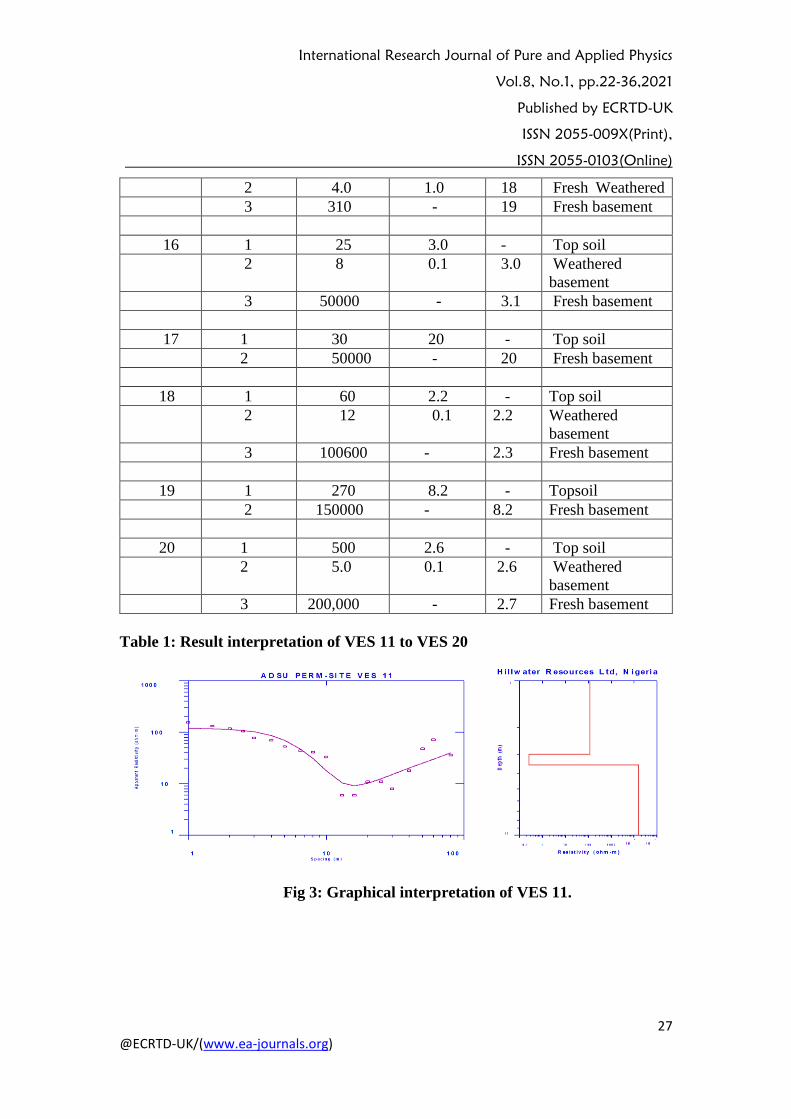
Table 1: Result interpretation of VES 11 to VES 20
Fig 3: Graphical interpretation of VES 11.
International Research Journal of Pure and Applied Physics
Vol.8, No.1, pp.22-36,2021
Published by ECRTD-UK
ISSN 2055-009X(Print),
ISSN 2055-0103(Online)
28 @ECRTD-UK/(www.ea-journals.org)
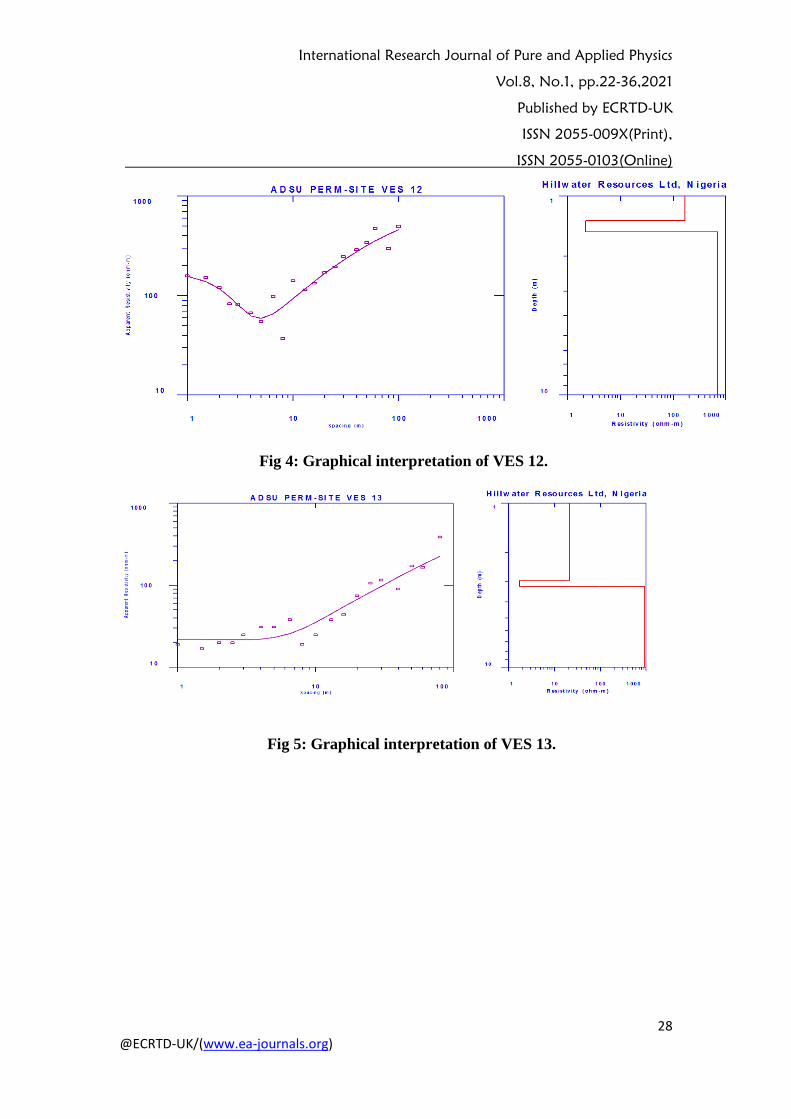
Fig 4: Graphical interpretation of VES 12.
Fig 5: Graphical interpretation of VES 13.
International Research Journal of Pure and Applied Physics
Vol.8, No.1, pp.22-36,2021
Published by ECRTD-UK
ISSN 2055-009X(Print),
ISSN 2055-0103(Online)
29 @ECRTD-UK/(www.ea-journals.org)
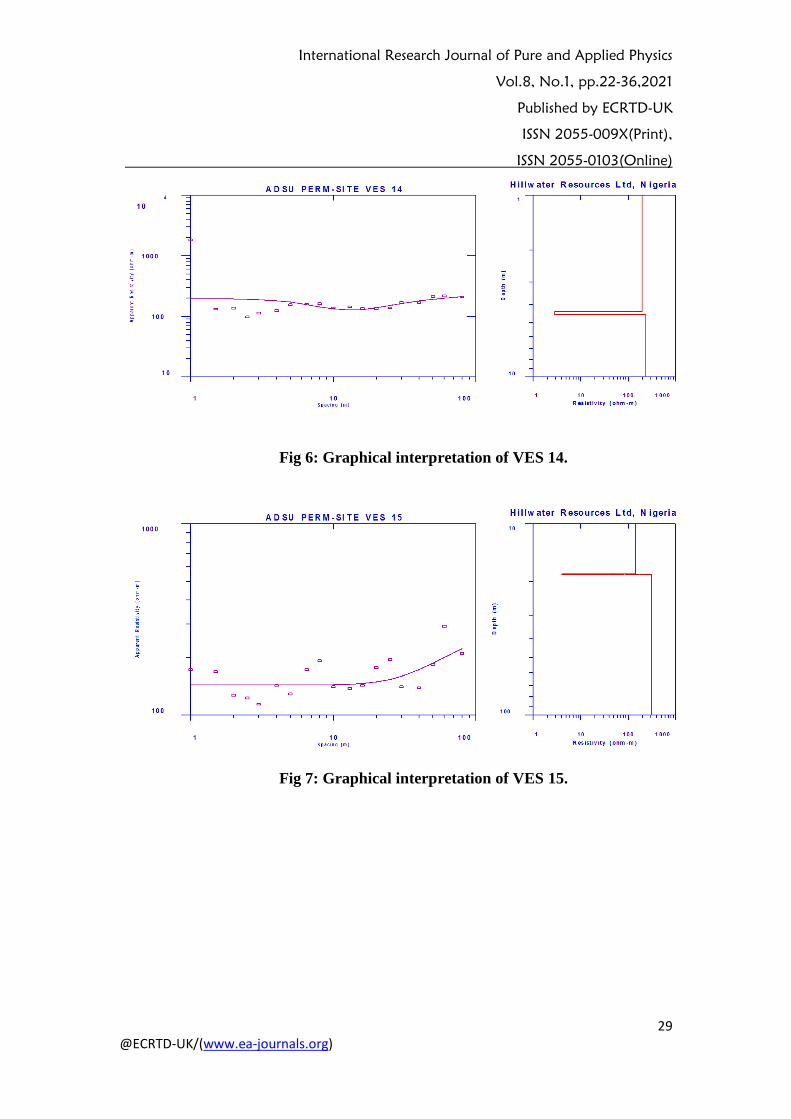
Fig 6: Graphical interpretation of VES 14.
Fig 7: Graphical interpretation of VES 15.
International Research Journal of Pure and Applied Physics
Vol.8, No.1, pp.22-36,2021
Published by ECRTD-UK
ISSN 2055-009X(Print),
ISSN 2055-0103(Online)
30 @ECRTD-UK/(www.ea-journals.org)
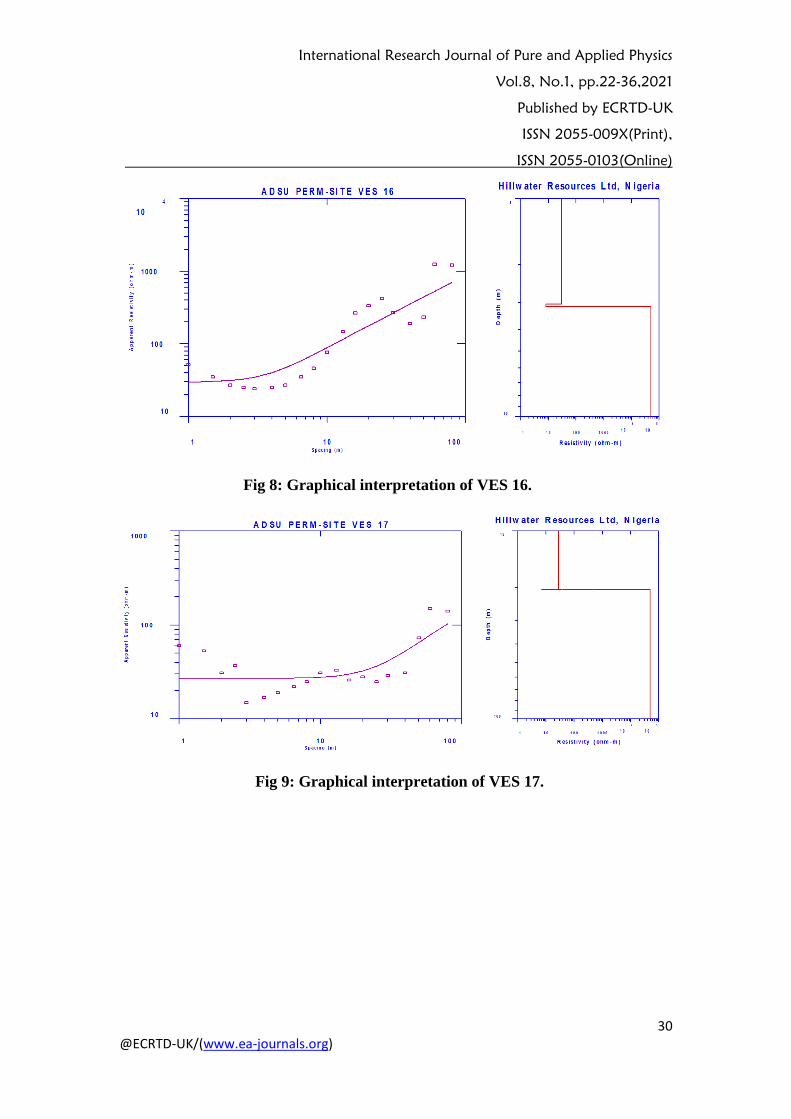
Fig 8: Graphical interpretation of VES 16.
Fig 9: Graphical interpretation of VES 17.
International Research Journal of Pure and Applied Physics
Vol.8, No.1, pp.22-36,2021
Published by ECRTD-UK
ISSN 2055-009X(Print),
ISSN 2055-0103(Online)
31 @ECRTD-UK/(www.ea-journals.org)
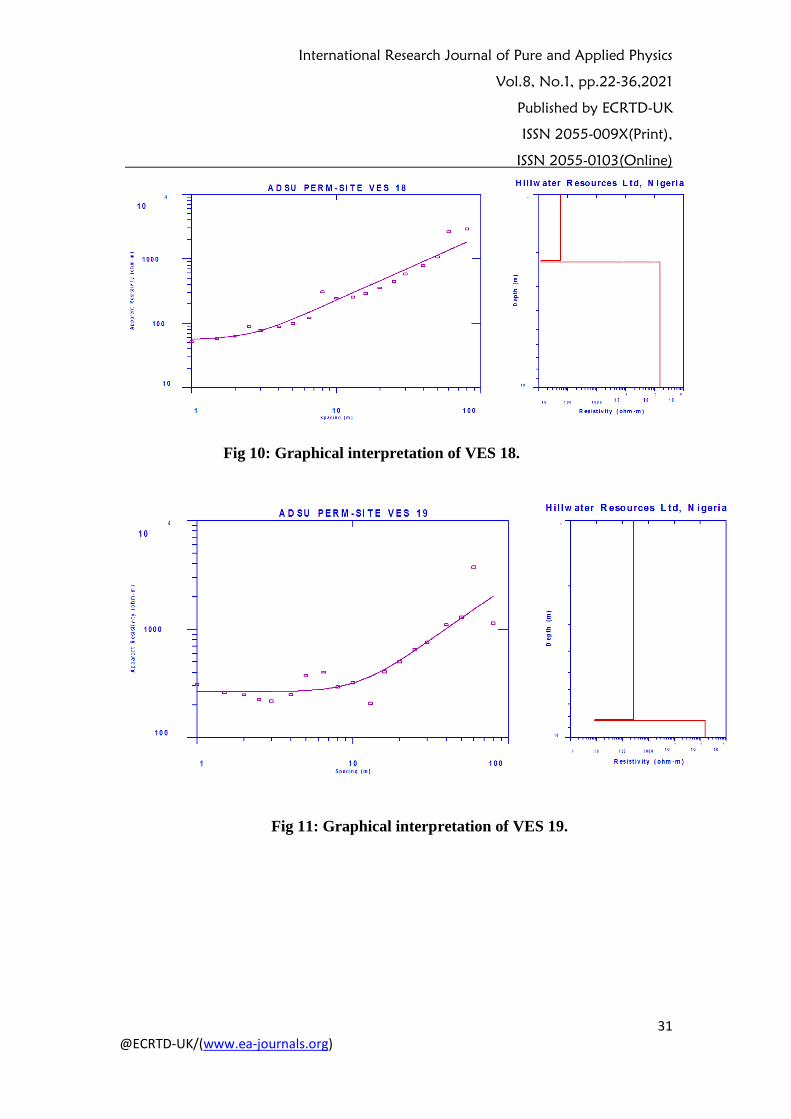
Fig 10: Graphical interpretation of VES 18.
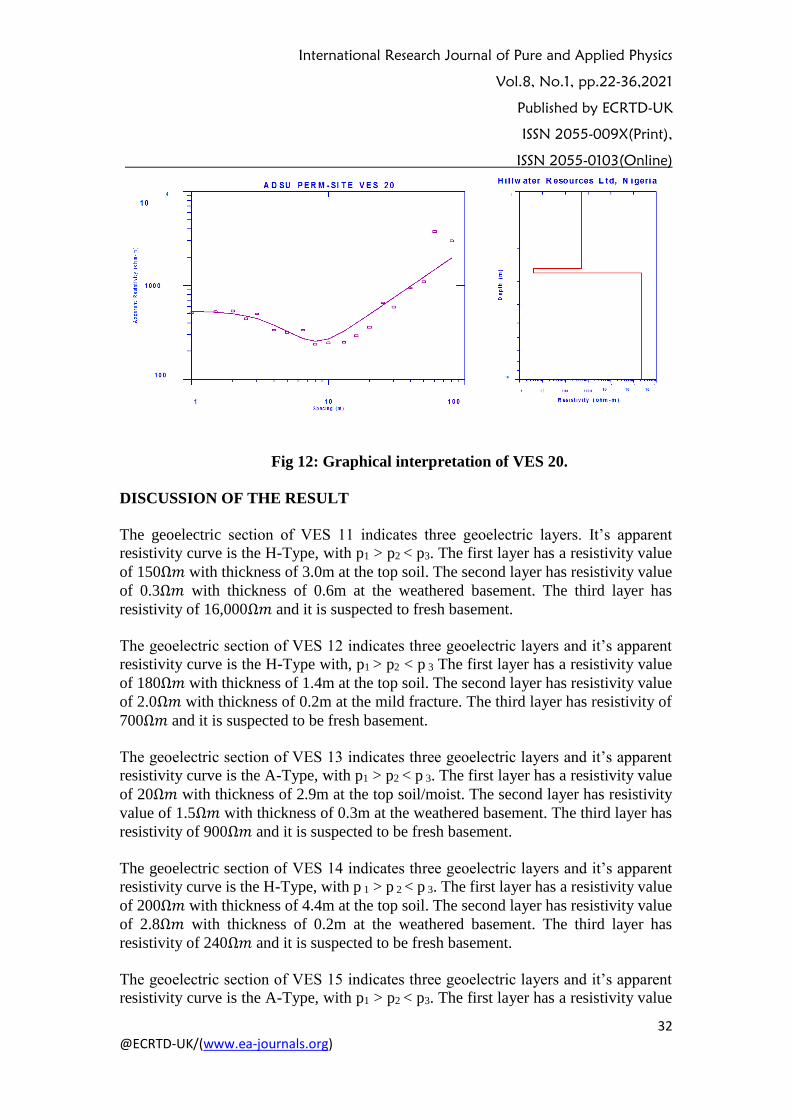
Fig 11: Graphical interpretation of VES 19.
International Research Journal of Pure and Applied Physics
Vol.8, No.1, pp.22-36,2021
Published by ECRTD-UK
ISSN 2055-009X(Print),
ISSN 2055-0103(Online)
32 @ECRTD-UK/(www.ea-journals.org)
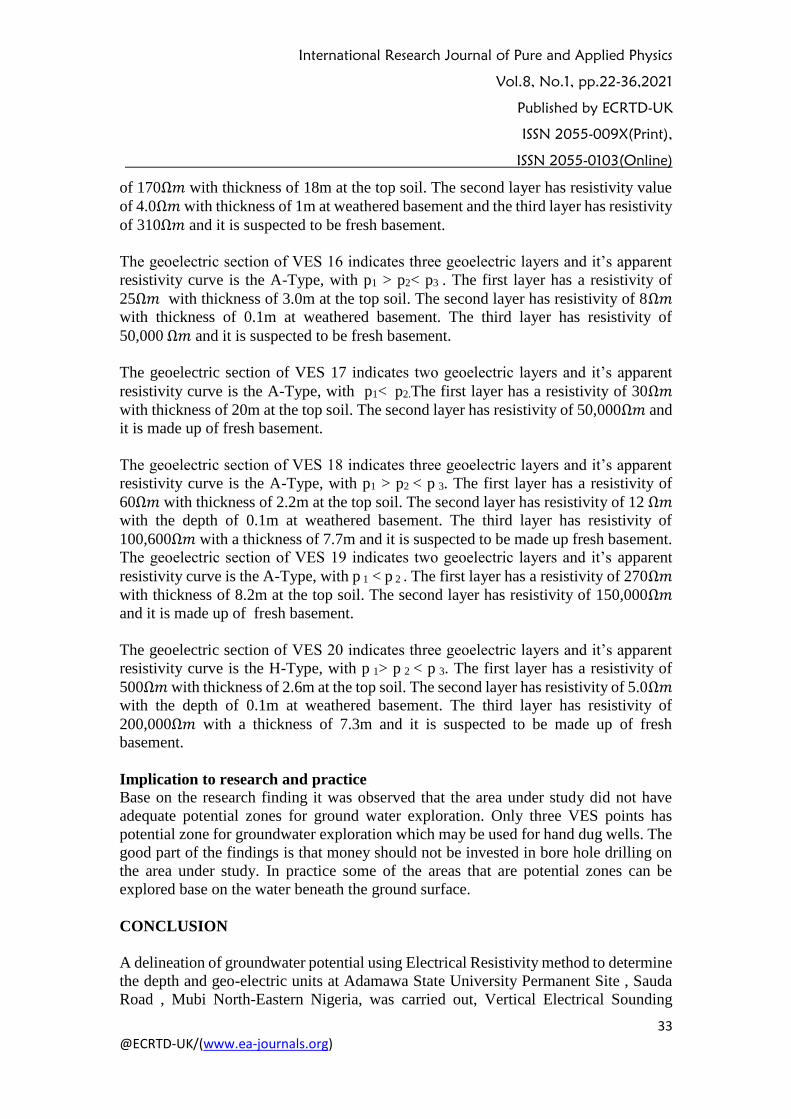
Fig 12: Graphical interpretation of VES 20.
DISCUSSION OF THE RESULT
The geoelectric section of VES 11 indicates three geoelectric layers. It’s apparent
resistivity curve is the H-Type, with p1 > p2 < p3. The first layer has a resistivity value
of 150Ω𝑚 with thickness of 3.0m at the top soil. The second layer has resistivity value
of 0.3Ω𝑚 with thickness of 0.6m at the weathered basement. The third layer has
resistivity of 16,000Ω𝑚 and it is suspected to fresh basement.
The geoelectric section of VES 12 indicates three geoelectric layers and it’s apparent
resistivity curve is the H-Type with, p1 > p2 < p 3 The first layer has a resistivity value
of 180Ω𝑚 with thickness of 1.4m at the top soil. The second layer has resistivity value
of 2.0Ω𝑚 with thickness of 0.2m at the mild fracture. The third layer has resistivity of
700Ω𝑚 and it is suspected to be fresh basement.
The geoelectric section of VES 13 indicates three geoelectric layers and it’s apparent
resistivity curve is the A-Type, with p1 > p2 < p 3. The first layer has a resistivity value
of 20Ω𝑚 with thickness of 2.9m at the top soil/moist. The second layer has resistivity
value of 1.5Ω𝑚 with thickness of 0.3m at the weathered basement. The third layer has
resistivity of 900Ω𝑚 and it is suspected to be fresh basement.
The geoelectric section of VES 14 indicates three geoelectric layers and it’s apparent
resistivity curve is the H-Type, with p 1 > p 2 < p 3. The first layer has a resistivity value
of 200Ω𝑚 with thickness of 4.4m at the top soil. The second layer has resistivity value
of 2.8Ω𝑚 with thickness of 0.2m at the weathered basement. The third layer has
resistivity of 240Ω𝑚 and it is suspected to be fresh basement.
The geoelectric section of VES 15 indicates three geoelectric layers and it’s apparent
resistivity curve is the A-Type, with p1 > p2 < p3. The first layer has a resistivity value
International Research Journal of Pure and Applied Physics
Vol.8, No.1, pp.22-36,2021
Published by ECRTD-UK
ISSN 2055-009X(Print),
ISSN 2055-0103(Online)
33 @ECRTD-UK/(www.ea-journals.org)
of 170Ω𝑚 with thickness of 18m at the top soil. The second layer has resistivity value
of 4.0Ω𝑚 with thickness of 1m at weathered basement and the third layer has resistivity
of 310Ω𝑚 and it is suspected to be fresh basement.
The geoelectric section of VES 16 indicates three geoelectric layers and it’s apparent
resistivity curve is the A-Type, with p1 > p2< p3 . The first layer has a resistivity of
25Ω𝑚 with thickness of 3.0m at the top soil. The second layer has resistivity of 8Ω𝑚
with thickness of 0.1m at weathered basement. The third layer has resistivity of
50,000 Ω𝑚 and it is suspected to be fresh basement.
The geoelectric section of VES 17 indicates two geoelectric layers and it’s apparent
resistivity curve is the A-Type, with p1< p2.The first layer has a resistivity of 30Ω𝑚
with thickness of 20m at the top soil. The second layer has resistivity of 50,000Ω𝑚 and
it is made up of fresh basement.
The geoelectric section of VES 18 indicates three geoelectric layers and it’s apparent
resistivity curve is the A-Type, with p1 > p2 < p 3. The first layer has a resistivity of
60Ω𝑚 with thickness of 2.2m at the top soil. The second layer has resistivity of 12 Ω𝑚
with the depth of 0.1m at weathered basement. The third layer has resistivity of
100,600Ω𝑚 with a thickness of 7.7m and it is suspected to be made up fresh basement.
The geoelectric section of VES 19 indicates two geoelectric layers and it’s apparent
resistivity curve is the A-Type, with p 1 < p 2 . The first layer has a resistivity of 270Ω𝑚
with thickness of 8.2m at the top soil. The second layer has resistivity of 150,000Ω𝑚
and it is made up of fresh basement.
The geoelectric section of VES 20 indicates three geoelectric layers and it’s apparent
resistivity curve is the H-Type, with p 1> p 2 < p 3. The first layer has a resistivity of
500Ω𝑚 with thickness of 2.6m at the top soil. The second layer has resistivity of 5.0Ω𝑚
with the depth of 0.1m at weathered basement. The third layer has resistivity of
200,000Ω𝑚 with a thickness of 7.3m and it is suspected to be made up of fresh
basement.
Implication to research and practice
Base on the research finding it was observed that the area under study did not have
adequate potential zones for ground water exploration. Only three VES points has
potential zone for groundwater exploration which may be used for hand dug wells. The
good part of the findings is that money should not be invested in bore hole drilling on
the area under study. In practice some of the areas that are potential zones can be
explored base on the water beneath the ground surface.
CONCLUSION
A delineation of groundwater potential using Electrical Resistivity method to determine
the depth and geo-electric units at Adamawa State University Permanent Site , Sauda
Road , Mubi North-Eastern Nigeria, was carried out, Vertical Electrical Sounding
International Research Journal of Pure and Applied Physics
Vol.8, No.1, pp.22-36,2021
Published by ECRTD-UK
ISSN 2055-009X(Print),
ISSN 2055-0103(Online)
34 @ECRTD-UK/(www.ea-journals.org)
(VES) method was used Schlumberger array has proved to be effective. Analysis of the
interpreted result has shown the nature and sub-surface lithology unit. Thus, this
includes the top soil, Alluvium, Weathered basement and Fresh basement. Base on the
resistivity values of the area ,the potential zones for groundwater exploration has been
identified which include VES 11,12 and 20 possess low resistivity values, while VES
13,14,15,16, 17,18 and19 do not possess groundwater potentials because of high
resistivity values.
Future Research
Intergraded geophysical methods such as electromagnetic, electrical resistivity method
(wenner and profiling), dipole-dipole array, gravity method and geological methods
(well inventory) could be used for future research on the study area.
Acknowledgment
We appreciate the TETFUND for sponsoring this research wok and management of The
Federal Polytechnic Mubi Adamawa State North-Eastern Nigeria for given us the
opportunity to access the fund.
Reference
Akintorinwa, O.J. and Olowolafe, T.S. (2013) Geoelectric Evaluation of Groundwater
Prospect within Zion Estate, Akure, Southwest, Nigeria. International
Journal of Water Resources and Environmental Engineering, 5, 12-28.
Anifowose, A.Y. B & Kolawole, F., (2012). Tectono-hydrological study of Akure
metropolis, Southwestern Nigeria. Special Publication of the
Nigerian Association of Hydrological Sciences.Hydrology for Disaster
Management: 106-120.
Brousse, J.J., (1963) Modern geophysical methods for subsurface water exploration:
Geophysics 28 : 633-657.
Dibal,H.U., Ogbeni,E.M.,Yenne,E.Y., Daspan,R.I. and Daku,S.S., (2016).. An
Integrated Method of Groundwater Potential Mapping of parts of
Naraguta Sheet 168NE, North-Central Nigeria. Water Resources.
Journal of Nigeria Association of Hydrogeologists 26:55-78.
Kasidi, S and Lazarus G. Ndatuwong (2017).Application of Vertical Electrical
Sounding (VES) Delineating of Groundwater Potential in Some Part of
Jalingo,Taraba State North Eastern Nigeria. International journal for
research in Applied Science and engineering technology pp 558-566.
Lazarus, G.N., Sunday, A & Usman,A. (2020). Delineation of Groundwater Potential
using Electrical Resistivity Method at Gidan Madara Mubi - South,
Adamawa State, North Eastern Nigeria. International Journal of
Engineering Research & Technology (IJERT). 9(7):190 – 194.
McMurry, J. &Fay, R.C., (2004). Hydrogen, Oxygen and Water in McMurry Fay
Chemistry. K.P. Hamann, (Ed.). 4th Edn. New Jersey: Pearson
Education, pp: 575-599.
International Research Journal of Pure and Applied Physics
Vol.8, No.1, pp.22-36,2021
Published by ECRTD-UK
ISSN 2055-009X(Print),
ISSN 2055-0103(Online)
35 @ECRTD-UK/(www.ea-journals.org)
Mendie, U. (2005). The Nature of Water. : The Theory and Practice of Clean Water
Production for Domestic and Industrial Use. Lagos: Lacto-Medals
Publishers, pp: 1-21.
Mogaji, K. A., Aboyeji, O.S & Omosuyi, G.O., (2011). Mapping of Lineaments for
Groundwater Targeting in Basement Complex Area of Ondo State
using Remotely Sensed Data and Geographic Information System
(GIS) Techniques. International Journal of Water Resources and
Environmental Engineering, 3(7): 150-160.
Mohammed , LN, Aboh, H.O and Emenike , E.A (2007). A region geoelectric
investigation for groundwater exploration in Minna area , North west
Nigeria. Science World Journal 2(3):15-19.
Niwas, S., & de Lima, O. A. L. (2003). Aquifer Parameter Estimation From Surface
Resistivity Data. Groundwater, 41(1): 94-99.
Nggada Ibrahim Sikami and Nur Ahmed (2017).Geo-electrical Survey for
Groundwater Potential of Biu and Environs,North Eastern Nigeria. World
Journal of Applied Physics. 2 (3) 59-70.
Obiefuna, G. I, A., Nur, A., Baba, U. & Bassey, N.E.,(1999). Geological and
geotechnical assessment of selected gully sites Yola Area Northeast,
Nigeria. Environmental hydrology Journal 7(6):1-13.
Odeyemi, I.B., Anifowose, A. Y. B., & Asiwaju-Bello, Y.A., (1999). Remote Sensing
Fracture Characteristics of Pan African Granite Batholiths in the
Basement Complex of Parts of South Western Nigeria. Journal of
Technoscience, 3: 56-60.
Olorunfemi, M.O. & Fasuyi, S. A., (1993). Aquifer Typesand The Geoelectric/
Hydrogeologic Characteristics of part of the central basementterrain of
Nigeria (Niger State). Journal of African Earth Sciences, 16 (3): 309-317.
Olorunfemi, M.O., Ojo, J.S. & Akintunde, O.M., (1999). Hydro-geophysical
Evaluation of The Groundwater Potentials of The Akure
Metropolis,Southwestern Nigeria. Journal of Mining and Geology, 35
(2): 207-228.
Okpoli, C.C. (2017). Hydrogeochemistry of water resources of Oka municipality.
Geoscience Resources. 2(1): 46–58.
Srinivasan, K., Poongothai, S. & Chidambaram, S. (2013). Identification of
Groundwater Potential Zone by Using GIS and Electrical Resistivity
Techniques in and around the Wellington Reservoir, Cuddalore District,
Tamilnadu, India. European Scientific Journal, 9 (17): 312-331.
Vanloon, G.W. and Duffy, S.J. (2005). The Hydrosphere. In: Environmental
Chemistry: A Global Perspective. 2nd Edn. New York: Oxford
University Press, pp 197-211.
Worthington, P.R., (1977). Geophysical Investigations of Groundwater Resources in
the KalahariBasin. Geophysics. 42 (4): 838-849.
Yenne, E. Y.,(2015). Integration of Remote Sensing and Electrical Resistivity Methods
in Groundwater Potentials Mapping of Akure, Southwestern Nigeria.
Unpublished M.Tech.Thesis, Federal University of Technology,
Akure, pp 178.

International Research Journal of Pure and Applied Physics
Vol.8, No.1, pp.22-36,2021
Published by ECRTD-UK
ISSN 2055-009X(Print),
ISSN 2055-0103(Online)
36 @ECRTD-UK/(www.ea-journals.org)
We appreciate the Tertiary Education Trust Fund for financial support
Recommended