Big Data in Radiation Oncology
Andre DekkerDepartment of Radiation Oncology (MAASTRO)GROW - Maastricht University Medical Centre +Maastricht, The Netherlands
SLIDES AVAILABLE ON SLIDESHARE (slideshare.net/AndreDekker)

2
Disclosures• Research collaborations incl. funding and speaker honoraria
– Varian (VATE, SAGE, ROO, chinaCAT, euroCAT), Siemens (euroCAT), Sohard (SeDI, CloudAtlas), Mirada Medical (CloudAtlas), Philips (EURECA, TraIT, SWIFT-RT, BIONIC), Xerox (EURECA), De Praktijkindex (DLRA), ptTheragnostic (DART, Strategy), CZ (My Best Treatment)
• Public research funding– Radiomics (USA-NIH/U01CA143062), euroCAT(EU-Interreg), duCAT&Strategy
(NL-STW), EURECA (EU-FP7), SeDI & CloudAtlas & DART (EU-EUROSTARS), TraIT (NL-CTMM), DLRA (NL-NVRO), BIONIC (NWO)
• Spin-offs and commercial ventures– MAASTRO Innovations B.V. (CSO)– Various patents on medical machine learning

3
TROG 2017 talks• Learning outcome prediction models from
cancer data– Technical Research Workshop, Monday 840-910,
followed by Panel Discussion• Big Data in Radiation Oncology
– Statistical Methods, Evidence Appraisal and Research for Trainees, Monday 1450-1520
• Knowledge Engineering in Oncology– TROG Plenary, Tuesday, 925-1000
• Radiomics for Oncology– TROG Plenary, Thursday, 1150-1220
Some Overlap
NoOverlap

4
Learning objectivesAfter the lecture, attendees should be able to• Name the major sources of cancer data and their absolute and
relative size• Itemize steps in the methodology to go from data to models• Appraise papers that describe models incl. using TRIPOD• Grasp challenges and opportunities to use models to improve care

The Data Part
6
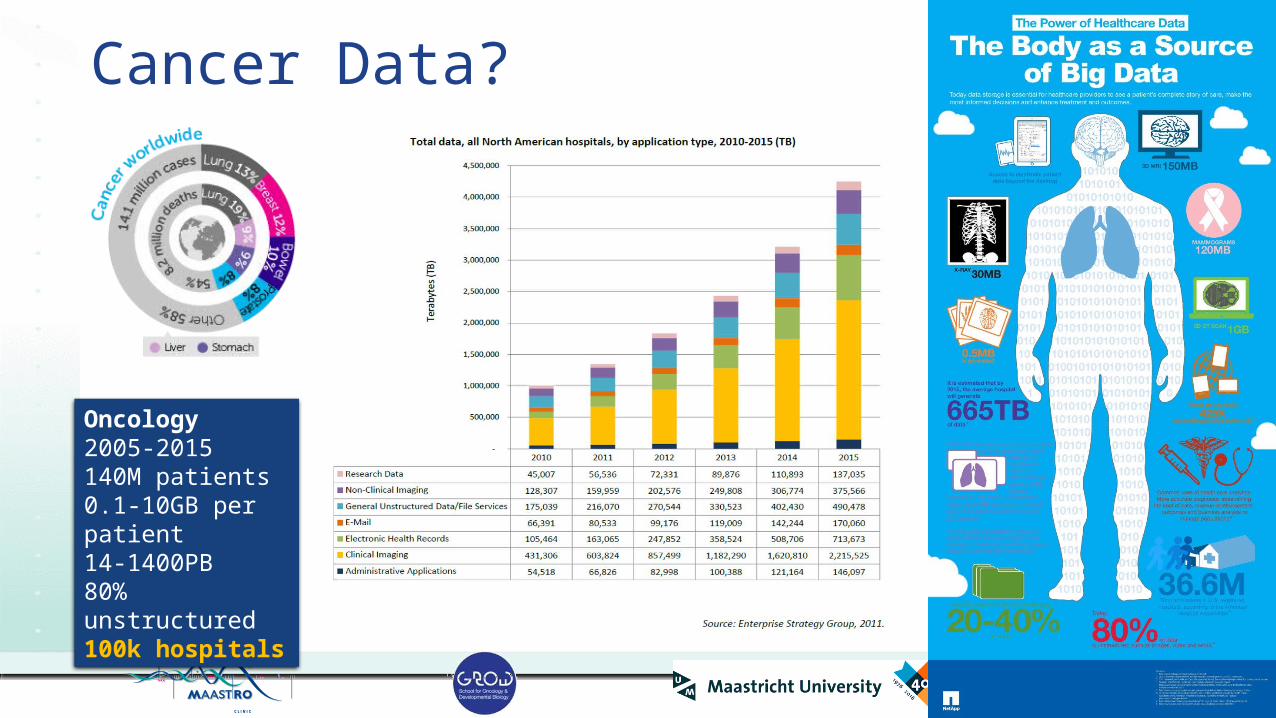
Cancer Data?
Oncology2005-2015140M patients0.1-10GB per patient14-1400PB80% unstructured100k hospitals

7
Data landscape• Clinical research
• 3% of patients• 100% of features• 5% missing• 285 data points
• Clinical registries• 100% of patients• 3% of features• 20% missing• 240 data points
• Clinical routine• 100% of patients• 100% of features• 80% missing• 2000 data points
Data elementsPatients

8
Our approach• euroCAT: https://
www.youtube.com/watch?v=ZDJFOxpwqEA

The Modelling Part
10
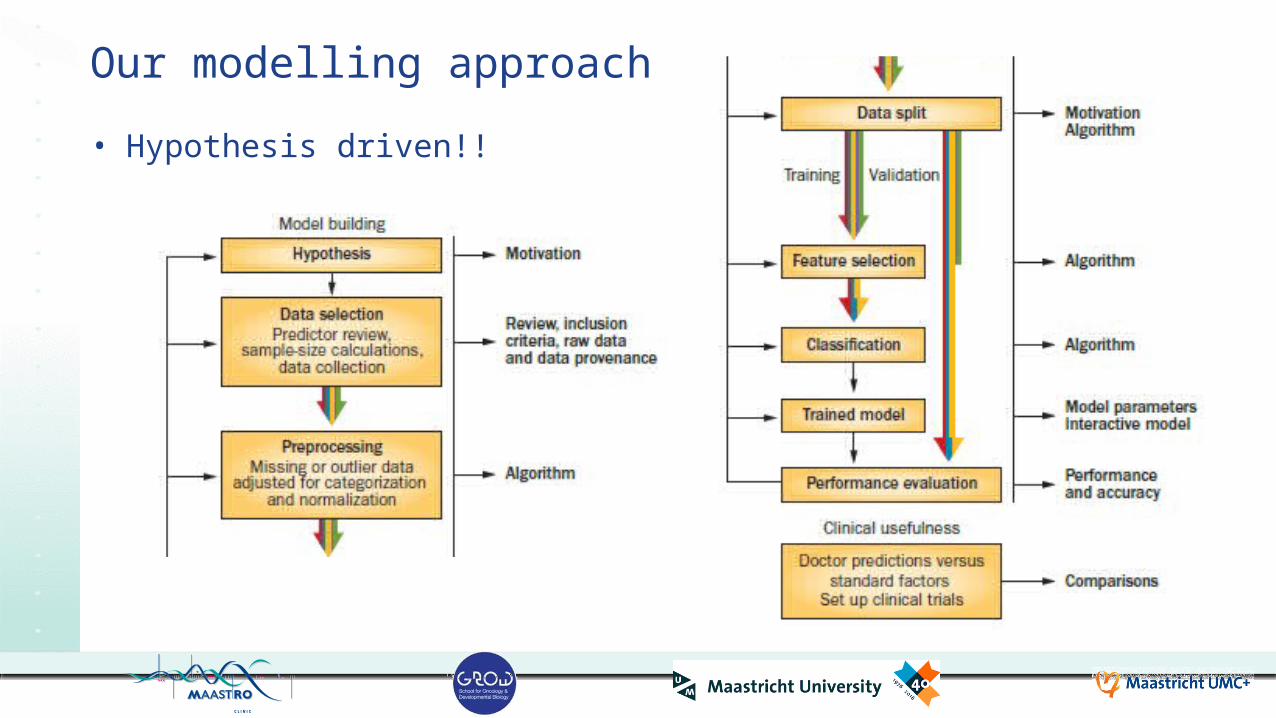
Our modelling approach• Hypothesis driven!!

11
How much data do you need?• Rule of thumb. Min. 10 events per input feature
• 200 NSCLC patients• 25% survival at two years• 50 events
• 10 input features• Simpler models are better Source: vitalflux.com (2017)
12
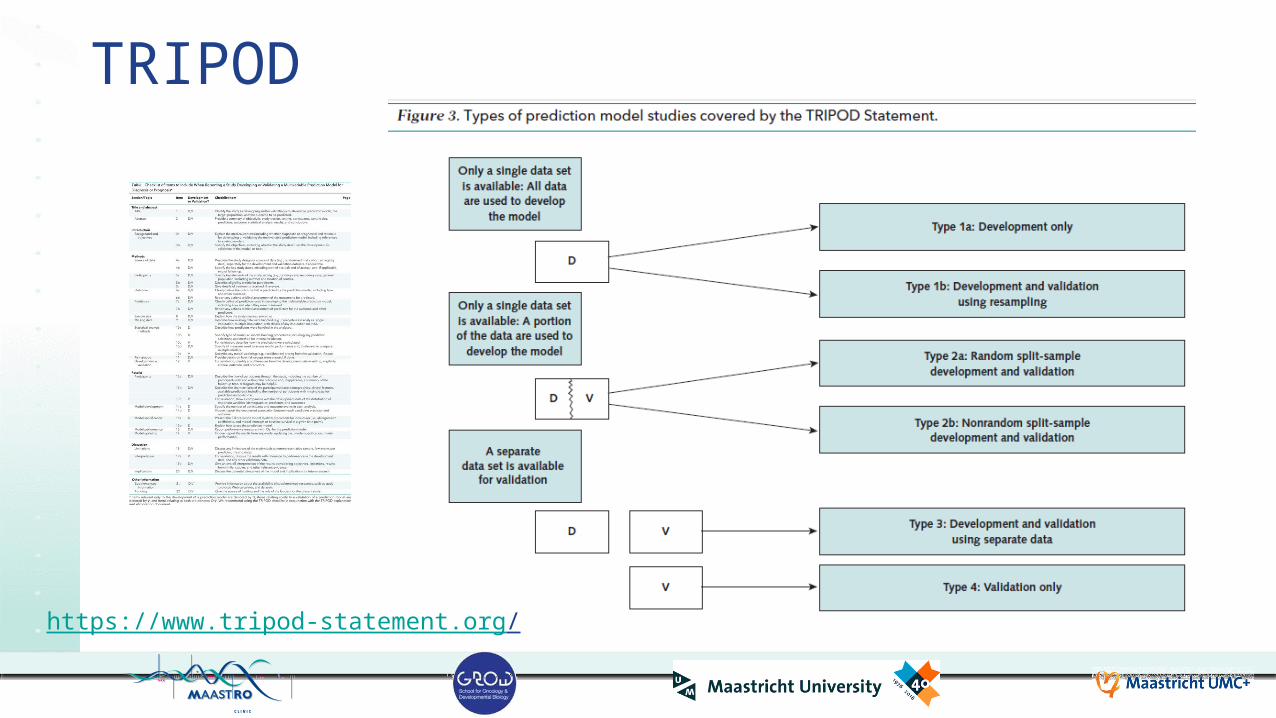
TRIPOD
https://www.tripod-statement.org/

13
Dehing-Oberije (MAASTRO), IJROBP 2009;74:355
Learn a model from data• Training cohort
– 322 patients (MAASTRO)• Clinical variables• Support Vector Machines• Nomogram
Cary Oberije et al.

14
Estimate model performance• Validation
cohort• 36 patients
(Leuven)• 65 patients (Ghent)
• Discrimination, Calibration
• AUC 0.75Dehing-Oberije (MAASTRO), IJROBP 2009;74:355
Cary Oberije et al.

15
Decision SupportStage IIIA 10 (14%)Stage IIIB 13 (19%)T4 12 (17%)
Cary Oberije et al.
Better Care?

17
There is an app for that
18
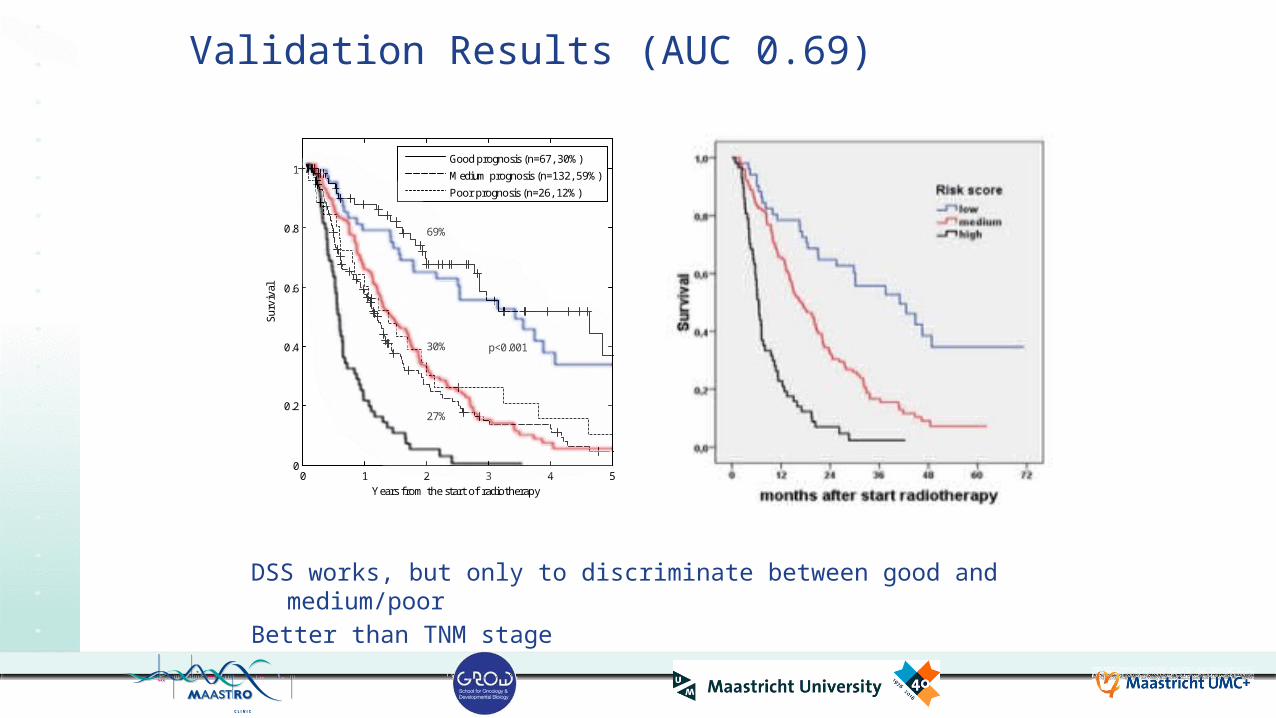
Validation Results (AUC 0.69)
DSS works, but only to discriminate between good and medium/poorBetter than TNM stage
0 1 2 3 4 50
0.2
0.4
0.6
0.8
1
Surv
ival
Years from the start of radiotherapy
69%
27%
30% p<0.001
Good prognosis (n=67, 30%)Medium prognosis (n=132, 59%)Poor prognosis (n=26, 12%)

19
Guideline vs. the real world in lung cancer
PalliativeRT/Chemo
Radical RT
SequentialChemo-RT
ConcurrentChemo-RT
EscalatedChemo-RT
100%
50%50%

20
What did Liverpool learn?
routine data, realistic quality, good evidence?
0 1 2 3 4 50
0.2
0.4
0.6
0.8
1Su
rviv
al
Years from the start of radiotherapy
69%
27%
30% p<0.001
Good prognosis (n=67, 30%)Medium prognosis (n=132, 59%)Poor prognosis (n=26, 12%)
0 1 2 3 4 50
0.2
0.4
0.6
0.8
1
Surv
ival
Years from the start of radiotherapy
18%
16%16%
Good prognosis (n=41, 17%)Medium prognosis (n=112, 47%)Poor prognosis (n=84, 35%)
• Rethink palliative treatments in good prognosis patients
• Rethink curative treatments in poor prognosis patients
radi
cal R
T tre
atm
ents
pallia
tive
RT
treat
men
ts Rapid learning: Expected survival gain with curative dose from 18 to ~60% in good prognosis patients
Rapid learning: No survival gain with curative dose in poor prognosis patients
What did MAASTRO learn?

21
There is an app for that
22
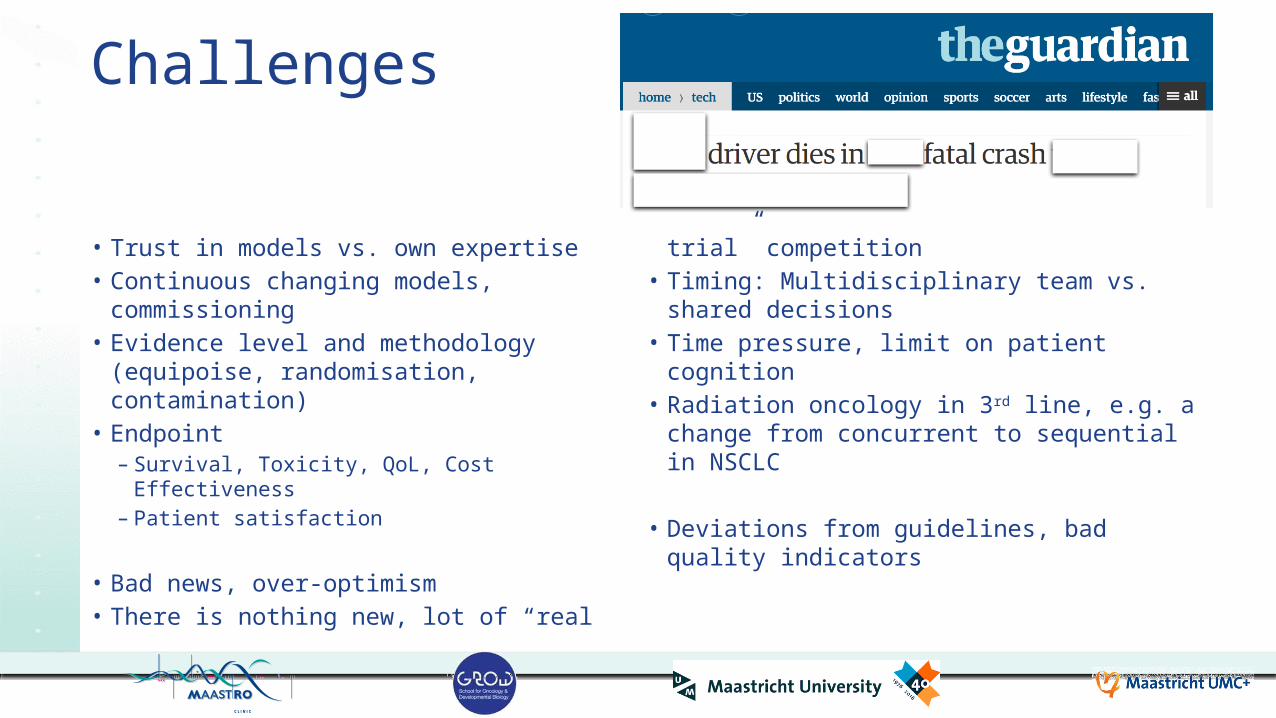
Challenges
• Trust in models vs. own expertise• Continuous changing models,
commissioning• Evidence level and methodology
(equipoise, randomisation, contamination)
• Endpoint– Survival, Toxicity, QoL, Cost Effectiveness– Patient satisfaction
• Bad news, over-optimism
• There is nothing new, lot of “real trial” competition
• Timing: Multidisciplinary team vs. shared decisions
• Time pressure, limit on patient cognition• Radiation oncology in 3rd line, e.g. a
change from concurrent to sequential in NSCLC
• Deviations from guidelines, bad quality indicators

23
Learning objectivesAfter the lecture, attendees should be able to• Name the major sources of cancer data and their absolute and
relative size• Itemize steps in the methodology to go from data to models• Appraise papers that describe models incl. using TRIPOD• Grasp challenges and opportunities to use models to improve care

24
Acknowledgements• Fudan Cancer Center, Shanghai,
China• Varian, Palo Alto, CA, USA• Siemens, Malvern, PA, USA• RTOG, Philadelphia, PA, USA• MAASTRO, Maastricht, Netherlands• Policlinico Gemelli, Roma, Italy• UH Ghent, Belgium• UZ Leuven, Belgium• Radboud, Nijmegen, Netherlands• University of Sydney, Australia• University of Michigan, Ann Arbor,
USA
• Liverpool and Macarthur CC, Australia
• CHU Liege, Belgium• Uniklinikum Aachen, Germany• LOC Genk/Hasselt, Belgium• Princess Margaret CC, Canada• The Christie, Manchester, UK• UH Leuven, Belgium• State Hospital, Rovigo, Italy• Illawarra Shoalhaven CC, Australia • Catharina Zkh Eindhoven,
Netherlands• Philips, Eindhoven, NetherlandsMore info on: www.predictcancer.org www.cancerdata.org
www.eurocat.info www.mistir.info
Thank you for your attention
Andre DekkerDepartment of Radiation Oncology (MAASTRO)GROW - Maastricht University Medical Centre +Maastricht, The Netherlands
Recommended