Degree/Certificate/Transfer/Completion Data
Tracked through
Educational and Facilities Master Plan

� � � � � � � � � � � � � � � � � � � � � � � � � � � � � � � � � � � � � � � � � � ��������
CHAPTER 2 – THE DISTRICT AND THE COLLEGE
The number of associate of arts degrees has declined by close to 100 degree annually in recent years (see Figure 10). Conversely, the number of associate of science degrees has increased sharply, from 354 degree in 2005/06 to 583 degrees in 2011/12.
The number of certificates awarded from 18 to 30 units and 30 to 60 units has also increased over this time period. Combined, the College awarded 393 certificates in these two categories in 2011/12, an increase from just 46 in 2005/06.
The number of COC students transferring to one of the University of California’s campuses has increased steadily in recent years, from 96 in 2000/01 to 195 in 2010/11 (see Figure 11). The number of students transferring to a California State University (CSU) campus increased from 423 in 2000/01 to 697 in 2007/08.
However, since 2007/08, the number of CSU transfer students has declined to 605. This is likely the result of restrictions in access at CSU in recent years. These restrictions are likely to continue into future years.
����������� Number of Degrees and Certificates Awarded
����������� Number of Student Transfers to University of California and California State University
� � � � � � � � � � � � � � � � �

Degree/Certificate/Transfer/Completion Data
Tracked through
Fact Sheet

College of the Canyons founded: 1969
College Service Area: 367 square miles
Valencia Campus size: 153.4 acres
Valencia Campus Buildings: 728,648 square feet
as of 07/2013)
Canyon Country Campus size: 70 acres
Canyon Country Campus Buildings: 59,192
square feet
Student Computer Labs: 57
Median Class Size: 31
Median Age of Students: 21
Headcount:
Fall 2012: 16,333
Projected — 2021: 27,807
Funded Growth Rate:
2011/2012 — decreased 8% Systemwide
2013/2014 — increased 1.63% Systemwide Note: While the rate “increased”, it actually just provided more
“access”
Networked Computers: 3,087
Intercollegiate Sports:
Men’s 8
Women’s 8
Grants Received in 2012/2013: $5,079,195
Degree Programs:
AA/AS Majors: 68
Certificates of Achievement: 36
Certificates of Specialization: 29
Certificates of Competency (Non-credit): 6
2012/2013 Adopted Budget:
2013/14 General Fund Expenditures and
Ending Fund Balance: $88.4 Million
2013/14 All Fund Expenditures and Ending
Fund Balance: $184.9 Million
Newest Program/New Curricula:
ENGL-096 “Accelerated Preparation for Col-
lege Reading and Writing”. Provides an accel-
erated path for students to English 101.
MATH-075 “Intermediate Algebra for Statis-
tics”. An accelerated course that takes neces-
sary Algebra topics from MATH-060 and
MATH-070 and puts it together with Data
Analysis and other pre-statistics topics. The
course will replace MATH-060 and MATH-
070 in the math sequence, but only for non-
STEM (Science, Technology, and Engineering
Majors) and non-business majors.
First Year Experience Program:
Comprehensive program for freshmen entering
from the Hart District who place below transfer
-level math and/or English.
Started in Fall 2010
Served nearly 850 students since Fall 2010
Compared to other first –time freshman en-
rolled in the same courses, FYE students had
higher success rates in 2011-12.
FYE students had higher Fall to Spring and Fall
to Fall persistence rates compared to other first-
time freshman.
Supplemental Learning Program:
Designed to support student success, particular-
ly in areas of high need, such as literacy, math
skills, learning skills, and courses that are tradi-
tionally difficult for students.
Over 18,000 students participated in more than
2,300 activities since Spring 2010.
Students who participate in Supplemental
Learning have higher success rates compared to
students who do not and are enrolled in the
same courses.
Dr. Dianne G. Van Hook University Center:
Unduplicated Headcount: 10,593 (1/2002-
6/2013)
Student Profile—Fall 2012
Fall 2012 Enrollment
Headcount 16,333
Basic Stats
Enrollment Characteristics
Fact Sheet
Dr. Dianne G. Van Hook
Chancellor
44 Degree Programs (as of 7/2013)
6 Partners (as of 7/2013)
110,000 square feet
Opened Fall 2009
Degrees Awarded: 1,839
Canyon Country Campus:
Campus Opened: August 2007
Facilities:
29 Classrooms
Student Services & Administrative
Offices
Skills 4 Success Center
Applied Technology Education Center
Launched Environmental Science degree
Outdoor Research and Demonstration
Garden
Number of Students: 5,334 (Fall 2013)
32,289 unduplicated students have attended
CCC since 2007
Enrollment growth from 200 sections in Fall
2009 to 314 sections Fall 2013
Web page: http://www.canyons.edu
4,8236,486
9,029
15,053
23,416
16,333
0
5,000
10,000
15,000
20,000
25,000
1988 1993 1998 2003 2008 2012
Nu
mb
er
of
Stu
de
nts

Resident Tuition & Fee History: Full-Time Students
2011/12 Tuition & Fees for Full-Time Students
2011/12 Financial Awards: $21,062,053 (Federal and State
aid) - 2012/13 data will be available October 2013
Tuition & Financial Aid 2011 / 2012
Faculty & Staff Fall 2012
Resident $1154*
Fee per unit $46
Annual Student Center Fee $1 per unit/$10 max
Health Fee (Fall & Spring) $20
Student Representation $1 per semester
Out of State $5,450*
Fee per unit
$169 per unit plus $46/unit
plus $10/unit capital outlay
fee
Annual Student Center Fee $1 per unit/$10 max
Student Representation $1 per semester
Headcount
Full-Time Faculty 170
Adjunct Faculty 507
Classified Administrator 52
Educational Administrator 26
Classified Staff 221
Top 10 Certificates of Achievement
Awarded in 2011/12
Number
Awarded
Transfer Studies: IGETC/CSU GE
Breadth 280
Accounting 15
Water Systems Technology 15
Human Resources Management 9
Computer Applications/Administration 8
Interior Design & Merchandising 8
Fire Technology 8
Culinary Arts 7
Photography 6
Biotechnology 4
Top 10 Associate Degrees
Awarded in 2011/12
Number
Awarded
Biological and Physical Sciences 154
Social Science 143
Accounting 119
Registered Nurse 108
Transfer Studies 47
Psychology 43
Fire Technology 38
Early Childhood Education 37
Mathematics 36
Art 33
Degrees Conferred 2009/10—2011/2012
2009/10 2010/11 2011/12
AA/AS 929 1,030 1,092
Certificates* 351 789 723
*Certificates of Achievement and Specialization
0
2,000
4,000
6,000
8,000
10,000
12,000
14,000Community of Students Residency
Fall 2008
Fall 2009
Fall 2010
Fall 2011
Fall 2012
5.2%
9.3%
36.5%
0.4%
43.9%
1.3%3.5% Student Demographics: Fall 2012
Afr ican American
Asi an / PacificIslanderLatino/Hispanic
Native American
White
Unknown/Decline toSta teOther/Multi-Racial
Note: 2012/13 data will be available October 2013
Fall 2009 Cohort COC State
Transfer & Completion Rate 41% 39%
Student-Right-To-Know Rates
In compliance with the Student-Right-to-Know and
Campus Security Act of 1990 (Public Law 101-
542), it is the policy of the Santa Clarita Communi-
ty College District and College of the Canyons
to make available its completion and transfer rates to
all current and prospective students. Beginning in Fall
2009, a cohort of all certificate-, degree-, transfer-
seeking, full-time, and first-time freshmen students
were tracked over a three-year period. The table be-
low illustrates the College's completion and transfer
rates compared to the State's rates for the same time
period. *Note that these rates do not represent the success
rates of the entire student population at COC as they
exclude part-time students and students indicating
“undecided” for their educational goal. Also, the rates
do not account for students graduating after this three-
year tracking period. As mandated by PL 101-542.
Financial Aid Applicants 20101-2012: 7,633
*Assumes 12 units in Fall and Spring, each for a total of 24 units.
931
1,090 1,103
1,2951,374
1,085
735649
535
0
200
400
600
800
1,000
1,200
1,400
1,600
2004 2005 2006 2007 2008 2009 2010 2011 2012
Nu
mb
er
of S
tud
en
tsConcurrent Enrollment Trends: Fall 2003-2012

Degree/Certificate/Transfer/Completion Data
Tracked through
Fact Book

96 Santa Clarita Community College District
Associate Degrees and Certificates—2012/13 The College awarded 1,396 degrees and/or certificates in 2012/13. The five most common majors were:
Transfer Studies: IGETC/CSU GE Breadth, Accounting, Social Science, Nursing (RN), and Psychology.
Source: SP12/13 referential file
Student Outcomes
Table 38.
Degrees & Certificates #
Awarded Degrees & Certificates
#Awarded
Degrees & Certificates #
Awarded
Accounting 97 Engineering, transfer 5 Multimedia 1
Administration of Justice 38 English 29 Music 3
American Sign Language Interpreting 8 Film/Video Production 1 Paralegal Studies 16
Animation 5 Fire Technology 17 Photography 4
Architectural Drafting & Technology 4 French 2 Psychology 67
Art 23 Graphic Design 8 Real Estate 0
Athletic Training 4 History 28 Registered Nurse 83
Automotive Technology 1 Hotel & Restaurant Mgmt 7 Radio/Television/Film: Audio/Radio 1
Biological and Physical Sciences 58 Humanities 9 Radio/Television/Film: Television 1
Business Mgmt 8 Interior Design & Merchandising 8 Recreation Mgmt 3
Commercial Photography 7 Journalism 6 Social Science, general 92 Computer Applications/Admin Asst. 11 Kinesiology 14 Sociology 37
Computer Networking 8 Land Surveying 1 Spanish 8
Computer Science, transfer 4 Liberal Arts & Sciences, general 8 Speech Communications 17
Construction Mgmt Technology 8 Library Media Technology 0 Transfer Studies 490
Culinary Arts 6 Manufacturing Technology 1 Water Systems Technology 13
Dramatic Arts 8 Marketing 14 Welding Technology 0
Early Childhood Education 36 Mathematics 35 Total 1,396
Revised 04/14, Next Revision 10/14

Just the Facts 97
Figure 50. Degrees and Certificates Awarded to 2006/07 to 2012/13
The most common educational awards of stu-dents were associate degrees. Certificate pro-grams requiring between 30 and 60 units or more than 60 units have not awarded many certificates, largely due to the elimination of the programs, until 2009/10 when transfer certifi-cates were awarded. For the first time in the past 14 years the college awarded more Asso-ciate of Science degrees than Associate of Arts degrees. In fact, 2011/12 recorded the highest number of Associate of Science degrees awarded in the College’s history. The highest number of degrees and certificates in the Col-lege’s history were awarded in 2010/11 (1,566). 2013/14 award data will be available in October 2014. Source: SP referential files.
Student Outcomes
Num
ber o
f Deg
rees
/Cer
tific
ates
Revised 04/14, Next Revision 10/14

Just the Facts 99
Figure 51. Number of Transfers to UC and CSU
A major component of California’s Master Plan for Higher Education is for students to be able to begin their college education at a community college and transfer to a four-year college or university. For College of the Canyons, the numbers of transfers to both CSU and UC have been growing over the past 10 years (2002-03 to 2012-13), as is de-picted in Figure 50. The decrease in 2008-09 and 2009-10 is likely the result of reduced admission slots available at the UCs and CSUs due to the budget cuts. While the number of COC students who transferred to UC and CSU in-creased to 64 percent and 66 percent, respectively, in 2011-12, numbers decreased again in 2012-13. This decrease may be due to a variety of factors, including students opting to attend out-of-state or private institutions and budget cuts. The top three UC transfer institutions for COC in 2012/13 were UC Los Angeles (UCLA), followed by UC Santa Barba-ra (UCSB), and UC Davis. The top three CSU transfer institutions for COC students in 2012/13 were CSU Northridge (CSUN), followed by CSU Long Beach (CSULB), and CSU Channel Islands (CSUCI).
Student Outcomes
Transfers and Completion
Source: CCCCO http://extranet.cccco.edu/Divisions/TechResearchInfoSys/Research.aspx
Revised 04/14 Next Revision 03/15
Num
ber o
f Stu
dent
s

Just the Facts 101
Student Outcomes Another set of outcomes analyses is based on Federal Student-Right-to-Know measures. These indicators track cohorts of stu-dents who were full-time, first-time freshmen, who were interested in obtaining a certificate, degree, or transferring. Completion is defined as completing a certificate or degree or becoming “transfer prepared” by complet-ing 56 transferable units with a GPA of 2.0 or better. The transfer rate reflects students who transfer to another postsecondary institution, (UC, CSU, or California Community College) prior to attaining a degree, certificate, or be-coming transfer prepared. After the three-year period students were tracked, the combined completion and transfer rate was 41 percent for COC, compared to 39 percent for the State. While the rates are higher than statewide, the College is actively engaged in efforts aimed at improving these rates.
Figure 52. Completion & Transfer Rate of First-Time, Full-Time, Degree, or Certificate Seeking Students by Cohort Year
Figure 53. Completion & Transfer Rate of 2009 First-Time, Full-Time, Degree, or Certificate Seeking Students: COC vs. the State
Source: California Community College Chancellor’s Office
Per
cent
age
Combined 41 Combined 39
Per
cent
age
of S
tude
nts
Revised 04/14, Next Revision 03/15

Degree/Certificate/Transfer/Completion Data
Tracked through
Research Briefs

Research Brief #57
April 2013
College of the Canyons Completion Rates Barry C. Gribbons, Ph.D. and Daylene M. Meuschke, Ed.D.
The California Community College Chancellor’s Office released the Student Success Scorecard on April 9, 2013. The scorecard includes data for each community college in the state, including College of the Canyons (COC). Tables 1 and 2 provide an overview of a key indicator, completion. The data are disaggregated by ethnicity. Table 1 includes data for students who were “prepared” for college. Table 2 includes data for students who were “unprepared” for college.
It is important to include some technical notes. The data are for first time students in 2006/07 that completed at least 6 units of classes and attempted an English or math course in their first three years. Completion was defined as earning an associate degree, certificate (approved by the Chancellor’s Office), transfer to a four-year institution, or achieved “transfer prepared.” Transfer prepared is defined as completing 60 CSU/UC transferable units with a grade point average of at least 2.0. Data summarized in Table 1 are for “Prepared” students that attempted degree applicable math courses or transferable English courses. If they attempted both English and Math, the lowest level course had to be both degree applicable math courses and transferable English courses. In other words, they could not have enrolled in remedial math or English courses. “Unprepared” students were students who enrolled in remedial English or math courses.
Table 1. Comparison of Completion Rates for Students "Prepared" for College-level Coursework
Completion Rate - Prepared
College of the
Canyons Statewide
Antelope Valley College
Glendale College
LA Mission College
Pasadena City
College Ventura College
Overall 79.2% 71.2% 69.3% 77.6% 73.1% 74.1% 71.5% African American 85.7% 65.9% 63.0% 64.3% 100.0% 52.2% 76.9% American Indian/Alaskan 100.0% 59.5% 100.0% 33.3% NA 33.3% 70.0% Asian 92.4% 82.2% 88.0% 80.2% 100.0% 81.1% 76.5% Filipino 81.0% 71.4% 81.5% 61.7% 85.7% 69.6% 81.3% Hispanic 72.4% 64.7% 63.1% 63.3% 68.5% 56.5% 73.1% Pacific Islander NA 58.3% 100.0% 71.4% 100.0% 77.8% 25.0% White 76.3% 70.5% 68.6% 81.8% 73.7% 74.2% 69.1%
Table 2. Comparison of Completion Rates for Students "Unprepared" for College-level Coursework
Completion Rate - Unprepared
College of the
Canyons Statewide
Antelope Valley College
Glendale College
LA Mission College
Pasadena City
College Ventura College
Overall 49.2% 41.1% 37.0% 42.1% 30.4% 44.2% 42.3% African American 41.0% 35.0% 33.6% 40.0% 25.0% 37.5% 50.0% American Indian/Alaskan 27.3% 31.6% 31.3% 11.1% 20.0% 57.1% 28.6% Asian 59.5% 57.9% 52.9% 48.4% 63.2% 57.7% 60.0% Filipino 57.3% 43.1% 27.3% 53.8% 31.3% 49.6% 56.5% Hispanic 39.9% 34.8% 36.3% 29.8% 29.3% 32.5% 37.7% Pacific Islander 26.7% 35.8% 25.0% 40.0% 50.0% 57.1% 40.0% White 52.9% 44.0% 39.8% 47.4% 35.1% 49.5% 47.6%

Institutional Development and Technology 2
The following is a summary of patterns observed in Tables 1 and 2:
• Completion rates for both COC Prepared and Unprepared groups were higher than the statewide average.
• Completion rates for both COC Prepared and Unprepared groups were higher than neighboring colleges, including Antelope Valley College, Glendale College, LA Mission, Pasadena City College, and Ventura College.
• The three largest ethnic groups of students at COC are White (41 percent), Latino (39 percent), and African American (7 percent) and compared favorable to similar ethnic groups statewide and at neighboring colleges. More specifically:
o White students, both prepared and unprepared, at COC had higher completion rates than the average statewide and for 9 out of 10 comparisons to neighboring colleges.
o Latino students, both prepared and unprepared, at COC had higher completion rates than the average statewide and for 9 out of 10 comparisons to neighboring colleges.
o African American students, both prepared and unprepared, at COC had higher completion rates than the average statewide and for 8 out of 10 comparisons to neighboring colleges.
Planned Actions in Response to 2013 Scorecard Data
While these data are positive, the College has many efforts intended to further increase the success of students in completing their educational goals. More specifically, the college has the following efforts underway:
• Redesigning the First-Year Experience (FYE) program to include learning communities based on a pathways model,
• Providing Career Coaches at the local high schools to help students identify career pathways available through community college programs and certificates and to help students see the connection between education and a career,
• Increasing services for reentry and veterans, including developing learning communities for programs that can be completed within the timeframe of veterans’ benefits,
• Aligning with the local high school district to develop resources for students including a sample transfer level writing prompts and assessment rubrics for distribution to high school faculty, a brochure and presentation for high school students, parents, and educators emphasizing the importance of continued math education throughout high school,
• Expanding the Supplemental Learning program, • Offering accelerated curriculum in English and math, • Implementing an online tutorial for first-time students which will include a one-semester educational
plan, • Reformulating the college’s online student orientation, • Creating and customizing an online student advising system that teaches students how to create a one
semester education plan, • Developing two-year course offering plans for programs and revisiting enrollment management
strategies to ensure student progress, • Offering a Skilled Teacher Certificate program for full and part-time faculty, • Offering noncredit summer bridge courses to improve transitions from noncredit to credit courses and to
improve readiness for students entering college,

Institutional Development and Technology 3
• Increasing learning community offerings, including thematically linked courses and accelerated cohorts, • Offering in-demand college courses on high school campuses through the College Now program, • Allowing students who score “proficient” on the English portion of the Early Assessment Program
(EAP) to enroll in English-101, • Working with Hart District in implementing the Common Core standards and College & Career
Readiness concepts, • Participating in the Association of American Colleges & Universities (AAC&U) Roadmap Project to
expand and improve existing programs like First Year Experience and in implementing a coordinated Learning Communities program, and
• Redesigning the college’s Skills4Success website to improve student and faculty access to information on support programs like Supplemental Learning and FYE and resources.
The effectiveness of these efforts will continue to be evaluated. Additionally, other indicators of student learning and success will continue to be evaluated to inform the development of programs and services.
For more detailed information on this research brief, stop by the Institutional Development and Technology office located in BONH-224, or call Daylene Meuschke, Director of Institutional Research at 661.362.5329.

Research Brief #33 July 2010
Transfer Volumes, Rates, Definitions and Issues Affecting Transfers Daylene M. Meuschke, Ed.D. and Barry C. Gribbons, Ph.D.
A major component of California’s Master Plan for Higher Education is for students to be able to begin their college education at a community college and transfer to a four-year college or university. This Research Brief provides the latest transfer information for College of the Canyons transfer students. More specifically, it includes information on where College of the Canyons students transfer to, issues related to budget cuts, transfer rates, performance of transfer students, transfer requirements, and the Transfer Center at College of the Canyons.
According to the California Postsecondary Education Commission (2010), College of the Canyons students transfer to a variety of colleges and universities. The top three UC and CSU transfer institutions for COC in 2008-09, each, were:
•UC Los Angeles (UCLA) (46 students) •CSU Northridge (CSUN) (409 students)
•UC Santa Barbara (UCSB) (25 students) •San Diego State University (SDSU) (27 students)
•UC Berkeley (UCB) (18 students) •CSU Long Beach (CSULB) and California State University and Los Angeles (CSULA) (25 students, each)
While the number of transfers to both CSU and UC for College of the Canyons has been growing over the past six years, it has slightly decreased in the past year due to issues related to budget cuts and reduction in admission slots to the UC and CSU institutions. While the overall number of COC students who transferred to
UCs and CSUs has increased over time, it has decreased approximately one and 10 percent, respectively, from 2007/08 to 2008/09. Issues related to budget cuts may partly explain this decrease.
As a result of budget cuts, the CSU system has reduced overall student enrollment (CSU Mentor) and are currently not accepting mid-year transfers. As seen in Table 1, this will significantly impact COC transfer students as the majority transfer to the CSU system. More specifically, over half (53 percent) of COC transfer students who transferred to a UC or CSU transferred to California State University, Northridge in the 2008/09 academic year (California Postsecondary Education Commission, 2010). In addition, budget cuts have resulted in a reduction of course offerings at College of the Canyons which can impact students’ ability to get classes needed for transfer. In the Fall 2009 semester, the College reduced course sections 13 percent from the Fall 2008 semester. In the Spring 2010 semester, course sections were reduced 14 percent from the Spring 2009 semester. (Note that these numbers exclude CWEE, GENSTU, ISA’s, Non-Credit, and Nursing courses). Unfortunately, these budget-related issues
66
336
82
363
96
423
123
423
122
474
124
481
127
534
136
562
161
625
155
697
142
624
0
100
200
300
400
500
600
700
800
UC CSU
Num
ber o
f Stu
dent
s
1998-99
1999-00
2000-01
2001-02
2002-03
2003-04
2004-05
2005-06
2006-07
2007-08
2008-09
Figure 1. Number of students who transfer to the UC or CSU system.

will continue to have a negative impact on transfer rates for some time and students may need to become more flexible in their transfer options, such as considering private and out-of-state institutions as well as the Dr. Dianne G. Van Hook University Center. The Dr. Dianne G. Van Hook University Center partners with public and private institutions to offer bachelors, masters, doctorate and credentialing programs. UCs and CSUs offering classes at the University Center do not have the same enrollment caps that the main UC and CSU campuses do. This provides a viable alternative for COC transfer students.
According to California College News Blog, students are transferring to private and out-of-state colleges to avoid waiting on the CSU System to accept them. During the 2007/08 school year, 434 COC students transferred to a variety of in-state private and out-of-state institutions including University of Phoenix, University of La Verne, University of Southern California, Brandman University (formerly Chapman University), Brigham Young University, Ashford University, and Arizona State University (Chancellor’s Office, 2010). Data is currently unavailable for students who transferred to in-state private and out-of-state institutions during the 2008/09 school year. If students are planning on transferring to an out-of-state institution, they should work carefully with a counselor as transfer requirements may vary. Table 1 shows the top 20 colleges and universities that College of the Canyons students transferred to in 2008/09, including CSU, UC, in-state private and out-of-state institutions.
Difference in Transfer Rate Definitions. One of the most commonly asked questions for community colleges is, “What is the transfer rate to four-year institutions?” Answering this question is not as straight forward as it might seem on the surface. In reality, it all depends on how you define transfer. There are no widely agreed upon transfer definitions in the California Community College (CCC) system. It is important to note that a student’s educational goal is not often a good predictor of transfer. Behavior is a better predictor of transfer. When examining transfer, it is also important to take into consideration the skill level at which students come to College of the Canyons (e.g., placing below transfer level math and/or English), course reductions at the College due to the State budget cuts, the student’s financial situation, and whether or not they were a full-time student. The following paragraphs provide a brief overview of three methods by which transfer rates have been examined (Student-Right-To-Know Rates, Integrated Postsecondary Education Data System, and Accountability Reporting for California Community Colleges).
Student-Right-To-Know Rates are just one method for looking at transfer rates for COC compared to the state (California Community College System as a whole). As specified by the Student-Right-to-Know (SRTK) and Campus Security Act of 1990 (Public Law 101-542), COC publishes completion and transfer rates for students who meet the SRTK cohort definitions (certificate-, degree-, or transfer-seeking, full-time, first-time freshmen, who
Transfer College or University
Number of
Students
Transfer College or University
Number of
Students
California State University - Northridge 409 Brandman University (Formerly Chapman University) 17
University of Phoenix 89 DeVry University-California 17 University of California-Los Angeles 46 San Francisco State University 17
San Diego State University 27 California State Polytechnic University, Pomona 16
University of La Verne 25 ITT Technical Institute 15 California State University - Long Beach 25 University of California, Irvine 15
California State University - Los Angeles 25 California State University, Dominguez
Hills 15
University of California-Santa Barbara 25 California State University, Channel Islands 14 University of Southern California 19 University of California, Santa Cruz 13 University of California-Berkeley 18 University of California, San Diego 12
Table 1. Top 20 Transfer Institutions for COC Students in 2008/09.
Institutional Development and Technology 2
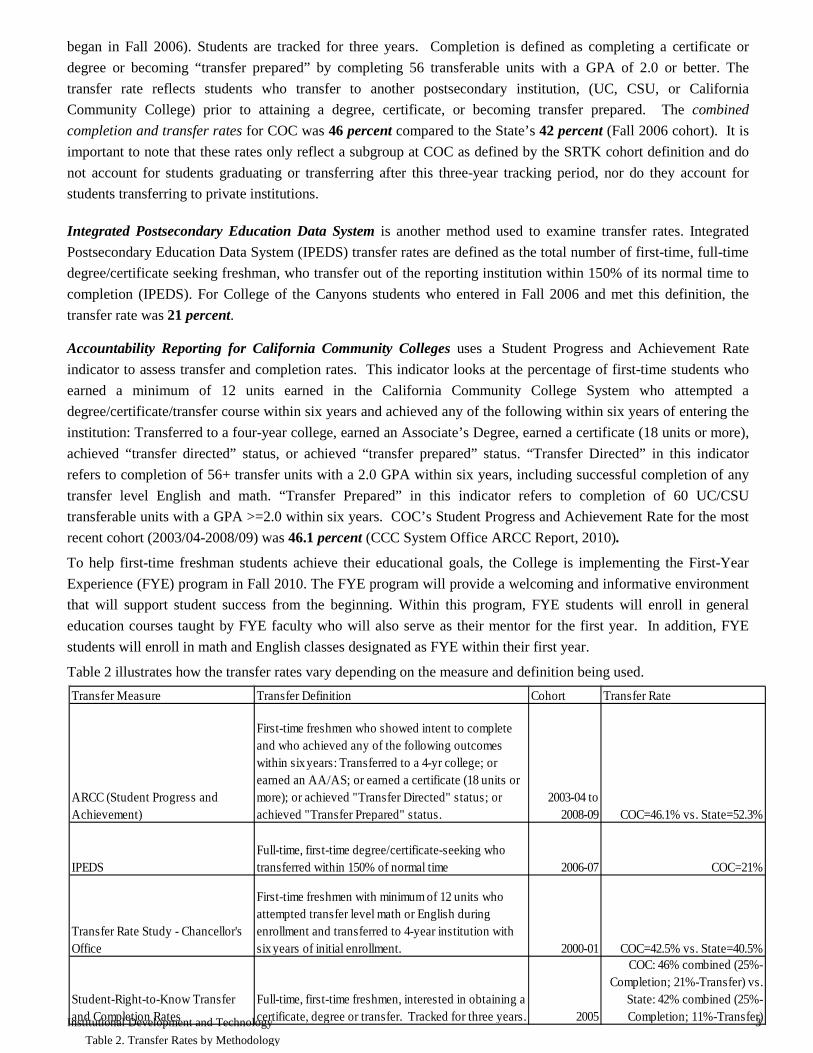
began in Fall 2006). Students are tracked for three years. Completion is defined as completing a certificate or degree or becoming “transfer prepared” by completing 56 transferable units with a GPA of 2.0 or better. The transfer rate reflects students who transfer to another postsecondary institution, (UC, CSU, or California Community College) prior to attaining a degree, certificate, or becoming transfer prepared. The combined completion and transfer rates for COC was 46 percent compared to the State’s 42 percent (Fall 2006 cohort). It is important to note that these rates only reflect a subgroup at COC as defined by the SRTK cohort definition and do not account for students graduating or transferring after this three-year tracking period, nor do they account for students transferring to private institutions. Integrated Postsecondary Education Data System is another method used to examine transfer rates. Integrated Postsecondary Education Data System (IPEDS) transfer rates are defined as the total number of first-time, full-time degree/certificate seeking freshman, who transfer out of the reporting institution within 150% of its normal time to completion (IPEDS). For College of the Canyons students who entered in Fall 2006 and met this definition, the transfer rate was 21 percent. Accountability Reporting for California Community Colleges uses a Student Progress and Achievement Rate indicator to assess transfer and completion rates. This indicator looks at the percentage of first-time students who earned a minimum of 12 units earned in the California Community College System who attempted a degree/certificate/transfer course within six years and achieved any of the following within six years of entering the institution: Transferred to a four-year college, earned an Associate’s Degree, earned a certificate (18 units or more), achieved “transfer directed” status, or achieved “transfer prepared” status. “Transfer Directed” in this indicator refers to completion of 56+ transfer units with a 2.0 GPA within six years, including successful completion of any transfer level English and math. “Transfer Prepared” in this indicator refers to completion of 60 UC/CSU transferable units with a GPA >=2.0 within six years. COC’s Student Progress and Achievement Rate for the most recent cohort (2003/04-2008/09) was 46.1 percent (CCC System Office ARCC Report, 2010).
To help first-time freshman students achieve their educational goals, the College is implementing the First-Year Experience (FYE) program in Fall 2010. The FYE program will provide a welcoming and informative environment that will support student success from the beginning. Within this program, FYE students will enroll in general education courses taught by FYE faculty who will also serve as their mentor for the first year. In addition, FYE students will enroll in math and English classes designated as FYE within their first year.
Table 2 illustrates how the transfer rates vary depending on the measure and definition being used. Transfer Measure Transfer Definition Cohort Transfer Rate
ARCC (Student Progress and Achievement)
First-time freshmen who showed intent to complete and who achieved any of the following outcomes within six years: Transferred to a 4-yr college; or earned an AA/AS; or earned a certificate (18 units or more); or achieved "Transfer Directed" status; or achieved "Transfer Prepared" status.
2003-04 to 2008-09 COC=46.1% vs. State=52.3%
IPEDSFull-time, first-time degree/certificate-seeking who transferred within 150% of normal time 2006-07 COC=21%
Transfer Rate Study - Chancellor's Office
First-time freshmen with minimum of 12 units who attempted transfer level math or English during enrollment and transferred to 4-year institution with six years of initial enrollment. 2000-01 COC=42.5% vs. State=40.5%
Student-Right-to-Know Transfer and Completion Rates
Full-time, first-time freshmen, interested in obtaining a certificate, degree or transfer. Tracked for three years. 2005
COC: 46% combined (25%-Completion; 21%-Transfer) vs.
State: 42% combined (25%-Completion; 11%-Transfer)
Table 2. Transfer Rates by Methodology Institutional Development and Technology 3

Figure 2. Enrollment Fees from 2007/08 to 2009/10 for California Community Colleges, California State University System, and the University of California System
Community College Transfer GPA at UC and CSU. Data available on the performance of transfer students from California Community Colleges show that College of the Canyons students transfer to a UC with about the same GPA as transfer students from all other California community colleges. For College of the Canyons students who transferred in 2008/09 to the UC system, the average GPA was 3.4, while it was 3.37 for all other community colleges. Data also shows that College of the Canyons students transfer to a CSU with a slightly higher GPA compared to transfer students from all other California community colleges. The average GPA for College of the Canyons students who transferred in the same year to the CSU system as an upper division student was 3.8 compared to 3.4 system-wide. In addition, data show that College of the Canyons students persist with about the same GPA as students do system wide. The average GPA for College of the Canyons students who transferred in 2007/08 after one year in the CSU system is 2.93 compared to 2.94 system-wide. For College of the Canyons students who transferred to the UC system in the same year, the average GPA after one year was 3.0 compared to 2.96 systemwide.
Increase in Fees. Students’ decisions about where they will pursue higher education, including transferring, will continue to be affected by ongoing changes in all three of California’s higher education systems: University of California (UC), California State University (CSU), and California Community Colleges (CCC). Budget cuts in California and across the nation have had a profound impact on access to higher education for students. Figure 2 illustrates the fee increases at CCCs, CSUs, and UCs from 2007/08 to 2009/10 (Community College League of California, 2009 & 2010). The CSU
Board of Trustees recently voted to raise fees by five percent effective
Fall 2010 (CSU Public Affairs, June 18, 2010).
Changing Eligibility Requirements. Senate Bill 1440 establishes the new Student Transfer Achievement Reform Act, which, if approved, will guarantee California community college students, who complete an associate’s degree in their field of study, the ability to transfer to the California State University as a junior. Additionally, the CSU will give priority admission to a community college transfer student to a major or program of choice, if the student has received his or her associate's degree in the same or related field. SB 1440 also prohibits the CSU from requiring these transfer students to repeat courses similar to those taken towards their associate’s degree. This bill will standardize the transfer process and increase transfer rates to CSU’s. It is set to be in effect starting Fall 2011. (COC Advocacy)
Transfer Agreement Guarantee (TAG) offers guaranteed admissions to California Community College students who meet specific requirements. TAGs are in place for 7 UC campuses: Davis, Irvine, Merced, Riverside, San Diego, Santa Barbara, Santa Cruz, as well as, California State University-Northridge. Students who participate in the TAG program receive early review of their academic records, early admission notification, and specific guidance about major preparation and general education coursework. Students interested in the TAG program
Institutional Development and Technology 4

should contact a COC Counselor. While the agreement is intended to ensure admission to the university of choice, not all CSU and UC campuses have transfer agreements with all community colleges.
Transfer Alliance Program (TAP) is a partnership between 47 California Community Colleges with Honors Programs and UCLA’s College of Letters and Science. Students participating in TAP receive “priority admission consideration” each year to majors within UCLA’s College of Letters and Science. Participation in TAP is contingent upon certification by COC’s Honors Program that the student has completed the COC Honors Program requirements, which include completion of 15 units of transfer level courses with a “B” or better. Students who have a High Intensity Transfer Enrichment (HITE) contract and apply for TAP in Fall 2010 will still need to complete the 18 units of contract, not course credit. For additional information, please visit the COC Honors website at http://www.canyons.edu/Offices/Honors/faqstudents.asp#tapagreement. UCLA’s TAP benefits can be viewed on their website at http://www.admissions.ucla.edu/Prospect/Adm_tr/ADM_CC)/tap.htm.
Transfer Center. College of the Canyons’ Transfer center helps students achieve their transfer goals by establishing articulation agreements with four-year institutions to provide a seamless transition from COC to four-year institutions, hosting the annual Transfer Day on campus so students can visit with university representatives, providing detailed educational plans for students to ensure they are enrolling in the appropriate coursework for transfer, and inviting students to meet with college and university representatives for one-on-one advisement throughout the year. COC’s Transfer Center also supports students by counseling them on the coursework needed to transfer, completing transfer agreements, and providing various transfer related workshops (e.g., how to complete an application for admissions, how to write a personal statement, general transfer information new students, etc).
Implications for Students. Students planning to transfer to UC and CSU schools should:
Complete 60 transferable semester units, Have the required preparation for the major, Complete transferable math and English early, Complete lower division general education
(GE) requirements,
Have a competitive GPA, and Apply to more than one campus for transfer.
COC Counselors. These criteria mean students will need to work closely with a counselor to develop an educational plan that will prepare them for transfer to more than one campus, especially since major preparation is campus specific. Students can use the website ASSIST, which shows students who are enrolled in a public California Community College how credits they have earned transfer to a California State University (CSU) or University of California (UC) school. Students can also explore which institutions offer their major of interest (ASSIST). COC’s experienced counselors have the most up-to-date information on transfer requirements and are available to assist students with their educational plans. Students are strongly encouraged to schedule an appointment with a counselor to discuss their transfer goals. COC Counseling Office has transfer information available at http://www.canyons.edu/offices/Counseling/transfer.asp. The Counseling Office also provides updated information in their newsletters published in the fall and spring terms (http://www.canyons.edu/offices/Counseling/newsletter.asp).
Students can access timely information about transfer from system sponsored web sites such as: ASSIST at http://www2.assist.org/Welcome.do (explore UC and CSU transfer major requirements for CCs)
CSU Mentor at http://www.csumentor.edu/
Figure 3. Dr. Danielle Butts advises a student on transfer.
Institutional Development and Technology 5

UC Pathways at http://www.ucop.edu/pathways/
California Colleges.edu at http://www.californiacolleges.edu/
Intersegmental General Education Transfer Curriculum (IGETC) at http://igetc.org/
Special thanks goes to Garrett Hooper, Counseling Faculty and Dr. Danielle Butts, Director, Transfer Center for providing input and feedback.
References
California College News Team. (2010, April 29). Re: California community college students having difficulty transferring [Web log message]. Retrieved from http://www.mycaliforniadegree.com/california-college-news/1102-california-community-college-students-having-difficulty-transferring
California Postsecondary Education Commission. (2010). Transfer Pathways. Retrieved from http://www.cpec.ca.gov/OnLineData/TransferPathway.asp
California State University Analytic Studies. Retrieved from http://www.asd.calstate.edu/performance/index.shtml California State University Public Affairs. Retrieved from http://www.calstate.edu/pa/News/2010/release/fees-five.shtml California State University, Northridge: CSU Mentor (2010). Retrieved from http://www.csumentor.edu/ Chancellor’s Office California Community Colleges. (2010). Accountability reporting for the community colleges 2010 report. Retrieved
from http://www.cccco.edu/Portals/4/Reports/ARCCfinalMar2010.pdf Chancellor’s Office California Community Colleges. (2010). California community college (CCC) transfers to in-state private (ISP) and out-
of-state (OOS) four-year institutions in 2007-2008. Retrieved from www.cccco.edu Community College League of Calfornia. (2009). Fast facts. Retreived from http://www.ccleague.org/files/public/FastFacts09.pdf Community College League of Calfornia. (2010, March). Fast facts. Retreived from
http://www.ccleague.org/files/public/FF2010_revMar10.pdf Gribbons, B.C. and Meuschke, D.M. (2003, April). Transfer patterns (Research Brief No. 13). College of the Canyons: Santa Clarita, CA.
Gribbons, B.C. and Meuschke, D.M. (2003, August). Transfer patterns (Research Brief No. #17). College of the Canyons: Santa Clarita, CA. Hatfield, Michelle. (2010, Apri1 21). Re: Extra credit: community college-CSU transfer bill [Web log message]. Retrieved from http://thehive.modbee.com/node/19013 Integrated Postsecondary Education System. Student-right–to-know- act. Retrieved from http://nces.ed.gov/ipeds/glossary/index.asp?id=625 Keller, Josh. (2010, June). California is set to ease path for transfer students. The Chronicle of Higher Education. Retrieved from
http://chronicle.com/article/California-Is-Set-to-Ease-Path/65763/ University of California Admissions (2010). Transfer Admission. Retrieved from
http://universityofcalifornia.edu/admissions/undergrad_adm/paths_to_adm/transfer.html University of California: StatFinder. Retrived from http://statfinder.ucop.edu/
For more detailed information on this research brief, please contact Daylene Meuschke, Director, Institutional Research at 661.362.5329. For more information on transferring, visit COC’s Counseling Services or Transfer Center, located in the “A” building.
Institutional Development and Technology 6

Degree/Certificate/Transfer/Completion Data
Tracked through
Strategic Plan

COLLEGE OF THE CANYONS PLANNING IMPACTS
page 15STRATEGIC PLAN 2012-15
Retention and Success Rates Retention and success rates have increased in recent years. Retentionrates increased from 88 percent in Fall 2007 to 91 percent in Fall 2010.Similarly, success rates increased from 67 percent to 72 percent in thesame time period.
Transfer Rate and InstitutionsA major component of California’s Master Plan for Higher Education isfor students to be able to begin their college education at a communitycollege and transfer to a four-year college or university. For College ofthe Canyons, the numbers of transfers to both California State Univer-sity (CSU) and University of California (UC) have been growing from1999/2000 to 2007/08. However, in the past two years, there has been asharp decline in transfers to CSU, from 697 to 459. This is likely the re-sult of reduced admissions as a result of state budget cuts. This decreasein transfers to CSU and UC underscores the importance of model pro-grams like the University Center which operates without state supportwith operations and therefore is not subject to enrollment caps.
The top UC transfer institutions for COC in 2009/10 were UC LosAngeles and UC San Diego. The top three CSU transfer institutions forCOC students in 2009/10 were CSU Northridge, CSU Bakersfield, andCSU Long Beach. Comparing COC to the State using the Student-Right-to-Know definition, the combined completion and transfer ratewas 44 percent compared to 39 percent statewide.
Increase in Retention and Success Rates: Fall 2007 to Fall 2010
Number of Transfers to CSU and UC
New Programs at College of the Canyons
College of the Canyons currently has 46 certificate programs, 68 degree pro-grams, 32 Career Specializations certificates, and 7 noncredit Competencycertificates. Some of the new programs and certificates include the following:• Insurance-Property and Casualty-Certificate of Achievement• International Trade-Finance-Certificate of Specialization• Electromechanical Systems – A.S. degree• ESL/Beginning Level-Certificate of Competency• ESL/Intermediate Level-Certificate of Competency• Hotel Restaurant Entrepreneurship-Certificate of Specialization• Energy Management-Certificate of Specialization• Human Services-Gerontology Option-Certificate of Achievement• Medical Laboratory Technician-A.A. degree• Skills for Healthy Aging Resources and Programs (SHARP)-
Certificate of Specialization• Web Publishing & Design-Certificate of Achievement• Web Development-Certificate of Achievement• Plumbing and Electrical (in development)
College of the Canyons should continue to evaluate local labor market projec-tions to determine which new instructional programs should be considered.

STRATEGIC PLAN EXECUTIVE SUMMARY 27
TRANSFER RATESA major component of California’s Master Plan for Higher Education is for students to beable to begin their college education at a community college and transfer to a four-year uni-versity. For College of the Canyons, the number of transfers to both California State Univer-sity (CSU) and University of California (UC) has grown from 1999-2000 to 2007-08. Inthe past two years, however, the college has experienced a sharp decline in transfers to CSU,from 697 to 459. This is likely the result of reduced admissions at the CSU level because ofstate budget cuts. This decrease in transfers underscores the importance of model programssuch as the Dr. Dianne G. Van Hook University Center, which operates without state sup-port and is not subject to enrollment caps.
TRANSFER RATE TO UC SYSTEMstudents
200
150
100
50
0year 2002-03 2003-04 2004-05 2005-06 2006-07 2007-08 2008-09 2009-10
122 124 127 136161 155
142162
TRANSFER RATE TO CSU SYSTEMstudents
800
600
400
200
0year 2002-03 2003-04 2004-05 2005-06 2006-07 2007-08 2008-09 2009-10
474 481 534 562625
697624
459
internal factors
MEASURES OF SUCCESS

28 SANTA CLARITA COMMUNITY COLLEGE DISTRICT
TOP TRANSFER INSTITUTIONSThe top UC transfer institutions for College of the Canyons students in 2009-10 were UCLA andUC San Diego. The top three CSU transfer institutions were CSU Northridge, CSU Bakersfield andCSU Long Beach. College of the Canyons’ combined completion and transfer rate of 44 percent ishigher than the state average of 39 percent.
SATISFACTION RATESSatisfaction with College of the Canyons is high overall, with a vast majority of students giving highmarks to both the Valencia and Canyon Country campuses. However, students give low marks tocourse availability, which has suffered recently due to budget constraints. They also cite limited courseavailability and the high cost of books and supplies as significant barriers to achieving their educa-tional goals. Students’ top reasons for attending College of the Canyons are location, cost and trans-ferability of courses to four-year universities.
COMPLETION BY DEPARTMENTThe English and Math departments are the largest in terms of the number of students, most of whomtake English and math courses to complete general education requirements. The departments award-ing the greatest number of degrees are Nursing and Biological Sciences, each awarding more than 100degrees. The department awarding the greatest number of certificates is Early Childhood Education.
RETENTION AND SUCCESS RATESRetention and success rates have increased in recent years. Retention rates increased from 88 percentin 2007 to 91 percent in 2010. Similarly, success rates increased from 67 percent to 72 percent in thesame period.
internal factors

Degree/Certificate/Transfer/Completion Data
Tracked through
Program Review
2/12/2014 - Academic Program Planning and Review
https://intranet.canyons.edu/offices/FiscalServices/APRBudget2010/AAPRForm.asp?ProgramId=9999 1/10
College of the Canyons Program Planning and Review
Year(s): 2011/2012 to 2013/2014
College of the Canyons' Mission Statement
College of the Canyons offers an accessible, enriching education that provides students with essential academic skills and prepares students fortransfer education, workforce-skills development, and the attainment of learning outcomes corresponding to their educational goals. To fulfill its
mission, College of the Canyons embraces diversity and engages students and the community in scholarly inquiry, creative partnerships, and theapplication of knowledge.
Year 3 Program Planning and Review (2013/2014)
PROGRAM INFORMATION for: Linguistics 1Year(s): 2011/2012 to 2013/2014
MISSION/DESCRIPTION:
Degrees/Certificates Offered:
Age of Program:
2011/2012 2012/2013 Change Comment (optional)

2/12/2014 - Academic Program Planning and Review
https://intranet.canyons.edu/offices/FiscalServices/APRBudget2010/AAPRForm.asp?ProgramId=9999 2/10
2011/2012 2012/2013 Change Comment (optional)
PROGRAM
DESCRIPTORS
Degrees
Awarded
Certificates
Awarded
Number ofOverdue
Courses (older than 5
years)
Total Studentswith declared
major
Majors (3 or
more courses)
DepartmentStudent
Headcount
Number of
Sections
Requested(CCC)
by AcademicAffairs
Number of
SectionsRequested (VC)
by Academic
Affairs
Number ofSectionsRequested
(Online)
2/12/2014 - Academic Program Planning and Review
https://intranet.canyons.edu/offices/FiscalServices/APRBudget2010/AAPRForm.asp?ProgramId=9999 3/10
(Online)by AcademicAffairs
Number ofSections OfferedTotal
Number of
Sections CCCOnly
Number of
Sections VCOnly
Number of
Sections OnlineOnly
Average ClassSize
Average ClassSize CCC Only
Average Class
Size VC Only
Average ClassSize Online Only
FTES Generated
Cost per FTES($)
Success Rate
(%)
Retention Rate
(%)
InstructionalLoad
2011/2012 2012/2013 Change Comment (optional)

2/12/2014 - Academic Program Planning and Review
https://intranet.canyons.edu/offices/FiscalServices/APRBudget2010/AAPRForm.asp?ProgramId=9999 4/10
2011/2012 2012/2013 Change Comment (optional)
RESOURCESINVESTED
Number of Full-Time TeachingFaculty
Number of
Adjunct Faculty
Number ofSupport Staff
Supplies Funds
EquipmentFunds
Grants
Obtained
COCFoundation
Donations
OtherResources
Level 1 user additional comments / dialogue about the information provided if desired.
Level 2 user comments / dialogue about the information provided if desired.
Level 3 user comments / dialogue about the information provided if desired.
Student Learning Outcomes
The new WASC accreditation standards require colleges to identify student learning outcomes for courses, programs, degrees, certificates, assess progress

2/12/2014 - Academic Program Planning and Review
https://intranet.canyons.edu/offices/FiscalServices/APRBudget2010/AAPRForm.asp?ProgramId=9999 5/10
The new WASC accreditation standards require colleges to identify student learning outcomes for courses, programs, degrees, certificates, assess progress
towards achievement of the identified student learning outcomes, and use assessment results to make improvements (Standard II: Section A 1.c). Studentlearning outcomes (SLO) are written statements that represent what a student is expected to know or be able to do as a result of a learning process.
Additional Student Learning Outcomes training will be provided during Flex workshops.
Beginning in Spring 2007, WASC began requiring colleges to complete an annual inventory of student learning outcomes for courses and programs. The
information you provide in the tables below will be used to complete the annual inventory in Spring 2013.
Please indicate any programs that have been deleted,
archived or for which courses have not yet beenoffered.
Student Learning Outcomes Assessment Model -
Programs:
The purpose of this assessment process is to improvestudent learning.
Program(s) SLOs Means of Assessmentand
Criteria for Success
Summary of Data Collected and Number of Cycles
Use of Results NextAssessment
Cycle
(Semester,Year)
Please indicate theprograms for which
your department has
developed SLOs in
the space below.
Please identify thecorresponding
Program SLOs as
listed in CurricUNET.
Please indicate themeans of assessment
and criteria for
success for the
program SLOs listed
in the column to theleft.
Please indicate the # of students whotook the assessment and the # of
students who passed the assessment.
Please indicate how thedepartment has used results
to implement change or
strengthen what is working
well.
Please enterthe semester
& year for the
next
assessment.
Cycle(s)
Please indicate any courses that have been deleted,
archived, or not offered due to budget constraints orcancellation due to low enrollment.
Student Learning Outcomes Assessment Model -
Courses:
The purpose of this assessment process is to improvestudent learning.
Course(s) SLOs Means of Assessmentand
Criteria for Success
Summary of Data Collected and Number of Cycles
Use of Results NextAssessment
Cycle

2/12/2014 - Academic Program Planning and Review
https://intranet.canyons.edu/offices/FiscalServices/APRBudget2010/AAPRForm.asp?ProgramId=9999 6/10
Criteria for Success Cycle
(Semester,Year)
Please indicate thecourses for which
your department has
developed SLOs inthe space below.
Please identify thecorresponding Course
SLOs as listed in
CurricUNET.
Please indicate themeans of assessment
and criteria for
success for the courseSLOs listed in the
column to the left.
Please indicate the # of students whotook the assessment and the # of
students who passed the assessment.
Please indicate how thedepartment has used results
to implement change or
strengthen what is workingwell.
Please enterthe semester
& year for the
nextassessment.
Coursesshould be
evaluated at
least every 2years.
Cycle(s)
Level 1 user additional comments / dialogue about the information provided if desired.
Level 2 user comments / dialogue about the information provided if desired.
Level 3 user comments / dialogue about the information provided if desired.
Strengths / Challenges / Objectives
Review of Previous Objectives. Summarize progress in achieving goals and objectives identified on the last program planning and review. (Review
College Strategic Goals)
Additional Accomplishments. (Review College Strategic Goals)

2/12/2014 - Academic Program Planning and Review
https://intranet.canyons.edu/offices/FiscalServices/APRBudget2010/AAPRForm.asp?ProgramId=9999 7/10
New Objectives. While the number of new objectives is to be determined by your department, most departments will want to limit the number of new
objectives to between 3 and 7. Also, there is no requirement to include objectives for each strategic goal. Rather, review the College Strategic Goals and
reflect on many implications for your department. Only include objectives for a College Strategic Goal is appropriate. (Review College Strategic Goals)
New Objectives Related to SLOs as Indicated in Use of Results Section:
Other New Objectives:
1). Linguistics need to be updated to be useful for demo purpose (Goal: Technological Advancement)
Please identify any substantive changes that occurred in the prior academic year that resulted in the addition of a new objective(s) in this year’s program
review. In addition, please provide data or evidence to support the addition of this objective(s).
Level 1 user additional comments / dialogue about the information provided if desired.
Level 2 user comments / dialogue about the information provided if desired.
Level 3 user comments / dialogue about the information provided if desired.
Budget Planning

2/12/2014 - Academic Program Planning and Review
https://intranet.canyons.edu/offices/FiscalServices/APRBudget2010/AAPRForm.asp?ProgramId=9999 8/10
Click Here for Budget Planning
Level 1 user additional comments / dialogue about the information provided if desired.
Level 2 user comments / dialogue about the information provided if desired.
Level 3 user comments / dialogue about the information provided if desired.
Addendum For Career & Technical Education (CTE)
Career & Technical Education Outlook
How is the program responding with regard to labor market demand?
What sources of information do you have to support your conclusions?
What similar training programs exist in the surrounding area or nearby colleges in the South Central Regional Consortium?
2/12/2014 - Academic Program Planning and Review
https://intranet.canyons.edu/offices/FiscalServices/APRBudget2010/AAPRForm.asp?ProgramId=9999 9/10
Comment on any placement rate information you may have.
Please comment on how the program’s industry advisory committee has been involved in the preparation or review of the program’s annual program review.
Level 1 user additional comments / dialogue about the information provided if desired.
Level 2 user comments / dialogue about the information provided if desired.
Level 3 user comments / dialogue about the information provided if desired.
Please list the faculty who were consulted in this program planning and review.
Upload additional files.
Level 1 user additional comments / dialogue about the information provided if desired.
Level 2 user comments / dialogue about the information provided if desired.

2/12/2014 - Academic Program Planning and Review
https://intranet.canyons.edu/offices/FiscalServices/APRBudget2010/AAPRForm.asp?ProgramId=9999 10/10
Level 3 user comments / dialogue about the information provided if desired.
Recommended