DATA BOOKFiscal Year 2020
From April 1, 2020 to March 31, 2021
2020年11月12日明治ホールディングス株式会社
IR広報部
November 12, 2020 Meiji Holdings Co., Ltd.
PR & IR Department

Meiji Holdings Co., Ltd. DATABOOK
連結財務諸表 ・・・・・・・・・・・・・・・・・・・・・・・・ 3Consolidated Financial Statements
主要連結財務指標 ・・・・・・・・・・・・・・・・・・・・・・・・ 7Main Consolidated Financial Indicators
セグメント情報 ・・・・・・・・・・・・・・・・・・・・・・・・ 11Segment Information
市場情報 ・・・・・・・・・・・・・・・・・・・・・・・・ 18Market Data
株式情報 ・・・・・・・・・・・・・・・・・・・・・・・・ 27Stock Information
会社概要 ・・・・・・・・・・・・・・・・・・・・・・・・ 28Corporate Data
(注記)
2015年10月1日付で普通株式1株につき2株の割合で株式分割を実施しました。当資料に記載されている1株あたり情報や株式数等は、この株式分割を反映しています。
The Company conducted a two-for-one stock split on October 1, 2015. The indicated per-share data, number of shares and other information reflect this stock split.
目次 Contents

Meiji Holdings Co., Ltd. DATABOOK
3
(1)連結貸借対照表 Consolidated Balance Sheets
(百万円/Millions of yen)
FY2010 FY2011 FY2012 FY2013 FY2014 FY2015 FY2016 FY2017 FY2018 FY2019
総資産
Total assets
流動資産
Current assets
受取手形及び売掛金
棚卸資産
Inventories
固定資産
Non-current assets
有形固定資産
Property, plants and equipment
負債合計
Total liabilities
流動負債
Current liabilities
固定負債
Non-current liabilities
純資産
Net assets
自己資本
Shareholders' equity
有利子負債
Interest bearing debt129,497192,810 205,261 205,394 198,376 221,480 147,828 106,764119,102 116,385
457,190
287,782 291,589 313,383 320,447 370,341 408,874 448,901
293,530 298,491 320,609 328,121 380,302 419,152 597,573
562,753
495,177
487,310
560,630
527,310
314,191
121,504 98,994 155,139 189,872 198,489 160,266 112,513
301,333 352,500 309,764 261,466 298,575 276,696 256,520
144,826
294,430
137,936
291,504
152,008
365,986
422,838 451,494 464,904 451,339 497,065 436,963 426,704
313,750 311,184 312,124 325,644 353,044 349,314
401,347
444,191383,962
432,367
433,491
443,512
134,234
414,692 427,453 444,302 450,390 525,349 493,196 506,187
105,151 112,013 121,194 121,661 130,050 123,603 173,299
582,034
136,468
534,870
165,924
582,696
301,676 322,531 341,211 329,071 352,018 362,919 416,885
179,931
392,674
195,760
421,447
202,193Notes and accountsreceivable-trade
連結財務諸表 Consolidated Financial Statements
716,368 749,985 785,514 779,461 877,367 856,115 883,895 998,920927,544 1,004,143
377,707
146,377 168,699 175,803 163,135 172,762 181,493 183,807

Meiji Holdings Co., Ltd. DATABOOK
4
(2)連結損益計算書 Consolidated Statements of Income
(百万円/Millions of yen)
FY2010 FY2011 FY2012 FY2013 FY2014 FY2015 FY2016 FY2017 FY2018 FY2019
売上高
Net sales
売上原価
Cost of sales
売上総利益
Gross profit
販売費及び一般管理費
Selling, general & administrative expenses
運賃保管料
Carriage and storage charges
拡売費・広告宣伝費
Sales promotion expenses
労務費
Labor cost
営業利益
Operating profit
経常利益
Ordinary profit
税金等調整前当期純利益
Profit before income taxes
親会社株主に帰属する当期純利益
EBITDA*1
*1 EBITDA=営業利益+減価償却費+のれん償却額
EBITDA=Op. profit + Depreciation and amortization
121,636 135,873
Profit attributable to owners of parent
70,026 61,309 66,805 77,607 94,063 148,942
67,318
142,826
61,868
143,058
89,192
9,552 6,805 16,646 19,060 30,891 62,580 60,786
17,925 14,588 25,214 33,687 48,657 95,210 97,74991,079
61,278
94,586
88,395
30,451 21,882 29,131 39,089 53,582 81,826 88,839
28,873 20,189 25,859 36,496 51,543 77,781 102,710
103,326
94,673
95,877
98,383
99,709
141,855
70,032 72,523 72,196 73,628 76,596 78,440 77,979
138,500 136,142 142,424 139,941 134,078 142,414
82,709
124,890133,574
78,871
122,010
81,882
372,931
45,129 44,672 43,403 43,127 42,115 46,982 48,851
352,361 350,584 356,825 357,565 351,842 367,780 359,812
47,732
360,208
46,234
358,185
48,157
781,153
381,234 370,774 382,684 394,062 403,386 445,561 461,326
732,860 738,500 743,835 754,013 757,766 778,184 790,183
462,523
785,978
454,882
797,811
456,569
連結財務諸表 Consolidated Financial Statements
1,114,095 1,109,275 1,126,520 1,148,076 1,161,152 1,223,746 1,242,480 1,252,7061,240,860 1,254,380

Meiji Holdings Co., Ltd. DATABOOK
5
(3)連結キャッシュフロー計算書 Consolidated Statements of Cash Flows
(百万円/Millions of yen)
FY2010 FY2011 FY2012 FY2013 FY2014 FY2015 FY2016 FY2017 FY2018 FY2019
営業活動によるキャッシュ・フロー
Net cash flow from operating activities
投資活動によるキャッシュ・フロー
Net cash flow from investing activities
財務活動によるキャッシュ・フロー
Net cash flow from financing activities
Cash and cash equivalents at end of period
フリー・キャッシュフロー*1
Free cash flow*1
*1 フリー・キャッシュフロー=営業活動によるキャッシュフロー+投資活動によるキャッシュフロー
Free cash flow=Net cash flow from operating activities + Net cash flow from investing activities
112,100
-100,202
-13,980
24,481
11,898
-30,287
37,110
43,291
31,516 22,624
95,346 37,59725,555 -13,716 11,118 16,553 -6,335
21,912現金及び現金同等物の期末残高
21,741 14,363 16,564 19,238
-19,570 4,861 -9,411 -18,194 6,846 -85,071 -46,548
-32,440 -44,314 -39,504 -47,293 -92,822 -9,809 -70,811 -64,394
-40,121
26,913
44,380
連結財務諸表 Consolidated Financial Statements
57,995 30,597 50,622 63,847 86,487 105,155 81,888 114,103108,775
-44,291

Meiji Holdings Co., Ltd. DATABOOK
6
(4)設備投資額・減価償却費・研究開発費 Capital Expenditures, Depreciation and Amortization, R&D Expenses
(百万円/Millions of yen)
FY2010 FY2011 FY2012 FY2013 FY2014 FY2015 FY2016 FY2017 FY2018 FY2019
設備投資額*
Capital expenditures
食品セグメント
Food segment
医薬品セグメント
Pharmaceuticals segment
消去又は全社
Corporate or elimination
減価償却費*
Depreciation and amortization
食品セグメント
Food segment
医薬品セグメント
Pharmaceuticals segment
消去又は全社
Corporate or elimination
研究開発費
R&D expenses
食品セグメント
Food segment
医薬品セグメント
Pharmaceuticals segment
消去又は全社
Corporate or elimination*設備投資額および減価償却費は、無形固定資産も含まれた数値です。
*The figures of "Capital expenditures" and "Depreciation and amortization" include "Intangible assets."
00 0 0 0 0 4360 0
12,409
13,253 15,078 14,747 13,557 14,654 13,752
10,569 11,120 11,319 12,548 12,654 13,427
17,582
13,213
13,293
12,712
16,470
227
23,418 23,823 26,199 26,067 26,105 27,308 26,162
1,226 1,261 1,153 1,094 251 -887
31,446
315
26,507
-580
29,182
39,914
5,169 5,322 5,439 5,482 5,311 5,730
34,476 34,237 34,379 35,308 36,513
9,616
37,46940,188
6,006
34,517
9,096
41
41,345 40,871 40,821 40,972 41,885 42,077 45,872
51 2 46 19 39 70
46,198
57
46,511
179
43,033
44,324
4,803 4,487 5,490 8,527 5,728 6,052
33,470 33,179 41,502 55,801 36,587 60,277
10,760
63,869
7,851
61,353
9,710
連結財務諸表 Consolidated Financial Statements
40,511 38,324 37,668 47,038 64,347 42,354 50,417 71,10971,777 71,243

Meiji Holdings Co., Ltd. DATABOOK
7
(1)収益性の指標 Profitability Indicators
(%)FY2010 FY2011 FY2012 FY2013 FY2014 FY2015 FY2016 FY2017 FY2018 FY2019
売上高総利益率
Gross profit margin
売上高営業利益率
Operating profit ratio
売上高経常利益率
Ordinary profit ratio
売上高当期純利益率
Return on sales
売上高販管費率
SG&A expenses ratioEBITDAマージン
EBITDA margin
(2)リターンの指標 Return Indicators
(%)FY2010 FY2011 FY2012 FY2013 FY2014 FY2015 FY2016 FY2017 FY2018 FY2019
自己資本当期純利益率*1
Return on equity (ROE)*1
総資産経常利益率*2
Ordinary profit/Total assets (ROA)*2
株主総利回り*3
Total Shareholders Return*3
*1 自己資本当期純利益率=当期純利益/期首・期末平均自己資本
Return on equity=Profit/Average shareholders' equity *2 総資産経常利益率=経常利益/期首・期末平均総資産
Ordinary profit/Total assets=Ordinary profit/Average net assets *3 (各事業年度末日の株価+2015年度から各事業年度までの1株当たり配当額の累計額)/2014年度末日の株価
TSR= (Year-end stock price for each fiscal year + cumulative total for per share dividends for each fiscal year since FY2015) / FY2014 year-end stock price
124.8 129.3 115.1 129.1 113.3
12.2
10.3
7.8
7.9
4.9
28.6
11.4
12.4
10.3
8.2
8.2
5.4
28.7
11.9
10.24.2 3.0 3.8 5.0 6.5 9.4
10.9
3.3 2.3 5.5 6.0 8.9 16.1 14.2
6.3 5.5 5.9 6.8 8.1 9.9
4.9
31.6 31.6 31.7 31.1 30.3 30.1 30.0
0.9 0.6 1.5 1.7 2.7 5.1
7.1
2.7 2.0 2.6 3.4 4.6 6.7 7.2
2.6 1.8 2.3 3.2 4.4 6.4
主要連結財務指標 Main Consolidated Financial Indicators
34.2 33.4 34.0 34.3 34.7 36.4 37.1 36.936.7 36.4
13.1
10.6
7.6
7.7
4.9
29.0
11.5
Meiji Holdings Co., Ltd. DATABOOK
8
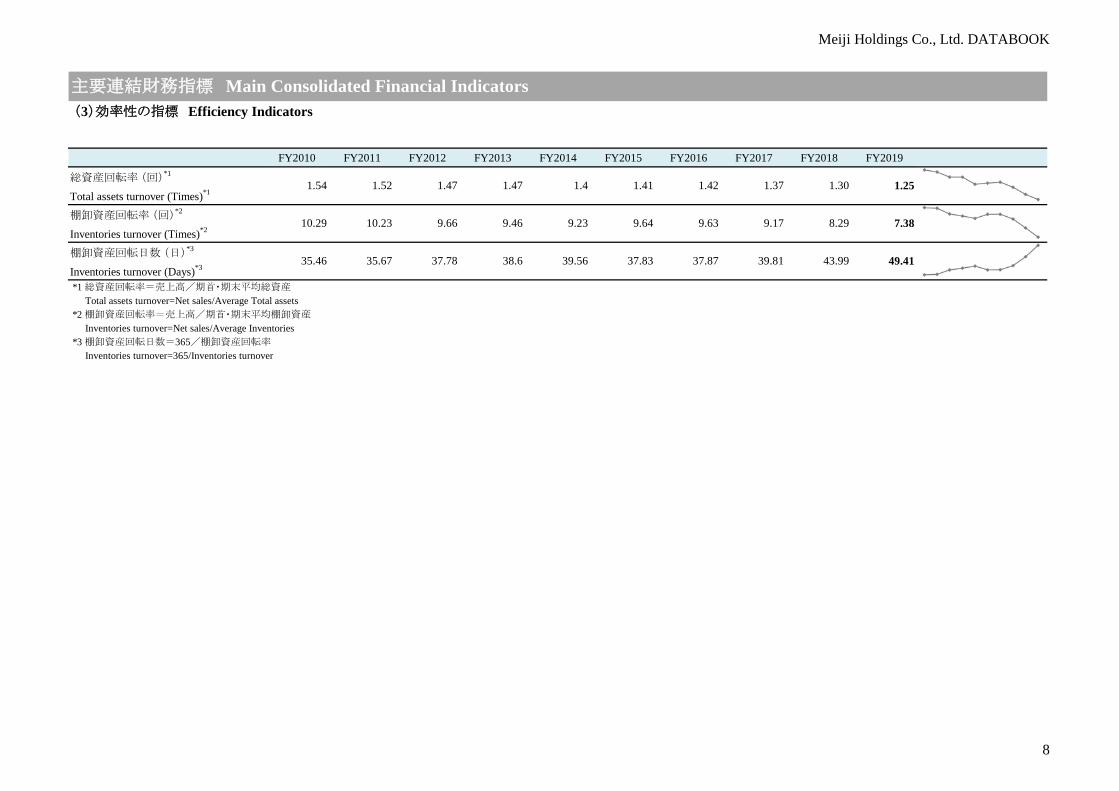
(3)効率性の指標 Efficiency Indicators
FY2010 FY2011 FY2012 FY2013 FY2014 FY2015 FY2016 FY2017 FY2018 FY2019
総資産回転率 (回)*1
Total assets turnover (Times)*1
棚卸資産回転率 (回)*2
Inventories turnover (Times)*2
棚卸資産回転日数 (日)*3
Inventories turnover (Days)*3
*1 総資産回転率=売上高/期首・期末平均総資産
Total assets turnover=Net sales/Average Total assets *2 棚卸資産回転率=売上高/期首・期末平均棚卸資産
Inventories turnover=Net sales/Average Inventories *3 棚卸資産回転日数=365/棚卸資産回転率
Inventories turnover=365/Inventories turnover
39.81
1.25
7.38
49.41
9.64 9.63
37.83 37.87
1.37
9.17
1.42 1.30
35.67 37.78 38.6 39.56
9.46 9.23
主要連結財務指標 Main Consolidated Financial Indicators
1.54
35.46
10.29
1.52 1.47 1.47 1.4 1.41
9.66 8.29
43.99
10.23

Meiji Holdings Co., Ltd. DATABOOK
9
(4)安全性および流動性の指標 Stability and Liquidity Indicators
FY2010 FY2011 FY2012 FY2013 FY2014 FY2015 FY2016 FY2017 FY2018 FY2019自己資本比率 (%)Shareholders' equity ratio流動比率 (%)Current ratio固定比率 (%)Fixed ratio固定長期適合率 (%)Fixed assets to fixed liability ratio
有利子負債・自己資本比率 (倍)*1
Interest-bearing debt/Equity ratio (Times)*1
キャッシュフロー・有利子負債比率 (%)*2
Cash flow/Interest-bearing debt ratio*2
インタレスト・カバレッジ・レシオ (倍)*3
Interest coverage ratio (Times)*3
*1 有利子負債・自己資本比率=有利子負債/自己資本
Interest-bearing debt/Equity ratio=Interest-bearing/Shareholder's equity *2 キャッシュフロー・有利子負債比率=営業活動によるキャッシュフロー/有利子負債
Cash flow/ Interest-bearing debt ratio=Net cash flow from operating activities/Interest-bearing debt *3 インタレスト・カバレッジ・レシオ=営業活動によるキャッシュフロー/利払い
Interest coverage ratio=Net cash flow from operating activities/Interest paid
143.2
144.6
110.5
85.8
0.22
96.3
157.0
162.5
103.4
82.3
0.19
106.963.2
24.0 15.0 29.5 48.6 76.2 104.1 105.1
30.0 14.9 24.6 32.1 39.0 71.1
90.2
0.66 0.70 0.65 0.61 0.59 0.36 0.28
101.3 109.4 94.8 88.3 92.4 86.7
120.2
144.1 146.6 141.8 140.6 141.9 120.6 112.8
100.1 91.5 110.2 125.9 117.9 131.2
主要連結財務指標 Main Consolidated Financial Indicators
40.2 38.9 39.9 41.1 42.2 47.8 50.8 56.352.5 52.5
140.3
133.4
109.8
85.5
0.24
91.3

Meiji Holdings Co., Ltd. DATABOOK
10
(5)投資の指標 Investment Indicators
FY2010 FY2011 FY2012 FY2013 FY2014 FY2015 FY2016 FY2017 FY2018 FY2019
1株当たり当期純利益 (円)*1
Profit per share (Yen)*1
1株当たり純資産 (円)*2
Net assets per share (Yen)*2
1株当たりキャッシュフロー (円)*3
Cash flow per share (Yen)*3
1株当たり配当金 (円)
Cash dividends per share (Yen)
株価収益率 (倍)*4
Price /Earning ratio ― PER (Times)*4
株価純資産倍率 (倍)*5
Price /Book value ratio ― PBR (Times)*5
株価キャッシュフロー倍率 (倍)*6
Price /Cash flow ratio ― PCFR (Times)*6
配当性向 (%)Payout ratio *1 1株当たり当期純利益=当期純利益/期中平均株式数
Profit per share=Profit / Average number of shares during period *2 1株当たり純資産=(純資産総額-少数株主持分)/(発行済株式数-自己株式数)
Net assets per share=(Total net assets - Minority interests) / (Number of shares outstanding - Number of treasury stock) *3 1株当たりキャッシュフロー=(当期純利益+減価償却費)/(発行済株式数-自己株式数)
Cash flow per share=(Profit + Depreciation and Amortization) / (Number of shares outstanding - Number of treasury stock) *4 株価収益率=期末株価終値/1株当たり当期純利益
Price/Earning ratio=Year-end stock price /Profit per share *5 株価純資産倍率=期末株価終値/1株当たり純資産
Price/Book value ratio=Year-end stock price / Net assets per share *6 株価キャッシュフロー倍率=期末株価終値/1株当たりキャッシュフロー
Price/Cash flow ratio=Year-end stock price / Cash flow per share
12.4
32.8
3,635.79
723.29
140.00
21.2
2.4
9.8
32.3
3,879.18
782.49
150.00
16.5
2.0
26.661.7 86.6 35.4 30.9 23.8 21.2
3.0
4.8 5.6 5.6 8.0 14.8 12.7 12.7
0.9 0.9 1.0 1.5 2.9 3.3
110.00
25.8 39.1 19.3 25.2 34.9 21.3 22.4
40.00 40.00 40.00 40.00 50.00 90.00
3,064.91
345.44 323.61 390.10 407.65 494.48 710.89 728.21
1,953.18 1,979.12 2,127.28 2,175.98 2,515.26 2,777.28
主要連結財務指標 Main Consolidated Financial Indicators
64.82 46.19 112.99 129.40 209.79 425.06 413.11 464.08422.15 426.61
10.8
30.8
3,360.70
743.35
130.00
19.1
2.4
Meiji Holdings Co., Ltd. DATABOOK
11
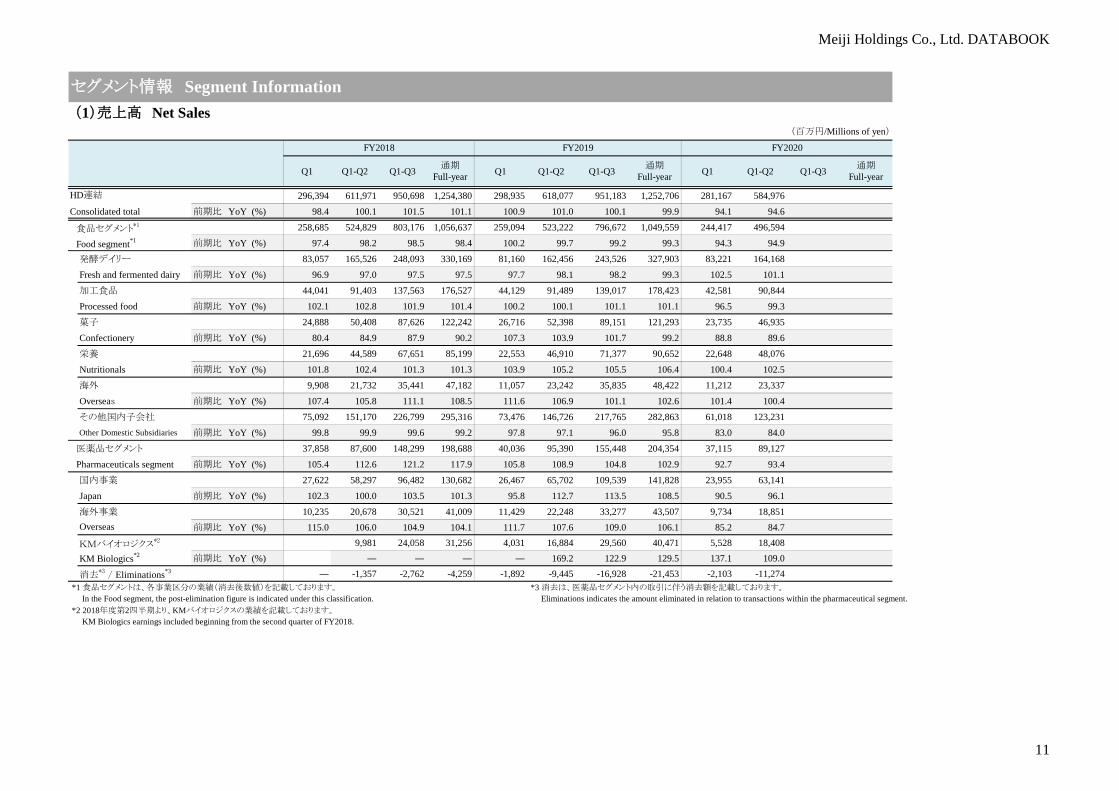
(1)売上高 Net Sales(百万円/Millions of yen)
296,394 611,971 950,698 1,254,380 298,935 618,077 951,183 1,252,706 281,167 584,976Consolidated total 前期比 YoY (%) 98.4 100.1 101.5 101.1 100.9 101.0 100.1 99.9 94.1 94.6
食品セグメント*1 258,685 524,829 803,176 1,056,637 259,094 523,222 796,672 1,049,559 244,417 496,594
Food segment*1 前期比 YoY (%) 97.4 98.2 98.5 98.4 100.2 99.7 99.2 99.3 94.3 94.9
発酵デイリー 83,057 165,526 248,093 330,169 81,160 162,456 243,526 327,903 83,221 164,168Fresh and fermented dairy 前期比 YoY (%) 96.9 97.0 97.5 97.5 97.7 98.1 98.2 99.3 102.5 101.1
加工食品 44,041 91,403 137,563 176,527 44,129 91,489 139,017 178,423 42,581 90,844Processed food 前期比 YoY (%) 102.1 102.8 101.9 101.4 100.2 100.1 101.1 101.1 96.5 99.3
菓子 24,888 50,408 87,626 122,242 26,716 52,398 89,151 121,293 23,735 46,935Confectionery 前期比 YoY (%) 80.4 84.9 87.9 90.2 107.3 103.9 101.7 99.2 88.8 89.6
栄養 21,696 44,589 67,651 85,199 22,553 46,910 71,377 90,652 22,648 48,076Nutritionals 前期比 YoY (%) 101.8 102.4 101.3 101.3 103.9 105.2 105.5 106.4 100.4 102.5
海外 9,908 21,732 35,441 47,182 11,057 23,242 35,835 48,422 11,212 23,337Overseas 前期比 YoY (%) 107.4 105.8 111.1 108.5 111.6 106.9 101.1 102.6 101.4 100.4
その他国内子会社 75,092 151,170 226,799 295,316 73,476 146,726 217,765 282,863 61,018 123,231Other Domestic Subsidiaries 前期比 YoY (%) 99.8 99.9 99.6 99.2 97.8 97.1 96.0 95.8 83.0 84.0
医薬品セグメント 37,858 87,600 148,299 198,688 40,036 95,390 155,448 204,354 37,115 89,127 Pharmaceuticals segment 前期比 YoY (%) 105.4 112.6 121.2 117.9 105.8 108.9 104.8 102.9 92.7 93.4
国内事業 27,622 58,297 96,482 130,682 26,467 65,702 109,539 141,828 23,955 63,141Japan 前期比 YoY (%) 102.3 100.0 103.5 101.3 95.8 112.7 113.5 108.5 90.5 96.1
海外事業 10,235 20,678 30,521 41,009 11,429 22,248 33,277 43,507 9,734 18,851前期比 YoY (%) 115.0 106.0 104.9 104.1 111.7 107.6 109.0 106.1 85.2 84.7
KMバイオロジクス*2 9,981 24,058 31,256 4,031 16,884 29,560 40,471 5,528 18,408
前期比 YoY (%) ― ― ― ― 169.2 122.9 129.5 137.1 109.0
消去*3
/ Eliminations*3 ― -1,357 -2,762 -4,259 -1,892 -9,445 -16,928 -21,453 -2,103 -11,274 *1 食品セグメントは、各事業区分の業績(消去後数値)を記載しております。 *3 消去は、医薬品セグメント内の取引に伴う消去額を記載しております。
In the Food segment, the post-elimination figure is indicated under this classification. Eliminations indicates the amount eliminated in relation to transactions within the pharmaceutical segment. *2 2018年度第2四半期より、KMバイオロジクスの業績を記載しております。
KM Biologics earnings included beginning from the second quarter of FY2018.
FY2020
Q1 Q1-Q2 Q1-Q3 通期Full-year
KM Biologics*2
セグメント情報 Segment Information
FY2019
Q1 Q1-Q2 Q1-Q3 通期Full-yearQ1-Q2 通期
Full-yearQ1 Q1-Q3
Overseas
HD連結
FY2018

Meiji Holdings Co., Ltd. DATABOOK
12
(2)営業利益 Operating Profit(百万円/Millions of yen)
HD連結 19,774 43,840 79,604 98,383 20,636 47,573 80,348 102,710 23,161 50,401
Consolidated total 前期比 YoY (%) 81.0 97.1 110.3 103.9 104.4 108.5 100.9 104.4 112.2 105.9
営業利益率 Op. profit ratio (%) 6.7 7.2 8.4 7.8 6.9 7.7 8.4 8.2 8.2 8.6
食品セグメント*1 18,470 39,005 64,922 84,763 19,682 39,548 65,148 87,340 23,545 43,935
Food segment*1 前期比 YoY (%) 82.2 95.4 100.0 100.7 106.6 101.4 100.3 103.0 119.6 111.1
営業利益率 Op. profit ratio (%) 7.1 7.4 8.1 8.0 7.6 7.6 8.2 8.3 9.6 8.8
発酵デイリー 11,381 22,418 34,141 47,859 10,462 20,768 32,135 48,440 16,256 29,097
Fresh and fermented dairy 前期比 YoY (%) 85.9 91.0 93.5 91.9 91.9 92.6 94.1 101.2 155.4 140.1
営業利益率 Op. profit ratio (%) 13.7 13.5 13.8 14.5 12.9 12.8 13.2 14.8 19.5 17.7
加工食品 1,698 4,391 7,069 8,220 1,893 4,882 7,597 8,377 1,958 4,405
Processed food 前期比 YoY (%) 92.2 109.1 113.1 110.9 111.5 111.2 107.5 101.9 103.4 90.2
営業利益率 Op. profit ratio (%) 3.9 4.8 5.1 4.7 4.3 5.3 5.5 4.7 4.6 4.8
菓子 3,191 6,288 14,861 20,431 4,075 6,877 14,539 19,004 2,314 3,565
Confectionery 前期比 YoY (%) 70.3 86.3 97.8 103.7 127.7 109.4 97.8 93.0 56.8 51.8
営業利益率 Op. profit ratio (%) 12.8 12.5 17.0 16.7 15.3 13.1 16.3 15.7 9.8 7.6
栄養 3,114 7,241 11,345 12,996 4,189 8,803 13,619 15,756 3,996 8,575
Nutritionals 前期比 YoY (%) 81.8 100.3 100.3 104.6 134.5 121.6 120.0 121.2 95.4 97.4
営業利益率 Op. profit ratio (%) 14.4 16.2 16.8 15.3 18.6 18.8 19.1 17.4 17.6 17.8
海外 -88 508 1,051 1,243 201 824 1,259 1,670 296 617
Overseas 前期比 YoY (%) ― 148.3 160.3 176.2 ― 162.1 119.8 134.4 146.8 74.8
営業利益率 Op. profit ratio (%) ― 2.3 3.0 2.6 1.8 3.5 3.5 3.5 2.6 2.6
その他国内子会社 1,275 2,354 3,420 3,815 881 2,078 2,978 3,559 769 1,726
Other Domestic Subsidiaries 前期比 YoY (%) 96.2 89.5 85.5 88.5 69.1 88.3 87.1 93.3 87.3 83.1
営業利益率 Op. profit ratio (%) 1.7 1.6 1.5 1.3 1.2 1.4 1.4 1.3 1.3 1.4
全社共通費 / Corporate expenses -2,101 -4,197 -6,966 -9,802 -2,021 -4,686 -6,982 -9,469 -2,046 -4,051
医薬品セグメント 1,486 5,115 15,157 14,243 977 8,227 15,605 15,984 -349 6,610
Pharmaceuticals segment 前期比 YoY (%) 76.4 117.5 200.2 129.2 65.7 160.8 103.0 112.2 ― 80.3
営業利益率 Op. profit ratio (%) 3.9 5.8 10.2 7.2 2.4 8.6 10.0 7.8 ― 7.4
国内事業 1,286 4,190 10,063 9,934 1,354 5,396 9,798 9,681 -2,665 -1,113
Japan 前期比 YoY (%) 88.9 178.0 241.4 150.0 105.3 128.8 97.4 97.5 ― ―
営業利益率 Op. profit ratio (%) 4.7 7.2 10.4 7.6 5.1 8.2 8.9 6.8 ― ―
海外事業 200 754 1,582 2,134 969 2,040 2,542 2,730 1,463 2,668
Overseas 前期比 YoY (%) 40.0 37.7 46.5 48.5 484.8 270.4 160.6 127.9 150.9 130.8
営業利益率 Op. profit ratio (%) 2.0 3.6 5.2 5.2 8.5 9.2 7.6 6.3 15.0 14.2
KMバイオロジクス*2 1,628 4,320 3,457 -1,542 801 2,185 3,899 -187 3,360
KM Biologics*2 前期比 YoY (%) ― ― ― ― 49.2 50.6 112.8 ― 419.1
営業利益率 Op. profit ratio (%) 16.3 18.0 11.1 ― 4.7 7.4 9.6 ― 18.3
修正・消去*3 / Adjustments and Eliminations*3 ― -1,458 -809 -1,281 195 -11 1,080 -327 1,040 1,695
*1 食品セグメントは、各事業区分の業績(消去後数値)を記載しております *3 修正・消去は、医薬品セグメント内の取引に伴う修正・消去額を記載しております。
In the Food segment, the post-elimination figure is indicated under this classification. Adjustments and eliminations indicates amounts adjusted and eliminated in relation to transactions within the pharmaceutical segment.
*2 2018年度第2四半期より、KMバイオロジクスの業績を記載しております。
KM Biologics earnings included beginning from the second quarter of FY2018.
セグメント情報 Segment Information
FY2020
Q1 Q1-Q2 Q1-Q3 通期Full-year
通期Full-yearQ1 Q1-Q2 Q1-Q3
FY2018
Q1 Q1-Q2 Q1-Q3 通期Full-year
FY2019

Meiji Holdings Co., Ltd. DATABOOK
13
(3)食品セグメント主力品売上高 (単体) Food Segment Sales by Main Products (Non-consolidated)(百万円/Millions of yen)
ヨーグルト 22,584 45,025 65,166 84,928 21,736 43,362 63,711 84,420 22,542 44,362Yogurt 前期比 YoY (%) 101.9 102.0 101.5 100.9 96.2 96.3 97.8 99.4 103.7 102.3
明治ブルガリアヨーグルト 21,006 41,915 60,659 78,871 19,825 39,061 57,663 76,143 20,693 40,648Meiji Bulgaria Yogurt 前期比 YoY (%) 102.5 102.3 101.8 101.1 94.4 93.2 95.1 96.5 104.4 4.1
プロバイオティクスヨーグルト 27,119 52,187 81,035 112,905 25,845 49,577 77,409 110,968 30,384 56,544Probiotics yogurt 前期比 YoY (%) 95.6 95.3 94.8 94.5 95.3 95.0 95.5 98.3 117.6 114.1
牛乳類 26,939 55,282 82,975 108,354 28,161 58,575 87,136 113,504 27,009 56,882Drinking milk 前期比 YoY (%) 97.8 98.3 100.3 101.1 104.5 106.0 105.0 104.8 95.9 97.1
明治おいしい牛乳 14,272 29,744 43,551 56,209 14,354 29,928 44,319 57,953 15,817 32,707Meiji Oishii Gyunyu 前期比 YoY (%) 96.7 96.2 96.9 97.3 100.6 100.6 101.8 103.1 110.2 109.3
チーズ 9,222 18,059 28,108 36,635 9,234 18,189 28,801 37,497 9,267 18,333Cheese 前期比 YoY (%) 104.4 105.0 104.9 104.1 100.1 100.7 102.5 102.4 100.4 100.8
明治北海道十勝チーズ 3,447 6,691 10,530 13,778 3,554 6,915 11,290 14,738 3,759 7,474Meiji Hokkaido Tokachi series 前期比 YoY (%) 101.7 104.5 105.4 105.6 103.1 103.3 107.2 107.0 105.8 108.1
アイスクリーム 12,271 28,395 37,266 45,106 12,164 27,529 36,602 44,410 12,037 27,915Ice cream 前期比 YoY (%) 105.6 106.9 104.2 104.7 99.1 96.9 98.2 98.5 99.0 101.4
チョコレート 17,924 36,693 67,215 95,464 19,928 39,358 70,123 97,154 19,259 38,171Chocolate 前期比 YoY (%) 82.5 87.2 89.4 91.7 111.2 107.3 104.3 101.8 96.6 97.0
スポーツ栄養 5,487 11,374 16,018 19,769 5,522 11,550 16,453 20,538 5,704 13,055Sports nutrition 前期比 YoY (%) 98.0 103.6 105.0 103.4 100.6 101.5 102.7 103.9 103.3 113.0
栄養*1 13,821 28,242 44,019 55,236 14,340 29,581 45,932 58,795 14,755 29,981
Nutritional products*1 前期比 YoY (%) 108.2 107.6 105.6 104.4 103.8 104.7 104.3 106.4 102.9 101.4
*1 栄養には、「乳幼児ミルク」「流動食」が含まれます。
Nutritional products includes infant formula and enteral formula.
セグメント情報 Segment Information
FY2020
Q1 Q1-Q2 Q1-Q3 通期Full-year
FY2019FY2018
通期Full-yearQ1 Q1-Q2 Q1-Q3Q1 Q1-Q2 Q1-Q3 通期
Full-year

Meiji Holdings Co., Ltd. DATABOOK
14
(4)医薬品セグメント主力品売上高 (単体) Pharmaceuticals Segment Sales by Main Products (Non-consolidated)
(百万円/Millions of yen)
シクレスト 867 1,833 2,804 3,723 1,031 2,074 3,236 4,362 895 2,040
SYCREST 前期比 YoY (%) 145.8 136.6 133.8 132.3 119.0 113.2 115.4 117.2 86.7 98.4
ビラノア 1,140 1,759 2,878 7,499 995 2,121 3,820 7,229 871 2,447
BILANOA 前期比 YoY (%) 526.5 385.1 233.5 232.1 87.3 120.6 132.7 96.4 87.6 115.4
リフレックス(GE含む) 2,226 4,381 6,764 8,619 1,499 3,341
REFLEX (includes Mirtazapine "meiji") 前期比 YoY (%) 49.7 44.2 45.0 51.0 67.3 76.3
メイアクト(GE含む) 1,361 2,530 4,137 5,391 450 1,161
MEIACT (includes Cefditoren "OK") 前期比 YoY (%) 94.2 89.4 86.0 85.7 33.1 45.9
タゾピペ 1,174 2,657 4,050 5,271 1,712 4,058 6,790 7,294 1,196 2,891
TAZOPIPE 前期比 YoY (%) 119.8 121.7 115.9 111.8 145.8 152.7 167.6 138.4 69.9 71.2
インフルエンザHAワクチン -28 7,090 15,186 14,862 -86 10,955
Influenza HA Vaccine 前期比 YoY (%) ― 764.1 354.5 377.2 ― 154.5
先発品計*3 12,575 26,768 43,967 56,269 10,100 29,508 52,266 66,624 10,308 32,905
Total brand name drugs*3 前期比 YoY (%) 106.3 103.5 107.2 102.6 80.3 110.2 118.9 118.4 102.1 111.5
ジェネリック医薬品計 10,964 22,839 35,499 46,966 12,228 24,691 38,510 48,667 9,059 21,091
Total generic drugs 前期比 YoY (%) 102.1 99.1 99.3 100.4 111.5 108.1 108.5 103.6 74.1 85.4
ヒト用ワクチン計 7,199 17,889 21,952 1,803 10,292 19,220 26,622 2,535 12,602
Total human vaccines 前期比 YoY (%) ― ― ― ― 143.0 107.4 121.3 140.6 122.4
血漿分画製剤計 1,736 3,652 5,547 1,016 3,545 5,967 7,951 1,853 3,700
Total blood plasma products 前期比 YoY (%) ― ― ― ― 204.1 163.4 143.3 182.4 104.4*1 2019年度より、国内医療用医薬品の表記方法を変更しております。
From the first quarter of FY2019, we changed the method of indicating domestic ethical pharmaceuticals. *2 国内医療用医薬品は、Meiji Seika ファルマの単体情報(受託製造販売分を除く)を記載しております。
Domestic ethical pharmaceuticals indicates non-consolidated information for Meiji Seika Pharma (excluding sales from contracted manufacturing).
*3 国内医療用医薬品の「先発品計」には、Meiji Seika ファルマが販売するヒト用ワクチンの売上高が含まれております。
“Total brand name drugs” under domestic ethical pharmaceuticals includes net sales from human vaccines sold by Meiji Seika Pharma.
*4 2018年度第2四半期より、KMバイオロジクスの単体情報を記載しております。
From the second quarter of FY2018, we indicated non-consolidated information for KM Biologics biological agents business.
KMバイオロジクス*4
KM Biologics*4
Q1-Q2 Q1-Q3 通期Full-year
国内医療用
医薬品*1,2
Ethicalpharmaceuticals
(Japan)*1,2
(参考)(By field)
FY2018
セグメント情報 Segment Information
FY2020
Q1-Q2 通期Full-yearQ1 Q1-Q3Q1 Q1-Q2 Q1-Q3 通期
Full-year
FY2019
Q1

Meiji Holdings Co., Ltd. DATABOOK
15
(5)医薬品開発品目一覧 List of New Products Under Development
【感染症領域 / Infectious disease】
【中枢神経系領域 / CNS disorders】
【新領域 / New fields】
【ワクチン / Vaccines】
【血漿分画製剤 / Blood Plasma Products】
開発コードName
剤型Type
薬効分類Efficacy Classification
備考Notes
Phase Ⅰ
Phase Ⅰ(海外 / Overseas) ME1100(アルベカシン / Arbekacin) 吸入剤
Inhalation
院内感染肺炎/人工呼吸器関連肺炎治療薬Hospital Acquired Bacterial Pneumonia/Ventilator Associated Bacterial Pneumonia treatment(HABP/VABP)
自社創製Discovered in-house
ステージStage
開発コードName
剤型Type
薬効分類Efficacy Classification
備考Notes
開発:HUYA Bioscience International社(米国)
In-license:HUYA Bioscience International, LLC(USA)
Phase Ⅱ(申請準備中 /
In preparation forapplication)
SP-02L(ダリナパルシン/Darinaparsin)
OP0595(ナキュバクタム / Nacubactam)注射剤
Injectionβ-ラクタマーゼ阻害薬
β-lactamase inhibitor自社創製Discovered in-house
Phase Ⅲ ME2112(ジプラシドン / Ziprasidone) 経口剤Oral
統合失調症治療薬Antipsychotic
導入元:ラクオリア創薬株式会社In-license: RaQualia Pharma Inc.
注射剤Injection
再発・難治性末梢性T細胞リンパ腫(PTCL)治療薬
Relapsed or refractory peripheral T-cell lymphoma (PTCL)開発:ソレイジア・ファーマ株式会社In-license: Solasia Pharma K.K.
ステージStage
自社開発KM Biologics Co., Ltd.
ステージStage
開発コードName
目標適応Target Disease
備考Notes
Phase Ⅲ KD-371 顕微鏡的多発血管炎における神経障害の改善(ステロイド剤が効果不十分な場合に限る) 希少疾病医薬品Indication expansion for microscopic polyangiitis (MPA) (orphan drug)
共同開発:帝人ファーマ株式会社Co-development: Teijin Pharma Limited
Phase Ⅱ/ Ⅲ(継続投与試験 /Extension study)
KD2-305血液凝固第VIII因子又は第IX因子に対するインヒビターを保有する患者の出血傾向の抑制
Suppression of bleeding tendency in patients with blood coagulation factor VIII or factor IX deficiency who have coagulationfactor inhibitaors
PhaseⅡ(国際共同臨床試験 /
Multi-Regional clinical trial)HBI-8000(ツシジノスタット/Tucidinostat) 経口剤
Oral再発・難治性末梢性T細胞リンパ腫(PTCL)治療薬
Relapsed or refractory peripheral T-cell lymphoma (PTCL)
申請中Filed (Under review)
Phase Ⅰ/ Ⅱ(準備中 /In preparation) KD-414 新型コロナウイルス感染症(COVID-19)の予防
Inactivated vaccine against COVID-19
Phase Ⅰ(海外 / Overseas) DMB-3115 注射剤
Injection
尋常性乾癬/関節症性乾癬/クローン病/潰瘍性大腸炎 (バイオ後続品)
Plaque psoriasis/Psoriatic arthritis/Crohn's disease/Ulcerative colitis (Biosimilar)
百日せき菌、ジフテリア菌、破傷風菌、ポリオウイルス、ヘモフィルスインフルエンザ菌b型による感染症の予防Pentavalent vaccine against diphtheria, tetanus, pertussis, polio, and haemophilus influenza type b
自社開発KM Biologics Co., Ltd.
ステージStage
開発コードName
剤型Type
備考Notes
共同開発:Dong-A Socio Holdings株式会社(韓国)
Co-development: Dong-A Socio Holdings Co., Ltd. (South Korea)
HBI-8000(ツシジノスタット/Tucidinostat) 経口剤Oral
再発・難治性成人T細胞白血病/リンパ腫(ATLL)治療薬
Relapsed or refractory adult T-cell leukemia-lymphoma (ATLL)開発:HUYA Bioscience International社(米国)
In-license:HUYA Bioscience International, LLC(USA)
Phase Ⅰ DMB-3111 注射剤Injection
乳癌/胃癌治療薬 (バイオ後続品)
Breast cancer/Gastric cancer (Biosimilar)
共同開発:Dong-A Socio Holdings株式会社(韓国)
導出先:Gedeon Richter Plc. (ハンガリー)
Co-development: Dong-A Socio Holdings Co., Ltd. (South Korea) Licensed out to Gedeon Richter Plc. (Hungary)
薬効分類Efficacy Classification
自社開発KM Biologics Co., Ltd.
セグメント情報 Segment Information
Phase Ⅰ(海外 / Overseas) KD-382 デング熱の予防
Quadrivalent vaccine against dengue fever自社開発KM Biologics Co., Ltd.
Phase Ⅰ/ Ⅱ KD-404 インフルエンザの予防
Egg-derived inactivated whole virus influenza vaccine共同開発: 北海道大学
Co-development: Hokkaido University
ステージStage
開発コードName
目標適応Target Disease
備考Notes
Phase IIIPhase II KD-370

Meiji Holdings Co., Ltd. DATABOOK
16
(6)国内主要関係会社情報 (連結) Information on major domestic affiliates (Consolidated)
株式会社 明治
Meiji Co., Ltd.明治フレッシュネットワーク株式会社
Meiji Fresh Network Co., Ltd.四国明治株式会社
Shikoku Meiji Co., Ltd.群馬明治株式会社
Gunma Meiji Co., Ltd.明治油脂株式会社
Meiji Oils and Fats Co., Ltd.明治チューインガム株式会社
Meiji Chewing Gum Co., Ltd.東海ナッツ株式会社
Tokai Nuts Co., Ltd.明治産業株式会社
Meiji Sangyo Co., Ltd.明治フードマテリア株式会社
Meiji Food Materia Co., Ltd.株式会社ケー・シー・エス
KCS Co., Ltd.明治ロジテック株式会社
Meiji Logitech Co., Ltd.明治飼糧株式会社
Meiji Feed Co., Ltd.株式会社明治アドエージェンシー
Meiji Ad Agency Co., Ltd.日本罐詰株式会社
Nihon Kanzume, Co., Ltd.Meiji Seika ファルマ株式会社
Meiji Seika Pharma Co., Ltd.KMバイオロジクス株式会社
KM Biologics Co., Ltd.北里薬品産業株式会社
Kitasato Pharmaceutical Industry Co., Ltd.大蔵製薬株式会社 医薬品 製造・販売
Ohkura Pharmaceutical Co., Ltd. Pharmaceuticals Sales and Production
缶詰 製造・販売
飼料 製造・販売
Feedstuffs Sales and Production
Foods
Sugar, Corn sweeteners, Functional materials Sales
― 運送
Purchasing, Processing, Sales, Logistics
Logistics
砂糖・糖化穀粉・機能性素材 販売
Vaccines for human Sales
食料品 仕入・加工・販売・運送
医療用医薬品、農薬、動物薬 製造・販売
Ethical pharmaceuticals, Agricultural chemicals, Veterinary drugs Sales and Production
ヒト用ワクチン 販売
― 宣伝広告
Advertisement
Canned food Sales and Production
Vaccines and blood plasma products
Dairy products Sales牛乳・飲料・菓子 製造・販売
Drinking milk, Beverages, Confectionery Sales and Production
Sales and Production
菓子・その他食料品 製造・販売
油脂類 製造・販売
Oils and Fats Sales and Production
Nuts, Fried confectionery products Sales and Production
Confectionery, Other foods Sales and Productionナッツ・油菓品 製造・販売
セグメント情報 Segment Information
セグメントSegment
会社名Name
取扱品Product
機能Function
事業
Business
医薬品Pharmaceuticals
発酵デイリーFresh and
fermented dairy
加工食品Processed food
菓子Confectionery
その他Other
食品Food
Research, Development, Manufacturing and Supply
牛乳・乳製品、菓子、食品の製造販売等
Dairy products, Confectionery, Other foods製造・販売
Sales and Production
ヒト用ワクチン、血漿分画製剤、動物用ワクチン 研究・開発・製造・供給
Confectionery, Other foods Sales and Production
菓子・その他食料品 製造・販売
牛乳・乳製品 販売
牛乳・飲料 製造・販売
Drinking milk, Beverages

Meiji Holdings Co., Ltd. DATABOOK
17
(7)海外主要関係会社情報 Information on major Overseas affiliates
明治(中国)投資有限公司
Meiji China Investment Co., Ltd.明治乳業(天津)有限公司
Meiji Dairies (Tianjin) Co., Ltd.明治制果食品工業(上海)有限公司
Meiji Seika Food Industry (Shanghai) Co., Ltd.明治乳業(蘇州)有限公司
Meiji Dairies (Suzhou) Co., Ltd.明治雪糕(広州)有限公司
Meiji Ice Cream (Guangzhou) Co., Ltd.廣州明治制果有限公司
Guangzhou Meiji Confectionary Co., Ltd.メイジセイカ・シンガポール
Meiji Seika (Singapore) Pte.Ltd.台湾明治食品股份有限公司 連結 台北市 粉ミルク 輸入・販売
Taiwan Meiji Food Co., Ltd. Taipei Infant formula Import and SalesCP メイジ
CP-MEIJI CO., LTDタイ・メイジ・フード
Thai Meiji Food Co., Ltd.P.T. メイジフードインドネシア
PT Meiji Food Indonesiaメイジ・インディア
MEIJI INDIAメイジデイリー・オーストラレイシア
スタウファー・ビスケット
D.F. Stauffer Biscuit Co., Incラグーナ・クッキー
Laguna Cookie Co., Inc.明治アメリカ
Meiji America Inc.明治医薬(山東)有限公司
Meiji Pharma (Shandong) Co., Ltd.汕頭経済特区明治医薬有限公司 広東省
Shantou Meiji Pharmaceutical Co., Ltd. Guangdongタイ・メイジ・ファーマシューティカル
Thai Meiji Pharmaceutical Co., Ltd.P.T. メイジ・インドネシア・ファーマシューティカル
P.T.Meiji Indonesian Pharma.Incメドライク
Medreich Limitedメイジ・ファルマ・スペイン, S.A.
Meiji Pharma Spain, S.A.
Sales and Production連結 ジャカルタ 医療用医薬品 製造・販売
Consolidated Jakarta Ethical pharmaceuticals Sales and Production
Madrid Ethical pharmaceuticals Sales and Production
連結 バンガロール 医療用医薬品・ジェネリック医薬品 受託開発・製造・販売
Consolidated Bangalore Ethical pharmaceuticals, Generic drugs Consigned development, Sales and Production連結 マドリッド 医療用医薬品 製造・販売
Confectionery Sales and Production
連結 バンコク ジェネリック医薬品 製造・販売
Consolidated Bangkok Generic drugs
医療用医薬品
Pennsylvania Confectionery Sales
Ethical pharmaceuticals製造・販売
Sales and Production
製造・販売
Consolidated Shandong Ethical pharma ceuticals, Veterinary drugs Sales and Production連結 山東省 医療用医薬品・動物薬
連結 ペンシルバニア 菓子 販売
メルボルン
―豪州情報の収集、乳製品・飼料貿易
MEIJI DAIRY AUSTRALASIA PTY.LTD. Non-consolidated Melbourne Australia information gathering,Dairy products and feedstuffs trade
連結 カリフォルニア 菓子 製造・販売
Consolidated California Confectionery Sales and Production
ペンシルバニア 菓子 製造・販売
Consolidated Pennsylvania
ムンバイ 菓子・健康食品 製造・販売
Non-consolidated Mumbai Confectionery, Healthcare products Sales and Production
カラワン 菓子 製造・販売
Non-consolidated Karawang Confectionery Sales and Production
Bangkok Confectionery Purchasing and Sales
バンコク 乳製品 製造・販売
Equity method Bangkok Dairy products Sales and Production
シンガポール 菓子・調整品 製造・販売
Consolidated Singapore Confectionery, Prepared products Sales and Production
Consolidated
持分法 バンコク 菓子 仕入販売
セグメント情報 Segment Information
セグメントSegment
地域Area
会社名Name
所在地Location
取扱品Product
機能Function
広州市 アイスクリーム 製造・販売
Sales and Production連結 蘇州市 乳製品 製造
Consolidated Suzhou Dairy products Production
上海市 中国事業会社の経営管理等
Shanghai Business management of operating companies―
広州市 菓子 製造・販売
Non-consolidated Guangzhou Confectionery Sales and Production
連結 天津市 乳製品 製造・販売
Consolidated Tianjin上海市 菓子 製造・販売
Shanghai Confectionery
連結
Guangzhou Ice cream Sales and Production
Dairy products Sales and Production
米国U.S.A.
医薬品Pharmaceuticals
食品Food
連結
Consolidated
Consolidated
持分法
非連結
非連結
連結
Consolidated
Consolidated
Consolidated
連結
Consolidated
連結
アジアAsia
オセアニアOceania
非連結
アジアAsia
ヨーロッパEurope
連結
Equity method
非連結

Meiji Holdings Co., Ltd. DATABOOK
18
(1)主要製品国内市場シェア(2019年度) Market Share of Main products in Japan (FY2019)
食品セグメント Food Segment
ヨーグルト Yogurt 牛乳類 Drinking milk ナチュラルチーズ Natural cheeseshare 41.9% [No.1] share 21.4% [No.1] share 7.8% [No.5]
アイスクリーム Ice cream チョコレート Chocolate グミ Gummy productsshare 9.9% [No.5] share 24.2% [No.1] share 26.7% [No.1]
粉末・顆粒プロテイン Powdered & granulated protein 粉ミルク Infant formulashare 44.6% [No.1] share 40.6% [No.1]
(Excluding commercial products)
share 29.6% [No.2]
市場情報 Market Data
流動食(市販向け除く)
Enteral formula
7.8%市場規模
Market Scale2,488億円
248.8billion yen
市場規模Market Scale
3,933億円393.3 billion yen
41.9% 21.4%市場規模
Market Scale1,362億円
136.2 billion yen
44.6%
24.2% 26.7%
40.6% 29.6%
市場規模Market Scale
5,630億円563.0 billion yen
9.9%
市場規模Market Scale
5,004億円500.4 billion yen
市場規模Market Scale
699億円69.9 billion yen
市場規模Market Scale
320億円32.0 billion yen
市場規模Market Scale
350億円35.0 billion yen
市場規模Market Scale
964億円96.4 billion yen
データ元: インテージ社、SRISource: INTAGE Inc., SRI
データ元: インテージ社、SDISource: INTAGE Inc., SDI
データ元(シェア):インテージ社、SRISource of share: INTAGE Inc., SRIデータ元(市場規模):全日本菓子協会Source of market scale: ALL NIPPON KASHI ASSOCIATION
※当社調べ Based on Meiji data as of March 2020
※
※
※
※
※
※
データ元(シェア): インテージ社、SRISource of share: INTAGE Inc., SRI データ元(市場規模):全日本菓子協会Source of market scale: ALL NIPPON KASHI ASSOCIATION
データ元: インテージ社、SRISource: INTAGE Inc., SRI
※
※

Meiji Holdings Co., Ltd. DATABOOK
19
(1)主要製品国内市場シェア(2019年度) Market Share of Main products in Japan (FY2019) 医薬品セグメント Pharmaceuticals Segment
全身性抗菌剤 抗うつ薬+非定型抗精神病薬 ジェネリック医薬品
Systemic antibacterial drugs Antidepressant + atypical antipsychotic drug Generic drugsshare 18.0% [No.1] share 8.2% [No.4] [No.4]
イネいもち病防除粒剤 いもち病箱処理剤の出荷データ
Rice blast preventives (Agricultural chemicals) Shipping data of Rice blast preventivesshare 37.1% [No.1]
市場情報 Market Data
市場規模Market Scale
2,807億円280.7 billion yen
市場規模Market Scale
1,996億円199.6 billion yen
18.0%8.2%
9.0%
Copyrightⓒ2020IQVIA. *Definition of MeijiCalculated based on JPM 2020 Mar MATReprinted with permission
Copyrightⓒ2020IQVIA. *Definition of MeijiCalculated based on JPM 2020 Mar MATReprinted with permission
出典:2019年度クレコン リサーチ&コンサルティング(株)Source: CRECON RESEARCH & CONSULTING, INC., FY2019
市場規模Market Scale
8189.1トン8189.1 tons
出典:一般社団法人日本植物防疫協会農薬要覧2019年版
(2018年の出荷実績)Source: Based on Handbook of Agricultural Chemicals -2019-, Japan Plant Protection Association
37.1%
Meiji Holdings Co., Ltd. DATABOOK
20
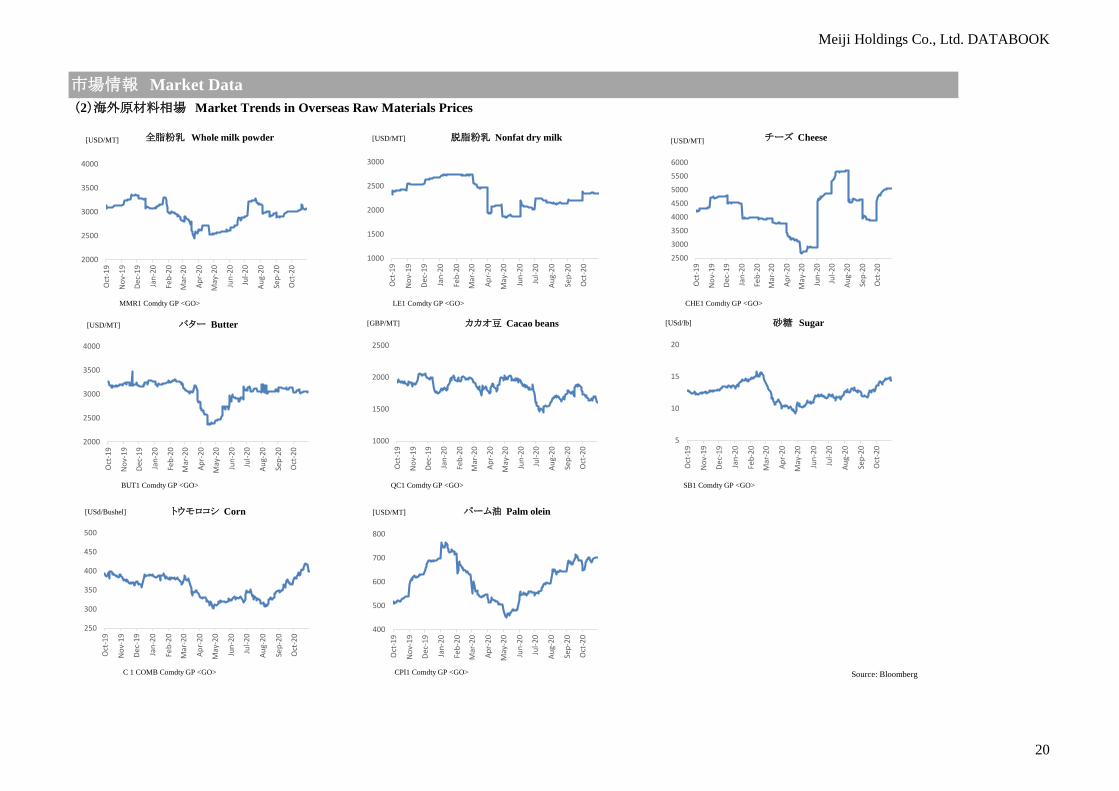
(2)海外原材料相場 Market Trends in Overseas Raw Materials Prices
MMR1 Comdty GP <GO> LE1 Comdty GP <GO> CHE1 Comdty GP <GO>
BUT1 Comdty GP <GO> QC1 Comdty GP <GO> SB1 Comdty GP <GO>
C 1 COMB Comdty GP <GO> CPI1 Comdty GP <GO> Source: Bloomberg
市場情報 Market Data
全脂粉乳 Whole milk powder[USD/MT] チーズ Cheese脱脂粉乳 Nonfat dry milk
バター Butter 砂糖 Sugar[USd/lb][GBP/MT]
[USD/MT]
[USD/MT]
[USD/MT]
[USD/MT]
[USd/Bushel] パーム油 Palm olein
カカオ豆 Cacao beans
トウモロコシ Corn
2000
2500
3000
3500
4000
Oct
-19
Nov
-19
Dec-
19
Jan-
20
Feb-
20
Mar
-20
Apr-
20
May
-20
Jun-
20
Jul-2
0
Aug-
20
Sep-
20
Oct
-20
1000
1500
2000
2500
3000
Oct
-19
Nov
-19
Dec-
19
Jan-
20
Feb-
20
Mar
-20
Apr-
20
May
-20
Jun-
20
Jul-2
0
Aug-
20
Sep-
20
Oct
-20
2500
3000
3500
4000
4500
5000
5500
6000
Oct
-19
Nov
-19
Dec-
19
Jan-
20
Feb-
20
Mar
-20
Apr-
20
May
-20
Jun-
20
Jul-2
0
Aug-
20
Sep-
20
Oct
-20
2000
2500
3000
3500
4000
Oct
-19
Nov
-19
Dec-
19
Jan-
20
Feb-
20
Mar
-20
Apr-
20
May
-20
Jun-
20
Jul-2
0
Aug-
20
Sep-
20
Oct
-20
1000
1500
2000
2500
Oct
-19
Nov
-19
Dec-
19
Jan-
20
Feb-
20
Mar
-20
Apr-
20
May
-20
Jun-
20
Jul-2
0
Aug-
20
Sep-
20
Oct
-20
5
10
15
20
Oct
-19
Nov
-19
Dec-
19
Jan-
20
Feb-
20
Mar
-20
Apr-
20
May
-20
Jun-
20
Jul-2
0
Aug-
20
Sep-
20
Oct
-20
250
300
350
400
450
500
Oct
-19
Nov
-19
Dec-
19
Jan-
20
Feb-
20
Mar
-20
Apr-
20
May
-20
Jun-
20
Jul-2
0
Aug-
20
Sep-
20
Oct
-20
400
500
600
700
800
Oct
-19
Nov
-19
Dec-
19
Jan-
20
Feb-
20
Mar
-20
Apr-
20
May
-20
Jun-
20
Jul-2
0
Aug-
20
Sep-
20
Oct
-20

Meiji Holdings Co., Ltd. DATABOOK
21
(3)牛乳・乳製品統計 Statistics Related to Drinking Milk and Dairy Products in Japan
市場情報 Market Data
3,158
1,139
1,033
409 0
500
1,000
1,500
2,000
2,500
3,000
3,500
4,000
4,500
1999
2000
2001
2002
2003
2004
2005
2006
2007
2008
2009
2010
2011
2012
2013
2014
2015
2016
2017
2018
2019
牛乳 Drinking milk乳飲料 Milk-based drinksはっ酵乳 Fermented milk加工乳・成分調整牛乳 Processed milk and composition-adjusted milk
156
130
11565
0
50
100
150
200
250
1999
2000
2001
2002
2003
2004
2005
2006
2007
2008
2009
2010
2011
2012
2013
2014
2015
2016
2017
2018
2019
チーズ Cheese 脱脂粉乳 Nonfat dry milk
クリーム Fresh cream バター Butter
3,27
0 4,
091
0
1,000
2,000
3,000
4,000
5,000
6,000
7,000
8,000
9,000
10,000
1999
2000
2001
2002
2003
2004
2005
2006
2007
2008
2009
2010
2011
2012
2013
2014
2015
2016
2017
2018
2019
都府県 Other Prefectures 北海道 Hokkaido
7,362
21.5
8.1
0
10
20
30
40
1998
1999
2000
2001
2002
2003
2004
2005
2006
2007
2008
2009
2010
2011
2012
2013
2014
2015
2016
2017
2018
2019
バター Butter
脱脂粉乳 Nonfat dry milk
28.8
76.3
0
10
20
30
40
50
60
70
80
90
100
1999
2000
2001
2002
2003
2004
2005
2006
2007
2008
2009
2010
2011
2012
2013
2014
2015
2016
2017
2018
2019
バター Butter
脱脂粉乳 Nonfat dry milk
15,0
00
0
5,000
10,000
15,000
20,000
25,000
30,000
35,000
40,000
1999
2000
2001
2002
2003
2004
2005
2006
2007
2008
2009
2010
2011
2012
2013
2014
2015
2016
2017
2018
2019
国内生乳生産量Raw milk production volume in Japan
[1,000 t] [1,000 t]
国内主要乳製品生産量Dairy products production volume in Japan
国内牛乳等生産量Drinking milk production volume in Japan
主要乳製品輸入量Dairy products import volume
国内乳製品月末在庫量Month-end inventory of dairy products in Japan
国内乳用牛飼養戸数Number of dairy farms in Japan
[1,000 t]
[1,000 t]
出所:総務省Source: Ministry of Intemal Affaires and Communications
[戸]
出所:独立行政法人 農畜産業振興機構Source: Aguliculture & Livestock Industries Corporation
[1,000 t]
出所:農林水産省Source: Ministry of Agriculture, Forestry and Fisheries
出所:農林水産省Source: Ministry of Agriculture, Forestry and Fisheries
出所:農林水産省Source: Ministry of Agriculture, Forestry and Fisheries
出所:農林水産省Source: Ministry of Agriculture, Forestry and Fisheries

Meiji Holdings Co., Ltd. DATABOOK
22
(3)牛乳・乳製品統計 Statistics Related to Drinking Milk and Dairy Products in Japan
2009/10/1 2010/4/1 2011/4/1 2012/4/1 2013/10/1 2014/4/1 2015/4/1 2016/4/1 2017/4/1 2018/4/1 2019/4/1 2020/4/1
― ― ― +3 +5 ― +3 ― ― ― +4 ―
― ― ― ― ― ― +3 ― ― ― +4 ―
― ― +1 ― ― +1.5 +2 ― +1 ― ― ―
-9 ― +3 +3 +1 +10 +5 ― +1 +4 ― ―
-5 ― ― +2 +1 +8 +5 ― +2 +5 ― ―
― -3 +0.5 +2.5 ― +3 +3 ― ― ― ― ―
― -1 +1 +3 ― +2 +3 ― ― ― ― ―
― ― ― ― ― ― +3 ― ― ― ― ―
― ― ― +1 ― ― ― ― ― ― ― ―
市場情報 Market Data
用途 Use
飲用 Drinking milk
はっ酵乳等 Fermented milk
加工(脱脂粉乳・バター等) Skim milk and butter
チーズ(ハード) Cheese (Hard)
チーズ(ソフト) Cheese (Soft)
生クリーム等(生クリーム) Cream (Cream)
生クリーム等(脱脂濃縮乳) Cream (Concentrated skim milk)
生クリーム等(その他) Cream (Other)
その他(飲料・アイスクリーム等) Other (Drink, icecream, etc)
24.9
3.2
8.9
10.4
0
5
10
15
20
25
30
35
40
1998
1999
2000
2001
2002
2003
2004
2005
2006
2007
2008
2009
2010
2011
2012
2013
2014
2015
2016
2017
2018
牛乳 Drinking milk加工乳 Processed milk乳飲料 Milk-based drinksはっ酵乳 Fermented milk1,332,000
88.8
0
10
20
30
40
50
60
70
80
90
100
1,000,000
1,200,000
1,400,000
1,600,000
1,800,000
2,000,000
2,200,000
1999
2000
2001
2002
2003
2004
2005
2006
2007
2008
2009
2010
2011
2012
2013
2014
2015
2016
2017
2018
2019
飼養頭数(めす)(左) Number of female dairy cows (Left)
1戸当たり飼養頭数(右) Number of female dairy cows per dairy farmer (Right)
国内乳用牛飼養頭数(めす)および1戸あたり飼養頭数(めす)Number of female dairy cows in Japan
[頭] [㍑/Liter]
国内牛乳乳製品の年間1人当たりの消費量Annual dairy consumption in Japan per capita
出所:一般社団法人 JミルクSource: Japan Dairy Association (J-milk)
出所:総務省Source: Ministry of Intemal Affaires and Communications
ホクレン 用途別原料乳 価格改定Change of Hokuren's raw milk price by use
出所:ホクレン農業協同連合会Source: Hokuren Group
[¥/Kg]
各国の年間1人当たりの牛乳消費量Annual drinking milk consumption in each country per capita
30.9
21.4
102.4
65.3
101.8
10
30
50
70
90
110
2012
2013
2014
2015
2016
2017
2018
日本 Japan
中国 China
イギリス UK
アメリカ US
オーストラリア Australia
[Kg]
出所:一般社団法人 JミルクSource: Japan Dairy Association (J-milk)

Meiji Holdings Co., Ltd. DATABOOK
23
(4)カカオ豆・チョコレート関連統計 Statistics Related to Cacao beans and Chocolate
市場情報 Market Data
53.5
0
20
40
60
80
1997
1998
1999
2000
2001
2002
2003
2004
2005
2006
2007
2008
2009
2010
2011
2012
2013
2014
2015
2016
2017
2018
2019
2,220
830
200
220
0
500
1,000
1,500
2,000
コートジボワール Ivory Coastガーナ Ghanaブラジル Brazilインドネシア Indonesia
4,84
9
4,783
2,000
2,500
3,000
3,500
4,000
4,500
5,000生産量 Production
磨砕量 Grinding
254
150
170
190
210
230
250
270
290
1998
1999
2000
2001
2002
2003
2004
2005
2006
2007
2008
2009
2010
2011
2012
2013
2014
2015
2016
2017
2018
2.19
1.2
1.4
1.6
1.8
2.0
2.2
2.4
1998
1999
2000
2001
2002
2003
2004
2005
2006
2007
2008
2009
2010
2011
2012
2013
2014
2015
2016
2017
2018
世界カカオ豆需給量Global supply and demand of cacao beans
[1,000 t] [1,000 t]
世界主要国別カカオ豆生産量Production volume of cacao beans by country
日本のカカオ豆輸入量Import volume of cacao beans in Japan
チョコレート製品国内生産量Chocolate production in Japan
チョコレート製品国内1人当たり年間消費量Annual chocolate consumption in Japan per capita
[kg]
[1,000 t]
[1,000 t]
出所:日本チョコレート・ココア協会Source: Chocolate & cocoa association of Japan
出所:日本チョコレート・ココア協会Source: Chocolate & cocoa association of Japan
出所:日本チョコレート・ココア協会Source: Chocolate & cocoa association of Japan
出所:日本チョコレート・ココア協会Source: Chocolate & cocoa association of Japan
出所:日本チョコレート・ココア協会Source: Chocolate & cocoa association of Japan
チョコレート製品各国の1人当たり年間消費量 (2017)Annual chocolate consumption in each country per capita (2017)
11.1
2.1
0
2
4
6
8
10
12
出所:日本チョコレート・ココア協会、国際菓子協会、欧州製菓協会Source: Chocolate & cocoa association of Japan, ICA, CAOBISCO
[kg]

Meiji Holdings Co., Ltd. DATABOOK
24
(5)厚生関連統計 Public Welfare Statistics
医薬品・健康グッズ・トイレタリーMedicine, health goods, toiletries 50.1%
化粧品・香水Cosmetics, perfume 42.2%
衣類Clothes 36.6%
その他食料品・飲料・酒・たばこOther food, drink & tobacco 57.0%
市場情報 Market Data
費目Spending
購入率Purchasing rate
菓子類Confectioneries 69.5%
865
7.0%
0%
5%
10%
15%
0
200
400
600
800
1,000
1,200
1,400
1,600
1,800
1980
1985
1990
1995
2000
2005
2010
2011
2012
2013
2014
2015
2016
2017
2018
2019
出生数 Number of births (左/Left)
出生率 Birth rate (右/Right)
50.9
14.0
27.6%
0%
5%
10%
15%
20%
25%
30%
0
10
20
30
40
50
60
70
1986
1989
1992
1995
1998
2001
2004
2007
2010
2013
2014
2015
2016
2017
2018
世帯総数 The total number of households (左/Left)高齢者世帯 Number of Senior citizen households (左/Left)高齢者世帯割合 Senior citizen households rate (右/Right)38.4%
0%
10%
20%
30%
40%
50%
0
50
100
150
200
1955
1960
1965
1970
1975
1980
1985
1990
1995
2000
2005
2010
2015
2020
2025
2030
2035
2040
2045
2050
2055
2060
2065
65歳以上 Old-age (65 and over) (左/Left)15~64歳 Working-age (15 to 64) (左/Left)0~14歳 Young-age (0 to 14) (左/Left)高齢者割合 Senior citizen rate (右/Right)
38.3%
0%
5%
10%
15%
20%
25%
30%
35%
40%
45%
2000
2010
2020
2030
2040
2050
2060
2070
2080
2090
2100
日本 Japanカナダ Canadaアメリカ U.S.Aフランス Franceドイツ Germanyイタリア Italyオランダ The Netherlandsイギリス U.K.
31,8
82
48,135
0
10,000
20,000
30,000
40,000
50,000
60,000
0
5,000
10,000
15,000
20,000
25,000
30,000
35,000
2010 2011 2012 2013 2014 2015 2016 2017 2018 2019
総数 Total (左/Left)
旅行消費額 Expenditures (右
/Right)
日本の総人口と高齢者人口割合(将来推計)Future Japanese population projections
[万人/10 thousands of people][千人/Thousands of people]
出所:国立社会保障・人口問題研究所Source: National Institute of Population and Social Security
高齢者世帯数Number of senior citizen households in Japan
日本の出生数・出生率Number of births and birth rate in Japan
老年人口割合の国際比較Global trend in elderly population
訪日外国人旅行者数と旅行消費額Numbers and expenditures of foreign tourists to Japan
訪日外国人旅行者の費目別購入率 (2019)Purchasing rate by spending type for
foreign visitors to Japan[千人/Thousands of people]
[百万世帯/Millions of households]
出所:厚生労働省Source: Ministry of Health, Labour and Welfare
出所:厚生労働省Source: Ministry of Health, Labour and Welfare
出所:観光庁Source: Japan Tourism Agency
出所:日本政府観光局、観光庁Source: Japan National Tourism Organization and Japan Tourism Agency
[億円/100 millions of yen]
出所:国立社会保障・人口問題研究所Source: National Institute of Population and Social Security

Meiji Holdings Co., Ltd. DATABOOK
25
(6)医薬品関連統計 Pharmaceutical statistics
改正年月日
Date revised
2004/4/12006/4/12008/4/12010/4/12012/4/12014/4/12016/4/12018/4/1
2019/10/12020/4/1
市場情報 Market Data
収載品目数
Number of listed drugs
改定率(薬剤費ベース)Revision rate
(Drug cost based)11,99313,31114,35915,45514,90215,303 -2.65
-7.79-7.48-2.40
-4.20-6.70-5.20-5.75-6.00
14,041 -4.38
15,91716,43216,510
34.9% 35.8%39.9%
46.9%
55.5% 56.2%
66.4%68.9%
74.7%
80.0%77.1%
30%
40%
50%
60%
70%
80%
90%
07/9 09/9 11/9 13/9 14/11 15/9 16/12 17/12 18/12 19/12 19-20(E)
48.8
57
.8
22.0%
15%
20%
25%
0
10
20
30
40
50
60
70
1996
1997
1998
1999
2000
2001
2002
2003
2004
2005
2006
2007
2008
2009
2010
2011
2012
2013
2014
2015
2016
2017
2020
2025
国民医療費 National medical expenditures
薬剤費比率 Drug cost ratio
58,6
78
17.3%
10%
15%
20%
25%
30%
35%
0
20,000
40,000
60,000
80,000
100,000
120,000
140,000
FY20
08
FY20
09
FY20
10
FY20
11
FY20
12
FY20
13
FY20
14
FY20
15
FY20
16
FY20
17
FY20
18
医療用医薬品総計 Total sales
長期収載品比率 Long-term listed product ratio
1,000
3,000
5,000
7,000
9,000
11,000
13,000
15,000
2007 2008 2009 2010 2011 2012 2013 2014 2015 2016 2017 2018
循環器官用薬 Cardiovascular agents中枢神経系用薬 Central nervous system agents その他の代謝性医薬品 Other metabolic drugs血液・体液用薬 Blood and body fluid agents 消化器官用薬 Digestive organ agents 腫瘍用薬 Antitumor agents外皮用薬 Topical medication
国民医療費と薬剤費比率Ratio of national medical expenditures to drug cost in Japan
[兆円/Trillions of yen] [億円/100 millions of yen]
出所:中央社会保険医療協議会、健康保険組合連合会Source: Central Social Insurance Medical Council
National Federation of Health Insurance Societies
ジェネリック医薬品シェア(数量ベース)Generic drugs share (volume-based)
医療用医薬品の売上高と薬剤種別の売上構成比率Net sales of ethical pharmaceuticals and
breakdown of net sales per long term listed products
医薬品薬効分類別 国内生産金額Pharmaceutical therapeutic category
/Domestic shipment value
薬価改定National Health Insurance (NHI)
price revision in Japan[億円/100 millions of yen]
出所:厚生労働省Source: Ministry of Health, Labour and Welfare
出所:厚生労働省、日本ジェネリック製薬協会Source: Ministry of Health, Labour and Welfare
Japan Generic Medicines Association
出所:厚生労働省Source: Ministry of Health, Labour and Welfare
出所:厚生労働省Source: Ministry of Health, Labour and Welfare
Meiji Holdings Co., Ltd. DATABOOK
26
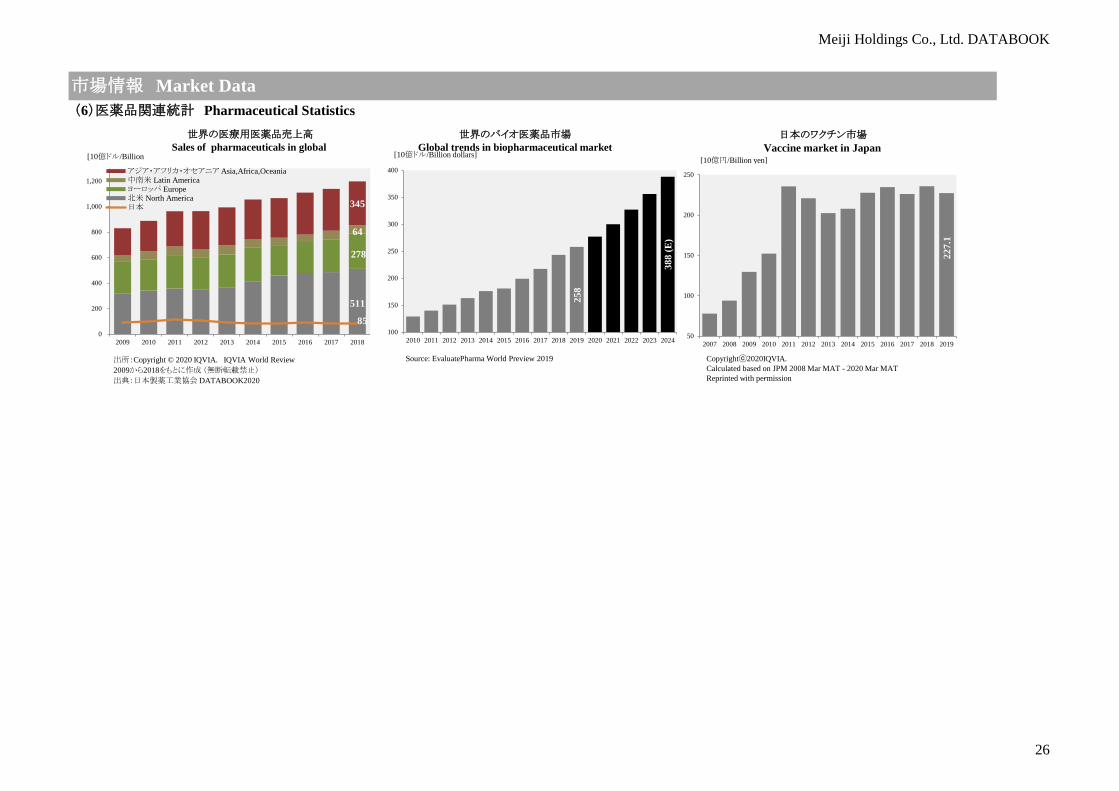
(6)医薬品関連統計 Pharmaceutical Statistics
市場情報 Market Data
511
278
64
345
850
200
400
600
800
1,000
1,200
2009 2010 2011 2012 2013 2014 2015 2016 2017 2018
アジア・アフリカ・オセアニア Asia,Africa,Oceania中南米 Latin Americaヨーロッパ Europe北米 North America日本
世界の医療用医薬品売上高Sales of pharmaceuticals in global
[10億ドル/Billion dollars][10億円/Billion yen]
出所:Copyright © 2020 IQVIA. IQVIA World Review 2009から2018をもとに作成 (無断転載禁止)
出典:日本製薬工業協会 DATABOOK2020
世界のバイオ医薬品市場Global trends in biopharmaceutical market
日本のワクチン市場
Vaccine market in Japan
258
388
(E)
100
150
200
250
300
350
400
2010 2011 2012 2013 2014 2015 2016 2017 2018 2019 2020 2021 2022 2023 2024
Source: EvaluatePharma World Preview 2019
227.
1
50
100
150
200
250
2007 2008 2009 2010 2011 2012 2013 2014 2015 2016 2017 2018 2019
Copyrightⓒ2020IQVIA.Calculated based on JPM 2008 Mar MAT - 2020 Mar MATReprinted with permission
[10億ドル/Billion

Meiji Holdings Co., Ltd. DATABOOK
27
(1)大株主の状況 Major Shareholders (2020年9月30日現在 As of September 30, 2020) (2)株価および出来高の推移 Stock Price and Trading Volume
日本マスタートラスト信託銀行㈱ (信託口) 16,387,300The Master Trust Bank of Japan, Ltd.(Trust Account)㈱日本カストディ銀行(信託口) 8928100
日本生命保険(相) 3348014Nippon Life Insurance Company㈱みずほ銀行 3117386Mizuho Bank, Ltd.農林中央金庫 2892202The Norinchukin Bank㈱日本カストディ銀行(信託口5) 2770400 (3)株式所有別分布状況 Shareholding by Type of Shareholder
(2020年9月30日現在 As of September 30, 2020)
明治ホールディングス取引先持株会 2619748 ■金融機関
Meiji Holdings Trading-Partner Shareholding Association Financial Institutions明治ホールディングス従業員持株会 2541935 ■個人・その他
Meiji Holdings Employee Shareholding Association Individuals and Others㈱りそな銀行 2347344 ■外国法人等
Resona Bank, Limited Foreign Companies, etc.2264784 ■その他の法人
Other Companies上位10名の合計 47,217,213 ■金融商品取引業者
Total of Top 10 Shareholders Financial Instruments Dealers■政府・地方公共団体
*上記の他に、当社が自己株式を7,582千株(持株比率4.97%)所有しております。 30.925% Government and Public Bodies In addition to the shares above, the Company owns 7,582 thousands shares of treasury stock (a 4.97% shareholding). * 自己株式は、「個人・その他」に含まれています。
"Indivisuals and Others" includes treasury stock.
STATE STREET BANK WEST CLIENT-TREATY 505234
Custody Bank of Japan, Ltd.(Trust Account)
Custody Bank of Japan, Ltd.(Trust Account 5)
―
41.24%
23.90%
23.08%
9.88%
1.90%
3,348
3,117
2,892
2,770
2.04
2.19
8,928
株式情報 Stock Information
株主名Name
所有株式数(千株)
Number of shares held(Thousands)
発行済株式総数に対する所有株式数の割合(%)
Percentage of totalshares issued (%)
16,387 10.73
5.85
152,683,400
1.89
1.81
2,541
2,619 1.72
1.66
30.93
1.48
1.54
47,217
2,264
2,347
152,683千株
Thousandshares
売買高(千株)Trading Volume (Thousand Million)
株価(円)Stock Price (Yen)
0
2,000
4,000
6,000
8,000
10,000
05,000
10,00015,00020,00025,00030,00035,00040,00045,000
19/10 19/11 19/12 20/1 20/2 20/3 20/4 20/5 20/6 20/7 20/8 20/9

Meiji Holdings Co., Ltd. DATABOOK
28
(1)会社情報 Corporate Data (2020年3月31日現在 As of March 31, 2020)
■商号 明治ホールディングス株式会社 (証券コード:2269) ■決算期日 3月31日
Company Name Meiji Holdings Co., Ltd. (Securities code:2269) Fiscal Year-End March 31
■本社所在地 〒104-0031 東京都中央区京橋二丁目4番16号 ■定時株主総会 6月下旬
Head Office 2-4-16, Kyobashi, Chuo-ku, Tokyo 104-0031, Japan Ordinary General Late in JuneMeeting of Shareholders
■設立 2009年4月1日
Incorporated April 1, 2009 ■株主名簿管理人 三菱UFJ信託銀行株式会社
Transfer Agent of Common Stock Mitsubishi UFJ Trust and Banking Corporation■資本金 300億円
Paid-in Capital 30 billions of yen ■グループ従業員数
Number of Group Employees ■発行済株式総数
Common Stock Issued ■お問い合わせ先 明治ホールディングス株式会社 IR広報部IR広報G
For further information, PR & IR Group, PR & IR Department, Meiji Holdings Co., Ltd. ■上場金融商品取引所 東京証券取引所 please contact: Tel: +81-3-3273-3917 E-mail:[email protected]
Stock Listing Tokyo
(2)社債情報 Corporate Bonds (3)格付情報 Credit Rating2019年7月25日現在 As of July 25, 2019
(注)第6回無担保社債は、社債のデット・アサンプション契約(債務履行引受契約)に基づき債務を譲渡いたしました。
社債権者に対する当社の社債償還義務は社債償還時まで存続するため、偶発債務として有価証券報告書の連結貸借対照表に注記しております。
Note: In accordance with the bond-backed debt assumption agreement, we transferred debts for our 6th unsecured bonds. As our bond redemption obligation to bond holders survives until the bond redemption date, this is noted in the consolidated balance sheets as contingent liabilities.
10,000 0.22 2024年9月13日
September 13 2024第8回無担保社債
Straight Bond #82018年1月30日
January 30 2018 10,000 0.12 2023年1月30日
January 30 2023
格付機関名Name
格付Rating
第6回無担保社債
Straight Bond #62014年1月28日
January 28 2014 15,000 0.52 2021年1月28日
January 28 2021 日本格付研究所(JCR)
Japan Credit RatingAgency, Ltd.
AA-第7回無担保社債
Straight Bond #7
発行年月日Date of Issue
券面総額 (百万円)
Total Par Value(Millions of yen)
利率(%)
Coupon (%)償還期限Maturity
2017年9月13日
September 13 2017
会社概要 Corporate Data
17,571
152,683,400
Recommended
![[MU – Hatten – 2020 FALL] MEIJI UNIVERSITYrubrecht/ALL DOWNLOADS/Downloads...[MU – Hatten – 2020 FALL] 1 MEIJI UNIVERSITY Weekly Schedule – 発展英語2020 Fall Dr. Rubrecht,](https://img.dokumen.tips/doc/110x75/5fd3a274195007234262de2b/mu-a-hatten-a-2020-fall-meiji-rubrechtall-downloadsdownloads-mu-a.jpg)