KenyaListedCompaniesCorporateGovernanceAnalysis
CytonnCorporateGovernanceReport
“Whatistheroleofcorporategovernanceintherecentinvestorlosses?”
8th May,2016

22
Table of Contents
I. Introduction to Cytonn Investments
II. Cytonn’s Corporate Governance Report
III. Cytonn’s Corporate Governance Index
IV. Appendix
A. Metrics Used
B. Metrics Used – Company Specific Scores
C. Investments & Research Team

33
I: Introduction to Cytonn Investments

44
Client Focus Drives the Team

55
Introduction to Cytonn InvestmentsCytonn Investments is an independent investments management company
• Our mission is that “we work to deliver innovative & differentiated financial solutions thatspeak to our clients needs”
• Cytonn Investments is differentiated in several respects:
1. Independence & Investor Focus: Cytonn is solely focused on serving the interest of clients,which is best done on an independent investment management platform to minimize conflicts ofinterest
2. Alternative Investments: Specialized focus on alternative assets - real estate, private equity,and structured products
3. Partnerships with Global Institutional Investors: Such as Taaleritehdas of Finland
4. Strong Alignment: Every staff member participates in ownership. When clients do well, the firmdoes well; and when the firm does well, staff do well

66
Cytonn’s Corporate Structure – Kshs 53 Bn Under Mandate
• Financial Services• Education • Technology
• Diaspora platform connecting investors in the diaspora with opportunities in the East African Region
• Development affiliate providing investment grade real estate development solutions
Cytonn Investments
Cytonn Investments
LtdCytonn Real
EstateCytonn
DiasporaCytonn
Investments LLC
• Independent investment management company, serving HNW & institutional clients
• US advisory and investment management company
Kenya United States
Private Equity
77
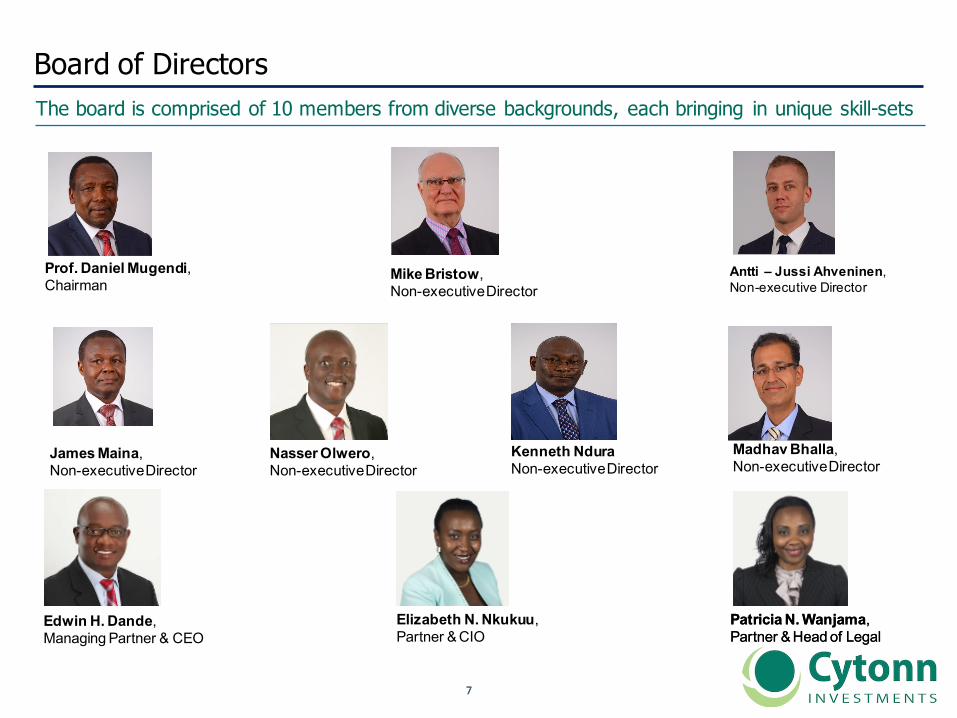
Board of Directors The board is comprised of 10 members from diverse backgrounds, each bringing in unique skill-sets
Patricia N. Wanjama,Partner & Head of Legal
Prof. Daniel Mugendi,Chairman
Antti – Jussi Ahveninen,Non-executive Director
Madhav Bhalla,Non-executive Director
James Maina,Non-executive Director
Nasser Olwero,Non-executive Director
Mike Bristow,Non-executive Director
Edwin H. Dande,Managing Partner & CEO
Elizabeth N. Nkukuu,Partner & CIO
Patricia N. Wanjama,Partner & Head of Legal
Kenneth NduraNon-executive Director

88
The Management Team The team brings in diverse global and local experience
Edwin H. Dande,Managing Partner & CEO
Elizabeth N. Nkukuu,Partner & CIO
Patricia N. Wanjama,Partner & Head of Legal
Maurice Oduor,Finance andInvestment Manager
Johnson Denge,Real Estate Services Manager
Robert M Mwebi,Project Manager
Shiv Arora,Head of Private Equity Real Estate
Gaurang Chavda,Head of Private Wealth Management
Winfred Ndung'u,Brand & Business Administration Manager
Beverlyn Naliaka,PR & Communication
Martin GitongaProject Manager

99
Cytonn Investment Solutions We offer differentiated investment solutions in four main areas
High Yield Solutions
� The Team’s expertise and market knowledge enable us to offer investors higher yields than the market
average� Regular credit analysis, quick dealing capability and the large banking spread in the market allow the
team to capitalize on investment opportunities
Real Estate Investment Solutions
� Our unique strategic partnerships with Cytonn Real Estate, our development affiliate, enables us to find,
evaluate, structure and deliver world class real estate investment products for investors� Our platform connects global capital seeking attractive return with institutional grade development
opportunities in the East African region
Private Regular
Investment Solutions
� We understand that investors have varying financial goals. Our highly customized and simple to
understand investment products will enable you to achieve your investment objective� We offer solutions to both local investors, and those in the diaspora interested in the investment
opportunities back in Kenya and the region
Private Equity
� Cytonn seeks to unearth value by identifying potential companies and growing them through capital
provision and partnering with their management to drive strategy� We primarily invest in the Financial Services, Education and Technology sectors

1010
Cytonn focuses on the highest returning Asset ClassTraditional investments returning 10% compared to 25% for real estate, & projected to continue
Per a
nnum
Ret
urn,
5 Y
ear A
vera
ge
25%
12.3%
10% 9.6%
0%
5%
10%
15%
20%
25%
30%
RealEstate 10YearTreasuryBondYield NASI 91DayT-Bill
Average =14.2%

1111
Global view of economic growth determines regions of focus There is demand from global capital (light colors) looking for attractive returns (dark colors)

1212
Key themes driving our property development
KEY THEME REAL ESTATE SECTOR PROVIDING EXPOSURE TO KEY THEME
Master Planned Communities
CommercialOffice Parks
CommercialMixed-Use
Suburban Malls
Three Star Hotels
1. Large Housing Deficit P P
2. Growth of Middle Class P P P P P
3. Demographic Trends P P P P P
4. Improved Infrastructure P P P P P
5. Political Decentralization P P P P P
6. Kenya as a Regional Hub P P P P P
A large housing deficit, growth of the middle class and demographic trends are just a few on the factors driving our thematicinvestments in Real Estate

1313
Deal pipeline overview – 85% to low and mid-income housing
Kshs53 BillionDealPipeline
Lowtomid-incomeHousing85%
• Masterplanned Development
• Comprehensive Development
• Low to mid-income Modular Housing
• High Density Integrated Mixed-use
• Gated Communities
PrimeResidentialandMixed-use15%

1414
Summary of Projects - Kshs 53 bn Deal Pipeline Details• Set 1: Real estate projects where the design, concept, agreements and funding are all secured, and have ground broken or in
the process of ground breaking• Set 2: Real estate projects where the Cytonn Real Estate team is in advanced stages of negotiations with the landowners, and
where consultants have been appointed to begin market research and concept design
all values in Kshs Millions unless statedProjects Concept Project Size SET 1 Amara Ridge Gated community 625.0Situ Village Gated masterplanned community 4,500.0The Alma Middle-class residential development 2,744.0Athi Sharpland Site & Service Scheme 644.7The Annex Middle-Class Residential development 522.9Rongai Sharpland Site & Service Scheme 375.5Sub - Total 9,412.1
SET 2 Project Mombasa High density mixed-use development 3,750.0Kiambu Road Middle-class gated community 3,832.0Project Kitale Masterplanned development 700.0Project Mavoko Low to mid income masterplanned city 12,500.0Project Lukenya Low to mid income masterplanned city 22,500.0Sub - Total 43,282.0
TOTAL 52,694.1

1515
Cytonn’s strategy brings three key pillars together
1. CreatingJobs
2. GrowingtheEconomy
3. Improvingthestandardsofliving
Financing Capability Development Capability
Landowners

1616
II. Cytonn’s Corporate Governance Report

1717
Introduction to Corporate GovernanceCorporate governance involves directors, shareholders and managers of organizations
2012
2013
• “Corporate governance is the application of best management practices, compliance with laws and regulations andadherence to ethical standards for effective management and distribution of wealth and discharge of socialresponsibility for sustainable development of stakeholders”
• A good corporate governance structure must encompass the following pillars:
IntegrityandEthics
Pillar RoleinCorporate Governance
• Integrity should be a fundamental requirement in choosing corporate officers andboard members• Organizations should develop a code of conduct for their directors and executives that promotes ethical
and responsible decision making
RegulatoryIndependence
DisclosureandTransparency
Responsibilityand
Accountability
• A good corporate governance structure should encompass independence of the directors to theregulators
• This will reduce instances of collusion and non-compliance due to connections with the regulators
• All financial and corporate actions should be disclosed to the public and made available for all• Proper disclosure stipulates ease of access to this information to the public, and increases transparency,
especially in public companies for the investing public
• A good corporate structure should encompass responsibility and accountability for every actionundertaken by the directors in relation to the company
• This will ensure that all decisions are made knowing that the firms resources and reputation are beingcommitted, which will assist in prudent decision making

1818
Pillars and Principles of Corporate GovernanceThe four pillars create the principles structure which centers on company leadership, corporate actions and stakeholder protection
2013
2012
INTEGRITYÐICS
REGULATORYINDEPENDENCE
DISCLOSURES&TRANSPARENCY
RESPONSIBILITYANDACCOUNTABILITY
PILLARSOFCORPORATEGOVERNANCE
PRINCIPLESOFCORPORATEGOVERNANCE# CompanyLeadership CorporateActions StakeholderProtection1 Authorityanddutiesofmembers Strategyandvalues Accountabilitytomembers
2 Leadershipand successionplanning Corporateperformance&Financialsustainability Responsibilitytostakeholders
3 AppointmentstotheBoard&Committees Corporatecompliance Socialandenvironmentalresponsibility
4 Structureandorganization CorporatecommunicationComplete transparencyandaccuracyindisclosures
5 Induction,developmentandstrengtheningofskillsofBoardmembers Adoptionoftechnologyandskills
Effectivecommunicationtostakeholders
6 Internalcontrolprocedures Corporateculture7 Assessment ofBoardperformance Managementofcorporaterisk

1919
Corporate Governance – Oversight in Kenya
2013
RoleOrganisation
RegulatoryBodies
• Regulators, including but not limited to, CBK, CMA, IRA, NSE, RBA and SASRA are all involved in settingout corporate governance guidelines for companies to adhere to
• These regulatory bodies are charged with responsibility of supervising, licensing and monitoring theactivities of market intermediaries
• The Capital Markets Authority published the “Code of Corporate Governance Practices” which is a basedon a ‘comply or explain’ approach to amost recent rules that front an ‘apply or explain’ approach
• The “comply or explain” approach lets individual companies to decide whether to follow set codes or notbut the “apply or explain” approach requires companies to actually follow the set out corporategovernance codes
ProfessionalOrganisations
• The Institute of Certified Public Accountants (ICPAK) continue to play a critical role in enhancing corporategovernance disclosure in Kenya. ICPAK is credited for spearheading the adoption of internationalAccounting and Audit standards in Kenya in 1999
• Other professional associations that has contributed to promote corporate disclosure include TheInstitute of Certified Public Secretaries of Kenya, Law Society of Kenya, Institute of Directors of Kenya andThe Associationof Practitioners inAdvertising
NGOs• Non governmental organisations such as Centre for Corporate Governance (COG) have also in their
course of executing their mandate agitated for improved disclosure. COG drafted the first sample codesof corporate governance best practices that were adopted in 1999

2020
Recent Developments in Corporate Governance in KenyaInvestors have incurred losses equating to Kshs. 264.3 bn as a result of isolated corporate governance issues
2012
2013
• Corporate governance in Kenya has been an issue which has led to the loss of investor’s wealth in the tune of Kshs. 264
bn. These companies include Chase Bank, CMC, Imperial Bank, Uchumi, Mumias, Kenya Airways, National Bank andTransCentury
• For a market with over 60 listed companies to have significant issues with at least 8 companies equates to about 13%of listed companies with corporate governance issues. That is a worryingly high statistic that should call into question
our regulatory frameworks and their effectiveness
(allvaluesinKshsbnsunlessstated)
Shareholders’LossAttributedtoPoorCorporateGovernanceFirm PeakSharePrice Current SharePrice No.ofShares LossinValueKenyaAirways 124.0 4.4 1.5 179.5ImperialBank 36.0Mumias 19.0 1.4 1.5 27.0Transcentury 36.0 4.8 0.3 8.7Uchumi 23.0 3.8 0.3 5.1ChaseBank 4.8NationalBank 16.0 9.5 0.3 2.0CMC 1.2Total 264.3

2121
Recent Developments in Corporate Governance in Kenya, continued…Chase Bank and Imperial Bank were closed and placed under receivership, with poor corporate governance and professional ethics being one of the main reasons
2012
2013
• Receivership of Chase Bank: Chase Bank’s recent receivership notice was as a result of unsound and unsafe banking
practices, which include, among others, large unsecured loans to directors. Important to note is that Chase Bank is the first
bank in Kenya to be closed and re-opened, with KCB Group acting as the receiver manager, a move to restore market
confidence
• Receivership of Imperial Bank & Dubai Bank: Another case of unsound and unsafe banking practices, which include,
among others, fraudulent loans to directors. Since Imperials Bank’s closure in October 2015, the bank is yet to re-open, with
depositors only having access to a maximum of Kshs. 1 mn of their despot value
• Suspension of National Bank CEO: In a move to strengthen corporate governance in Kenya, National bank suspended the
CEO and other top executives due to emergent concerns over the operations at the lender. However, investors are yet to be
informed of the situation,which has created a level of uncertainty as they await the results of the ongoing audit process

2222
Recent Developments in Corporate Governance in Kenya, continued…Mismanagement of institutions which have large government holding, as well as unsustainable debt levels have led to corporate governance issues and investor losses
2012
2013
• Mismanagement of Government owned Institutions: Poor strategies have led to the demise of companies like Mumias,
Uchumi and Kenya Airways, with the capital in these entities shrinking by more than 90%, and the companies operating with
negative equity positions. There is a need for privatization in these organizations to ensure an efficient turnaround, which is not
dependent of a public bailout, as there is the risk of firms having a moral hazard towards operations, knowing they will receive
support funding from the Government
• Unsustainable Debt Levels: TransCentury has suffered financial strains given high unsustainable debt levels and questionable
investment decisions into such like RVR, which have eroded shareholder value, and the inability of the firm to repay
bondholders, who may have to convert their positions to equity holdings

2323
What is the role of corporate governance in the recent investor losses?
2012
2013
PoorCorporateGovernanceandEthics
Specific SummaryofIssue
• Over the last year, we have been plagued withisolated cases of poor corporate governance
• This has been largest in the banking sector, withissues leading to the closureof 3 banks
• All the cases, including those which havemismanagement of companies, can be related tofraud, lack of board supervision, non-disclosures andno transparency to the investing public
• Other than disclosures, we have witnessed severalcases of restatement of earnings by large financialservices firms, bringing into question the quality ofearnings and reliability of information
• In addition, corporate governance issues havecentered around CEO’s and Directors, who should beat the forefront of protecting shareholder rights
EffectonInvestors
• In as much as these cases of corporate governanceare not systemic, they have negative effects oninvestor confidence and market sentiment, especiallyfor banks in Kenya
• In the banking sector, measures had to be taken byCentral Bank of Kenya (CBK) to provide liquidity tosmaller banks and restore confidence
• Restatement of earnings by Chase Bank, NationalBank, Britam and Uchumi have led to investorsquestioning levels of disclosures in firms
• CMC and Uchumi have been delisted (with Uchuminow trading again) due to poor governance
• Sophisticated investors are now looking beyondvaluation using financial ratios, and questioning thelevel of governanceand professional ethicswithin anyorganization
DueDiligenceand
Supervision
• In as much as investor losses are due to poorcorporate governance and a lack of professionalethics, questions are raised over the level ofsupervision by regulatory bodies
• In the case of Imperial Bank, the decision to acceptmoney for a corporate bond and approve listing byCMA and NSE, only weeks before the bank wasclosed, raises questions over the diligence of reviewas investors lost a total of Kshs. 2 bn in thebond issue
• However, credit must be given to CBK as they closedChase Bank to avoid any insolvency in the bank, andprovided liquidity to smaller banks to support thesystem
• Investors are now looking to conduct independentduediligenceat amore detailed level to avoid missingout what has not been captured at supervisory level
• The market is now looking for increased risk basedsupervision to protect the interest of investors
• CBK has already come out in to the market to statethat the level of supervision needs to be greater, andtheGovernor will lead theeffort
• Given CBK has already acknowledged that supervisioncould be stronger, are IRA and CMA sufficientlycovering their sectors under supervision to preventfurther investor losses?

2424
South Africa has a Social Responsible Index (SRI) launched in 2004 to measure corporate governance
Case Study - Corporate Governance in South Africa
• Corporate governance of the listed companies on the Johannesburg Stock Exchange is measured by the Social Responsible index
(SRI), developed to improve the levels of transparency for investors
• This index assesses companies against over 90 indicators based on their environmental, social and governance impact on the
economic borrowing from international best practice standards, the country’s Company Act of 2009 and the King Code of Corporate
Governance of 2010
• Companies are evaluated on four main areas: Environment, Society, Governance and Climate Change with over 60 underlying
criteria which are ranked as high, medium or low, with the total used to rank companies on corporate governance performance
• Index constituents are published by the JSE together with the best performers and criteria used as opposed to other indices such
as China, Mexico and South Korea that only publish to the members of the index
Since listing in 2004 with 51 companies, exclusions have occurred, with companies forced to leave the index, owing to violations in terms of poor governance, ethics, unlawful competition and human rights violations,
an indication of its efficiency in promoting prudent corporate governance in industry

2525
III. Cytonn Corporate Governance Index

2626
Cytonn Corporate Governance Index (CGI) ReportThe CGI ranked the 50 listed companies on the Nairobi Securities Exchange, all of which have a market capitalization of over Kshs. 1 bn, on 24 corporate governance metrics
• The Cytonn Corporate Governance Index (CGI) is a diffusion index consisting of 24 metrics used to rank listed companies on their
corporate governance structure• All companies with a market capitalization of over Kshs 1 bn, which equates to 50 companies on the Nairobi Securities Exchange,
were ranked on each of the 24 metrics to arrive at a composite score to provide a deeper understanding of the level of corporate
governance in each firm
• The main areas of analysis are in the (i) board composition, (ii) audit functions, (iii) CEO tenure and evaluation, (iv) remuneration,
and (v) transparency• The Kenyan system of corporate governance follows the “Anglo-American Model” of the United States and the United Kingdom
which relies on a single tiered Board of Directors. This board is dominated by independent directors appointed by shareholders
• The score is calculated as per the formula below:
• Formula = (A*1) + (B*0.5) + (C*0)• A - % of compliant metrics
• B - % of partial compliant metrics
• C - % of non compliant metrics
The score assumes a diffusion index with 50% as the base. Anything below 50% should be flagged as having serious corporate governance issues while anything above is skewed towards proper governance.
However, the variance from 100% gives the risk associated with corporate governance

2727
Cytonn Corporate Governance Index – Comprehensive Score Ranking*KCB group ranks highest with a CGI score of 95.8%
No. Company ComprehensiveScore(a)
26. CIC 64.6%27. EACables 62.5%28. StandardGroup 60.4%29. Sasini 60.4%30. Kakuzi 60.4%31. HousingFinance 60.4%32. TPSEastAfrica 58.3%33. NationMediaGroup 58.3%34. KenyaRe 58.3%35. CFCStanbic 56.3%36. Trans-CenturyLtd 56.3%37. B.O.CKenya 56.3%38. Britam 54.2%39. CarandGeneral 54.2%40. MumiasSugar 52.1%41. Kenol/Kobil 52.1%42. EastAfricaPortlandCement 50.0%43. WilliamsonTea 47.9%44. Carbacid Investments 45.8%45. WPPScanGroup 45.8%46. CrownPaints 43.8%47. Uchumi 37.5%48. FlameTreeGroupHoldings 33.3%49. LimuruTea 18.8%50. Kenyaorchards 10.4%
(a)Thecomprehensivescoreisbasedon theaverageweightingbetweenthe24corporategovernancemetrics.Thehigher thescoreindicatedbettercorporate governance
No. Company ComprehensiveScore(a)
1. KCBGroup 95.8%2. Safaricom 83.3%3. StandardChartered 83.3%4. Kengen 79.2%5. JubileeHoldings 77.1%6. EastAfricaBreweries 77.1%7. Barclays 77.1%8. BATKenya 77.1%9. DTBBank 75.0%10. I&MBank 72.9%11. Umeme Ltd 72.9%12. EquityGroup 72.9%13. PanAfrica 70.8%14. Co-operativebank 70.8%15. NSE 68.8%16. KenyaPower&Lighting 68.8%17. NationalBank 68.8%18. KenyaAirways 66.7%19. Centum 66.7%20. Liberty 66.7%21. NIC 66.7%22. Unga 66.7%23. Bamburi 66.7%24. TotalKenyaLtd 65.2%25. ARM 64.6%
*Forthecomprehensiverankingsindetail,[email protected]

2828
Cytonn Corporate Governance Index – Gender Diversity RankingBarclays ranks first on gender diversity with an even gender distribution
Thepercentagecomposition ofwomenontheboard.Thehigherthescoreindicatesbettergenderdiversity
No. Company Score*1. Barclays 50.0%2. Safaricom 44.0%3. MumiasSugar 36.3%4. TotalKenya 33.3%5. CIC 33.0%6. Uchumi 30.0%7. Liberty 29.0%8. Kengen 27.3%9. KCBGroup 27.3%10. KenyaRe 27.0%11. NationMediaGroup 26.7%12. Pan-Africa 25.0%13. NSE 25.0%14. StandardChartered 25.0%15. Unga 25.0%16. Centum 22.2%17. KenyaPower&Lighting 22.2%18. BATKenya 22.2%19. EquityGroup 22.0%20. B.O.CKenya 22.0%21. NationalBank 22.0%22. EastAfricaBreweries 20.0%23. FlameTree 20.0%24. Bamburi 20.0%25. NIC 18.2%
No. Company Score*26. CFC 18.0%27. DTBBank 18.0%28. Kenol/Kobil 17.0%29. KenyaAirways 16.7%30. WilliamsonTea 14.3%31. HousingFinance 14.3%32. EACables 14.2%33. Trans-CenturyLtd 12.5%34. I&MBank 12.5%35. StandardGroup 12.5%36. Sasini 12.5%37. Britam 12.5%38. Umeme 10.0%39. TPSEastAfrica 10.0%40. JubileeHoldings 9.0%41. Co-operativeBank 8.3%42. ARM 0.0%43. LimuruTea 0.0%44. CarbacidInvestments 0.0%45. EastAfricaPortland 0.0%46. Kakuzi 0.0%47. WPPScanGroup 0.0%48. CrownPaints 0.0%49. CarandGeneral 0.0%50. KenyaOrchards 0.0%
2929
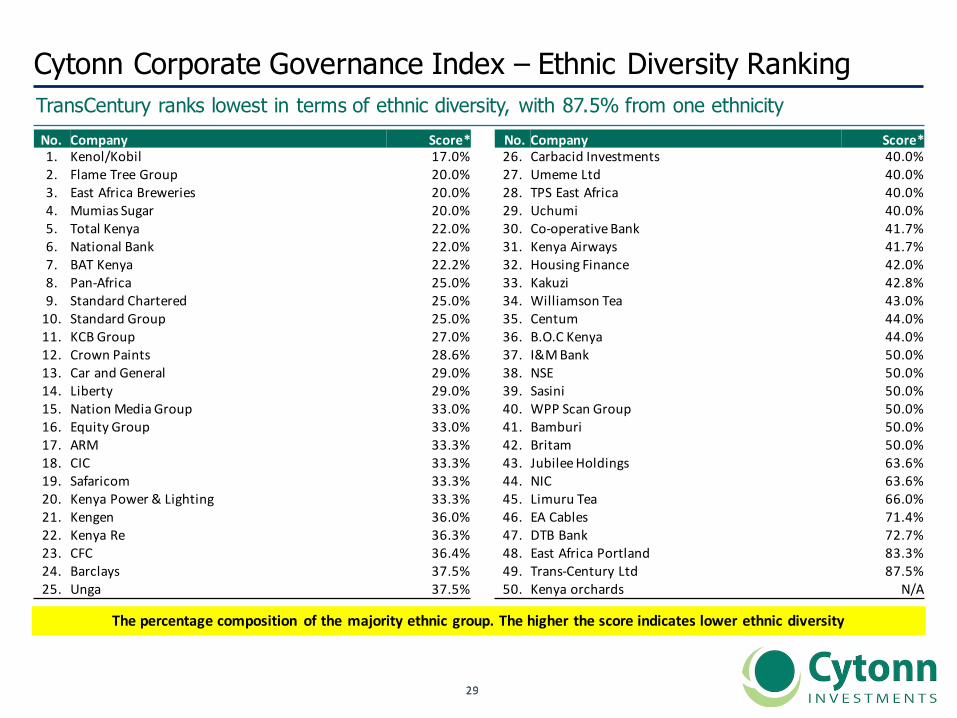
Cytonn Corporate Governance Index – Ethnic Diversity RankingTransCentury ranks lowest in terms of ethnic diversity, with 87.5% from one ethnicityNo. Company Score*1. Kenol/Kobil 17.0%2. FlameTreeGroup 20.0%3. EastAfricaBreweries 20.0%4. MumiasSugar 20.0%5. TotalKenya 22.0%6. NationalBank 22.0%7. BATKenya 22.2%8. Pan-Africa 25.0%9. StandardChartered 25.0%10. StandardGroup 25.0%11. KCBGroup 27.0%12. CrownPaints 28.6%13. CarandGeneral 29.0%14. Liberty 29.0%15. NationMediaGroup 33.0%16. EquityGroup 33.0%17. ARM 33.3%18. CIC 33.3%19. Safaricom 33.3%20. KenyaPower&Lighting 33.3%21. Kengen 36.0%22. KenyaRe 36.3%23. CFC 36.4%24. Barclays 37.5%25. Unga 37.5%
No. Company Score*26. CarbacidInvestments 40.0%27. UmemeLtd 40.0%28. TPSEastAfrica 40.0%29. Uchumi 40.0%30. Co-operativeBank 41.7%31. KenyaAirways 41.7%32. HousingFinance 42.0%33. Kakuzi 42.8%34. WilliamsonTea 43.0%35. Centum 44.0%36. B.O.CKenya 44.0%37. I&MBank 50.0%38. NSE 50.0%39. Sasini 50.0%40. WPPScanGroup 50.0%41. Bamburi 50.0%42. Britam 50.0%43. JubileeHoldings 63.6%44. NIC 63.6%45. LimuruTea 66.0%46. EACables 71.4%47. DTBBank 72.7%48. EastAfricaPortland 83.3%49. Trans-CenturyLtd 87.5%50. Kenyaorchards N/A
Thepercentagecomposition ofthemajorityethnicgroup.Thehigher thescoreindicateslowerethnicdiversity

3030
Cytonn Corporate Governance Index - ConclusionCorporate governance is directly correlated to stock price performance of listed firms
Comprehensive Ranking 5 Yr. Absolute Return*
Ethnic Diversity Ranking 5 Yr. Absolute Return* Gender Diversity Ranking 5 Yr. Absolute Return*
• As shown in the charts, good corporate governance isdirectly correlated to stock price performance
• Companies with a well diversified board in terms ofgender outperformed those with an undiversifiedboard composition highlighting the importance ofgender diversity as a corporate governance rankingmetric
• The same applies for ethnic diversity where companiesthat are ethnically diverse also outperformed thosethat are ethnically biased
Key Take-outs
55.6%
9.1%
0.0%10.0%20.0%30.0%40.0%50.0%60.0%
Top25 Bottom25
52.9%
12.5%
-10.0%20.0%30.0%40.0%50.0%60.0%
Top25 Bottom25
42.4%
25.6%
-
10.0%
20.0%
30.0%
40.0%
50.0%
Top25 Bottom25
• We exclude agricultural stocks due to their repricing as real estate firms

3131
Appendix

3232
A. Metrics Used

3333
Cytonn Corporate Governance Index - MetricsNo. Metrics 0 0.5 1
1 Attendance toMeetings Lessthan50%attendance Between50%and75%attendance
Greaterthan75%attendance
2 AverageAgeofDirectors Greaterthan60yrsandlessthan40yrs
50- 60yrs 40- 50yrs
3 BoardRemunerationvsEPSNegativecorrelation
(RemunerationincreasewhileEPSdecline)/Zerocorrelation
WeakpositivecorrelationStrongpositivecorrelation/Remunerationdeclinewhile
EPSincrease
4 BoardSize&Evenness Lessthan4members 12ormore/EvenNumber Between5- 11members
5 CEOandDirectorsShares(directlyand indirectly)
0%orgreaterthan20%shareholding
Between11%and20%shareholding
Between0%and10%shareholding
6 ChoiceofAuditors NoproofofAudits Non-recognizedauditor Recognizedauditors
7 Corporate SocialResponsibility Doesn’tParticipate N/A Activelyparticipates
8 DebttoCapital/TangibleEquity forBanksand InsuranceCompanies(a)
Beyond20%optimalaboveorbelow/Nodebt;>5%deviation
frommedian(14.3%)forbanks;>10%deviationfrom
medianforinsurancecompanies(21.8%)
10%- 20%aboveorbelowoptimal;1%- 5%deviationfrommedian(14.3%)forbanks;5%- 10%deviationfrommedianforinsurance
companies(21.8%)
10%aboveorbelowoptimal;0%-1%deviationfrommedian(14.3%)forbanks;0%- 5%deviationfrommedianfor
insurancecompanies(21.8%)

3434
Cytonn Corporate Governance Index - MetricsNo. Metrics 0 0.5 1
9 DividendPolicy Noknowndividendpolicy/inconstencywithpolicy
consistentpayment Consistentlyfollowedplan
10 EaseofaccessofInformation Opaque Disclosuresnotcomprehensive Sufficientdisclosureofinformation
11 EthnicDiversity Greaterthan50%from1ethnicity
Between30%and50%from1ethnicity
Lessthan30%from1ethnicity
12 EvaluationofCEO NotConductedConducted withnegativeresults/Conductedwithno
resultsdisclosure
Conducted withpositiveresultsdisclosure
13 Freefloat** Lessthan35% Between35%and50% Greaterthan50%
14 GenderDiversity 0%Diversity Greaterthan0%but lessthan33%
33%orgreater
15GlobalMarketsExposure(studiesand
workexperience)ExcludeAfrica(includeS.AandEgypt)
None OneorTwomembers MorethanTwomembers
16 Independence ofChair toCEO SameIndividual
Differentbutrelated(Eitherfamilyorhaveworked
togetherforasignificantnumberofyears)
Different&Independent

3535
Cytonn Corporate Governance Index - MetricsNo. Metrics 0 0.5 1
17 InternalAuditFunction Lacksthisfunction Lessthan75%independentmembers
75%orgreaterindependentmembers
18 Loans todirectorsvsshareholding LoansgreaterthanShareholding
Loansgreaterthan50%oftheShareholding
Loanslessthan50%ofshareholding
19 Proportion ofNon-Executive Nomember Lessthan50% 50%andGreater
20 Releaseresultson time Beyond120days 90days≤x≤120days Within90days
21 RotationofAuditors NoRotation Greaterthan5yrs Lessthan5yrs
22 Shareholder Composition Shareholdingwithcontrollinggovernmentstakeofover20%
DiverseShareholdingSophisticatedInstitutionalInvestors/Renownparent
companyholding
23 StaggeredMembers forboard Non-existent Staggered,periodgreaterthan5yrs
Wellstaggered(between1- 5yrs)
24 TenureoftheCEO Notermlimitsandelection Definedtenuregreaterthan7years
Definedtenureofabout3to7years

3636
B. Metrics Used – Company Specific Scores

3737
Metrics for ARM,BAT, B.O.C, Bamburi and BarclaysARM BAT B.O.C Bamburi Barclays
No. Metrics 0 0.5 1 Score Score Score Score Score1 BoardSize&Evenness Lessthan4members 12ormore/EvenNumber Between 5- 11members 1 1 1 0.5 0.5
2 GenderDiversity 0%Diversity Greater than0%butlessthan33% 33%orgreater 0 0.5 0.5 0.5 1
3 AverageAgeofDirectors Greater than60yrsandlessthan40yrs 50- 60yrs 40- 50yrs 0 0.5 0.5 0.5 0.5
4 Ethnic Diversity Greater than50%from1ethnicity
Between 30%and50%from1ethnicity
Lessthan30%from1ethnicity 0.5 1 0.5 0.5 0.5
5GlobalMarketsExposure(studiesandworkexperience)ExcludeAfrica(include S.AandEgypt)
None OneorTwomembers MorethanTwomembers 1 1 1 1 1
6 Proportion ofNon-Executive Nomember Lessthan50% 50%andGreater 0.5 1 1 1 1
7 Attendance toMeetings Lessthan50%attendance
between50%and75%attendance
Greater than75%attendance 1 1 0 1 0.5
8 Independence ofChairtoCEO SameIndividual
Different butrelated(Eitherfamilyorhaveworkedtogether forasignificant
number ofyears)
Different &Independent 1 1 1 1 1
9 TenureoftheCEO Notermlimitsandelection
Definedtenure greaterthan7years
Definedtenure ofabout3to7years 0 0 0 0 1
10 StaggeredMembersforboard Non-existent Staggered,period greaterthan5yrs
Wellstaggered(between1- 5yrs) 1 1 0 0 1
11 CEOandDirectorsShares(directlyandindirectly)
0%orgreaterthan20%shareholding
Between 11%and20%shareholding
Between 0%and10%shareholding 0.5 1 1 0 1
12 ShareholderCompositionShareholding with
controlling governmentstakeofover20%
DiverseShareholding
SophisticatedInstitutional Investors/Renown parentcompany
holding
0.5 1 1 0.5 1

3838
Metrics for ARM,BAT, B.O.C, Bamburi and Barclays, continued…ARM BAT B.O.C Bamburi Barclays
No. Metrics 0 0.5 1 Score Score Score Score Score13 Freefloat** Lessthan35% Between 35%and50% Greater than50% 0.5 0 0 0 0
14 BoardRemuneration vsEPS
Negativecorrelation(Remuneration increasewhileEPSdecline)/Zero
correlation
Weakpositivecorrelation
Strongpositivecorrelation/
Remuneration declinewhileEPSincrease
0.5 1 1 1 1
15 Choice ofAuditors Noproof ofAudits Non-recognized auditor Recognized auditors 1 1 1 1 116 Rotation ofAuditors NoRotation Greater than5yrs Lessthan5yrs 1 1 0 1 0
17 Evaluation ofCEO NotConductedConducted withnegativeresults/Conducted withnoresultsdisclosure
Conducted withpositiveresultsdisclosure 0 0.5 0 1 0.5
18 InternalAudit Function Lacksthisfunction Lessthan75%independent members
75%orgreaterindependent members 1 1 0.5 1 1
19 Loanstodirectorsvsshareholding LoansgreaterthanShareholding
Loansgreaterthan50%oftheShareholding
Loanslessthan50%ofshareholding 1 1 1 1 1
20 Releaseresultsontime Beyond120days 90days≤x≤120days Within 90days 1 1 1 1 1
21 Dividend PolicyNoknowndividend
policy/inconstency withpolicy
consistent payment Consistently followed plan 0.5 0.5 0.5 0.5 0.5
22 Debtto Capital/Tangible Equity forBanksandInsuranceCompanies(a)
Beyond20%optimalaboveorbelow/Nodebt;>5%deviationfrommedian(14.3%)
forbanks;>10%deviationfrommedian
forinsurancecompanies(21.8%)
10%- 20%aboveorbelowoptimal;1%- 5%
deviationfrommedian(14.3%)forbanks;5%-10%deviationfrommedianforinsurancecompanies(21.8%)
10%aboveorbelowoptimal;0%-1%deviationfrommedian(14.3%)forbanks;0%- 5%deviation
frommedianforinsurance companies
(21.8%)
0 1 0 0 0.5
23 EaseofaccessofInformation Opaque Disclosures notcomprehensive
Sufficient disclosure ofinformation 1 0.5 1 1 1
24 CorporateSocialResponsibility Doesn’t Participate - Activelyparticipates 1 0 0 1 1Comprehensive Score 64.6% 77.1% 56.3% 66.7% 77.1%

3939
Metrics for Britam, Car and General, Carbacid, Centum and CfCBritam Carand
General Carbacid Centum CFC
No. Metrics 0 0.5 1 Score Score Score Score Score
1 BoardSize&Evenness Lessthan4members 12ormore/EvenNumber Between 5- 11members 0.5 1 1 1 1
2 GenderDiversity 0%Diversity Greater than0%butlessthan33% 33%orgreater 0.5 0 0 0.5 0.5
3 AverageAgeofDirectors Greater than60yrsandlessthan40yrs 50- 60yrs 40- 50yrs 0 0 0 0.5 0.5
4 Ethnic Diversity Greater than50%from1ethnicity
Between 30%and50%from1ethnicity
Lessthan30%from1ethnicity 0 1 0.5 0 0.5
5GlobalMarketsExposure(studiesandworkexperience)ExcludeAfrica(include S.AandEgypt)
None OneorTwomembers MorethanTwomembers 0 0 0.5 1 1
6 Proportion ofNon-Executive Nomember Lessthan50% 50%andGreater 1 1 1 1 1
7 Attendance toMeetings Lessthan50%attendance
between50%and75%attendance
Greater than75%attendance 1 0 0 0.5 0
8 Independence ofChairtoCEO SameIndividual
Different butrelated(Eitherfamilyorhaveworkedtogether forasignificant
number ofyears)
Different &Independent 1 1 0 1 1
9 TenureoftheCEO Notermlimitsandelection
Definedtenure greaterthan7years
Definedtenure ofabout3to7years 0 0 0 0 0
10 StaggeredMembersforboard Non-existent Staggered,period greaterthan5yrs
Wellstaggered(between1- 5yrs) 0 1 1 1 0.5
11 CEOandDirectorsShares(directlyandindirectly)
0%orgreaterthan20%shareholding
Between 11%and20%shareholding
Between 0%and10%shareholding 0 1 0 0 0
12 ShareholderCompositionShareholding with
controlling governmentstakeofover20%
DiverseShareholding
SophisticatedInsituional Investors/
Renown parentcompanyholding
0.5 0.5 0.5 0.5 1

4040
Metrics for Britam, Car and General, Carbacid, Centum and CfC, continued…Britam Carand
General Carbacid Centum CFC
No. Metrics 0 0.5 1 Score Score Score Score Score13 Freefloat** Lessthan35% Between 35%and50% Greater than50% 0 0 0.5 0.5 0
14 BoardRemuneration vsEPS
Negativecorrelation(Remuneration increasewhileEPSdecline)/Zero
correlation
Weakpositivecorrelation
Strongpositivecorrelation/Remuneration
decline whileEPSincrease
0.5 0 0 1 0
15 Choice ofAuditors Noproof ofAudits Non-recognized auditor Recognized auditors 1 1 1 1 116 Rotation ofAuditors NoRotation Greater than5yrs Lessthan5yrs 1 0 0 0 0
17 Evaluation ofCEO NotConductedConducted withnegativeresults/Conducted withno
resultsdisclosure
Conducted withpositiveresults
disclosure0 0 0 0.5 1
18 InternalAudit Function Lacksthisfunction Lessthan75%independentmembers
75%orgreaterindependentmembers
1 1 1 1 0.5
19 Loanstodirectorsvsshareholding LoansgreaterthanShareholding
Loansgreaterthan50%oftheShareholding
Loanslessthan50%ofshareholding 1 1 1 1 0
20 Releaseresultsontime Beyond120days 90days≤x≤120days Within 90days 0.5 1 1 1 1
21 Dividend PolicyNoknowndividend
policy/inconstency withpolicy
consistent payment Consistently followedplan 0.5 0.5 0 1 0
22 Debtto Capital/Tangible Equity forBanksandInsuranceCompanies(a)
Beyond20%optimalaboveorbelow/Nodebt;>5%deviationfrommedian(14.3%)
forbanks;>10%deviationfrommedian
forinsurancecompanies(21.8%)
10%- 20%aboveorbelowoptimal;1%- 5%deviationfrommedian(14.3%)forbanks;5%- 10%deviationfrommedianforinsurance
companies(21.8%)
10%aboveorbelowoptimal;0%-1%deviationfrom
median(14.3%)forbanks;0%- 5%deviationfrom
medianforinsurancecompanies(21.8%)
1 0.5 0 0 1
23 EaseofaccessofInformation Opaque Disclosures notcomprehensive
Sufficient disclosureofinformation 1 0.5 1 1 1
24 CorporateSocialResponsibility Doesn’t Participate - Activelyparticipates 1 1 1 1 1Comprehensive Score 54.2% 54.2% 45.8% 66.7% 56.3%

4141
Metrics for CIC, Co-op, Crown, DTB & EA CablesCIC Co-op Crown
Paints DTB EACables
No. Metrics 0 0.5 1 Score Score Score Score Score1 BoardSize&Evenness Lessthan4members 12ormore/EvenNumber Between 5- 11members 0.5 0.5 1 1 1
2 GenderDiversity 0%Diversity Greater than0%butlessthan33% 33%orgreater 1 0.5 0 0.5 0.5
3 AverageAgeofDirectors Greater than60yrsandlessthan40yrs 50- 60yrs 40- 50yrs 0.5 0.5 0 0.5 0.5
4 Ethnic Diversity Greater than50%from1ethnicity
Between 30%and50%from1ethnicity
Lessthan30%from1ethnicity 0.5 0.5 1 0 0
5GlobalMarketsExposure(studiesandworkexperience)ExcludeAfrica(include S.AandEgypt)
None OneorTwomembers MorethanTwomembers 0.5 0.5 0 1 1
6 Proportion ofNon-Executive Nomember Lessthan50% 50%andGreater 1 1 1 1 1
7 Attendance toMeetings Lessthan50%attendance
between50%and75%attendance
Greater than75%attendance 0 1 0 1 1
8 Independence ofChairtoCEO SameIndividual
Different butrelated(Eitherfamilyorhaveworkedtogether forasignificant
number ofyears)
Different &Independent 1 1 1 1 1
9 TenureoftheCEO Notermlimitsandelection
Definedtenure greaterthan7years
Definedtenure ofabout3to7years 0 0 0 0 0
10 StaggeredMembersforboard Non-existent Staggered,period greaterthan5yrs
Wellstaggered(between1-5yrs) 0.5 1 0 0.5 1
11 CEOandDirectorsShares(directlyandindirectly)
0%orgreaterthan20%shareholding
Between 11%and20%shareholding
Between 0%and10%shareholding 1 1 0 1 1
12 ShareholderCompositionShareholding with
controlling governmentstakeofover20%
DiverseShareholdingSophisticated InsituionalInvestors/Renownparent
companyholding0.5 0.5 0.5 1 0.5

4242
Metrics for CIC, Co-op, Crown, DTB & EA Cables, continued…CIC Co-op Crown
Paints DTB EACables
No. Metrics 0 0.5 1 Score Score Score Score Score13 Freefloat** Lessthan35% Between 35%and50% Greater than50% 0 0 0 0.5 0
14 BoardRemuneration vsEPS
Negativecorrelation(Remuneration increasewhileEPSdecline)/Zero
correlation
WeakpositivecorrelationStrongpositive
correlation/ Remunerationdecline whileEPSincrease
0 1 0.5 1 0
15 Choice ofAuditors Noproof ofAudits Non-recognized auditor Recognized auditors 1 1 1 1 116 Rotation ofAuditors NoRotation Greater than5yrs Lessthan5yrs 1 0.5 0 0 0
17 Evaluation ofCEO NotConductedConducted withnegativeresults/Conducted withno
resultsdisclosure
Conducted withpositiveresultsdisclosure 0 0.5 0 1 0
18 InternalAudit Function Lacksthisfunction Lessthan75%independentmembers
75%orgreaterindependent members 1 1 0.5 1 1
19 Loanstodirectorsvsshareholding LoansgreaterthanShareholding
Loansgreaterthan50%oftheShareholding
Loanslessthan50%ofshareholding 1 1 1 1 1
20 Releaseresultsontime Beyond120days 90days≤x≤120days Within 90days 1 1 1 1 1
21 Dividend PolicyNoknowndividend
policy/inconstency withpolicy
consistent payment Consistently followed plan 1 0 0.5 0.5 0.5
22 Debtto Capital/Tangible Equity forBanksandInsuranceCompanies(a)
Beyond20%optimalaboveorbelow/Nodebt;>5%deviation
frommedian(14.3%)forbanks;>10%deviation
frommedianforinsurance companies
(21.8%)
10%- 20%aboveorbelowoptimal;1%- 5%deviationfrommedian(14.3%)forbanks;5%- 10%deviationfrommedianforinsurance
companies(21.8%)
10%aboveorbelowoptimal;0%-1%deviationfrommedian(14.3%)forbanks;0%- 5%deviationfrommedianforinsurance
companies(21.8%)
0.5 1 0 0.5 0
23 EaseofaccessofInformation Opaque Disclosures notcomprehensive
Sufficient disclosure ofinformation 1 1 0.5 1 1
24 CorporateSocialResponsibility Doesn’t Participate - Activelyparticipates 1 1 1 1 1
Comprehensive Score 64.6% 70.8% 43.8% 75.0% 62.5%

4343
Metrics for EABL, EAPC, Equity, Flame Tree & HF GroupEABL EAPC Equity Flame
TreeHF
GroupNo. Metrics 0 0.5 1 Score Score Score Score Score1 BoardSize&Evenness Lessthan4members 12ormore/EvenNumber Between 5- 11members 0.5 0.5 1 1 1
2 GenderDiversity 0%Diversity Greater than0%butlessthan33% 33%orgreater 0.5 0 0.5 0.5 0.5
3 AverageAgeofDirectors Greater than60yrsandlessthan40yrs 50- 60yrs 40- 50yrs 0.5 0 0 0 0.5
4 Ethnic Diversity Greater than50%from1ethnicity
Between 30%and50%from1ethnicity
Lessthan30%from1ethnicity 1 0.5 0.5 1 0.5
5GlobalMarketsExposure(studiesandworkexperience)ExcludeAfrica(include S.AandEgypt)
None OneorTwomembers MorethanTwomembers 1 0 1 1 1
6 Proportion ofNon-Executive Nomember Lessthan50% 50%andGreater 1 1 1 0.5 1
7 Attendance toMeetings Lessthan50%attendance
between50%and75%attendance
Greater than75%attendance 0.5 0.5 1 0 1
8 Independence ofChairtoCEO SameIndividual
Different butrelated(Eitherfamilyorhaveworkedtogether forasignificant
number ofyears)
Different &Independent 1 1 1 1 1
9 TenureoftheCEO Notermlimitsandelection
Definedtenure greaterthan7years
Definedtenure ofabout3to7years 0 0 0 0 0
10 StaggeredMembersforboard Non-existent Staggered,period greaterthan5yrs
Wellstaggered(between1-5yrs) 1 1 1 0 1
11 CEOandDirectorsShares(directlyandindirectly)
0%orgreaterthan20%shareholding
Between 11%and20%shareholding
Between 0%and10%shareholding 1 0 1 0 0
12 ShareholderCompositionShareholding with
controlling governmentstakeofover20%
DiverseShareholdingSophisticated InsituionalInvestors/Renownparent
companyholding1 0 1 0 1

4444
Metrics for EABL, EAPC, Equity, Flame Tree & HF Group, continued…EABL EAPC Equity Flame
TreeHF
GroupNo. Metrics 0 0.5 1 Score Score Score Score Score13 Freefloat** Lessthan35% Between 35%and50% Greater than50% 0.5 0 1 0 0.5
14 BoardRemuneration vsEPS
Negativecorrelation(Remuneration increasewhileEPSdecline)/Zero
correlation
Weakpositivecorrelation
Strongpositivecorrelation/
Remuneration declinewhileEPSincrease
1 0.5 0 0 0
15 Choice ofAuditors Noproof ofAudits Non-recognized auditor Recognized auditors 1 1 1 0.5 116 Rotation ofAuditors NoRotation Greater than5yrs Lessthan5yrs 1 0 0 0 0
17 Evaluation ofCEO NotConductedConducted withnegativeresults/Conducted withno
resultsdisclosure
Conducted withpositiveresultsdisclosure 0.5 0.5 0.5 0.5 0.5
18 InternalAudit Function Lacksthisfunction Lessthan75%independentmembers
75%orgreaterindependent members 1 1 1 0.5 0
19 Loanstodirectorsvsshareholding LoansgreaterthanShareholding
Loansgreaterthan50%oftheShareholding
Loanslessthan50%ofshareholding 1 1 1 0 0
20 Releaseresultsontime Beyond120days 90days≤x≤120days Within 90days 1 1 1 1 1
21 Dividend PolicyNoknowndividend
policy/inconstency withpolicy
consistent payment Consistently followed plan 0.5 0 0.5 0 0.5
22 Debtto Capital/Tangible Equity forBanksandInsuranceCompanies(a)
Beyond20%optimalaboveorbelow/Nodebt;>5%deviation
frommedian(14.3%)forbanks;>10%deviation
frommedianforinsurance companies
(21.8%)
10%- 20%aboveorbelowoptimal;1%- 5%deviationfrommedian(14.3%)forbanks;5%- 10%deviationfrommedianforinsurance
companies(21.8%)
10%aboveorbelowoptimal;0%-1%deviationfrommedian(14.3%)forbanks;0%- 5%deviation
frommedianforinsurance companies
(21.8%)
0 1 0.5 0 0.5
23 EaseofaccessofInformation Opaque Disclosures notcomprehensive
Sufficient disclosure ofinformation 1 0.5 1 0.5 1
24 CorporateSocialResponsibility Doesn’t Participate - Activelyparticipates 1 1 1 0 1Comprehensive Score 77.1% 50.0% 72.9% 33.3% 60.4%

4545
Metrics for I&M, Jubilee, Kakuzi, KCB Group & KenGenI&M Jubilee Kakuzi KCB KenGen
No. Metrics 0 0.5 1 Score Score Score Score Score1 BoardSize&Evenness Lessthan4members 12ormore/EvenNumber Between 5- 11members 0.5 1 1 1 1
2 GenderDiversity 0%Diversity Greater than0%butlessthan33% 33%orgreater 0.5 0.5 0 0.5 0.5
3 AverageAgeofDirectors Greater than60yrsandlessthan40yrs 50- 60yrs 40- 50yrs 0.5 0.5 0 0.5 0.5
4 Ethnic Diversity Greater than50%from1ethnicity
Between 30%and50%from1ethnicity
Lessthan30%from1ethnicity 0.5 0 0.5 1 0.5
5GlobalMarketsExposure(studiesandworkexperience)ExcludeAfrica(include S.AandEgypt)
None OneorTwomembers MorethanTwomembers 1 1 1 1 1
6 Proportion ofNon-Executive Nomember Lessthan50% 50%andGreater 1 1 1 1 1
7 Attendance toMeetings Lessthan50%attendance
between50%and75%attendance
Greater than75%attendance 1 1 0 1 1
8 Independence ofChairtoCEO SameIndividual
Different butrelated(Eitherfamilyorhaveworkedtogether forasignificant
number ofyears)
Different &Independent 1 1 1 1 1
9 TenureoftheCEO Notermlimitsandelection
Definedtenure greaterthan7years
Definedtenure ofabout3to7years 0 0 0 1 1
10 StaggeredMembersforboard Non-existent Staggered,period greaterthan5yrs
Wellstaggered(between1-5yrs) 0 1 1 1 1
11 CEOandDirectorsShares(directlyandindirectly)
0%orgreaterthan20%shareholding
Between 11%and20%shareholding
Between 0%and10%shareholding 1 1 1 1 1
12 ShareholderCompositionShareholding with
controlling governmentstakeofover20%
DiverseShareholdingSophisticated InsituionalInvestors/Renownparent
companyholding1 1 0.5 1 0

4646
Metrics for I&M, Jubilee, Kakuzi, KCB Group & KenGen, continued…I&M Jubilee Kakuzi KCB KenGen
No. Metrics 0 0.5 1 Score Score Score Score Score13 Freefloat** Lessthan35% Between 35%and50% Greater than50% 0 0.5 0 1 0
14 BoardRemuneration vsEPS
Negativecorrelation(Remuneration increasewhileEPSdecline)/Zero
correlation
WeakpositivecorrelationStrongpositivecorrelation/Remuneration declinewhileEPSincrease
1 0.5 1 1 1
15 Choice ofAuditors Noproof ofAudits Non-recognized auditor Recognized auditors 1 1 1 1 116 Rotation ofAuditors NoRotation Greater than5yrs Lessthan5yrs 1 1 0 1 1
17 Evaluation ofCEO NotConductedConducted withnegativeresults/Conducted withno
resultsdisclosure
Conducted withpositiveresultsdisclosure 0.5 0 0 1 1
18 InternalAudit Function Lacksthisfunction Lessthan75%independentmembers
75%orgreaterindependent members 1 1 1 1 1
19 Loanstodirectorsvsshareholding LoansgreaterthanShareholding
Loansgreaterthan50%oftheShareholding
Loanslessthan50%ofshareholding 1 1 1 1 1
20 Releaseresultsontime Beyond120days 90days≤x≤120days Within 90days 1 1 1 1 1
21 Dividend PolicyNoknowndividend
policy/inconstency withpolicy
consistent payment Consistently followed plan 0.5 0.5 0.5 1 0.5
22 Debtto Capital/Tangible Equity forBanksandInsuranceCompanies(a)
Beyond20%optimalaboveorbelow/Nodebt;>5%deviation
frommedian(14.3%)forbanks;>10%deviation
frommedianforinsurance companies
(21.8%)
10%- 20%aboveorbelowoptimal;1%- 5%deviationfrommedian(14.3%)forbanks;5%- 10%deviationfrommedianforinsurance
companies(21.8%)
10%aboveorbelowoptimal;0%-1%deviationfrommedian(14.3%)forbanks;0%- 5%deviationfrommedianforinsurance
companies(21.8%)
0.5 1 0 1 0
23 EaseofaccessofInformation Opaque Disclosures notcomprehensive
Sufficient disclosure ofinformation 1 1 1 1 1
24 CorporateSocialResponsibility Doesn’t Participate - Activelyparticipates 1 1 1 1 1
Comprehensive Score 72.9% 77.1% 60.4% 95.8% 79.2%

4747
Metrics for Kenol/Kobil, KQ, Orchards, Kenya Power & Kenya ReKenol/Kobil KQ Kenya
OrchardsKenyaPower
Kenya-Re
No. Metrics 0 0.5 1 Score Score Score Score Score1 BoardSize&Evenness Lessthan4members 12ormore/EvenNumber Between 5- 11members 0.5 0.5 0 1 1
2 GenderDiversity 0%Diversity Greater than0%butlessthan33% 33%orgreater 0.5 0.5 0 0.5 0.5
3 AverageAgeofDirectors Greater than60yrsandlessthan40yrs 50- 60yrs 40- 50yrs 0 0.5 0 0.5 0
4 Ethnic Diversity Greater than50%from1ethnicity
Between 30%and50%from1ethnicity
Lessthan30%from1ethnicity 1 0.5 0 0.5 0.5
5
GlobalMarketsExposure(studies andworkexperience)ExcludeAfrica(include S.Aand
Egypt)
None OneorTwomembers MorethanTwomembers 1 1 0 0.5 1
6 Proportion ofNon-Executive Nomember Lessthan50% 50%andGreater 1 1 0 1 1
7 Attendance toMeetings Lessthan50%attendance
between50%and75%attendance
Greater than75%attendance 0 0 0 1 0
8 Independence ofChairtoCEO SameIndividual
Different butrelated(Either familyorhaveworkedtogether forasignificant numberof
years)
Different &Independent 1 1 1 1 1
9 TenureoftheCEO Notermlimitsandelection
Definedtenure greaterthan7years
Definedtenure ofabout3to7years 0 0 0 0 0
10 StaggeredMembersforboard Non-existent Staggered,period greaterthan5yrs
Wellstaggered(between1- 5yrs) 0 1 0 1 0
11 CEOandDirectorsShares(directly andindirectly)
0%orgreaterthan20%shareholding
Between 11%and20%shareholding
Between 0%and10%shareholding 0 1 0 1 1
12 ShareholderComposition
Shareholding withcontrolling
governmentstakeofover20%
DiverseShareholdingSophisticated InsituionalInvestors/Renown
parentcompanyholding0.5 0.5 0 0 0

4848
Metrics for Kenol/Kobil, KQ, Orchards, Kenya Power & Kenya Re, continued…Kenol/Kobil KQ Kenya
OrchardsKenyaPower
Kenya-Re
No. Metrics 0 0.5 1 Score Score Score Score Score13 Freefloat** Lessthan35% Between 35%and50% Greater than50% 0 0 0 0 0
14 BoardRemuneration vsEPS
Negativecorrelation(Remuneration
increasewhileEPSdecline)/Zerocorrelation
Weakpositivecorrelation
Strongpositivecorrelation/
Remuneration declinewhileEPSincrease
1 0.5 0 1 1
15 Choice ofAuditors Noproof ofAudits Non-recognized auditor Recognized auditors 1 1 0.5 1 116 Rotation ofAuditors NoRotation Greater than5yrs Lessthan5yrs 0 1 0 1 0
17 Evaluation ofCEO NotConductedConducted withnegativeresults/Conducted withno
resultsdisclosure
Conducted withpositiveresultsdisclosure 0 0.5 0 0.5 0.5
18 InternalAudit Function Lacksthisfunction Lessthan75%independent members
75%orgreaterindependent members 0.5 1 0 1 1
19 Loanstodirectorsvsshareholding
LoansgreaterthanShareholding
Loansgreaterthan50%oftheShareholding
Loanslessthan50%ofshareholding 1 1 0 1 1
20 Releaseresultsontime Beyond120days 90days≤x≤120days Within 90days 1 1 1 1 1
21 Dividend PolicyNoknowndividendpolicy/inconstency
withpolicyconsistent payment Consistently followed
plan 0 0.5 0 0 0.5
22Debtto Capital/Tangible Equity
forBanksandInsuranceCompanies(a)
Beyond20%optimalaboveorbelow/Nodebt;>5%deviationfrommedian(14.3%)forbanks;>10%
deviationfrommedianforinsurance
companies(21.8%)
10%- 20%aboveorbelowoptimal;1%- 5%deviationfrommedian(14.3%)forbanks;5%- 10%deviationfrommedianforinsurance
companies(21.8%)
10%aboveorbelowoptimal;0%-1%
deviationfrommedian(14.3%)forbanks;0%-5%deviationfrommedianforinsurancecompanies(21.8%)
1 0 0 0 0
23 EaseofaccessofInformation Opaque Disclosures notcomprehensive
Sufficient disclosure ofinformation 0.5 1 0 1 1
24 CorporateSocialResponsibility Doesn’t Participate - Activelyparticipates 1 1 0 1 1Comprehensive Score 52.1% 66.7% 10.4% 68.8% 58.3%

4949
Metrics for Liberty, Limuru Tea, Mumias, Nation Media & NBK
Liberty LimuruTea Mumias NMG NBK
No. Metrics 0 0.5 1 Score Score Score Score Score1 BoardSize&Evenness Lessthan4members 12ormore/EvenNumber Between 5- 11members 1 0 1 0.5 1
2 GenderDiversity 0%Diversity Greater than0%butlessthan33% 33%orgreater 0.5 0 1 0.5 0.5
3 AverageAgeofDirectors Greater than60yrsandlessthan40yrs 50- 60yrs 40- 50yrs 0 0 0 0.5 0.5
4 Ethnic Diversity Greater than50%from1ethnicity
Between 30%and50%from1ethnicity
Lessthan30%from1ethnicity 1 0.5 1 0.5 1
5GlobalMarketsExposure(studiesandworkexperience)ExcludeAfrica(include S.AandEgypt)
None OneorTwomembers MorethanTwomembers 1 0 1 1 1
6 Proportion ofNon-Executive Nomember Lessthan50% 50%andGreater 1 0 1 1 1
7 Attendance toMeetings Lessthan50%attendance
between50%and75%attendance
Greater than75%attendance 1 0 0 0 1
8 Independence ofChairtoCEO SameIndividual
Different butrelated(Eitherfamilyorhaveworkedtogether forasignificant
number ofyears)
Different &Independent 1 0 1 1 1
9 TenureoftheCEO Notermlimitsandelection
Definedtenure greaterthan7years
Definedtenure ofabout3to7years 0 0 0 0 0
10 StaggeredMembersforboard Non-existent Staggered,period greaterthan5yrs
Wellstaggered(between1-5yrs) 1 0 0 1 1
11 CEOandDirectorsShares(directlyandindirectly)
0%orgreaterthan20%shareholding
Between 11%and20%shareholding
Between 0%and10%shareholding 0 0 1 1 1
12 ShareholderCompositionShareholding with
controlling governmentstakeofover20%
DiverseShareholdingSophisticated InsituionalInvestors/Renownparent
companyholding1 1 0 1 0.5

5050
Metrics for Liberty, Limuru Tea, Mumias, Nation Media & NBK, continued…Liberty Limuru
Tea Mumias NMG NBK
No. Metrics 0 0.5 1 Score Score Score Score Score13 Freefloat** Lessthan35% Between 35%and50% Greater than50% 0 0 1 0.5 0
14 BoardRemuneration vsEPS
Negativecorrelation(Remuneration increasewhileEPSdecline)/Zero
correlation
Weakpositivecorrelation
Strongpositivecorrelation/
Remuneration declinewhileEPSincrease
0 0 0 1 0
15 Choice ofAuditors Noproof ofAudits Non-recognized auditor Recognized auditors 1 1 0.5 1 116 Rotation ofAuditors NoRotation Greater than5yrs Lessthan5yrs 0.5 0 0.5 0 1
17 Evaluation ofCEO NotConductedConducted withnegativeresults/Conducted withno
resultsdisclosure
Conducted withpositiveresultsdisclosure 0 0 0 0 0.5
18 InternalAudit Function Lacksthisfunction Lessthan75%independentmembers
75%orgreaterindependent members 1 0 1 1 1
19 Loanstodirectorsvsshareholding LoansgreaterthanShareholding
Loansgreaterthan50%oftheShareholding
Loanslessthan50%ofshareholding 1 1 0 0 0
20 Releaseresultsontime Beyond120days 90days≤x≤120days Within 90days 1 1 1 1 1
21 Dividend PolicyNoknowndividend
policy/inconstency withpolicy
consistent payment Consistently followed plan 0.5 0 0 0.5 0.5
22 Debtto Capital/Tangible Equity forBanksandInsuranceCompanies(a)
Beyond20%optimalaboveorbelow/Nodebt;>5%deviation
frommedian(14.3%)forbanks;>10%deviation
frommedianforinsurance companies
(21.8%)
10%- 20%aboveorbelowoptimal;1%- 5%deviationfrommedian(14.3%)forbanks;5%- 10%deviationfrommedianforinsurance
companies(21.8%)
10%aboveorbelowoptimal;0%-1%deviationfrommedian(14.3%)forbanks;0%- 5%deviationfrommedianforinsurance
companies(21.8%)
0.5 0 0 0 0
23 EaseofaccessofInformation Opaque Disclosures notcomprehensive
Sufficient disclosure ofinformation 1 0 0.5 0 1
24 CorporateSocialResponsibility Doesn’t Participate - Activelyparticipates 1 0 1 1 1Comprehensive Score 66.7% 18.8% 52.1% 58.3% 68.8%

5151
Metrics for NIC, NSE, Pan-Africa, Safaricom, SasiniNIC NSE Pan-
africa Safaricom Sasini
No. Metrics 0 0.5 1 Score Score Score Score Score1 BoardSize&Evenness Lessthan4members 12ormore/EvenNumber Between 5- 11members 1 0.5 0.5 1 0.5
2 GenderDiversity 0%Diversity Greater than0%butlessthan33% 33%orgreater 0.5 0.5 0.5 1 0.5
3 AverageAgeofDirectors Greater than60yrsandlessthan40yrs 50- 60yrs 40- 50yrs 0.5 0 0.5 0.5 0
4 Ethnic Diversity Greater than50%from1ethnicity
Between 30%and50%from1ethnicity
Lessthan30%from1ethnicity 0 0.5 1 0.5 0
5GlobalMarketsExposure(studiesandworkexperience)ExcludeAfrica(include S.AandEgypt)
None OneorTwomembers MorethanTwomembers 1 1 1 1 1
6 Proportion ofNon-Executive Nomember Lessthan50% 50%andGreater 1 1 1 1 1
7 Attendance toMeetings Lessthan50%attendance
between50%and75%attendance
Greater than75%attendance 0 1 1 1 1
8 Independence ofChairtoCEO SameIndividual
Different butrelated(Eitherfamilyorhaveworkedtogether forasignificant
number ofyears)
Different &Independent 1 1 1 1 1
9 TenureoftheCEO Notermlimitsandelection
Definedtenure greaterthan7years
Definedtenure ofabout3to7years 0 0.5 0 1 0
10 StaggeredMembersforboard Non-existent Staggered,period greaterthan5yrs
Wellstaggered(between1- 5yrs) 1 1 1 1 1
11 CEOandDirectorsShares(directlyandindirectly)
0%orgreaterthan20%shareholding
Between 11%and20%shareholding
Between 0%and10%shareholding 0.5 1 0.5 1 1
12 ShareholderCompositionShareholding with
controlling governmentstakeofover20%
DiverseShareholdingSophisticated InsituionalInvestors/Renown
parentcompanyholding0.5 0.5 1 1 0.5

5252
Metrics for NIC, NSE, Pan-Africa, Safaricom, Sasini, continued…NIC NSE Pan-
africa Safaricom Sasini
No. Metrics 0 0.5 1 Score Score Score Score Score13 Freefloat** Lessthan35% Between 35%and50% Greater than50% 1 1 0 0 0
14 BoardRemuneration vsEPS
Negativecorrelation(Remuneration increasewhileEPSdecline)/Zero
correlation
Weakpositivecorrelation
Strongpositivecorrelation/
Remuneration declinewhileEPSincrease
0 0 0 1 0.5
15 Choice ofAuditors Noproof ofAudits Non-recognized auditor Recognized auditors 1 1 1 1 116 Rotation ofAuditors NoRotation Greater than5yrs Lessthan5yrs 1 1 1 0.5 1
17 Evaluation ofCEO NotConductedConducted withnegativeresults/Conducted withno
resultsdisclosure
Conducted withpositiveresultsdisclosure 0 0 0.5 1 0
18 InternalAudit Function Lacksthisfunction Lessthan75%independentmembers
75%orgreaterindependent members 1 1 1 0.5 1
19 Loanstodirectorsvsshareholding LoansgreaterthanShareholding
Loansgreaterthan50%oftheShareholding
Loanslessthan50%ofshareholding 0.5 1 1 1 1
20 Releaseresultsontime Beyond120days 90days≤x≤120days Within 90days 1 1 1 1 1
21 Dividend PolicyNoknowndividend
policy/inconstency withpolicy
consistent payment Consistently followed plan 0.5 0 0 1 0.5
22 Debtto Capital/Tangible Equity forBanksandInsuranceCompanies(a)
Beyond20%optimalaboveorbelow/Nodebt;>5%deviation
frommedian(14.3%)forbanks;>10%deviation
frommedianforinsurance companies
(21.8%)
10%- 20%aboveorbelowoptimal;1%- 5%deviationfrommedian(14.3%)forbanks;5%- 10%deviationfrommedianforinsurance
companies(21.8%)
10%aboveorbelowoptimal;0%-1%deviationfrommedian(14.3%)forbanks;0%- 5%deviationfrommedianforinsurance
companies(21.8%)
1 0 0.5 0 0
23 EaseofaccessofInformation Opaque Disclosures notcomprehensive
Sufficient disclosure ofinformation 1 1 1 1 0
24 CorporateSocialResponsibility Doesn’t Participate - Activelyparticipates 1 1 1 1 1Comprehensive Score 66.7% 68.8% 70.8% 83.3% 60.4%

5353
Metrics for StanChart, Standard Group, Serena, Total and TranscenturySCBK Standard TPSEA Total
KenyaTrans-Century
No. Metrics 0 0.5 1 Score Score Score Score Score
1 BoardSize&Evenness Lessthan4members 12ormore/EvenNumber Between 5- 11members 0.5 0.5 0.5 0.5 0.5
2 GenderDiversity 0%Diversity Greater than0%butlessthan33% 33%orgreater 0.5 0.5 0.5 1 0.5
3 AverageAgeofDirectors Greater than60yrsandlessthan40yrs 50- 60yrs 40- 50yrs 0.5 0 0 0.5 0
4 Ethnic Diversity Greater than50%from1ethnicity
Between 30%and50%from1ethnicity
Lessthan30%from1ethnicity 1 1 0.5 1 0
5GlobalMarketsExposure(studiesandworkexperience)ExcludeAfrica(include S.AandEgypt)
None OneorTwomembers MorethanTwomembers 1 1 1 1 1
6 Proportion ofNon-Executive Nomember Lessthan50% 50%andGreater 1 1 1 1 1
7 Attendance toMeetings Lessthan50%attendance
between50%and75%attendance
Greater than75%attendance 1 1 0.5 0 1
8 Independence ofChairtoCEO SameIndividual
Different butrelated(Eitherfamilyorhaveworkedtogether forasignificant
number ofyears)
Different &Independent 1 1 1 1 1
9 TenureoftheCEO Notermlimitsandelection
Definedtenure greaterthan7years
Definedtenure ofabout3to7years 1 0 0 0 0
10 StaggeredMembersforboard Non-existent Staggered,period greaterthan5yrs
Wellstaggered(between1- 5yrs) 1 0 0 1 1
11 CEOandDirectorsShares(directlyandindirectly)
0%orgreaterthan20%shareholding
Between 11%and20%shareholding
Between 0%and10%shareholding 1 0 1 0 0
12 ShareholderCompositionShareholding with
controlling governmentstakeofover20%
DiverseShareholdingSophisticated InsituionalInvestors/Renown
parentcompanyholding1 1 1 1 0.5

5454
SCBK Standard TPSEA TotalKenya
Trans-Century
No. Metrics 0 0.5 1 Score Score Score Score Score13 Freefloat** Lessthan35% Between 35%and50% Greater than50% 0 0 0 0 0.5
14 BoardRemuneration vsEPS
Negativecorrelation(Remuneration increasewhileEPSdecline)/Zero
correlation
Weakpositivecorrelation
Strongpositivecorrelation/
Remuneration declinewhileEPSincrease
1 0.5 0 1 0
15 Choice ofAuditors Noproof ofAudits Non-recognized auditor Recognized auditors 1 1 1 1 116 Rotation ofAuditors NoRotation Greater than5yrs Lessthan5yrs 0 1 0 0 0
17 Evaluation ofCEO NotConductedConducted withnegativeresults/Conducted withno
resultsdisclosure
Conducted withpositiveresults
disclosure1 0 0.5 0 0
18 InternalAudit Function Lacksthisfunction Lessthan75%independentmembers
75%orgreaterindependent members 1 1 1 0.5 1
19 Loanstodirectorsvsshareholding LoansgreaterthanShareholding
Loansgreaterthan50%oftheShareholding
Loanslessthan50%ofshareholding 1 0 1 1 1
20 Releaseresultsontime Beyond120days 90days≤x≤120days Within 90days 1 1 1 1 1
21 Dividend PolicyNoknowndividend
policy/inconstency withpolicy
consistent payment Consistently followedplan 1 0.5 0.5 o.5 0
22 Debtto Capital/Tangible Equity forBanksandInsuranceCompanies(a)
Beyond20%optimalaboveorbelow/Nodebt;>5%deviation
frommedian(14.3%)forbanks;>10%deviation
frommedianforinsurance companies
(21.8%)
10%- 20%aboveorbelowoptimal;1%- 5%deviationfrommedian(14.3%)forbanks;5%- 10%deviationfrommedianforinsurance
companies(21.8%)
10%aboveorbelowoptimal;0%-1%
deviationfrommedian(14.3%)forbanks;0%-5%deviationfrommedianforinsurancecompanies(21.8%)
0.5 1 0.5 0.5 0.5
23 EaseofaccessofInformation Opaque Disclosures notcomprehensive
Sufficient disclosure ofinformation 1 0.5 0.5 1 1
24 CorporateSocialResponsibility Doesn’t Participate - Activelyparticipates 1 1 1 1 1Comprehensive Score 83.3% 60.4% 58.3% 65.2% 56.3%
Metrics for Stanchart, Standard, Serena, Total and TransCentury continued…

5555
Metrics for Unga, Uchumi, Umeme, Williamson and ScangroupUnga Uchumi Umeme Williamson WPP
ScanNo. Metrics 0 0.5 1 Score Score Score Score Score
1 BoardSize&Evenness Lessthan4members 12ormore/EvenNumber Between 5- 11members 0.5 0.5 0.5 1 0.5
2 GenderDiversity 0%Diversity Greater than0%butlessthan33% 33%orgreater 0.5 0.5 0.5 0.5 0
3 AverageAgeofDirectors Greater than60yrsandlessthan40yrs 50- 60yrs 40- 50yrs 0.5 0 0 0 0.5
4 Ethnic Diversity Greater than50%from1ethnicity
Between 30%and50%from1ethnicity
Lessthan30%from1ethnicity 0 0.5 0.5 0.5 0.5
5GlobalMarketsExposure(studiesandworkexperience)ExcludeAfrica(include S.AandEgypt)
None OneorTwomembers MorethanTwomembers 1 0 1 0 1
6 Proportion ofNon-Executive Nomember Lessthan50% 50%andGreater 1 1 1 1 1
7 Attendance toMeetings Lessthan50%attendance
between50%and75%attendance
Greater than75%attendance 0 0 1 0 0
8 Independence ofChairtoCEO SameIndividual
Different butrelated(Eitherfamilyorhaveworkedtogether forasignificant
number ofyears)
Different &Independent 1 1 1 1 1
9 TenureoftheCEO Notermlimitsandelection
Definedtenure greaterthan7years
Definedtenure ofabout3to7years 0 0 0 0 0
10 StaggeredMembersforboard Non-existent Staggered,period greaterthan5yrs
Wellstaggered(between1- 5yrs) 1 0 1 1 0
11 CEOandDirectorsShares(directlyandindirectly)
0%orgreaterthan20%shareholding
Between 11%and20%shareholding
Between 0%and10%shareholding 1 0 1 1 0.5
12 ShareholderCompositionShareholding with
controlling governmentstakeofover20%
DiverseShareholding
SophisticatedInsituional Investors/
Renown parentcompanyholding
0.5 0 1 0.5 0.5

5656
Unga Uchumi Umeme Williamson WPPScan
No. Metrics 0 0.5 1 Score Score Score Score Score13 Freefloat** Lessthan35% Between 35%and50% Greater than50% 0 1 0.5 0 0
14 BoardRemuneration vsEPS
Negativecorrelation(Remuneration increasewhileEPSdecline)/Zero
correlation
Weakpositivecorrelation
Strongpositivecorrelation/
Remuneration declinewhileEPSincrease
1 0 0 0 0.5
15 Choice ofAuditors Noproof ofAudits Non-recognized auditor Recognized auditors 1 1 1 1 116 Rotation ofAuditors NoRotation Greater than5yrs Lessthan5yrs 1 0 0.5 0 0
17 Evaluation ofCEO NotConductedConducted withnegativeresults/Conducted withno
resultsdisclosure
Conducted withpositiveresultsdisclosure 0.5 0 0.5 0 0
18 InternalAudit Function Lacksthisfunction Lessthan75%independentmembers
75%orgreaterindependent members 1 0 1 1 1
19 Loanstodirectorsvsshareholding LoansgreaterthanShareholding
Loansgreaterthan50%oftheShareholding
Loanslessthan50%ofshareholding 1 0 1 1 1
20 Releaseresultsontime Beyond120days 90days≤x≤120days Within 90days 1 1 1 1 1
21 Dividend PolicyNoknowndividend
policy/inconstency withpolicy
consistent payment Consistently followedplan 0.5 0 0.5 0.5 0.5
22Debtto Capital/Tangible Equity
forBanksandInsuranceCompanies(a)
Beyond20%optimalaboveorbelow/Nodebt;>5%deviationfrommedian(14.3%)forbanks;>10%
deviationfrommedianforinsurance
companies(21.8%)
10%- 20%aboveorbelowoptimal;1%- 5%deviationfrommedian(14.3%)forbanks;5%- 10%deviationfrommedianforinsurance
companies(21.8%)
10%aboveorbelowoptimal;0%-1%
deviationfrommedian(14.3%)forbanks;0%-5%deviationfrommedianforinsurancecompanies(21.8%)
0 1 1 0 0
23 EaseofaccessofInformation Opaque Disclosures notcomprehensive
Sufficient disclosure ofinformation 1 0.5 1 0.5 0.5
24 CorporateSocialResponsibility Doesn’t Participate - Activelyparticipates 1 1 1 0 0
Comprehensive Score 66.7% 37.5% 72.9% 47.9% 45.8%
Metrics for Unga, Uchumi, Umeme, Williamson and Scangroup continued…

5757
C. Investments & Research Team

58
Investment & Research Team
Shiv A. AroraHead of Private Equity, Real EstateShiv serves as Head Private Equity, Real Estate at Cytonn Investments Management Limited. His experience within thefinancial services industry ranges from wealth management with Merrill Lynch Dubai to Citibank Kenya. Most recently,Shiv served as an Investment Analyst for Britam Asset Managers, focused largely on the Private Market segment,with a key focus on Real Estate. Shiv holds a BSc. Hons in Economics from theUniversity ofWarwick and is a candidate intheCFA Programme.
MauriceOduorHead of Investments, Public MarketsMaurice serves as an Investment Manager at Cytonn Investments Management Limited. He has over six yearsexperience in investment industry having worked with two strong brands in Kenya. Before joining Cytonn Investments,Maurice served as Assistant Portfolio Manager at Britam Asset Managers Ltd focusing on portfolio managementand clients relationship management. Maurice started his career at Genesis Kenya Investment Management Ltd as aninvestment Assistant with specialization in Fixed incomeanalysis, investment dealing and port folio management duties.He holds a Bachelor of Business Administration (Finance option) from Maseno University and is currently a CharteredFinancial Analyst (CFA) level III candidate.
Cytonn’s investment team bring with them vast experience in investment managementElizabeth N. Nkukuu, CFAPartner, Chief InvestmentOfficerElizabeth serves as theChief Investment Officer of Cytonn InvestmentsManagement Limited. Shehas over 10 years ofexperience in Investment Management. Before Joining Cytonn, Elizabeth was a Senior Portfolio Manager at BritamAsset Managers having come from Genesis Investments as an Investment Manager. Elizabeth started hercareer as an Investment analyst in PineBridge Investments. Elizabeth has a Master’s of Business Administration (MBA)Degree (Finance) from the University of Nairobi. In addition to being a Chartered Financial Analyst (CFA), she is also aCPA (K).

59
Duncan Lumwamu,BSc.Senior Investment AnalystDuncan serves as a Senior Investment Analyst at Cytonn Investments Management Limited. He has over four years ofexperience in Investment Research and Investment management. His experience ranges from research on local, regionaland global equities, deal structuring and portfolio management. Before joining Cytonn Investments, Duncan held theposition of Head of Research at Dyer and Blair Investment Bank and ABC Capital. Duncan started his career at BritamAsset Managers as an Investment analyst. He holds a Bachelor of Science in Statistics degree from the University ofNairobi and he is a candidate in theCFA Programme.
Cytonn’s investment team bring with them vast experience in investment management
CalebM.MugendiInvestment AnalystCaleb serves as an Investment Analyst at Cytonn Investments Management Limited. He is a graduate of the CytonnYoung Leaders Program, a prestigious hands-on training on finance and investment management. His experience rangesfrom specialization in fixed incomeanalysis, currencies and the financial services industry, having focused largely on thebanking sector. Heholds a Bachelor of Economics from KenyattaUniversity and is currently a Chartered Financial Analyst(CFA) level II candidate.
John NduaInvestment AnalystJohn serves as an Investment Analyst at Cytonn InvestmentsManagement Limited. He is a graduate of theCytonn YoungLeaders Program, a prestigious and hands on financial and investments training program. His experience widely rangesfrom equities, fixed income analysis and financial modelling having focused largely on the financial services sector. Heholds a Bachelors of Science Degree in Actuarial Science from the Jomo Kenyatta University of Agriculture andTechnology. He is currently an actuarial candidate currently holding a Certificate in Financial Mathematics from TheInstitute and Faculty of Actuaries.
Investment & Research Team, continued…

6060
Q&AIncaseofanyqueriesorclarificationsonthisReport,kindlycontactthe
Teamat:E-mail:[email protected]
Tel:+254(0)709101000/714830744
Recommended