Pr o ce edin gs of the C ons erv - Vis io n C on f eren ce • The Uni vers i t y o f Waika t o
ww w .wa ika t o.a c .nz /w fas s /C onse rv - Vis i on
Conserv-Vision Conference Proceedings The University of Waikato
A CELEBRATION OF 20 YEARS OF CONSERVATION BY NEW ZEALAND’S DEPARTMENT OF CONSERVATION
CONFERENCE PROCEEDINGS EDITED BY:
Dr Bruce Clarkson, Dr Mairi Jay, Dr Priya Kurian, Todd Nachowitz, & Dr Hamish Rennie
© 2008 S. Bijoy Nandan
Article Title: “Current status and biodiversity modification in the coastal wetland ecosystems of India with objectives for its sustainable management”
Author(s): Nandan, S. Bijoy
Publication Date: 4 November 2008
Source: Proceedings of the Conserv-Vision Conference, University of Waikato, 2-4 July 2007
Published by: The University of Waikato, Private Bag 3105, Hamilton, New Zealand
Stable URL: www.waikato.ac.nz/wfass/conserv-vision

S. Bijoy Nandan 1
Pr o ce edin gs of the C ons erv - Vis io n C on f eren ce • The Uni vers i t y o f Waika t o ww w .wa ika t o.a c .nz /w fas s /cons erv - vis io n
Current status and biodiversity modification in the coastal wetland ecosystems of India with objectives for its sustainable management
S. Bijoy Nandan
Dept. of Marine Biology, Microbiology & Biochemistry, School of Ocean Science & Technology, Cochin University of Science & Technology, Cochin 6820 16, India
email: < [email protected]>
Abstract
The South West (S.W.) coast of India is blessed with a series of wetland systems popularly referred to as backwaters covering a total area of 46128.94 ha. These backwaters are internationally renowned for their aesthetic and scientific values including being a repository for several species fish and shell fishes. This is more significant in that three wetlands (Vembanad, Sasthamcotta and Ashtamudi) have recently been designated as Ramsar sites of international importance. Thirty major backwaters forming the crux of the coastal wetlands form an abode for over 200 resident or migratory fish and shellfish species. The fishing activities in these water bodies provide the livelihood to about 200,000 fishers and also provide full-time employment to over 50,000 fishermen. This paper describes the changes on the environmental and biodiversity status of selected wetlands, during 1994-2005 period. The pH was generally near neutral to alkaline in range. The salinity values indicated mixohaline condition ranging from 5.20-32.38 ppt. in the 12 wetlands. The productivity values were generally low in most of the wetlands during the study, where the gross production varied from 0.22 gC/m3/day in Kadinamkulam to 1.10 gC/m3/day in the Kayamkulam. The diversity of plankton and benthos was more during the pre-monsoon compared to the monsoon and post-monsoon periods in most of the wetlands. The diversity of plankton and benthos was more during the pre-monsoon compared to the monsoon and post-monsoon periods in most of the wetlands. The average fish yield per ha. varied from 246 kg. in Valapattanam to 2747.3 kg. in Azhikode wetland. Retting of coconut husk in most of the wetlands led to acidic pH conditions with anoxia resulting in the production of high amounts of sulphide, coupled with high carbon dioxide values leading to drastic reduction in the incidence and abundance of plankton, benthic fauna and the fishery resources. The major fish species recorded from the investigation were Etroplus suratensis, E. maculatus, Channa marulius, Labeo dussumieri, Puntius sp. Lutianus argentimaculatus, Mystus sp., Tachysurus sp. and Hemiramphus sp. The majority of these backwaters are highly stressed, especially during the pre monsoon period when the retting activity is at its peak. The study has clearly reflected that a more restrained and cautious approach is needed to manage and preserve the unique backwater ecosystems of South-west India.
Key words: Coastal wetlands, Backwaters Biodiversity, Chemical and physical parameters,
Plankton, Benthos, Fishery, Retting, sustainability, India

Current status and biodiversity modification in the coastal wetland ecosystems of India 2
Pr o ce edin gs of the C ons erv - Vis io n C on f eren ce • The Uni vers i t y o f Waika t o
ww w .wa ika t o.a c .nz /w fas s /C onse rv - Vis i on
Introduction
Coastal wetlands are known to be an indispensable habitat to a variety of biologically and
economically important resident and migratory aquatic fauna. Moreover, the interdependence of the
adjoining marine and the estuarine zones in completion of the life cycle processes of innumerable
aquatic species is amply described in fishery literature (Jhingran, 1988, Kurup and Samuel 1987). The
biologic importance of the chain of backwaters/ estuaries/ wetlands (locally called as kayals) along
with the canals are of special significance in this context. Plate 1 gives the Ramsar sites of Kerala and
other important wetlands. Gopalan (1983) has presented a comprehensive account of the history of
reclamation and the consequent shrinkage of the backwaters, especially the Vembanad backwaters.
Similarly under the Indo-Dutch Collaborative Research Project on the Water Balance study of the
Kuttanad Region, various aspects of the ecology and fisheries of Vembanad backwater were
investigated and reported (Anon., 2001). Sarala Devi et al (1991) elaborated the coexistence of
different benthic communities in the northern limb of Cochin backwaters. Murugan et al (1980) gave
an account on the distribution and seasonal variation of the benthic fauna of the Veli Lake, Southwest
coast of India. Devassy and Bhattathiri (1974), Kurian et al (1975), Desai et al (1983) and Gopalan et al
(1987) undertook some of the investigations on the benthic fauna extending right from Cochin to
Alappuzha. Sarala Devi et al. (1979) and Unnithan et al (1975) documented the effect of organic
pollution due to industrial pollution on some water quality parameters in Cochin backwaters. There
are few studies available on the general ecology of the backwaters, but studies on a comprehensive
scale is greatly lacking. It was in this context that this contribution investigates the ecology and
fishery potential of selected backwaters of Kerala for their wise use in the context of long term
ecosystem management and conservation objectives.
Materials and Methods
Water samples were collected from selected backwaters as given in Table 1, below and analyzed for
pH, dissolved oxygen, total sulphide, BOD5, COD, free carbon dioxide, alkalinity, conductivity, total
dissolved solids, nitrate, nitrite, phosphate and silicate (APHA, 1992). Sub surface water samples
were collected using the Van Dorn sampler. Rate of primary production was estimated using the
dark and light bottle method as described by the Strickland and Parsons (1972). Plankton was
collected using bolting silk having 60µ meshes. The phytoplankton, zooplankton and benthic fauna
were collected and analysed based on Davis (1955), Ward and Whipple (1959), APHA (1992). The

S. Bijoy Nandan 3
Pr o ce edin gs of the C ons erv - Vis io n C on f eren ce • The Uni vers i t y o f Waika t o ww w .wa ika t o.a c .nz /w fas s /cons erv - vis io n
diversity index (H’ log2), richness index (d), evenness index (‘J) and dominance index (lambda’) of
plankton and benthos were also computed (Margalef, 1968). Fish fauna were identified based on
Talwar and Jhingran (1991). Water and sediment samples were collected from 33 stations in these
backwater systems for the physical and chemical analysis of samples on a seasonal basis. A Landing
Centre Approach was adopted for collecting information on different fish species, fish yield and
gears employed from the 38 fish landing centers around the eleven backwaters during the study
(Cochran, 1977, Gupta et al 1997). The Catch per Unit Effort (CPUE) is expressed as kg/ catch per
craft/hr was computed for the monthly and annual values and used as index of relative abundance.
This contribution documented the environmental and fishery investigations in 11 backwaters in
Kerala during 1996-98 periods on a seasonal basis (monsoon, pre monsoon and post monsoon)
(Fig.1). The data on biota was subjected to multivariate analysis using the PRIMER Version 6,
(Plymouth Routines in Multivariate Ecological Research) software.
Table 1: The eleven backwaters investigated during the study period
---------------------------------------------------------------------------------------------------
Backwaters Abbr. Used District Area (ha)
---------------------------------------------------------------------------------------------------
1 Kadinamkulam KDK Trivandrum 347
2 Achuthengu ANG -do- 552
3 Ashtamudi AST Kollam 6424 4 Kayamkulam KYK Kollam/Alp 1652
5 Azhikode AZK Trissur 696*
6 Chettuva CTV Trissur 714 7 Ponnani PNI Trissur 908**
8 Kadalundi -Beypore KDL/BPR Kozhikode 1192
9 Mahe MHE Kannur 88
10 Valapattanam VPM Kannur 3074
11 Neleswaram NEL Kasargod 825
---------------------------------------------------------------------------------------------------
* Kodungallur-Azhikode estuary ** Ponnani+ Puthuponnani

Current status and biodiversity modification in the coastal wetland ecosystems of India 4
Pr o ce edin gs of the C ons erv - Vis io n C on f eren ce • The Uni vers i t y o f Waika t o
ww w .wa ika t o.a c .nz /w fas s /C onse rv - Vis i on
Results and Discussion
Water Quality
The water quality parameters were recorded from the eleven backwaters during the pre- monsoon,
monsoon and post monsoon periods (Figs. 2, 3 & 4).
The pH was generally near neutral to alkaline in range. However, there was a reduction in its value
particularly during the pre-monsoon period, owing to less mixing coupled with the impact of retting
activity at certain stations. Anchuthengu, Kadinamkulam, Azhikode, Kadalundi and Chettuva
recorded lower pH values. This was mainly due to the organic acids liberated during the retting. The
mean pH values varied from 6.85 in Kadinamkulam to 8.12 in Chettuva backwater during pre-
monsoon season. During monsoon, the variation was from 6.63 in Azhikode to 7.68 in Ashtamudi,
whereas it varied from 6.74 in Ponnani to 8.20 in Neeleshwaram during the post-monsoon period.
Moderate to low transparency values were observed in the systems (0.29-1.54m). Retting areas had
significantly lower values, particularly during the pre-monsoon period due to the accumulation of
coir pith and ret liquor containing organic acids like pectin, pentosan, phenol, tannin, etc. in the water
body. Turbidity from runoff substantially reduced the transparency in these shallow systems during
monsoon while organic pollution resulted in low transparency during the pre-monsoon season. The
salinity values indicated mixo-haline condition of these systems with a range of 5.20-32.38 ppt.
during the pre-monsoon, 0.18 to 22.42 ppt. during the monsoon and 0.5 to 28.6 ppt. during the post-
monsoon periods. Such high variation was also dependent on the tidal impact and sampling time.
The dissolved oxygen level did not exhibit wide variation during the monsoon while nil to low
values were observed at certain stations during the post-monsoon and the pre-monsoon periods. The
highly stressed environment was evident from the fact that on an average, 7 out of the 11 investigated
water bodies recorded dissolved oxygen within a range of 1.73-4.57 ppm during the pre-monsoon
survey. Marked depletion of dissolved oxygen leading to anoxic condition coupled with the presence
of sulfide was the most conspicuous observation at certain stations. This was mainly due to the
intense retting activity in these zones. The dissolved sulphides had an alarming concentration level
in six of the systems during the pre-monsoon days. Sulfides exceeding 10mg/L coupled with nil-
<2.0mg/L dissolved oxygen was prevalent in 12 of the 33 stations investigated during this season.
Bottom layers of five sampling stations recorded no dissolved oxygen during the pre-monsoon

S. Bijoy Nandan 5
Pr o ce edin gs of the C ons erv - Vis io n C on f eren ce • The Uni vers i t y o f Waika t o ww w .wa ika t o.a c .nz /w fas s /cons erv - vis io n
months. This has been despite the exposure of the sampling stations to the tidal amplitudes twice a
day.
The monsoon showers brought nutrients from allochthonous sources into the systems elevating the
phosphate, nitrate and silicate concentrations in the water. Moderate to high COD values were
observed during the post-monsoon when compared to the monsoon season. The high COD load
could be due to the intense of retting activity and runoff from the surrounding areas.
The study indicated that retting of coconut husk in the backwaters has been the most contributing
factor to the organic pollution leading to the depletion in the faunal resources in the backwaters as by
the observations especially during the pre-monsoon survey. Nine of the eleven systems investigated
were subjected to rampant retting activity.
The productivity values were generally low in most of the backwaters during the seasonal study. The
gross production varied from a mean of 0.30gC/m 3/day in Anchuthengu to 0.98 gC/m 3/day in
Azhikode kayal. Earlier investigations conducted on the primary productivity in the Kadinamkulam
backwater reported zero values at retting zones during October to May and 0.02-1.49gC/m 3/day at
other stations and that in Ashtamudi the gross production rate was estimated at 143.88mgC/m3/hr
(Bijoy Nandan, 2004). The present results were in conformity with these studies. Anchuthengu kayal
had consistently poor chlorophyll values indicating the severe stress originating from coconut husk
retting and other anthropogenic influences.
The intense retting activity resulting in organic enrichment was also responsible for the higher
organic content of the sediment in the southern backwaters as compared to the northern. Calcium
carbonate was at its peak in Ashtamudi (Av.17.65%) during the pre-monsoon and the lowest in
Anchuthengu backwater (Av. 0.29%) during the monsoon period. The mining activity of clams and
oysters was more prevalent in the southern backwaters which could have resulted in higher values of
calcium carbonate in the sediment. The available phosphorous content was high during the pre-
monsoon with an average of 0.40% during the pre-monsoon followed by monsoon (Av.0.27%) and
post-monsoon (Av. 0.28%) in the 11 backwaters.
Sand fraction dominated in all the backwaters investigated followed by clay and silt. The northern
backwaters were higher in sand content as compared to the southern systems (Table 2).

Current status and biodiversity modification in the coastal wetland ecosystems of India 6
Pr o ce edin gs of the C ons erv - Vis io n C on f eren ce • The Uni vers i t y o f Waika t o
ww w .wa ika t o.a c .nz /w fas s /C onse rv - Vis i on
The post-monsoon period was characterized by the peak sand fraction followed by pre-monsoon and
the monsoon periods. Coarse sand also formed an important constituent of the sediment texture
contributing a mean of 47.69 % (Av.) during the monsoon, 38.15% (Av.) during the post-monsoon
and 36.34% (Av.) during the pre-monsoon. Silt distribution in the backwaters were very uneven
without any steady pattern, where Ashtamudi had the highest average in the all the three seasons
followed by Kadalundi during the pre-monsoon and Kayamkulam during the monsoon and post
monsoon periods. The clay fraction was highest in the southern backwaters during all the three
seasons with exceptionally high mean value in Anchuthengu (Av.39.15%). This could be due to the
high organic enrichment due to retting activity as well as the stressed condition due to the dry pre-
monsoon months prevalent in the backwater.
Impact of Retting Activity in the Wetlands
There are several anthropogenic interventions affecting the sustainability of floral and faunal
resources (Bijoy Nandan 2004). These include effluent discharge from factories / industries, organic
pollution from various sources. .The retting of coconut husk for the production of coir is the most
extensive and damaging pollution affecting the entire backwater ecosystems of the region. Retting, is
basically a “soaking process” where husks are arranged in bundles in huge coir nets known as ‘’malis”
and allowed to float freely in the backwaters, until they get soaked, become heavy and gradually sink
to the bottom. It involves bacteria, fungi and yeast.
Large chunks of pectin, phenol, cellulose, hemicellulose and tannin are released from the husk into
the surrounding medium, during different stages of retting. In depth studies on the impact of retting
activity on the backwater systems, was reported by Bijoy Nandan (2004).
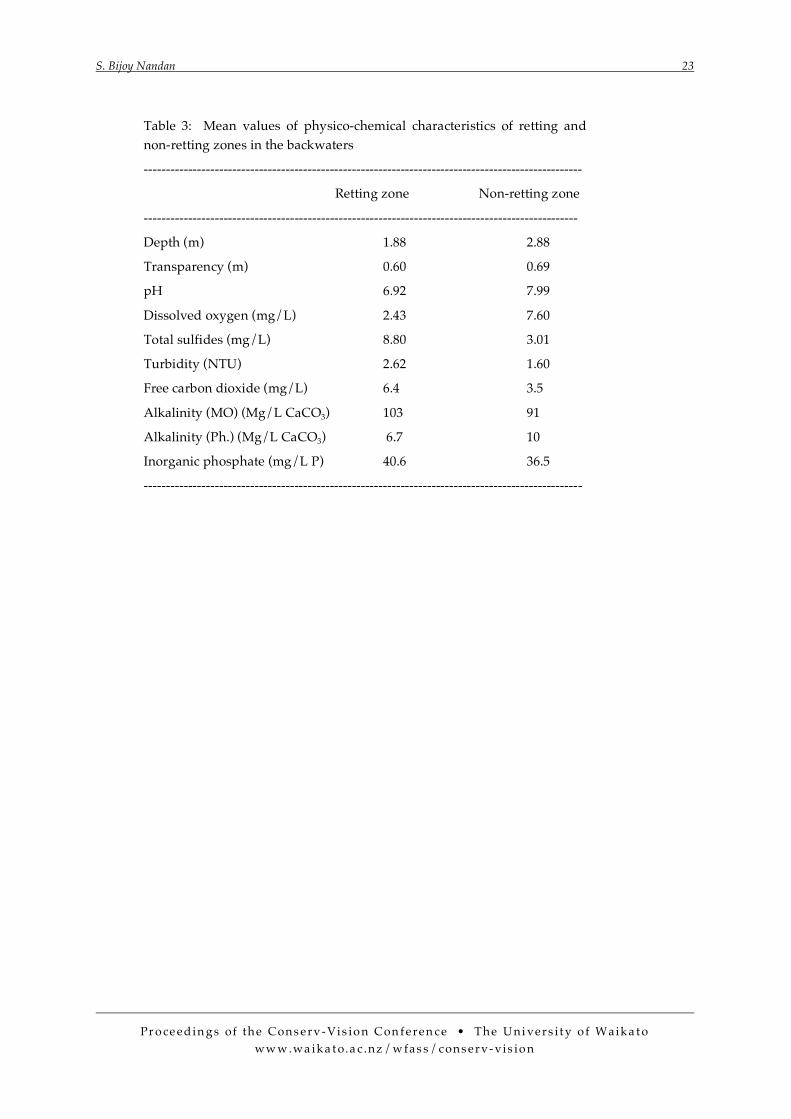
Acidic pH condition coupled with anoxia and production of high concentrations of hydrogen
sulphide were the outstanding feature, in the environmental quality of the retting zones. The higher
concentration of free CO2 in the retting zones could be attributed to the process of decomposition of
organic matter like pectin, phenol, tannin etc. leading to a rise in temperature of the medium, along
with the production of the gas. The retting zones showed rise in the concentration of sulphide
accompanied with the production of CO2, thereby establishing a positive direct relationship between
CO2 and sulphide values particularly in the retting zones. This corroborates with the studies
conduced in the retting zones of Kadinamkulam estuary by Bijoy Nandan (2004) (Table 3).
S. Bijoy Nandan 7
Pr o ce edin gs of the C ons erv - Vis io n C on f eren ce • The Uni vers i t y o f Waika t o ww w .wa ika t o.a c .nz /w fas s /cons erv - vis io n
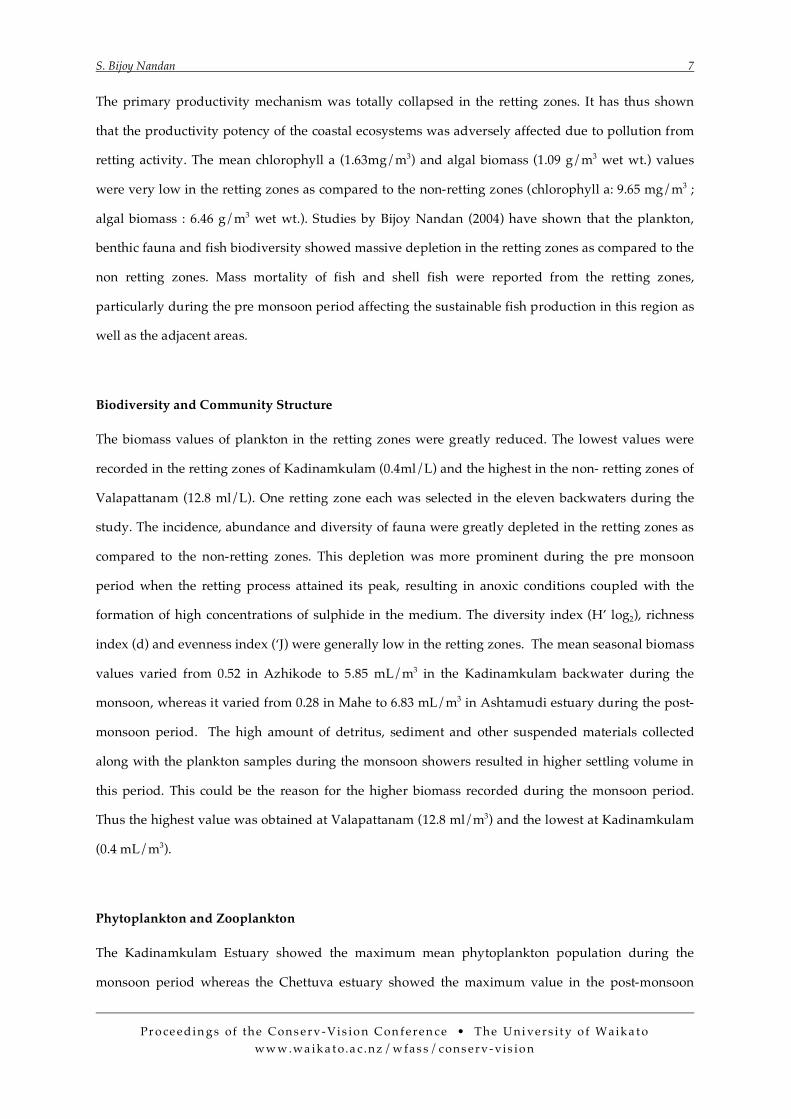
The primary productivity mechanism was totally collapsed in the retting zones. It has thus shown
that the productivity potency of the coastal ecosystems was adversely affected due to pollution from
retting activity. The mean chlorophyll a (1.63mg/m3) and algal biomass (1.09 g/m3 wet wt.) values
were very low in the retting zones as compared to the non-retting zones (chlorophyll a: 9.65 mg/m3 ;
algal biomass : 6.46 g/m3 wet wt.). Studies by Bijoy Nandan (2004) have shown that the plankton,
benthic fauna and fish biodiversity showed massive depletion in the retting zones as compared to the
non retting zones. Mass mortality of fish and shell fish were reported from the retting zones,
particularly during the pre monsoon period affecting the sustainable fish production in this region as
well as the adjacent areas.
Biodiversity and Community Structure
The biomass values of plankton in the retting zones were greatly reduced. The lowest values were
recorded in the retting zones of Kadinamkulam (0.4ml/L) and the highest in the non- retting zones of
Valapattanam (12.8 ml/L). One retting zone each was selected in the eleven backwaters during the
study. The incidence, abundance and diversity of fauna were greatly depleted in the retting zones as
compared to the non-retting zones. This depletion was more prominent during the pre monsoon
period when the retting process attained its peak, resulting in anoxic conditions coupled with the
formation of high concentrations of sulphide in the medium. The diversity index (H’ log2), richness
index (d) and evenness index (‘J) were generally low in the retting zones. The mean seasonal biomass
values varied from 0.52 in Azhikode to 5.85 mL/m3 in the Kadinamkulam backwater during the
monsoon, whereas it varied from 0.28 in Mahe to 6.83 mL/m3 in Ashtamudi estuary during the post-
monsoon period. The high amount of detritus, sediment and other suspended materials collected
along with the plankton samples during the monsoon showers resulted in higher settling volume in
this period. This could be the reason for the higher biomass recorded during the monsoon period.
Thus the highest value was obtained at Valapattanam (12.8 ml/m3) and the lowest at Kadinamkulam
(0.4 mL/m3).
Phytoplankton and Zooplankton
The Kadinamkulam Estuary showed the maximum mean phytoplankton population during the
monsoon period whereas the Chettuva estuary showed the maximum value in the post-monsoon

Current status and biodiversity modification in the coastal wetland ecosystems of India 8
Pr o ce edin gs of the C ons erv - Vis io n C on f eren ce • The Uni vers i t y o f Waika t o
ww w .wa ika t o.a c .nz /w fas s /C onse rv - Vis i on
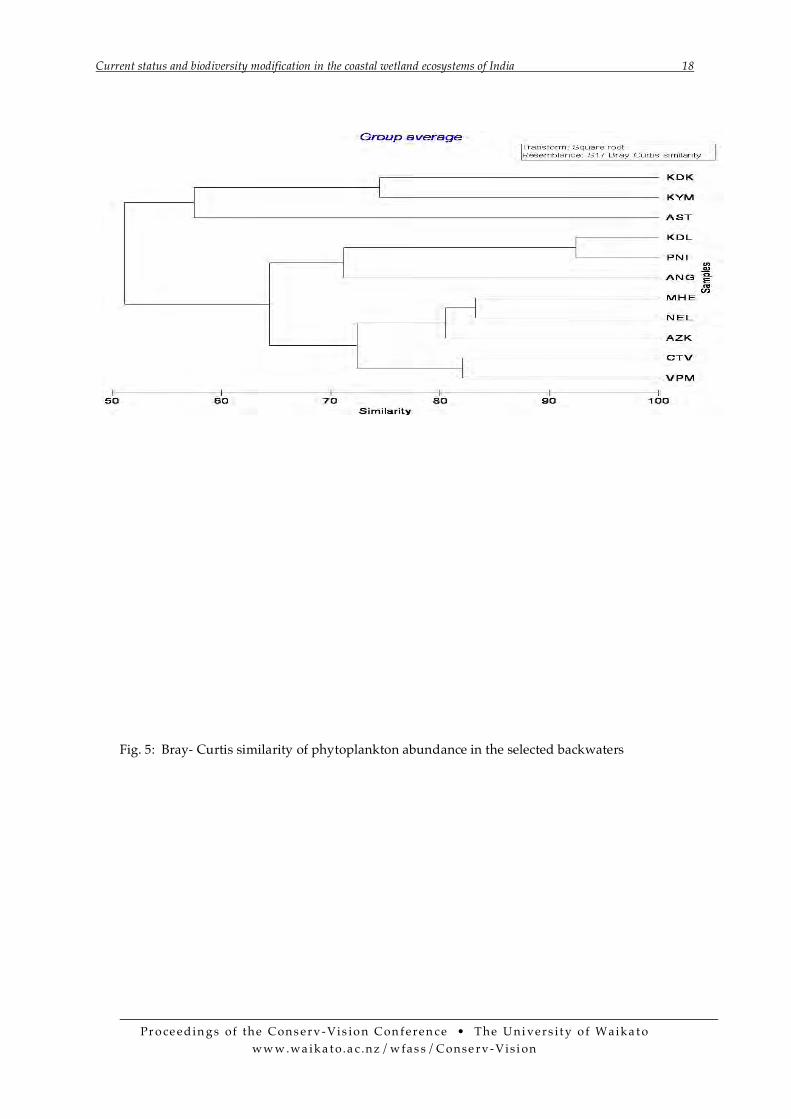
period. The similarity profile indicated that it gave three groupings having the Kadinamkulam,
Kayamkulam and Ashtamudi (southern systems) in one group the Kadalundi, Ponnani and
Anguthngu in the second group and the third having the Mahe, Neeleshwaram, Azhikode, Chettuva
and Valapattanam. The similarity in abundance of phytoplankton was highest in Kadalundi and
Ponnani water bodies (93%) and the least in Kadinamkulam and Kayamkulam backwaters (74%) (Fig.
5).
Desmidaceae had a higher representation in the northern backwaters (Neeleswaram to Azhikode)
during the monsoon season whereas this was replaced by either Bacillariophyceae or Chlorophyceae
during the post monsoon season. The southern backwaters except Ashtamudi were dominated by
Bacillariophyceae during monsoon, which got replaced by Myxophyceae during the post monsoon
season. During the pre-monsoon period Chlorophyceae, Myxophyceae and Chrysophyceae showed
higher percentage incidence in the southern backwaters whereas Bacillariophyceae showed higher
incidence in the northern backwaters. Campylodiscus sp., Staurastrum sp., Micrasterias sp., and
Spondylosium sp. contributed to the higher density of Bacillariophyceae. Chlorophyceae represented
by Microspora sp., Pediastrum sp. and Hormidium sp., contributed to the high planktonic biomass in
Chettuva and Ponnani estuaries.
Non-metric multidimensional Scaling (MDS) ordination of the abundance data showed that the
phytoplankton was generally similar in 10 of the stations except Ashtamudi backwater with the
overall similarity of the abundance as low at 20% whereas it was highly similar at about 80% between
Chettuva - Valapattanam; Azhikode -Mahe - Neeleshwaram and Ponnani- Kadalundi backwaters.
The stress factor overlying the MDS plot (0.08) was quite high indicating that the systems were
stressed (Fig.6).
A total of 100 species of phytoplankton were recorded from the backwaters. The diversity index (H’
log2) was highest in Kadalundi and lowest in Valapattanam backwater whereas richness of fauna (d)
ranged from Ashtamudi (3.57) to Valapattanam (2.09), evenness index (‘J) from Anjuthengu (0.96) to
Chettuva and Ashtamudi (0.87) and the dominance index (lamba) ranged from Anjuthengu (0.09) to
Mahe (0.15). (Fig.7) The monsoon period showed the presence of 14 groups of zooplankton whereas
the post monsoon showed 20 groups in the backwaters. But during the pre-monsoon study
S. Bijoy Nandan 9
Pr o ce edin gs of the C ons erv - Vis io n C on f eren ce • The Uni vers i t y o f Waika t o ww w .wa ika t o.a c .nz /w fas s /cons erv - vis io n
conducted in the same water bodies during 1996 showed the presence of only 12 faunal groups. The
southern backwaters (Kayamkulam to Kadinamkulam) showed higher incidence and diversity of the
different planktonic groups when compared to the backwaters in the northern segment during
monsoon as well as post-monsoon periods. During the pre-monsoon, the Kayamkulam backwater
recorded the maximum numerical density (64273 Nos./ m3) and the Mahe backwater recorded the
minimum (3350 Nos./ m3). Centropyxis sp., the protozoan showed its maximum incidence in the
Mahe and Azhikode estuaries during the monsoon period. The retting zones in the ten ecosystems
showed considerably lower planktonic abundance and diversity, coinciding with the poor water
quality condition in the corresponding areas. Azhikode recorded the highest diversity index value
(H’ log2) during the monsoon period (2.74) and the lowest in Kayamkulam during the same season.
Copepods and copepod nauplii formed an important component in all the ten systems in both the
seasons (Fig.8). In the Neeleswaram backwater, 50% of the plankton was contributed by copepods
during the post-monsoon period whereas the group formed 34.8% of the population during the
monsoon period in the Kadinamkulam estuary. Altogether, 34 species of rotifers were recorded
during the post-monsoon season alone in the ten backwaters. Brachionus species represented by
B.plicatilis, B. falcatus, B. calyciflorus showed the maximum incidence among the rotifers in the present
study.
Benthic fauna
Amphipoda, Polychaeta and Gastropoda formed the dominant groups in all the backwaters during
both the seasons. The monsoon as well as post monsoon periods showed higher numerical density in
the southern backwaters when compared to the northern segments. Nemertea (Ribbon worms), a
rare group was recorded in the Neeleswaram (0.5%) and Ashtamudi backwaters (0.4%) during the
post-monsoon period. The similarity profile indicated that it gave five groupings having as given in
Fig. 9. The similarity was highest in Neeleshwaram and Valapattanam backwaters (85%) and lowest
in Kayamkulam and Anjuthengu (68%) (Fig.10). The pre-monsoon was characterized by higher
groups of benthic fauna like Oligochaeta, Polychaeta, Amphipoda, Insecta and Mollusca in the
northern backwaters when compared to the backwaters in the southern side. The MDS analysis done
with depth as a factor showed that abundance of fauna was similar in ten of the backwaters except
Kadinamkulam backwater. The MDS also showed that the overall similarity in the abundance of
benthos was low at 20% whereas it was similar at about 80% within each of the stations. (Fig.11).

Current status and biodiversity modification in the coastal wetland ecosystems of India 10
Pr o ce edin gs of the C ons erv - Vis io n C on f eren ce • The Uni vers i t y o f Waika t o
ww w .wa ika t o.a c .nz /w fas s /C onse rv - Vis i on
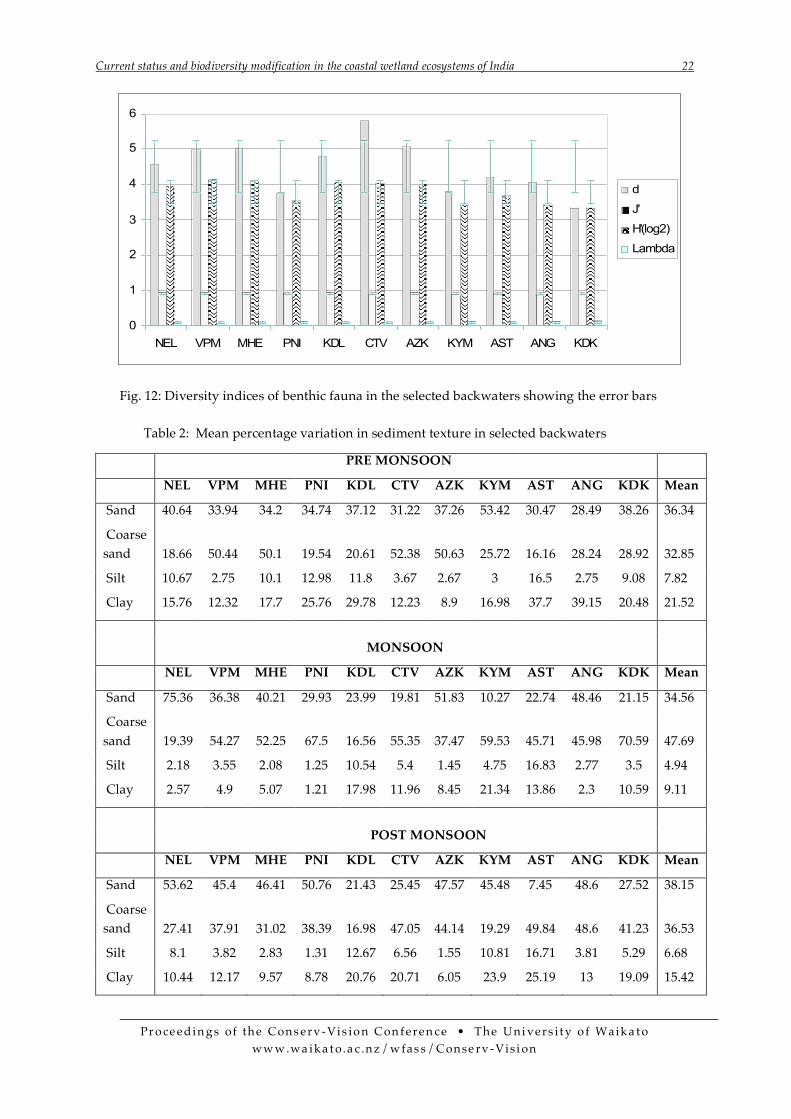
The diversity index (H’ log2) was highest in Valapattanam (4.14) and lowest in Kadinamkulam
backwater (3.32) whereas richness of fauna (d) ranged from Chettuva (5.81) to Kadinamkulam (3.33),
evenness index (‘J) from Valapattanam (0.93) to Anjuthengu (0.83) and the dominance index
(lambda’) ranged from Kadinamkulam (0.124) to Valapattanam (0.064). (Fig. 12).
As observed above in zooplankton, the benthic fauna also showed considerable depletion in the
retting zones of the present study. Thirteen groups formed the benthic population during the
monsoon period whereas seventeen groups in the post-monsoon. Insect fauna showed higher
incidence and diversity particularly in the backwaters in the northern side during the post-monsoon
period. The retting zones in the backwaters showed higher dominance of Chironomus larvae and
other insects.
The benthic forms were present at all seasons showing its maximum mean density (39 nos./m2)
during the monsoon. The high organic carbon content in combination with the higher percentage of
sandy clay during the post-monsoon and pre-monsoon periods was a positive element in maintaining
a high density of the benthic organisms. The proboscis worms or the nemertines belonging to the
phylum Nimertinea was one of the rare groups of benthic fauna recorded during the present
investigation. This is the first record of this worm from the inland waters of this geographic region.
Fish Production Potential
Ninety four species of fish and shellfish were identified in the fishery of the backwaters. Of the 94
species listed, 63 have been recorded from the marine waters by different workers, thereby
establishing a close relationship of the backwater fishery with that of the marine system. Nineteen of
them used to be predominantly recorded from the rivers and these take a sojourn to the backwater
during the monsoon or immediately after the monsoon when the salinity remained very low in the
upper reaches. Definite zone marking were observed in the distribution of these species in the
backwater where Puntius filamentosus, P. sarana, Labeo dussumieri, Mystus malabaricus, Anabas
testudineus, Channa spp., Oreochromis mossambicus, and Mastacebelus armatus could be cited as
examples which inhabited the estuarine regions. Whereas the purely marine forms, Rhinobatus halavi,

S. Bijoy Nandan 11
Pr o ce edin gs of the C ons erv - Vis io n C on f eren ce • The Uni vers i t y o f Waika t o ww w .wa ika t o.a c .nz /w fas s /cons erv - vis io n
Congressox talaboidenes, Lobotes surinamensis, Acanthurus strigosus, Eleotris fusca, Lepturocanthus savala,
Platax orbicularis, etc were recorded from the backwaters during the summer season in stray numbers.
Etroplus suratensis, Penaeus indicus and the Metapenaeus monoceros represented 2.0-13.9%, 2.5-29.6%
and 1.0-8.2% in the total catches (Table 4). The total landings from different backwaters varied from
96.8t from Mahe to 2899t from the Ashtamudi. The average yield/ha varied from 410 kg at
Anchuthengu to 2747.3 t from Azhikode estuary. The Catch per Unit Effort exhibited wide variation
from gear to gear in the eleven backwaters. The high CPUE for the Stake Net (7.5 kg -18.1kg) was
largely offset by the limited days of operation and the low market value fish forming the bulk of the
catch. The Seine net also demonstrated a high CPUE (11.3 kg -74.7 kg), but the catch composition was
composed largely of small fishes, young fishes and the low priced M. dobsonii.
From the 16, 472 ha backwaters covered under the investigation, the average yield per hectare was to
the tune of 651kg/year. A total of 9, 667 tones was the annual yield from the 11 backwaters during
the present study. Sugunan and Sinha (2001) had earlier reported an annual catch of 14, 000 -17, 000 t
from a total area of 45,000 ha of backwaters in the State. Comparing this report with the present
study, it could be inferred that the fish production in the backwaters investigated are quite
encouraging. An estimation of the price share of fish also indicated that on an average, the fishermen
received only 48-73% of the market price at the landing site through auction. The study clearly
indicates the indisputable contribution of the backwaters to the inland fish production of the region
both for internal consumption and for export. While the shellfish fishery largely support the export
clientele (except M. dobsonii), the fishes serve the local populace.
Conclusions from the Study
1. The fishing effort should not be allowed to increase further and has to be restricted at least to the
current level until further recommendations are made based on population dynamic
investigations conducted on major fish/shellfish species of the backwater systems.
2. There is an urgent need to restrict the mesh size of the stake net, Chinese dip net and the drag net
to ensure that sufficient fish reach the adult size classes. Though a minimum mesh size of 25 mm
(stretched) is advisable, considering that M. dobsonii is also to be exploited, the minimum mesh
size may be restricted to 18mm.

Current status and biodiversity modification in the coastal wetland ecosystems of India 12
Pr o ce edin gs of the C ons erv - Vis io n C on f eren ce • The Uni vers i t y o f Waika t o
ww w .wa ika t o.a c .nz /w fas s /C onse rv - Vis i on
3. It has been observed that several units of purse seine are diverted to the backwaters during the
closed season for marine fishing. This should be prohibited.
4. Several of the stake nets are being deployed during the tide incursion to the back- waters against
the norms. The enforcement machinery should be strengthened to ensure that the stake nets are
deployed only during the receding phase.
5. A considerable area of the backwaters has already been lost due to reclamation for agricultural,
mining, urban area development and similar activities. Further encroachment/reclamation
should be strictly regulated.
6. Several stretches of backwaters are subjected to extreme organic/industrial pollution. Hence
pollution abatement measures should be given top priority. Technology for alternate coconut
husk retting practice should be developed that do require the use of backwaters.
7. Reclaimed paddy lands such as at Kuttanad, Kattampally, etc should be utilized to raise an
additional crop of fish during the fallow period.
Acknowledgements
The author is thankful to the Director, Central Inland Fisheries Research Institute (CIFRI) for
providing the facilities and also to the staff for giving unstinted support in undertaking the work.
References
Anon, 2001. Ecology and Fisheries Investigation in Vembanad Lake, CIFRI Bull. No.107, ISSN 0970-616 X, P. 38.
APHA 1992, American Public Health Association, Standard Methods for the examination of analysis of water and waste-water, 19th edition.
Bijoy Nandan. S 2004. Studies on the Impact of retting on Aquatic Ecosystems, ISBN 81-901939-0-2, Limnological Association of Kerala, India, 120 p,
Cochran, W.G. 1977. Sampling Techniques. Second edition Third Wiley Eastern Reprint, John Wiley and Sons, Inc., New York, London, Sydney and Toronto.
Desai, B.N., S.N. Gajbhiye, M. Jiyalal Ram and Vijayalakshmi R. Nair, 1983. Comparative account on zooplankton in polluted and unpolluted estuaries of Gujarat, Mahasagar, 16 (3), 281-291.
Devassy, V.P. and P.M.A. Bhattathiri, 1974. Phytoplankton ecology of the Cochin backwater, Indian J. Mar. Sci., 3: 46-50.
Davis C. C. 1995. The Marine and Fresh water plankton, Michigan State University Press.

S. Bijoy Nandan 13
Pr o ce edin gs of the C ons erv - Vis io n C on f eren ce • The Uni vers i t y o f Waika t o ww w .wa ika t o.a c .nz /w fas s /cons erv - vis io n
Gopalan, U.K., T. Doyil, P. Vengayil, P. Udayavarma and M. Krishnankutty, 1983. The Shrinking backwaters of Kerala, J. Mar. Biol. Ass. India, 25: 131-141.
Gopalan, U.K., Meenakshikunjamma P.P. and Vengayil D.T. 1987. Macro benthos of Vembanad estuary in relation to the deposition of degraded water fern Salvinia and other macrophytes, Proc. Natn. Sem. Estuarine Management, 410-414.
Gupta R. A., Mandal S. K. and Paul S. 1997. Methods of collection of Inland Fisheries Statistics in India, Part –1, survey methodology guidelines Bulletin No.77, CIFRI Publication. p.64.
Jhingran. A.G. 1988. Fish and Fisheries of India Revised and Enlarged Second Edition, Hindustan Publishing Corporation, Delhi.
Kurian, C.V., R. Damodaran and A. Antony, 1975. Bottom fauna of the Vembanad lake. Bull. Dept. Mar. Sci. Univ. Cochin, VII: 987-994.
Kurup B.M. and Samuel C.T. 1987. Ecology and fish distribution pattern of a tropical estuary. Proc. Natn. Sem. Estuarine Management, 339-349.
Sarala Devi, K., P. Venugopal, K.N. Remani, S. Lalitha and R.V. Unnithan, 1979. Hydrographic features and water quality of Cochin backwaters in relation to Industrial pollution, Indian J. Mar. Sci., 8 (3): 123-200.
Sarala Devi, K. P. Venugopal, K.N. Remani, Dominic Zacharias and R.V. Unnithan, 1983. Nutrients in some estuaries of Kerala, Mahasagar, 16 (2): 161-174.
Sarala Devi K., Jayalakshmy K.V. and Venugopal P. 1991. Communities and coexistence of benthos in northern limb of Cochin backwaters, Indian J. Mar. Sci., 20 : 249-254.
Sugunan, V.V. and Sinha .M. 2001 Sustainable capture and culture based fisheries in freshwaters of India, In: Sustainable Indian Fisheries, Pandian (ed.) P. 43-70. National Academy of Agricultural Sciences, New Delhi.
Margalef R (1968). Perspectives in ecological Theory. University of Chicago press, Chicago. Murugan, T., O. Divakaran, N.B. Nair and K.G. Padmanabhan, 1980. Distribution and seasonal
variation of the benthic fauna of the Veli lake, Southwest coast of India, Indian J. Mar. Sci., 9: 184-188.
Strickland J. D. H and Parsons T. R 1972. A practical handbook of sea water analysis, Bulletin No.167, Fisheries Research Board of Canada.
Talwar P. K. and Jhingran A. G. 1991. Inland Fishes, Vol.1 & 2 Oxford & IBH Publishing Co. Pvt. Ltd. Unnithan, R.V., M. Vijayan and K.N. Remani, 1975. Organic pollution in Cochin Backwaters, Indian
J. Mar. Sci. 4 (1): 39-42. Ward, H. B and Whipple G. C, 1959. Freshwater Biology, Second Edition, John Wiley and sons, Inc.
p.1248.

Current status and biodiversity modification in the coastal wetland ecosystems of India 14
Pr o ce edin gs of the C ons erv - Vis io n C on f eren ce • The Uni vers i t y o f Waika t o
ww w .wa ika t o.a c .nz /w fas s /C onse rv - Vis i on

S. Bijoy Nandan 15
Pr o ce edin gs of the C ons erv - Vis io n C on f eren ce • The Uni vers i t y o f Waika t o ww w .wa ika t o.a c .nz /w fas s /cons erv - vis io n
Fig 2: Mean water quality variations in selected backwaters during pre-monsoon period.
0
2
4
6
8
10
K D K A N G AST K Y M A Z K C TV K D L M H E V P M
Depth (m)
pH
Dissolved O2 (mg/L)
Sulphides (mg/L)
0
2
4
6
8
10
Transparency (m)
Turbidity (NTU)
0
5
10
15
20
Ph. Alkalinity (mg/L)
Free CO2 (mg/L)
0
40
80
120
160
MOA Alkalinity
(mg/L)

Current status and biodiversity modification in the coastal wetland ecosystems of India 16
Pr o ce edin gs of the C ons erv - Vis io n C on f eren ce • The Uni vers i t y o f Waika t o
ww w .wa ika t o.a c .nz /w fas s /C onse rv - Vis i on
Fig. 3: Mean water quality variation in selected backwaters during the monsoon period
0
2
4
6
8
10
Depth (m)
pH
Dissolved
O2 (mg/L)
Sulphides
(mg/L)
0
100
200
300TSS (mg/l)
0
15
30
45
60
75
M.O. Alkalinity (mg/L) Ph. Alkalinity (mg/L)
0
1
2
3
4
5
6
7
KDK ANG AST KYM AZK CTV KDL PNI MHE VPM NEL
Free CO2 (mg/L) Transparency (m)

S. Bijoy Nandan 17
Pr o ce edin gs of the C ons erv - Vis io n C on f eren ce • The Uni vers i t y o f Waika t o ww w .wa ika t o.a c .nz /w fas s /cons erv - vis io n
Fig. 4: Mean water quality variation in selected backwaters during the post monsoon period
0
2
4
6
8
Depth (m) pHDissolved O2 (mg/L) Sulphides (mg/L)
0
50
100
150
200
250
300
TSS (mg/l) M.O. Alkalinity (mg/L) Ph. Alkalinity (mg/L)
0
1
2
3
4
5
6
7
KDK ANG AST KYM AZK CTV KDL PNI MHE VPM NEL
Free CO2 (mg/L)
Transparency (m)
Stations
Current status and biodiversity modification in the coastal wetland ecosystems of India 18
Pr o ce edin gs of the C ons erv - Vis io n C on f eren ce • The Uni vers i t y o f Waika t o
ww w .wa ika t o.a c .nz /w fas s /C onse rv - Vis i on
Fig. 5: Bray- Curtis similarity of phytoplankton abundance in the selected backwaters

S. Bijoy Nandan 19
Pr o ce edin gs of the C ons erv - Vis io n C on f eren ce • The Uni vers i t y o f Waika t o ww w .wa ika t o.a c .nz /w fas s /cons erv - vis io n
Fig.6: Multi dimensional plot (MDS) of Phytoplankton in the selected backwaters
Fig. 7: Diversity indices of Phytoplankton in selected backwaters showing the error bars
0
1
2
3
4
NEL VPM MHE PNI KDL CTV AZK KYM AST ANG KDK
d
J'
H'(log2)
Lambda

Current status and biodiversity modification in the coastal wetland ecosystems of India 20
Pr o ce edin gs of the C ons erv - Vis io n C on f eren ce • The Uni vers i t y o f Waika t o
ww w .wa ika t o.a c .nz /w fas s /C onse rv - Vis i on
Fig. 8: Seasonal mean distribution (%) of selected zooplankton in the backwaters
Fig. 9: Seasonal mean distribution (%) of selected benthic fauna in the backwaters
0
15
30
45
60
75
90
105
NEL VPM MHE PNI CTV AZK KYM AST ANG KDK
Rotifera Copepoda Copepod nauplii
Pre monsoon
0
5
10
15
20
25
30
35
40
NEL VPM MHE PNI CTV AZK KYM AST ANG KDK
Rotifera Copepoda Copepod nauplii
Monsoon
0
15
30
45
60
75
90
105
NEL VPM MHE PNI CTV AZK KYM AST ANG KDK
Rotifera Copepoda
Copepod nauplii
Post monsoon
0
15
30
45
60
75
90
105
NEL VPM MHE PNI CTV AZK KYM AST ANG KDK
Amphipoda Polychaeta Gastropoda Bivalvia
Pre monsoon
0
15
30
45
60
75
90
105
NEL VPM MHE PNI CTV AZK KYM AST ANG KDK
Polychaeta Amphipoda Gastropoda Bivalvia
Monsoon
0
10
20
30
40
50
60
70
NEL VPM MHE PNI CTV AZK KYM AST ANG KDK
Polychaeta Amphipoda Gastropoda Bivalvia
Post monsoon

S. Bijoy Nandan 21
Pr o ce edin gs of the C ons erv - Vis io n C on f eren ce • The Uni vers i t y o f Waika t o ww w .wa ika t o.a c .nz /w fas s /cons erv - vis io n
Fig. 10: Bray- Curtis similarity of benthic faunal abundance in the selected backwaters
Fig. 11: MDS plot of total benthic fauna in the selected backwaters
Current status and biodiversity modification in the coastal wetland ecosystems of India 22
Pr o ce edin gs of the C ons erv - Vis io n C on f eren ce • The Uni vers i t y o f Waika t o
ww w .wa ika t o.a c .nz /w fas s /C onse rv - Vis i on
Fig. 12: Diversity indices of benthic fauna in the selected backwaters showing the error bars
Table 2: Mean percentage variation in sediment texture in selected backwaters
PRE MONSOON
NEL VPM MHE PNI KDL CTV AZK KYM AST ANG KDK Mean
Sand 40.64 33.94 34.2 34.74 37.12 31.22 37.26 53.42 30.47 28.49 38.26 36.34
Coarse sand 18.66 50.44 50.1 19.54 20.61 52.38 50.63 25.72 16.16 28.24 28.92 32.85
Silt 10.67 2.75 10.1 12.98 11.8 3.67 2.67 3 16.5 2.75 9.08 7.82
Clay 15.76 12.32 17.7 25.76 29.78 12.23 8.9 16.98 37.7 39.15 20.48 21.52
MONSOON
NEL VPM MHE PNI KDL CTV AZK KYM AST ANG KDK Mean
Sand 75.36 36.38 40.21 29.93 23.99 19.81 51.83 10.27 22.74 48.46 21.15 34.56
Coarse sand 19.39 54.27 52.25 67.5 16.56 55.35 37.47 59.53 45.71 45.98 70.59 47.69
Silt 2.18 3.55 2.08 1.25 10.54 5.4 1.45 4.75 16.83 2.77 3.5 4.94
Clay 2.57 4.9 5.07 1.21 17.98 11.96 8.45 21.34 13.86 2.3 10.59 9.11
POST MONSOON
NEL VPM MHE PNI KDL CTV AZK KYM AST ANG KDK Mean
Sand 53.62 45.4 46.41 50.76 21.43 25.45 47.57 45.48 7.45 48.6 27.52 38.15
Coarse sand 27.41 37.91 31.02 38.39 16.98 47.05 44.14 19.29 49.84 48.6 41.23 36.53
Silt 8.1 3.82 2.83 1.31 12.67 6.56 1.55 10.81 16.71 3.81 5.29 6.68
Clay 10.44 12.17 9.57 8.78 20.76 20.71 6.05 23.9 25.19 13 19.09 15.42
0
1
2
3
4
5
6
NEL VPM MHE PNI KDL CTV AZK KYM AST ANG KDK
d
J'
H'(log2)
Lambda
S. Bijoy Nandan 23
Pr o ce edin gs of the C ons erv - Vis io n C on f eren ce • The Uni vers i t y o f Waika t o ww w .wa ika t o.a c .nz /w fas s /cons erv - vis io n
Table 3: Mean values of physico-chemical characteristics of retting and non-retting zones in the backwaters
---------------------------------------------------------------------------------------------------
Retting zone Non-retting zone
--------------------------------------------------------------------------------------------------
Depth (m) 1.88 2.88
Transparency (m) 0.60 0.69
pH 6.92 7.99
Dissolved oxygen (mg/L) 2.43 7.60
Total sulfides (mg/L) 8.80 3.01
Turbidity (NTU) 2.62 1.60
Free carbon dioxide (mg/L) 6.4 3.5
Alkalinity (MO) (Mg/L CaCO3) 103 91
Alkalinity (Ph.) (Mg/L CaCO3) 6.7 10
Inorganic phosphate (mg/L P) 40.6 36.5
---------------------------------------------------------------------------------------------------

Current status and biodiversity modification in the coastal wetland ecosystems of India 24
Pr o ce edin gs of the C ons erv - Vis io n C on f eren ce • The Uni vers i t y o f Waika t o
ww w .wa ika t o.a c .nz /w fas s /C onse rv - Vis i on
Table 4: Percentage contribution by various species/groups to the total landings from selected backwaters
--------------------------------------------------------------------------------------------------------
Species/ Groups Contribution (%) to total landings
Range Mean% of Pooled data
----------------------------------------------------------------------------------------------
Acanthurus spp. 0.0-4.9 0.47
Gerres spp. 1.0-6.1 2.72
Platycephalus sp. 0.1-3.1 1.08
Leiognathus spp. 0.3-5.9 1.08
Etroplus spp. 2.0-13.9 5.68
Megalops sp. 0.0-5.8 0.60
Tachysurus spp. 1.9-10.4 3.20
Ambassis sp. 0.0-8.6 2.92
O. mossambicus 0.0-14.7 0.94
Stolephorus sp. 0.0-3.3 1.57
Sillago sihama 0.0-3.8 0.81
Caranx spp. 1.0-5.2 1.29
Lutjanus spp. 1.1-11.4 1.50
Mullets 1.5-16.5 5.07
Flat fishes 0.1-3.6 1.21
Half beaks 0.1-2.5 0.26
Others 6.4-20.0 10.66
Fishes total 26.9-75.0 41.20
----------------------------------------------------------------------------------------
Metapenaeus dobsonii 9.2-53.4 33.06
M. monoceros 1.0-8.2 6.53
Penaeus indicus 2.5-29.6 9.19
P. monodon 0.0-9.0 1.22
Other penaeids 0.0-2.9 0.64
Non-penaeids 0.0-1.3 0.46
Prawns total 13.9-70.5 53.1
Crabs 2.6-11.1 5.75
Total yield (kg/ha.) 246-2747 630.1
---------------------------------------------------------------------------------------
Recommended