Mike McNamara Investor Day – May 2012
1

2
Executive Overview
• Extensive global footprint, manufacturing technologies and
services
• Growth business with structurally higher growth rates than
the GDP and the electronics industry
• Business transformation leading to optimized portfolio
generating less volatility and higher margins
• Sustainable business model generating strong free cash
flow and >20% ROIC
• Expanding operating margin to 3.5% this year
• Exceptionally well positioned for eco-system shifts
3
Flextronics Manufacturing
Austin, Dallas, Longview & Houston, TX
Milpitas, CA Asheville, Charlotte, Creedmoor, NC
Boeblingen & Paderborn, Germany
Dongguan, Ganzhou, Gushu, Huangtian, Shenzhen, Xixiang
& Zhuhai, China
Althofen, Austria
Kallang & Joo Koon Singapore
Columbia, SC
Northfield, MN
Aguascalientes, MX
Guadalajara, MX
Nogales, MX
Tijuana, MX Ramos Arizpe, MX
Manaus, Brazil
Sao Paulo, Brazil
Sorocaba, Brazil
Sarvar, Tab & Zala, Hungary Cork, Ireland
Arad, Migdal Haemek, Ofakim & Yavne, Israel
Tczew, Poland
Timisoara, Romania
Karlskrona, Sweden
Beregovo & Mukachevo, Ukraine Nanjing, Malu/Shanghai
& Suzhou, China
Chennai, India
Batam, Indonesia
Ibaraki, Japan
Bukit, Penang, PTP & Senai, Malaysia
Chengdu, China Juarez, MX
Treviso, Italy Valencia, CA
>100 Locations │ 25 Million Square Feet │ 200,000 Employees
3

4
Flextronics Global Services and Software
Austin & Laredo, TX
Milpitas, CA Raleigh, NC
Hong Kong & Shenzhen, China
Changi, Singapore
Memphis, TN
Louisville, KY
Guadalajara, MX
Sorocaba, Brazil
Budapest & Pecs, Hungary
Cork & Limerick, Ireland
Lodz, Poland
Dubai, UAE
Manchester & Swindon, UK
Istanbul, Turkey Shanghai, China
Bangalore & Chennai, India
Koriyama, Japan
Senai, Malaysia
Juarez, MX Milan, Italy
Toronto, Canada
Venray, Netherlands Pardubice,
Czech Republic
Delhi, India
Mumbai, India
>25 Locations │ 7 Million Square Feet │ 11,000 Employees
4
5
Flextronics Design Engineering
Austin, & Irving, TX
Milpitas, CA
Ottawa & Toronto, Canada
Frickenhausen, Ostbeven & Tuebingen,
Germany
Hong Kong & Shenzhen, China
Althofen, Austria
Singapore
Atlanta, GA
Detroit, MI
Guadalajara, MX
Brno, Czech Republic
Karlskrona, Sweden
Shanghai, China
Bukit & Penang, Malaysia
Monza & Treviso, Italy
Beijing, China
Taipei, Taiwan
26 Design Centers │ 2000+ Design Engineers

6
Broad Base of Manufacturing Technologies and Services
Total FY13E Revenue ~ $5B
Many ways to create competitive differentiation
• PCB
• Flexible Circuits
• Rigid/Flex Circuits
• Power Solutions
• Metal Fabrication
• Precision Machining
• Plastics
• Cables
• Advanced Displays
• Global Services
• Electronic Materials
• Advanced Manufacturing Services

7
Extensive Relationships with our Customers
Top Ten
Customers PCB Power Services PCBA
System
Integration Countries
Customer
HQ
A X X X X X 4 North America
B X X X 5 North America
C X X X X 5 China
D X X X 5 China
E X X X X X 16 North America
F X X X X X 9 North America
G X X X X 8 Europe
H X X X X X 6 North America
I X X X X 9 Europe
J X X X 4 North America
Sophisticated worldwide management system required to
support international OEMs
8
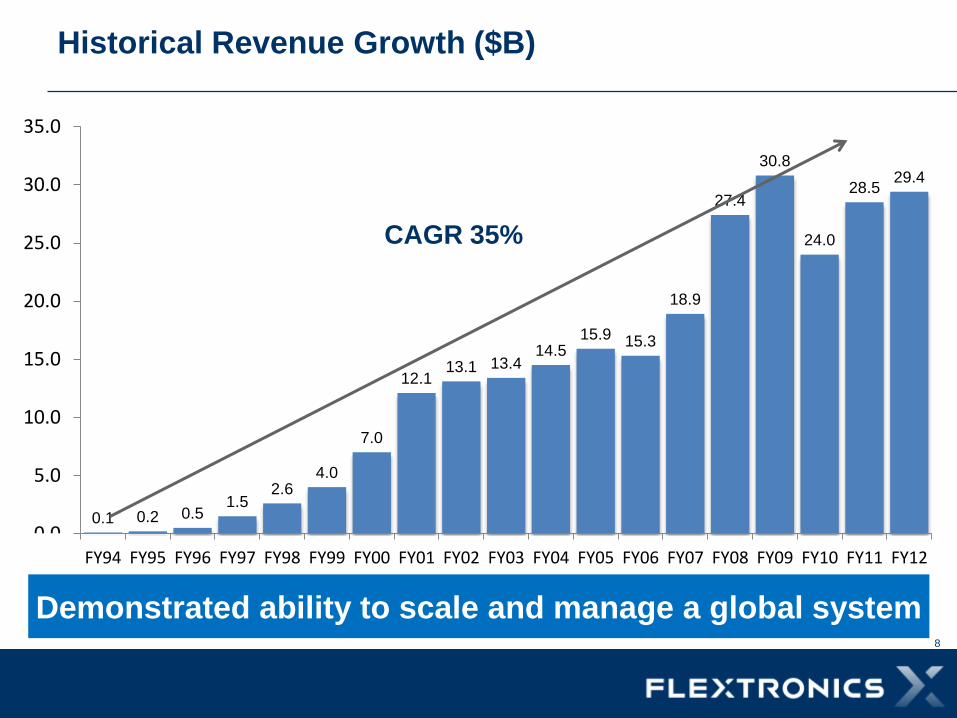
Historical Revenue Growth ($B)
Demonstrated ability to scale and manage a global system
0.1 0.2 0.5 1.5
2.6 4.0
7.0
12.1 13.1 13.4
14.5 15.9 15.3
18.9
27.4
30.8
24.0
28.5 29.4
0.0
5.0
10.0
15.0
20.0
25.0
30.0
35.0
FY94 FY95 FY96 FY97 FY98 FY99 FY00 FY01 FY02 FY03 FY04 FY05 FY06 FY07 FY08 FY09 FY10 FY11 FY12
CAGR 35%

9
GDP, Electronics and EMS Growth Rates Last 10 Years
• Potential size is limitless
• Large outsourcing deals
continue
• New markets drive new
outsourcing revenue
• Economics of
outsourcing are
compelling
GDP
3.8%
Electronics
6.0%
EMS
8.6%
2%
4%
8%
6%
10%
A structurally higher growth Industry than the
GDP or electronics
Source: GDP- IMF, EMS – IDC, Electronics - Prismark

10
Our Four Primary Business Groups
High Reliability Solutions Medical, Automotive, Aerospace & Defense
Integrated Network Solutions Telecom, Networking and Server &
Storage
Industrial & Emerging Industries Energy Management, Application & Lifestyle,
Renewable Energy, Equipment & Automation
High Velocity Solutions Consumer, Mobile, Computing, Internet
Access Products

11
28%
11%
3%
58% 39%
14% 8%
39% ~45%
~15% ~10%
~30%
Our Portfolio Transformation
Actively manage the portfolio to adapt to market and
eco-system shifts and expand margins
FY07 FY12 FY13E
Revenue $18.9B Revenue $29.4B Revenue $26-$27B
High Velocity Integrated Network Industrial & Emerging High Reliability
12
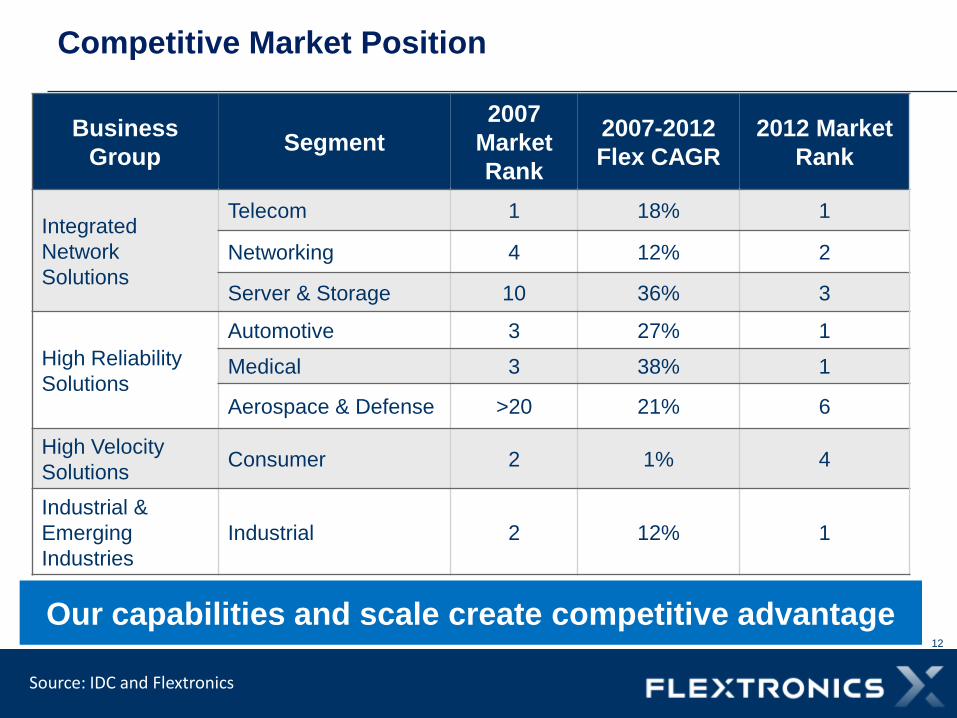
Business
Group Segment
2007
Market
Rank
2007-2012
Flex CAGR
2012 Market
Rank
Integrated
Network
Solutions
Telecom 1 18% 1
Networking 4 12% 2
Server & Storage 10 36% 3
High Reliability
Solutions
Automotive 3 27% 1
Medical 3 38% 1
Aerospace & Defense >20 21% 6
High Velocity
Solutions Consumer 2 1% 4
Industrial &
Emerging
Industries
Industrial 2 12% 1
Source: IDC and Flextronics
Our capabilities and scale create competitive advantage
Competitive Market Position
13
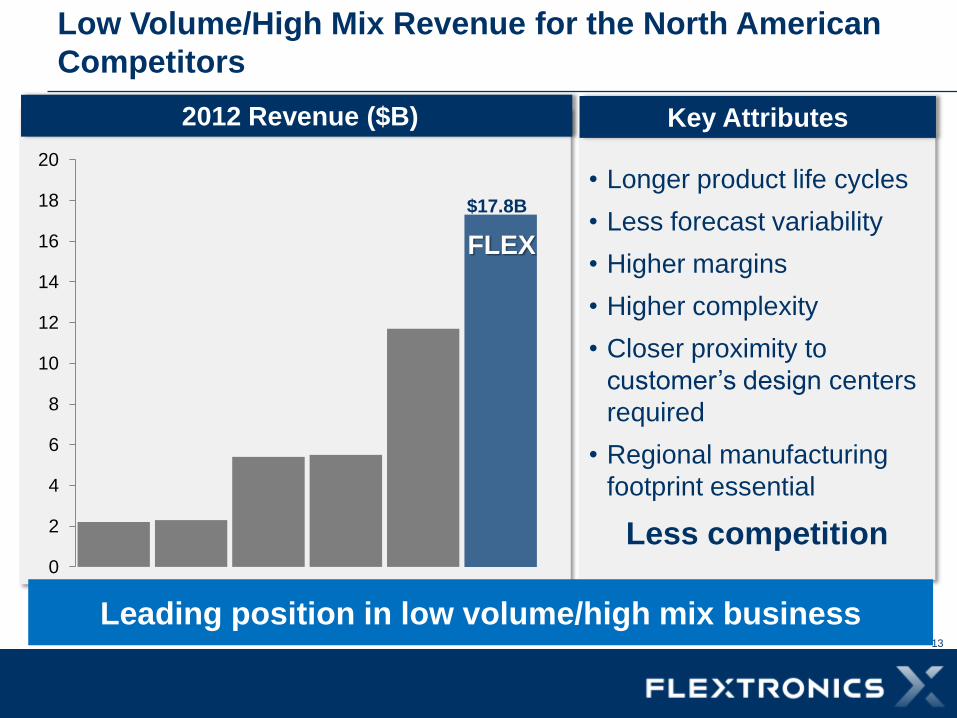
• Longer product life cycles
• Less forecast variability
• Higher margins
• Higher complexity
• Closer proximity to
customer’s design centers
required
• Regional manufacturing
footprint essential
Less competition
2012 Revenue ($B) Key Attributes
Leading position in low volume/high mix business
Low Volume/High Mix Revenue for the North American
Competitors
0
2
4
6
8
10
12
14
16
18
20
FLEX
$17.8B

14
Low Volume/High Mix Business Revenue ($M)
Steady, predictable growth
-
5,000
10,000
15,000
20,000
25,000
FY10 FY11 FY12 FY'13E*
CAGR 10.4%
FY13E

15
0
200
400
600
800
1000
1200
FY07 FY08 FY09 FY10 FY11 FY12 FY13E
Flextronics Power
• 4th largest power supply
company
• Innovative patented
technology for high
efficiency servers,
chargers and adapters
• 3 dedicated manufacturing
sites – final factory closure
complete in the September
quarter
• Expect margin expansion
in the second half of FY13
Revenue ($M) Differentiators
77% CAGR

16
Multek
• Invested in complex and
mobile PCBs, and flex/rigid
flex circuits
• Highly diversified:
- No Customer > 10%
- Top 50% of revenue is
spread across 15
customers
• Strong growth forecasted this
year based on state of the art
manufacturing facilities
• Expect margin expansion in
the second half of FY13
Revenue ($M) Differentiators
0
200
400
600
800
1000
1200
FY07 FY08 FY09 FY10 FY11 FY12 FY13E
6.5% CAGR

17
Flextronics Power Revenue ($M) Multek Revenue ($M)
These are very valuable assets that are not reflected in
our stock price today
0
200
400
600
800
1000
1200
FY07 FY08 FY09 FY10 FY11 FY12 FY13E
77% CAGR
0
200
400
600
800
1000
1200
FY07 FY08 FY09 FY10 FY11 FY12 FY13E
6.5% CAGR

18
GAAP EPS
18
Quality of earnings has become exceptionally high
FY08 – Restructuring and Solectron Integration
FY09 – Goodwill impairment
FY10 - Restructuring, Aircent Investment and N/R Impairment
FY13E - GAAP Adjusted Consensus
-$0.31
-$0.16
-$0.67
$0.60
$0.12
$0.47
-$0.92
-$7.46
$0.03
$0.77 $0.70
$0.89
-$2.0
-$1.0
$0.0
$1.0
$2.0
FY02 FY03 FY04 FY05 FY06 FY07 FY08 FY09 FY10 FY11 FY12 FY13E -$8.0
FY08 – Solectron Integration
FY09 – Goodwill impairment
FY10 - Restructuring and investment impairment
FY13E - GAAP Adjusted Consensus
GAAP EPS
19
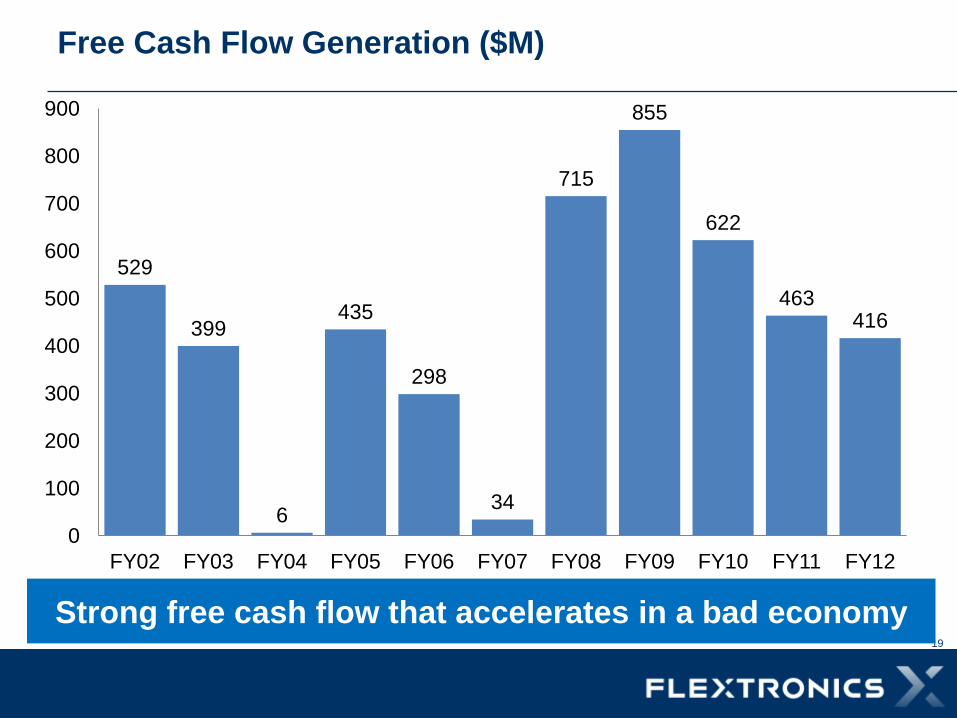
Free Cash Flow Generation ($M)
Strong free cash flow that accelerates in a bad economy
529
399
6
435
298
34
715
855
622
463 416
0
100
200
300
400
500
600
700
800
900
FY02 FY03 FY04 FY05 FY06 FY07 FY08 FY09 FY10 FY11 FY12

20
Key Ecosystem
Shifts
Flex Competitive Position
and Response
Large scale manufacturing sites in Malaysia, India, Indonesia,
Mexico, Brazil, Ukraine and Eastern Europe, employing more
than 75,000 people
Rising Manufacturing
Costs in China
Increasing Regulation
Driving Regional
Manufacturing
Broadest footprint outside of China and greater than any North
America or Taiwanese competitor
Product Convergence
Requiring Multiple
Technologies
Manufacture the largest and most diverse set of products in the
world
End to End Supply
Chain Services
Innovative development of end-to-end supply chain software
tools for customer intelligence leveraging analytics
Mobility and the Cloud Broad expertise in products, design engineering and product
technologies for mobile, server, storage, telecom and networking
Outstanding competitive position for the future
21
Conclusion
• Well positioned with scale, capabilities and cost
structure to win
• Operating a product portfolio with longer product life
cycles, less forecast variability and higher margins
• Generating strong free cash flow
• Fundamentally structured to achieve 3.5% operating
margin this fiscal year
• Well positioned for eco-system shifts
Recommended