
Covered Bond Investor Presentation
October 2017

Page 1
Additional Colours NOTE: Eurobank is always red (Chart 10)
Chart 7
Chart 8
Chart 9
Chart 10
Colour 11
Colour 12
Colour 13
Chart 14
Body Text in Calibri
Background
Heading Text, 1st Level Fill
Message Box, Table Highlights
Chart 1
Chart 2
Chart 3
Chart 4
Chart 5
Chart 6
157-177-207
124-179-252
24-56-132
255-255-255
39-58-124
0-176-80
192-0-0
82-76-123
170-178-203
0-78-156
103-141-197
222-221-233
255-192-0
166-166-166
179-209-224
97-91-145
128-128-128
39-58-124
Table of contents
Eurobank Overview and Financials 2
Capital and Liquidity 13
Asset Quality 18
Eurobank Mortgage Business: Loans Origination and Management 26
Eurobank Global Covered Bond Programme I 38
Appendix I – Macroeconomic Update 51
Appendix II – Legal Framework Comparison 57
Appendix II – Glossary 59

Eurobank Overview and Financials

Page 3
Additional Colours NOTE: Eurobank is always red (Chart 10)
Chart 7
Chart 8
Chart 9
Chart 10
Colour 11
Colour 12
Colour 13
Chart 14
Body Text in Calibri
Background
Heading Text, 1st Level Fill
Message Box, Table Highlights
Chart 1
Chart 2
Chart 3
Chart 4
Chart 5
Chart 6
157-177-207
124-179-252
24-56-132
255-255-255
39-58-124
0-176-80
192-0-0
82-76-123
170-178-203
0-78-156
103-141-197
222-221-233
255-192-0
166-166-166
179-209-224
97-91-145
128-128-128
39-58-124
38.8
7.6
11.2
34.1
14.0 22.3
Assets Liabilities
Eurobank overview
Key Highlights Key Figures
Assets and Liabilities Breakdown (€bn) – 2Q 2017
(€bn, Unless Otherwise Stated) June 2017
Customer loans (net) 38.8
Customer deposits 34.1
Total assets 64.0
Tangible book value 5.8
Branches (Group) (#) 897
Employees (Group) (#) 15,846
Business, 53%
Mortgages, 35%
Consumer, 12%
Loans
Securities
Other
64.0 64.0
Total Equity
Deposits
Central Bank funding and
Other
Gross Loan Portfolio Balance Sheet
Most private bank in Greece, 97.62% owned today by private
investors (institutional and retail) and 2.38% by the HFSF
Market leader in attractive fee generating businesses such as equity brokerage, asset management, securities services & private banking
Highly experienced management team with long tenure at the
bank
CEO, Deputy CEOs and CRO with over 15 years with the
bank
International presence
International platform including banking subsidiaries self funded with deposit gathering outpacing loan growth
‒ €10.4bn deposits vs. €6.8bn net loans as of 2Q 2017
Commercial and retail banking operations in Bulgaria, Romania and Serbia
Private and corporate banking operations in Cyprus
Private banking operations in Luxembourg
2
3
1
4

Page 4
Additional Colours NOTE: Eurobank is always red (Chart 10)
Chart 7
Chart 8
Chart 9
Chart 10
Colour 11
Colour 12
Colour 13
Chart 14
Body Text in Calibri
Background
Heading Text, 1st Level Fill
Message Box, Table Highlights
Chart 1
Chart 2
Chart 3
Chart 4
Chart 5
Chart 6
157-177-207
124-179-252
24-56-132
255-255-255
39-58-124
0-176-80
192-0-0
82-76-123
170-178-203
0-78-156
103-141-197
222-221-233
255-192-0
166-166-166
179-209-224
97-91-145
128-128-128
39-58-124
Eurobank is the most private bank in Greece
2% 11%
26%
40%
98% 89%
74%
60%
Eurobank Alpha Piraeus NBG
Source: Bank’s registry data.
Private
Shareholders
Hellenic Financial Stability Fund

Page 5
Additional Colours NOTE: Eurobank is always red (Chart 10)
Chart 7
Chart 8
Chart 9
Chart 10
Colour 11
Colour 12
Colour 13
Chart 14
Body Text in Calibri
Background
Heading Text, 1st Level Fill
Message Box, Table Highlights
Chart 1
Chart 2
Chart 3
Chart 4
Chart 5
Chart 6
157-177-207
124-179-252
24-56-132
255-255-255
39-58-124
0-176-80
192-0-0
82-76-123
170-178-203
0-78-156
103-141-197
222-221-233
255-192-0
166-166-166
179-209-224
97-91-145
128-128-128
39-58-124
Leading position in fee generating activities
1. Extel Survey / Thomson Reuters. 2. ATHEX. 3. As at 31 August 2017. 4. Data ad of 30 September 2017. 5. As of 2Q17.
The sole provider in Greece (ISO certified) offering a full suite of securities services in line with international standards
Best Securities Services Provider in Greece for 2017, by Global Finance eleven times over the last twelve years;
Top Rated Custodian for Institutional Investors in Greece, by Global Custodian for eleven consecutive years.
€31.9bn assets under custody and €3.6bn assets under management3
Securities Services
Market leader in Greece with a 32,2% market share in mutual funds and €2.2bn of assets
More than €1.0bn assets under management in segregated accounts
Fund selection services in mutual funds of 15 internationally recognised funds manages, with a total of €0.7bn of assets
Asset Management4
Market leader in Greece with holistic servicing model in four countries (Greece, Cyprus, London and Luxembourg)
We offer a unique proposition to our clients, including multiple/multi-currency Discretionary mandates, Virtual Advisory & External Asset Management, Account Consolidation services, advanced Wealth & succession planning solutions, Art Advisory and our totally revamped Family Office offering.
€5.6bn assets under management5
Private Banking
Market leader with full service equity brokerage and research firm
Voted best brokerage firm in Greece and best research in 20161
~17% market share YTD in volumes traded2 (consistently ranking no.1 for past 8 years)
Equity Brokerage
Leadership position across businesses as a result of effective distribution coupled with a comprehensive product offering

Page 6
Additional Colours NOTE: Eurobank is always red (Chart 10)
Chart 7
Chart 8
Chart 9
Chart 10
Colour 11
Colour 12
Colour 13
Chart 14
Body Text in Calibri
Background
Heading Text, 1st Level Fill
Message Box, Table Highlights
Chart 1
Chart 2
Chart 3
Chart 4
Chart 5
Chart 6
157-177-207
124-179-252
24-56-132
255-255-255
39-58-124
0-176-80
192-0-0
82-76-123
170-178-203
0-78-156
103-141-197
222-221-233
255-192-0
166-166-166
179-209-224
97-91-145
128-128-128
39-58-124
Eurobank receives international recognition – recent awards
Banking products and Services
Most Admired Companies #8, 2017 – Greece -Fortune Magazine and KPMG Survey
Best Bank 2016 & 2017 – Greece
Best Retail Bank 2016 - Greece
Digital Banking
Best SMS/Text Banking in Western Europe, 2017 – Greece
Best Consumer Digital Bank in Greece, 2017 - Greece
Best Corporate/Institutional Digital Bank in Greece, 2016 & 2017 - Greece
Gold Award for €pistrofi app in the Mobile Personalized Service, 2017 – Greece
Gold Award for Eurobank Mobile Αpp in the Mobile App for Consumers – Sector Mobile App, 2017 – Greece
Gold Award for PaF - Pay a Friend in the Use of Mobile for P2P Payment, 2017 - Greece
Gold Award for PaF - Pay a Friend in the Contactless Payment, P2P Payment category, 2017 - Greece
Other
Best Security Services Provider 2016 & 2017 - Greece
Best Domestic Trade Finance Provider 2017 – Greece
Best Treasury & Cash Management Provider 2016 & 2017 - Greece
Best Private Bank 2016 – Greece -The Banker & PWM Magazines - Financial Times Group
Best Private Bank 2016 – Greece

Page 7
Additional Colours NOTE: Eurobank is always red (Chart 10)
Chart 7
Chart 8
Chart 9
Chart 10
Colour 11
Colour 12
Colour 13
Chart 14
Body Text in Calibri
Background
Heading Text, 1st Level Fill
Message Box, Table Highlights
Chart 1
Chart 2
Chart 3
Chart 4
Chart 5
Chart 6
157-177-207
124-179-252
24-56-132
255-255-255
39-58-124
0-176-80
192-0-0
82-76-123
170-178-203
0-78-156
103-141-197
222-221-233
255-192-0
166-166-166
179-209-224
97-91-145
128-128-128
39-58-124
International presence
Grivalia Properties classified as held for sale. All previous quarters restated accordingly.
All data as of 2Q17.
Total Assets (€ bn) 1.3
Net Loans (€ bn) 0.9
Deposits (€ bn) 0.8
Branches (#) 80
Total Assets (€ bn) 4.3
Net Loans (€ bn) 1.5
Deposits (€ bn) 3.8
Private Banking Centers (#)
8
Total Assets (€ bn) 2.6
Net Loans (€ bn) 1.7
Deposits (€ bn) 1.9
Branches (#) 147
Total Assets (€ bn) 3.4
Net Loans (€ bn) 2.4
Deposits (€ bn) 2.9
Branches (#) 174
Total Assets (€ bn) 1.5
Net Loans (€ bn) 0.5
Deposits (€ bn) 1.2

Page 8
Additional Colours NOTE: Eurobank is always red (Chart 10)
Chart 7
Chart 8
Chart 9
Chart 10
Colour 11
Colour 12
Colour 13
Chart 14
Body Text in Calibri
Background
Heading Text, 1st Level Fill
Message Box, Table Highlights
Chart 1
Chart 2
Chart 3
Chart 4
Chart 5
Chart 6
157-177-207
124-179-252
24-56-132
255-255-255
39-58-124
0-176-80
192-0-0
82-76-123
170-178-203
0-78-156
103-141-197
222-221-233
255-192-0
166-166-166
179-209-224
97-91-145
128-128-128
39-58-124
2Q17 results1
1. Grivalia Properties classified as held for sale. All previous quarters restated accordingly. 2. Before discontinued operations & restructuring costs. 3. Pro-forma for Grivalia disposal.
Key financials
2
3
Highlights
1
4
€ m 2Q17 1Q17 Δ(%) 1H17 1H16 Δ(%)
Net interest income 388.9 381.5 2.0 770.4 771.0 (0.1)
Banking fee and Commission income
71.9 68.8 4.5 140.6 117.8 19.4
Other income 35.3 40.2 (12.2) 75.6 130.9 (42.3)
Operating income 496.1 490.5 1.1 986.6 1,019.8 (3.3)
Operating expenses (244.9) (243.9) 0.4 (488.8) (501.8) (2.6)
Total 251.2 246.6 1.9 497.9 518.0 (3.9)
Loan loss provisions (183.7) (188.2) (2.4) (371.9) (397.5) (6.4)
Net Income before tax2 51.4 52.2 (1.5) 103.6 112.8 (8.2)
Net income after tax 39.7 36.5 8.8 76.3 106.5 (28.3)
Ratios (%) 2Q17 1Q17 1H17 1H16
NPE 44.1 45.0 44.1 45.1
NPE coverage 51.1 50.8 51.1 50.0
90dpd 34.6 34.8 34.6 34.7
90dpd coverage 65.3 65.5 65.3 65.0
CET1 17.43 17.3 17.43 16.7
FLB3 CET1 14.43 13.9 14.43 13.3
Loans / Deposits 113.8 115.1 113.8 119.9
TBV per share (€) 2.64 2.58 2.64 2.48
EPS (€) 0.02 0.02 0.03 0.05 5
Net profit €40m in 2Q17 and €76m in 1H17
NII up 2.0% q-o-q; stable y-o-y
Banking fee and Commission income up 4.5% q-o-q; up 19.4% y-o-y
Operating expenses down 2.6% y-o-y, Greece down 3.5% y-o-y
Asset Quality
Third quarter of negative NPE formation at €193m
NPE stock down €0.5bn in 2Q17; €0.8bn in 1H17
NPE ratio down 90bps q-o-q at 44.1%
NPE coverage up 30bps q-o-q at 51.1%
Liquidity
Deposits Greece up by €0.7bn q-o-q; up €0.3bn in 1H17
Current ELA funding at €9.9bn; €2.5bn down from 2017 peak
Capital
Eurobank plans to redeem €950m preference shares issuing Tier II bonds
20% of Grivalia disposal on July 4th; 30bps gain on 2Q17 FLB3 CET1
Common Equity Tier 1 (CET1) ratio at 17.4%3
Fully loaded Basel III (FLB3) CET1 at 14.4%3, up 50bps q-o-q
International operations net profit €42m in 2Q17 and €71m in 1H17

Page 9
Additional Colours NOTE: Eurobank is always red (Chart 10)
Chart 7
Chart 8
Chart 9
Chart 10
Colour 11
Colour 12
Colour 13
Chart 14
Body Text in Calibri
Background
Heading Text, 1st Level Fill
Message Box, Table Highlights
Chart 1
Chart 2
Chart 3
Chart 4
Chart 5
Chart 6
157-177-207
124-179-252
24-56-132
255-255-255
39-58-124
0-176-80
192-0-0
82-76-123
170-178-203
0-78-156
103-141-197
222-221-233
255-192-0
166-166-166
179-209-224
97-91-145
128-128-128
39-58-124 51 57 51 55 57 58
496 487 480 470 442 447
(17) (22) (24) (28) (21) (22)
(73) (66) (53) (48) (45) (44)
(19) (12) (10) (5) (4) (4)
(55) (56) (56) (54) (48) (47)
1Q16 2Q16 3Q16 4Q16 1Q17 2Q17
Net interest income
NII breakdown (€ m) NII per region (€ m)
NII evolution q-o-q (€ m)
Grivalia Properties classified as held for sale. All previous quarters restated accordingly.
279 282 285 283 274 281
104 106 104 107 108 108
383 388 389 390 381 389
1Q16 2Q16 3Q16 4Q16 1Q17 2Q17
International
Greece
381 389
1 0 6 3
(3) 0
1Q
17
Euro
syst
em
De
po
sits
ma
rgin
Loan
s m
argi
n
Bo
nd
s
Re
po
s &
oth
er
Inte
rnat
ion
al
2Q
17
Greece
Total NII 383 388 389 390 381 389
Loan margin
Deposit margin
Bonds & other
Eurosystem funding
Money market & Repos
Pillar II

Page 10
Additional Colours NOTE: Eurobank is always red (Chart 10)
Chart 7
Chart 8
Chart 9
Chart 10
Colour 11
Colour 12
Colour 13
Chart 14
Body Text in Calibri
Background
Heading Text, 1st Level Fill
Message Box, Table Highlights
Chart 1
Chart 2
Chart 3
Chart 4
Chart 5
Chart 6
157-177-207
124-179-252
24-56-132
255-255-255
39-58-124
0-176-80
192-0-0
82-76-123
170-178-203
0-78-156
103-141-197
222-221-233
255-192-0
166-166-166
179-209-224
97-91-145
128-128-128
39-58-124
Banking fee and Commission income breakdown (€ m) Banking fee and Commission income per region (€ m)
Banking fee and Commission income
Grivalia Properties classified as held for sale. All previous quarters restated accordingly.
Rental & other income
Mutual funds
Capital Markets
Network
Lending
Govt. Guarantee expense (16)
(10) (5) (3) (3) (3)
3 3 2 2 3 3
8 8 8 9 9 11
6 6 3 5
8 8
32 34 37 37
34 35
24 20 19 21
18 19
57 61 66
71 69
72
1Q16 2Q16 3Q16 4Q16 1Q17 2Q17
€m 73 71 70 75 71 75
bps 41 40 41 45 44 47
Fees excl. Govt. guarantees expense
33 35 39
44 44 44
24 26
27
28 25 28
57
61
66
71 69
72
1Q16 2Q16 3Q16 4Q16 1Q17 2Q17
Greece
International

Page 11
Additional Colours NOTE: Eurobank is always red (Chart 10)
Chart 7
Chart 8
Chart 9
Chart 10
Colour 11
Colour 12
Colour 13
Chart 14
Body Text in Calibri
Background
Heading Text, 1st Level Fill
Message Box, Table Highlights
Chart 1
Chart 2
Chart 3
Chart 4
Chart 5
Chart 6
157-177-207
124-179-252
24-56-132
255-255-255
39-58-124
0-176-80
192-0-0
82-76-123
170-178-203
0-78-156
103-141-197
222-221-233
255-192-0
166-166-166
179-209-224
97-91-145
128-128-128
39-58-124
Operating expenses
Grivalia Properties classified as held for sale. All previous quarters restated accordingly.
OpEx per region (€ m) OpEx breakdown (€ m)
Headcount and network evolution (#)
186 182 181 181 177 178
66 68 66 61 66 67
251 250 247 242 243 245
1Q16 2Q16 3Q16 4Q16 1Q17 2Q17
International
Greece
272 275
194 181
36 33
502 489
1H16 1H17
Depreciation
Administrative
Staff
(2.6%)
Greece (3.5%)
915 856 840 839 839 838 Branches (#)
16,883 16,340 15,906 15,929 15,899 15,846
10,440 10,173 9,807 9,789 9,761 9,710
6,443 6,167 6,099 6,140 6,138 6,136
1Q16 2Q16 3Q16 4Q16 1Q17 2Q17
Group
Greece
International

Capital and Liquidity

Page 13
Additional Colours NOTE: Eurobank is always red (Chart 10)
Chart 7
Chart 8
Chart 9
Chart 10
Colour 11
Colour 12
Colour 13
Chart 14
Body Text in Calibri
Background
Heading Text, 1st Level Fill
Message Box, Table Highlights
Chart 1
Chart 2
Chart 3
Chart 4
Chart 5
Chart 6
157-177-207
124-179-252
24-56-132
255-255-255
39-58-124
0-176-80
192-0-0
82-76-123
170-178-203
0-78-156
103-141-197
222-221-233
255-192-0
166-166-166
179-209-224
97-91-145
128-128-128
39-58-124
13.8%
14.4%
16.9% 17.4%
250bps 3bps 49bps
20
16
FLB
3
2Q
17
pro
-fo
rma
FLB
3
Pre
fere
nce
shar
es
FLB
3 in
cl. p
ref.
shar
es
Oth
er
adju
stm
en
ts
DTA
ph
ase
ou
t
2Q
17
pro
-fo
rma
CET
1
Capital position
Phased-in CET1 Fully loaded Basel III CET1 (FLB3)
Grivalia Properties classified as held for sale. All previous quarters restated accordingly. 1. Pro forma for Grivalia disposal.
Note: 2017 CET1 SREP requirement 8.75%. 2017 Total capital requirement (TCR) 12.25%.
RWAs (€ m)
38,602 - 388 38,990 (875) 38,115
Capital (€ m)
6,663 40 69 6,772 (132) 6,640
RWAs (€ m)
38,190 37,835 - 37,835 - 280 38,115
Capital (€ m)
5,268 5,441 950 6,391 13 236 6,640
17.3% 17.4% 17.4% 10bps 0 5bps
1Q
17
CET
1
2Q
17
re
sult
AFS
& o
the
r
2Q
17
CET
1
Gri
valia
pro
pe
rtie
s sa
le
2Q
17
pro
-fo
rma
CET
1
60bps
1

Page 14
Additional Colours NOTE: Eurobank is always red (Chart 10)
Chart 7
Chart 8
Chart 9
Chart 10
Colour 11
Colour 12
Colour 13
Chart 14
Body Text in Calibri
Background
Heading Text, 1st Level Fill
Message Box, Table Highlights
Chart 1
Chart 2
Chart 3
Chart 4
Chart 5
Chart 6
157-177-207
124-179-252
24-56-132
255-255-255
39-58-124
0-176-80
192-0-0
82-76-123
170-178-203
0-78-156
103-141-197
222-221-233
255-192-0
166-166-166
179-209-224
97-91-145
128-128-128
39-58-124
Eurobank plans to redeem €950m state preference shares through issuance of Tier II bonds in 4Q17
Coupon c.6.4%1 payable in cash, tax deductible
Non-convertible
Tier II bond terms are market standard:
Subordinated instrument, ranks senior to common shares
10 years maturity, callable after 5 years
Mandatory coupon payment
Qualifies for MREL
Pro- Forma CAD ratio2 (FLB3) increases by 250bps to 17.1%
Tier II bonds Total Capital (FLB3)
Redemption of preference shares through issuance of Tier II bonds
Grivalia Properties classified as held for sale. All previous quarters restated accordingly.
1. According to Law 4484/2017. 2. Pro-forma for Grivalia disposal.
14.6%
17.1%
12.25%
250bps
2Q17 FLB3 totalcapital
Tier II capital Pro-forma 2Q17FLB3 total capital
2017 TCR SREP2

Page 15
Additional Colours NOTE: Eurobank is always red (Chart 10)
Chart 7
Chart 8
Chart 9
Chart 10
Colour 11
Colour 12
Colour 13
Chart 14
Body Text in Calibri
Background
Heading Text, 1st Level Fill
Message Box, Table Highlights
Chart 1
Chart 2
Chart 3
Chart 4
Chart 5
Chart 6
157-177-207
124-179-252
24-56-132
255-255-255
39-58-124
0-176-80
192-0-0
82-76-123
170-178-203
0-78-156
103-141-197
222-221-233
255-192-0
166-166-166
179-209-224
97-91-145
128-128-128
39-58-124
Funding and liquidity
Grivalia Properties classified as held for sale. All previous quarters restated accordingly.
1. As at 30 August 2017.
Eurosystem funding (€ bn) Comments
Interbank repos and eurosystem funding (€ bn) Liabilities breakdown (€ bn)
Wholesale 5.6
Deposits 34.1
ECB 2.6
ELA 11.2
Other 3.0
Current ELA funding at €9.9bn; €2.5bn down from 2017 peak
Outstanding Pillar II bonds €1.0bn1
Group deposits up by €0.4bn q-o-q; fully offsetting 1Q17 outflows
TLTRO II €1.3bn
c75% of Interbank repos with Greek risk related collaterals
29
.0
17
.0
16
.3
10
.7
9.1
12
.5
29
.1
32
.7
31
.6
25
.3
22
.9
21
.5
16
.8
13
.9
15
.7
13
.8
12
.2
2.0
1
0.5
10
.8
10
.9
11
.1 9.9
0.7
0.4
0.6
4
.0
5.2
5.0
6.8
7.2
5.3
5.0
5.8
De
c 1
2
De
c 1
3
Mar
14
Jun
14
Sep
14
De
c 1
4
Mar
15
Jun
15
Sep
15
De
c 1
5
Mar
16
Jun
16
Sep
16
De
c 1
6
Mar
17
Jun
17
Au
g 1
7
Eurosystem Repos
15.0
22.9
11.9 12.2 11.2 9.9
19.0
9.8
2.1 3.4 2.6 2.3
34.0 32.7
13.9 15.7
13.8 12.2
Jun 12 Jun 15 Dec 16 Mar 17 Jun 17 Aug 17
ECB
ELA
1
1

Page 16
Additional Colours NOTE: Eurobank is always red (Chart 10)
Chart 7
Chart 8
Chart 9
Chart 10
Colour 11
Colour 12
Colour 13
Chart 14
Body Text in Calibri
Background
Heading Text, 1st Level Fill
Message Box, Table Highlights
Chart 1
Chart 2
Chart 3
Chart 4
Chart 5
Chart 6
157-177-207
124-179-252
24-56-132
255-255-255
39-58-124
0-176-80
192-0-0
82-76-123
170-178-203
0-78-156
103-141-197
222-221-233
255-192-0
166-166-166
179-209-224
97-91-145
128-128-128
39-58-124
Deposits Spreads Greece (bps)
2Q16 3Q16 4Q16 1Q17 2Q17
Savings & Sight (56) (53) (53) (51) (49)
Time (103) (103) (96) (90) (88)
Total (75) (74) (72) (67) (66)
1M avg. Euribor (35) (37) (37) (37) (37)
22.8 23.1 23.4 22.9 23.7
10.2 10.2 10.6 10.7 10.4
6M16 9M16 FY16 3M17 6M17
International
Greece
5.3 5.4 5.4 5.3 5.2
16.3 16.1 16.1 16.0 15.7
21.9 21.7 21.7 21.4 21.5
7.5 7.4 7.5 7.5 7.7
6M16 9M16 FY16 3M17 6M17
International
Business
Mortgages
Consumer
Greece
119.9% 117.2%
114.8% 115.1% 113.8%
Gross loans (€ bn) Deposits (€ bn)
Loans and deposits
Grivalia Properties classified as held for sale. All previous quarters restated accordingly.
1. Excluding FX effect, write-offs and sales.
50.2 50.1
33.7 34.1
33.4 34.0
Loans/Deposits
348 54 (195)
50.7 50.6 51.0
33.0
Δ loans l-f-l1 (€m)
Lending Spreads Greece (bps)
2Q16 3Q16 4Q16 1Q17 2Q17
Corporate 507 511 524 516 493
Retail 460 447 435 416 432
Total 477 470 467 451 454

Asset Quality

Page 18
Additional Colours NOTE: Eurobank is always red (Chart 10)
Chart 7
Chart 8
Chart 9
Chart 10
Colour 11
Colour 12
Colour 13
Chart 14
Body Text in Calibri
Background
Heading Text, 1st Level Fill
Message Box, Table Highlights
Chart 1
Chart 2
Chart 3
Chart 4
Chart 5
Chart 6
157-177-207
124-179-252
24-56-132
255-255-255
39-58-124
0-176-80
192-0-0
82-76-123
170-178-203
0-78-156
103-141-197
222-221-233
255-192-0
166-166-166
179-209-224
97-91-145
128-128-128
39-58-124
Strong asset quality profile versus domestic peers
NPE coverage (Group)1 NPE ratio (Group)1
44% 45%
52% 54%
Eurobank Peer 1 Peer 2 Peer 3
51%
56%
45%
48%
Eurobank Peer 1 Peer 2 Peer 3
1. Latest available data

Page 19
Additional Colours NOTE: Eurobank is always red (Chart 10)
Chart 7
Chart 8
Chart 9
Chart 10
Colour 11
Colour 12
Colour 13
Chart 14
Body Text in Calibri
Background
Heading Text, 1st Level Fill
Message Box, Table Highlights
Chart 1
Chart 2
Chart 3
Chart 4
Chart 5
Chart 6
157-177-207
124-179-252
24-56-132
255-255-255
39-58-124
0-176-80
192-0-0
82-76-123
170-178-203
0-78-156
103-141-197
222-221-233
255-192-0
166-166-166
179-209-224
97-91-145
128-128-128
39-58-124
First NPE portfolio sale in the Greek market by a Systemic bank
50% 50%
72%
Intrum is the industry-leading provider of Credit Management Services with a presence in 23 markets in Europe, has more than 8,000 employees servicing more than 100,000 companies across Europe
Capital and P&L neutral transaction
De-risking balance sheet and reducing NPE ratio
Servicing will be maintained with Financial Planning Services (FPS), which is 100% owned by Eurobank
Cost savings arising from collection / servicing efforts leading to headcount optimization
status parties reached agreement on all terms and anticipate duly close the transaction within the 4Q17
Perimeter
Buyer
Benefits
Portfolio of consumer unsecured NPE loans
c.€1.5bn unpaid principal balance of which c. €620m on balance sheet exposure
First NPE sale in the Greek market

Page 20
Additional Colours NOTE: Eurobank is always red (Chart 10)
Chart 7
Chart 8
Chart 9
Chart 10
Colour 11
Colour 12
Colour 13
Chart 14
Body Text in Calibri
Background
Heading Text, 1st Level Fill
Message Box, Table Highlights
Chart 1
Chart 2
Chart 3
Chart 4
Chart 5
Chart 6
157-177-207
124-179-252
24-56-132
255-255-255
39-58-124
0-176-80
192-0-0
82-76-123
170-178-203
0-78-156
103-141-197
222-221-233
255-192-0
166-166-166
179-209-224
97-91-145
128-128-128
39-58-124
142 171 160 155 161 158
33
52
31 31 27 26
175
222
191 186 188 184
1Q16 2Q16 3Q16 4Q16 1Q17 2Q17
Int'l
Greece
(170)
(23)
370
492
149
(108) (72)
(193)
1Q16 2Q16 3Q16 4Q16 1Q17 2Q17
Int'l
Greece
Asset quality
NPEs formation1 (€ m) 90dpd formation1 (€ m)
Loan loss provisions (€ m)
Third quarter of negative NPE formation at €193m
NPE stock down €0.5bn in 2Q17; €0.8bn in 1H17
NPE ratio down 90bps q-o-q at 44.1%
NPE coverage up 30bps q-o-q at 51.1%
90dpd formation positive, albeit reduced by 41% q-o-q
Grivalia Properties classified as held for sale. All previous quarters restated accordingly.
1. q-o-q change before write-offs, sales, FX movements and other. 2. On net loans
Coverage (%) 50.7 50.0 50.0 50.7 50.8 51.1
Ratio (%) 44.2 45.1 45.6 45.2 45.0 44.1
Coverage (%) 64.3 65.0 65.5 66.1 65.5 65.3
Ratio (%) 34.8 34.7 34.8 34.7 34.8 34.6
85
6 42
(16) (28)
(85)
154
91
1Q16 2Q16 3Q16 4Q16 1Q17 2Q17
Int'l
Greece

Page 21
Additional Colours NOTE: Eurobank is always red (Chart 10)
Chart 7
Chart 8
Chart 9
Chart 10
Colour 11
Colour 12
Colour 13
Chart 14
Body Text in Calibri
Background
Heading Text, 1st Level Fill
Message Box, Table Highlights
Chart 1
Chart 2
Chart 3
Chart 4
Chart 5
Chart 6
157-177-207
124-179-252
24-56-132
255-255-255
39-58-124
0-176-80
192-0-0
82-76-123
170-178-203
0-78-156
103-141-197
222-221-233
255-192-0
166-166-166
179-209-224
97-91-145
128-128-128
39-58-124
35 38
28
(7) (2)
(15)
1Q
16
2Q
16
3Q
16
4Q
16
1Q
17
2Q
17
315 278
100
(9)
22
(22)
1Q
16
2Q
16
3Q
16
4Q
16
1Q
17
2Q
17
71 51
12
(27) (15)
(73)
1Q
16
2Q
16
3Q
16
4Q
16
1Q
17
2Q
17
(36)
139
14
(24)
(67) (60)
1Q
16
2Q
16
3Q
16
4Q
16
1Q
17
2Q
17
NPEs formation per segment (Greece)
Mortgages (€ m) Consumer (€ m)
Small business (€ m) Corporate (€ m)
Grivalia Properties classified as held for sale. All previous quarters restated accordingly.

Page 22
Additional Colours NOTE: Eurobank is always red (Chart 10)
Chart 7
Chart 8
Chart 9
Chart 10
Colour 11
Colour 12
Colour 13
Chart 14
Body Text in Calibri
Background
Heading Text, 1st Level Fill
Message Box, Table Highlights
Chart 1
Chart 2
Chart 3
Chart 4
Chart 5
Chart 6
157-177-207
124-179-252
24-56-132
255-255-255
39-58-124
0-176-80
192-0-0
82-76-123
170-178-203
0-78-156
103-141-197
222-221-233
255-192-0
166-166-166
179-209-224
97-91-145
128-128-128
39-58-124
NPEs analysis (Greece)
388 513
190
(64) (38) (158) (4) (7) (36)
(3) (25)
(11) (248)
(15) (41) (11)
(204)
(159)
(150)
Change of stock NPEs (€ m) Retail portfolio
Corporate portfolio
Performing Non - Performing
Non- Performing Forborne 90dpd Performing Forborne
Non- Performing Forborne 0-89dpd
€ 9.2 bn € 9.3 bn
€ 2.0 bn
€ 2.7 bn € 4.2 bn
Δ stock NPEs
NPEs PEs
109
512
112
(155) (254)
(395)
(27)
22
(2)
74 13
(67) Other adjustments
1Q16 2Q16 3Q16 4Q16 1Q17 2Q17
NPE formation
Performing Non - Performing
Non- Performing Forborne 90dpd Performing Forborne
Non- Performing Forborne 0-89dpd
€ 7.9 bn € 5.1 bn
€ 0.4 bn
€ 1.1 bn € 0.6 bn
NPEs PEs NPE net flow
Collateral liquidation
Write-offs
Sales
Grivalia Properties classified as held for sale. All previous quarters restated accordingly.

Page 23
Additional Colours NOTE: Eurobank is always red (Chart 10)
Chart 7
Chart 8
Chart 9
Chart 10
Colour 11
Colour 12
Colour 13
Chart 14
Body Text in Calibri
Background
Heading Text, 1st Level Fill
Message Box, Table Highlights
Chart 1
Chart 2
Chart 3
Chart 4
Chart 5
Chart 6
157-177-207
124-179-252
24-56-132
255-255-255
39-58-124
0-176-80
192-0-0
82-76-123
170-178-203
0-78-156
103-141-197
222-221-233
255-192-0
166-166-166
179-209-224
97-91-145
128-128-128
39-58-124
90dpd bridge to NPEs (€ bn)
16.5 16.3 16.1 15.7 15.6 15.5
6.2 6.7 7.0 7.2 7.0 6.6
22.7 23.0 23.1 22.9 22.6 22.1
1Q16 2Q16 3Q16 4Q16 1Q17 2Q17
NPF
NP
(€781m)
17.3
22.1 4.0
0.8
90dpd NPF 0-89dpd Other Impaired NPEs
Total NPEs NPEs ratio4 Provisions/ NPEs
Provisions & collaterals /
NPEs
(€ bn) (%) (%) (%)
Consumer 3.4 64.6 80.1 85
Mortgages 6.3 40.0 34.7 105
Small Business 4.3 66.4 44.2 100
Total Retail 14.0 50.9 48.6 99
Corporate 6.6 43.8 55.9 101
Greece 20.5 48.4 51.0 100
Int’l 1.6 20.4 53.5 103
Total 22.1 44.1 51.1 100
NPEs metrics (Group)
NPEs per segment and region
17% 19% 19% 20% 19% 18%
10% 10% 11% 11% 12% 12%
73% 71% 70% 69% 69% 70%
1Q16 2Q16 3Q16 4Q16 1Q17 2Q17
NP
NPF 90dpd
NPF 0-89dpd
NPEs (€ bn) NPEs breakdown (€ bn)
3
1
1 2
23.0 23.1 22.9 22.6 22.1 22.7
Grivalia Properties classified as held for sale. All previous quarters restated accordingly. 1. Non-performing forborne loans. 2. Loans impaired due to triggers other than the existence of forbearance measures. 3. Non – Performing. 4. NPE ratio at 40.8% including €4.5bn off-balance sheet exposures.

Page 24
Additional Colours NOTE: Eurobank is always red (Chart 10)
Chart 7
Chart 8
Chart 9
Chart 10
Colour 11
Colour 12
Colour 13
Chart 14
Body Text in Calibri
Background
Heading Text, 1st Level Fill
Message Box, Table Highlights
Chart 1
Chart 2
Chart 3
Chart 4
Chart 5
Chart 6
157-177-207
124-179-252
24-56-132
255-255-255
39-58-124
0-176-80
192-0-0
82-76-123
170-178-203
0-78-156
103-141-197
222-221-233
255-192-0
166-166-166
179-209-224
97-91-145
128-128-128
39-58-124
90dpd ratio per segment (%)
47.9
29.1
52.1
28.7 34.5
Consumer Mortgages Small Business Corporate Group
37.5 37.6 37.7 37.7 38.0 38.0
34.8 34.7 34.8 34.7 34.8 34.6
1Q16 2Q16 3Q16 4Q16 1Q17 2Q17
Greece
Group
Asset quality metrics - 90dpd loans
90dpd ratio per region (%)
90dpd coverage per segment (%) 90dpd coverage per region (%)
€3.0bn €5.1bn €3.7bn €5.5bn €17.3bn
17.7 17.5 17.3 16.9 15.7 International
1Q16 2Q16 3Q16 4Q16 1Q17 2Q17
Greece 64.3 64.9 65.3 65.8 65.2 65.0
International 64.3 66.4 67.9 69.4 69.8 69.6
Group 64.3 65.0 65.5 66.1 65.5 65.3
91.8
45.4 56.0
75.6
65.3
Consumer Mortgages Small Business Corporate Group
Grivalia Properties classified as held for sale. All previous quarters restated accordingly.

Eurobank Mortgage Business: Loans Origination and Management
Page 26
Additional Colours NOTE: Eurobank is always red (Chart 10)
Chart 7
Chart 8
Chart 9
Chart 10
Colour 11
Colour 12
Colour 13
Chart 14
Body Text in Calibri
Background
Heading Text, 1st Level Fill
Message Box, Table Highlights
Chart 1
Chart 2
Chart 3
Chart 4
Chart 5
Chart 6
157-177-207
124-179-252
24-56-132
255-255-255
39-58-124
0-176-80
192-0-0
82-76-123
170-178-203
0-78-156
103-141-197
222-221-233
255-192-0
166-166-166
179-209-224
97-91-145
128-128-128
39-58-124
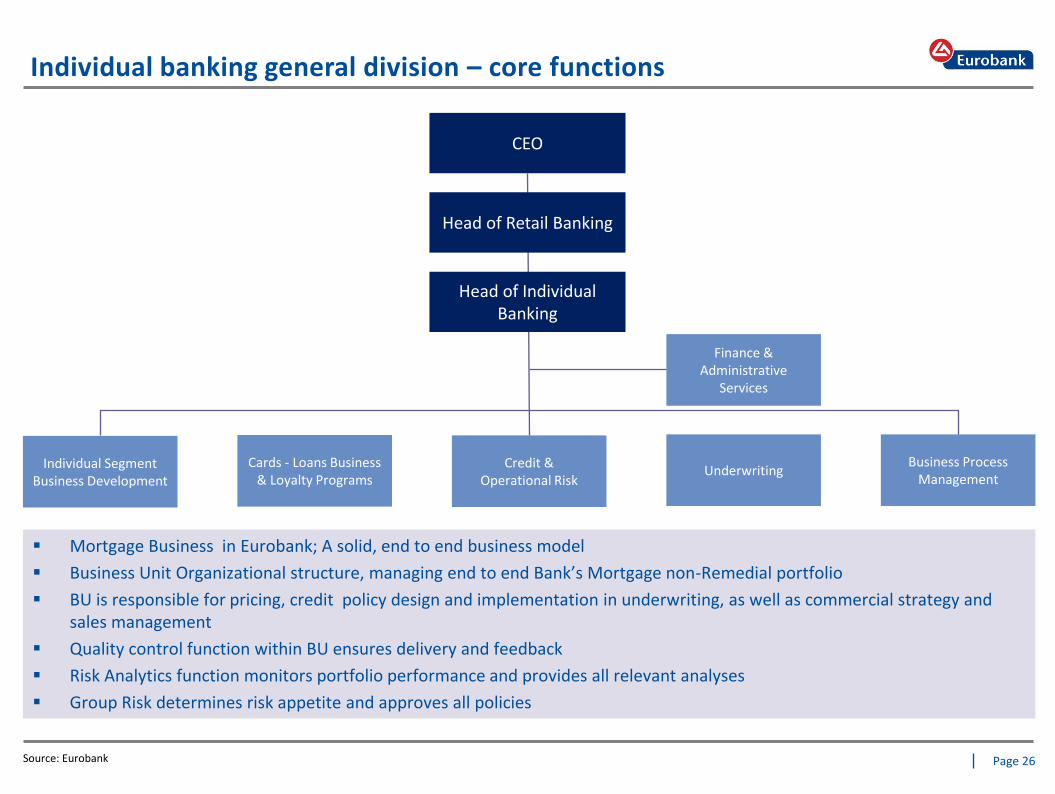
Individual banking general division – core functions
Mortgage Business in Eurobank; A solid, end to end business model
Business Unit Organizational structure, managing end to end Bank’s Mortgage non-Remedial portfolio
BU is responsible for pricing, credit policy design and implementation in underwriting, as well as commercial strategy and sales management
Quality control function within BU ensures delivery and feedback
Risk Analytics function monitors portfolio performance and provides all relevant analyses
Group Risk determines risk appetite and approves all policies
Source: Eurobank
Finance & Administrative
Services
Business Process Management
Credit & Operational Risk
Underwriting Cards - Loans Business
& Loyalty Programs Individual Segment
Business Development
Head of Individual Banking
Head of Retail Banking
CEO
Page 27
Additional Colours NOTE: Eurobank is always red (Chart 10)
Chart 7
Chart 8
Chart 9
Chart 10
Colour 11
Colour 12
Colour 13
Chart 14
Body Text in Calibri
Background
Heading Text, 1st Level Fill
Message Box, Table Highlights
Chart 1
Chart 2
Chart 3
Chart 4
Chart 5
Chart 6
157-177-207
124-179-252
24-56-132
255-255-255
39-58-124
0-176-80
192-0-0
82-76-123
170-178-203
0-78-156
103-141-197
222-221-233
255-192-0
166-166-166
179-209-224
97-91-145
128-128-128
39-58-124
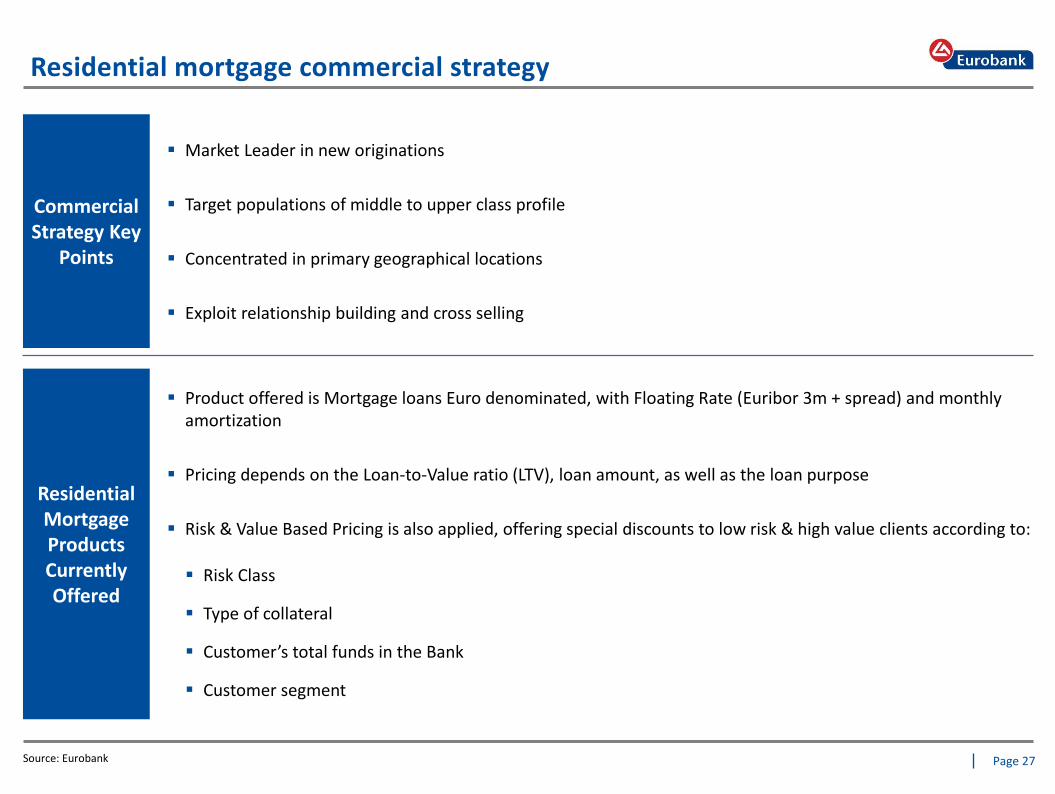
Residential mortgage commercial strategy
Source: Eurobank
Commercial Strategy Key
Points
Market Leader in new originations
Target populations of middle to upper class profile
Concentrated in primary geographical locations
Exploit relationship building and cross selling
Residential Mortgage Products Currently Offered
Product offered is Mortgage loans Euro denominated, with Floating Rate (Euribor 3m + spread) and monthly amortization
Pricing depends on the Loan-to-Value ratio (LTV), loan amount, as well as the loan purpose
Risk & Value Based Pricing is also applied, offering special discounts to low risk & high value clients according to:
Risk Class
Type of collateral
Customer’s total funds in the Bank
Customer segment
Page 28
Additional Colours NOTE: Eurobank is always red (Chart 10)
Chart 7
Chart 8
Chart 9
Chart 10
Colour 11
Colour 12
Colour 13
Chart 14
Body Text in Calibri
Background
Heading Text, 1st Level Fill
Message Box, Table Highlights
Chart 1
Chart 2
Chart 3
Chart 4
Chart 5
Chart 6
157-177-207
124-179-252
24-56-132
255-255-255
39-58-124
0-176-80
192-0-0
82-76-123
170-178-203
0-78-156
103-141-197
222-221-233
255-192-0
166-166-166
179-209-224
97-91-145
128-128-128
39-58-124
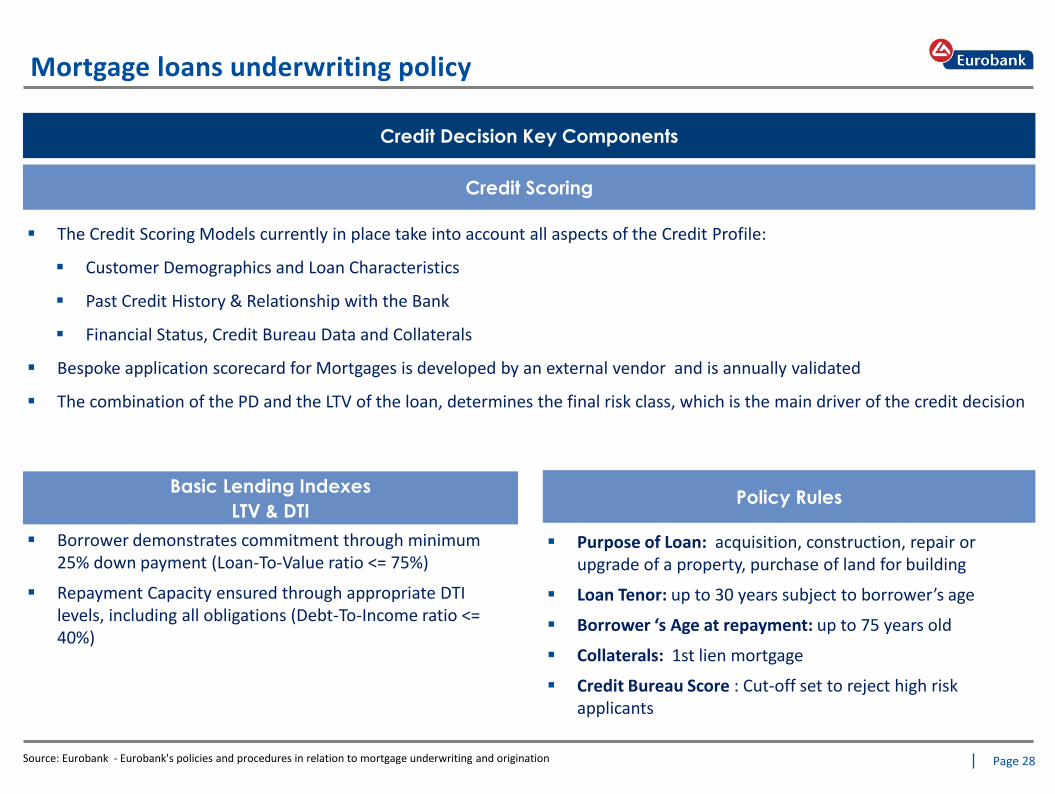
Mortgage loans underwriting policy
Basic Lending Indexes
LTV & DTI
Credit Decision Key Components
Policy Rules
Purpose of Loan: acquisition, construction, repair or upgrade of a property, purchase of land for building
Loan Tenor: up to 30 years subject to borrower’s age
Borrower ‘s Age at repayment: up to 75 years old
Collaterals: 1st lien mortgage
Credit Bureau Score : Cut-off set to reject high risk applicants
Credit Scoring
The Credit Scoring Models currently in place take into account all aspects of the Credit Profile:
Customer Demographics and Loan Characteristics
Past Credit History & Relationship with the Bank
Financial Status, Credit Bureau Data and Collaterals
Bespoke application scorecard for Mortgages is developed by an external vendor and is annually validated
The combination of the PD and the LTV of the loan, determines the final risk class, which is the main driver of the credit decision
Borrower demonstrates commitment through minimum 25% down payment (Loan-To-Value ratio <= 75%)
Repayment Capacity ensured through appropriate DTI levels, including all obligations (Debt-To-Income ratio <= 40%)
Source: Eurobank - Eurobank's policies and procedures in relation to mortgage underwriting and origination

Page 29
Additional Colours NOTE: Eurobank is always red (Chart 10)
Chart 7
Chart 8
Chart 9
Chart 10
Colour 11
Colour 12
Colour 13
Chart 14
Body Text in Calibri
Background
Heading Text, 1st Level Fill
Message Box, Table Highlights
Chart 1
Chart 2
Chart 3
Chart 4
Chart 5
Chart 6
157-177-207
124-179-252
24-56-132
255-255-255
39-58-124
0-176-80
192-0-0
82-76-123
170-178-203
0-78-156
103-141-197
222-221-233
255-192-0
166-166-166
179-209-224
97-91-145
128-128-128
39-58-124
Origination process - mortgages
Contract Preparation /
Disbursement
Collateral Valuation
& Loan Approval
Business Unit
Branch Network
Selected Real Estate Brokers
Validate customer data
Automated capture of customer position, credit bureau info, calculation of indexes
System performs 1st level decisioning
Sales & Distribution
Middle Office
Evaluation of customer creditworthiness based on policy rules, indexes, and credit scoring models
Electronic capture of legal & technical valuation results
Evaluation of collateral
Authorization level routing performed by the system.
4-eyes principle exists for all applications
Approval from required credit authority levels
Underwriting
Efficient document scanning at sales point
Sent legal & technical valuation order electronically
Contract verification
Collateral pledge
Property insurance coverage
Loan disbursement
Archiving of physical file
Loan Administration
Print out contract and obtain customer signature
Sent electronically orders for
contract verification, prenotation & property insurance
1 3
2 4
5
6
Sales Channel
Authority Levels Total Exposure (€Κ)
IB Underwriting up to 700
Bank Credit Sector up to 2.000
Bank Central Credit Committee above 2.000
Source: Eurobank - Eurobank's policies and procedures in relation to mortgage underwriting and origination

Page 30
Additional Colours NOTE: Eurobank is always red (Chart 10)
Chart 7
Chart 8
Chart 9
Chart 10
Colour 11
Colour 12
Colour 13
Chart 14
Body Text in Calibri
Background
Heading Text, 1st Level Fill
Message Box, Table Highlights
Chart 1
Chart 2
Chart 3
Chart 4
Chart 5
Chart 6
157-177-207
124-179-252
24-56-132
255-255-255
39-58-124
0-176-80
192-0-0
82-76-123
170-178-203
0-78-156
103-141-197
222-221-233
255-192-0
166-166-166
179-209-224
97-91-145
128-128-128
39-58-124
.
Property valuation process
Embedded system rules for different valuation
order types
Required documents for each order type
automatically defined.
Eurobank Property Services
Receive valuation order electronically
Assign valuer.
Monitor valuer (response times,
pendencies, quality of evaluation).
Valuer
Receive valuation order and
documents electronically
Conduct on site property visit
Complete and submit technical
evaluation electronically to EPS
Eurobank Property Services
Check valuation report
Obtain required reviewer approvals
Send out valuation results
electronically
Embedded system rules for the definition of
required reviewing levels
Independent external valuers, duly
appointed by Eurobank Property Services
and trained by experienced in-house
valuers
Legal Department
•Receive legal valuation
order
•Assign to an external
lawyer
• Legal Department monitor
external lawyers (response
times, pendencies, quality
of evaluation)
External lawyer
•Receive legal valuation order and documents electronically
•Conduct property valuation against land registry records (at least 20
year time span)
•Complete and submit legal valuation electronically to legal
department
•Receive prenotation order and documents electronically
•Complete and submit prenotation order electronically
•Submit to the Bank original prenotation certificates
Legal Department
•Check legal valuation
results, and submit
electronically
• Internal lawyers advise
and propose solutions on
all legal issues arising from
the results of the legal
valuations
Annual revaluation of all properties based on the Prop Index, an interbank statistical indicator that monitors changes in the value of residential property and market's general trends.
Annual revaluation (site visit) for loans above specific outstanding balance thresholds and selective physical revaluations during the servicing process.
Legal valuation process
Technical valuation process
Source: Eurobank

Page 31
Additional Colours NOTE: Eurobank is always red (Chart 10)
Chart 7
Chart 8
Chart 9
Chart 10
Colour 11
Colour 12
Colour 13
Chart 14
Body Text in Calibri
Background
Heading Text, 1st Level Fill
Message Box, Table Highlights
Chart 1
Chart 2
Chart 3
Chart 4
Chart 5
Chart 6
157-177-207
124-179-252
24-56-132
255-255-255
39-58-124
0-176-80
192-0-0
82-76-123
170-178-203
0-78-156
103-141-197
222-221-233
255-192-0
166-166-166
179-209-224
97-91-145
128-128-128
39-58-124
Overview of mortgage new origination
Strategy for new origination targets high-value / low-risk customers, through low risk channels, mainly in urban areas, resulting in very good credit quality of new vintages
As a result, approval rates remain at high levels, despite strict credit policy framework
Incoming application volumes are steadily increasing, yet still remaining at relatively low levels
Average new disbursement LTV is 50%
Average loan amount well below €100k and less than 5% of new production in €200+k area (high granularity)
Purchase of residential property constitutes the lending purpose in more than 50% of the loans, while home-construction and renovation constitutes the 35% of the loans
Source: Eurobank

Page 32
Additional Colours NOTE: Eurobank is always red (Chart 10)
Chart 7
Chart 8
Chart 9
Chart 10
Colour 11
Colour 12
Colour 13
Chart 14
Body Text in Calibri
Background
Heading Text, 1st Level Fill
Message Box, Table Highlights
Chart 1
Chart 2
Chart 3
Chart 4
Chart 5
Chart 6
157-177-207
124-179-252
24-56-132
255-255-255
39-58-124
0-176-80
192-0-0
82-76-123
170-178-203
0-78-156
103-141-197
222-221-233
255-192-0
166-166-166
179-209-224
97-91-145
128-128-128
39-58-124
Troubled Assets Group structure Strategic Objectives of TAG
Eurobank aims to provide the most efficient and effective Troubled Assets Management services in Greece by employing best-in-class strategies, systems and human capital and to significantly contribute to the Bank’s profitability, while remaining socially responsible.
The strategic objectives of TAG are the following:
Manage NPE formation through early intervention. In this context, early warning tools in conjunction with Business Units are fully used so that the below are achieved:
Shift from short-term and temporary to long-term and sustainable solutions
Development and implementation of long term modification solutions to increase viability of customers through innovative propositions
Consolidation of know-how and capabilities and increase of efficiency by segregating collateral workout management for non-cooperative and non-viable borrowers. In this respect, an appropriate mix of collections, credit and legal workout practices is utilized in order to maximize value are utilized
Deployment of appropriate dynamic strategies (including sale of portfolios and Joint Ventures (JVs)) aiming at:
Decreasing cost of risk
Reducing NPE perimeter and Risk Weighted Assets (RWAs)
Increasing pre-provision income (PPI)
State of the art structure of Trouble Assets Group & in accordance with regulatory directions
CEO
Troubled Assets Group
Deputy CEO
Collateral Recoveries Sector
TAG Risk Management & Business Policies Sector
Business Planning Sector
Retail Remedial General Division
Corporate Special Handling Sector
Eurobank FPS
Source: Eurobank

Page 33
Additional Colours NOTE: Eurobank is always red (Chart 10)
Chart 7
Chart 8
Chart 9
Chart 10
Colour 11
Colour 12
Colour 13
Chart 14
Body Text in Calibri
Background
Heading Text, 1st Level Fill
Message Box, Table Highlights
Chart 1
Chart 2
Chart 3
Chart 4
Chart 5
Chart 6
157-177-207
124-179-252
24-56-132
255-255-255
39-58-124
0-176-80
192-0-0
82-76-123
170-178-203
0-78-156
103-141-197
222-221-233
255-192-0
166-166-166
179-209-224
97-91-145
128-128-128
39-58-124
1. Achieve NPE targets and monitoring indicators
Minimize inflow to NPE
Maximize outflow from NPE (curing)
2. Upgrade our operational model in order to:
Increase modification volumes, thus increasing outflows
Reduce re-default rates
Streamline credit process, to shorten modification delivery time
3. Accelerate legal actions for non-cooperative borrowers
4. Enhance Servicer
Continue expanding offered services (all asset classes, solutions, products etc)
Review strategic options (i.e. commercial agreement)
5. Continue with Portfolio Sales
First portfolio sale successfully completed (Oct2017)
Further enhance infrastructure
TAG retail remedial key strategic priorities
Source: Eurobank

Page 34
Additional Colours NOTE: Eurobank is always red (Chart 10)
Chart 7
Chart 8
Chart 9
Chart 10
Colour 11
Colour 12
Colour 13
Chart 14
Body Text in Calibri
Background
Heading Text, 1st Level Fill
Message Box, Table Highlights
Chart 1
Chart 2
Chart 3
Chart 4
Chart 5
Chart 6
157-177-207
124-179-252
24-56-132
255-255-255
39-58-124
0-176-80
192-0-0
82-76-123
170-178-203
0-78-156
103-141-197
222-221-233
255-192-0
166-166-166
179-209-224
97-91-145
128-128-128
39-58-124
Eurobank FPS is a fully owned subsidiary established in 2006
Eurobank FPS obtained a servicer license in early 2017 and is regulated by Bank of Greece
Eurobank FPS will manage the first sold portfolio of Eurobank unsecured consumer NPLs, acquired by 3rd party fund.
Eurobank FPS manages all retail portfolios and is a profit center for the Bank
Eurobank FPS objectives are:
to enhance the capability of Eurobank to outperform SSM targets
to increase its equity value by capitalizing on opportunities in the Greek NPL market
to effectively manage ex-Eurobank portfolios acquired by 3rd parties and expand offer services to other
portfolios not originated by Eurobank
Eurobank FPS: a unique advantage
Source: Eurobank

Page 35
Additional Colours NOTE: Eurobank is always red (Chart 10)
Chart 7
Chart 8
Chart 9
Chart 10
Colour 11
Colour 12
Colour 13
Chart 14
Body Text in Calibri
Background
Heading Text, 1st Level Fill
Message Box, Table Highlights
Chart 1
Chart 2
Chart 3
Chart 4
Chart 5
Chart 6
157-177-207
124-179-252
24-56-132
255-255-255
39-58-124
0-176-80
192-0-0
82-76-123
170-178-203
0-78-156
103-141-197
222-221-233
255-192-0
166-166-166
179-209-224
97-91-145
128-128-128
39-58-124
Retail remedial employs a range of organic strategies to address NPE reduction
Action Type Description
Collections For customers that have missed some payments but still are in early
stage arrears or customers under a long-term modification
Collect missed payments from customers to prevent them from moving to non-performing
Convert active short-term modifications approaching expiry into long-term modifications based on the needs of the borrower
Collections & Conversion
Restructuring
Without value transfer
For customers with low/medium financial difficulties
Full outstanding loan balance including interest will be payed, any deferred amount is capitalized
With interest reduction For customers with medium financial difficulties
Interest is (partly) written-off
With interest and capital reduction
For customers with severe and medium/long-term financial difficulties
Outstanding loan balance and interest are partly forgiven
Closure – Collateral work-out
For customers that are not likely to return to performing status in the medium/long-term without significant cost to the Bank
Termination of existing contract to limit further losses
Overview of high-level strategies for Customer Segments
Legal actions employed to non - cooperative borrowers
Source: Eurobank

Page 36
Additional Colours NOTE: Eurobank is always red (Chart 10)
Chart 7
Chart 8
Chart 9
Chart 10
Colour 11
Colour 12
Colour 13
Chart 14
Body Text in Calibri
Background
Heading Text, 1st Level Fill
Message Box, Table Highlights
Chart 1
Chart 2
Chart 3
Chart 4
Chart 5
Chart 6
157-177-207
124-179-252
24-56-132
255-255-255
39-58-124
0-176-80
192-0-0
82-76-123
170-178-203
0-78-156
103-141-197
222-221-233
255-192-0
166-166-166
179-209-224
97-91-145
128-128-128
39-58-124
Forced liquidation process
After the Code of Conduct being applied, an extrajudicial statement for immediate payment is serviced to the debtor by bailiff
Extrajudicial Statement
Payment Order
Issuance of payment order through Court. The payment order is serviced to the debtor by bailiff
Foreclosure
Foreclosure process executed by a lawyer appointed. A Notary (“Auction employee”) is appointed. The copy of the Foreclosure Statement fixing the date of the auction (Auction Program) is uploaded in Legal Fund site. A’ Bid Price is the Market Value of the asset defined by a certified valuator (order for valuation from bailiff). Foreclosure Statement is serviced to the debtor by bailiff
Auction
The auction date is mandatory within 7 months of the Foreclosure Statement and not exceeding 8 months (new Civil Code)
Collection of Auction Proceeds
Ranking list of claims is served to the bank
Code of
Conduct
1 month 2-6 months 1 month 2-6 months 7-8 months
Time lines depend on a) Auction outcome. Repeated auctions
can take place every 30-60 days, depending on reasons that the auction was not conducted
b) Any objections on the proceeds’ ranking list
During the forced liquidation process, a settlement might take place in which a new payment schedule for the loan is agreed
Source: Code of Conduct is applied to initiate Forced liquidation process, the rest according to Eurobank’s Policy

Eurobank Global Covered Bond Programme I

Page 38
Additional Colours NOTE: Eurobank is always red (Chart 10)
Chart 7
Chart 8
Chart 9
Chart 10
Colour 11
Colour 12
Colour 13
Chart 14
Body Text in Calibri
Background
Heading Text, 1st Level Fill
Message Box, Table Highlights
Chart 1
Chart 2
Chart 3
Chart 4
Chart 5
Chart 6
157-177-207
124-179-252
24-56-132
255-255-255
39-58-124
0-176-80
192-0-0
82-76-123
170-178-203
0-78-156
103-141-197
222-221-233
255-192-0
166-166-166
179-209-224
97-91-145
128-128-128
39-58-124
Summary of the programme
Source: Base Prospectus “Eurobank Ergasias S.A. €5 billion Global Covered Bond Programme I” approved on 5th October 2017, Moody’s, ECB
Note: (1) Net Present Value Test and Interest Cover Test performed on a monthly basis at Eurobank discretion, contractually to be run quarterly
Issuer/Originator/Servicer Eurobank Ergasias S.A.
Issuer Ratings RD/Caa3/CCC+ (Fitch/Moody’s/S&P)
Covered Bond Rating B3 [Expected] (Moody’s)
Programme Size EUR 5.0bn
Cover Pool Prime Greek residential mortgage loans (100%)
Max. LTV 80%, to be applied for calculations on tests
Segregation of collateral Collateral is ring-fenced on the Balance Sheet of the Issuer for the benefit of Covered Bondholders and other secured parties pursuant to the Greek Covered Bond Law
Committed over-collateralisation 25%, contractual minimum
Tests Statutory tests are to be run monthly or quarterly1 to ensure sufficient programme support
Amortisation test to be run monthly post-Issuer Event
Extension Format Conditional Pass-Through (CPT)
Listing Luxembourg Stock Exchange
Asset Monitor Deloitte Certified Public Accountants S.A.
Representative of CB holders The Bank of New York Mellon (International) Limited
Arranger Barclays Bank PLC
CBPP3 Structured with the objective to comply with all the conditions required by CBPP3. ECB determination on eligibility remains independent upon/post issuance
Governing Law Contractual terms will be governed by English law / Greek Law / Greek Covered Bond Law
Investor Reporting Monthly, available on Eurobank’s website https://www.eurobank.gr/online/home/viewServices.aspx?id=382&mid=636&lang=en

Page 39
Additional Colours NOTE: Eurobank is always red (Chart 10)
Chart 7
Chart 8
Chart 9
Chart 10
Colour 11
Colour 12
Colour 13
Chart 14
Body Text in Calibri
Background
Heading Text, 1st Level Fill
Message Box, Table Highlights
Chart 1
Chart 2
Chart 3
Chart 4
Chart 5
Chart 6
157-177-207
124-179-252
24-56-132
255-255-255
39-58-124
0-176-80
192-0-0
82-76-123
170-178-203
0-78-156
103-141-197
222-221-233
255-192-0
166-166-166
179-209-224
97-91-145
128-128-128
39-58-124
Covered bond structure
Source: Base Prospectus “Eurobank Ergasias S.A. €5 billion Global Covered Bond Programme I” approved on 5th October 2017, Moody’s
Note: (1) if required
(Issuer/
Originator/Servicer) Covered Bond Investors
Covered Bonds 1
Covered Bond Proceeds
Oversight 4
Monitoring
Asset Monitor
3
Cover Pool
Swap Counterparty Covered Bond Swap1
2 Interest Rate Swap1
Eurobank’s Global Covered Bond Programme I uses the direct issuance structure allowed under the Greek Covered Bond Law (Article 152 of Law 4261/2014 and secondary legislation)
The assets constituting the Cover Pool will be segregated from Eurobank’s remaining assets with no need to transfer the Cover Pool to a separate entity:
The Cover Pool will be encumbered by a statutory pledge in favour of the Covered Bondholders
The Covered Bondholders benefit from dual recourse both to the Cover Pool assets and to Eurobank
Eurobank will continue to service the portfolio
Eurobank sells the Covered Bonds in the market and receives net proceeds from investors
Issuance and Segregation of Assets 1
Monitoring 3
The Asset Monitor confirms compliance with the Statutory Tests on a monthly or quarterly basis depending on the test. Following an Issuer Event, the Amortisation Test, is tested on a monthly basis .
Oversight 4
Eurobank may enter into swap agreements with external counterparties
The swaps are designed to hedge Eurobank from interest rate and / or currency risk arising from mismatches between the amounts earned on the mortgage loans included in the Cover Pool and the amounts payable with respect to the Covered Bonds
Hedging 2
The Bank of Greece oversees the Covered Bond structure and the application of the relevant legislative framework

Page 40
Additional Colours NOTE: Eurobank is always red (Chart 10)
Chart 7
Chart 8
Chart 9
Chart 10
Colour 11
Colour 12
Colour 13
Chart 14
Body Text in Calibri
Background
Heading Text, 1st Level Fill
Message Box, Table Highlights
Chart 1
Chart 2
Chart 3
Chart 4
Chart 5
Chart 6
157-177-207
124-179-252
24-56-132
255-255-255
39-58-124
0-176-80
192-0-0
82-76-123
170-178-203
0-78-156
103-141-197
222-221-233
255-192-0
166-166-166
179-209-224
97-91-145
128-128-128
39-58-124
1. An Issuer Insolvency Event
2. Failure to pay any amount of principal (including the Final Redemption Amount on the Final Maturity Date) / interest due and payable on the Covered Bonds of any Series within 7 Athens Business Days
3. Default in the performance or observance of any of its other obligations which is not remedied for 30 days after written notice by the Trustee
4. The repayment of any indebtedness owing by the Issuer is accelerated by reason of default, or the Issuer defaults in any payment of any indebtedness or in the honouring of any guarantee or indemnity in respect of any indebtedness subject to certain thresholds
5. Breach of a Statutory Test on an Applicable Calculation Date and such breach is not remedied within 5 Athens Business Days
Issuer event Events of default
1. On the Extended Final Maturity Date, failure to pay any amount of principal due, which is not remedied within a period of 7 days
2. On any Interest Payment Date, default in the payment of the amount of interest due, which is not remedied within a period of 14 days
Issuer events and events of default
Source: Base Prospectus “Eurobank Ergasias S.A. €5 billion Global Covered Bond Programme I” approved on 5th October 2017 and Supplement as of 16th October 2017
1. No further Covered Bond will be issued
2. Any and all payments due under the Cover Pool Assets are effected directly to the Transaction Account
3. All collections of principal and interest on the Cover Pool Assets will be dedicated exclusively to the payment of interest and repayment of principal on the Covered Bonds and of the obligations of the Issuer vis-à-vis the Secured Creditors
4. If Eurobank is the Servicer, its appointment as Servicer will be terminated
5. The Servicer or Replacement Servicer will be required to try to sell Selected Loans
1. The Trustee serves a notice of Default on the Issuer
2. Following the service of a Notice of Default, the Covered Bonds of each Series become immediately due and payable
3. The Trustee is entitled to take steps to enforce the security

Page 41
Additional Colours NOTE: Eurobank is always red (Chart 10)
Chart 7
Chart 8
Chart 9
Chart 10
Colour 11
Colour 12
Colour 13
Chart 14
Body Text in Calibri
Background
Heading Text, 1st Level Fill
Message Box, Table Highlights
Chart 1
Chart 2
Chart 3
Chart 4
Chart 5
Chart 6
157-177-207
124-179-252
24-56-132
255-255-255
39-58-124
0-176-80
192-0-0
82-76-123
170-178-203
0-78-156
103-141-197
222-221-233
255-192-0
166-166-166
179-209-224
97-91-145
128-128-128
39-58-124
Statutory tests and amortisation test
The Euro Equivalent of the Principal Amount Outstanding of all Series of Covered Bonds, together with all accrued interest, is not greater than 80% of the Nominal value of the Cover Pool as at the last calendar day of the immediately preceding calendar month
In order to assess compliance with this test, all of the assets comprising the Cover Pool are evaluated at their nominal value plus accrued interest, but not including the Hedging Agreements
Nominal Value Test (Monthly)
Net Present Value
Test (Quarterly1)
The Issuer must ensure that on each Applicable Calculation Date the net present value of liabilities under the Covered Bonds outstanding is less than or equal to the Net Present Value of the Cover Pool as at the last calendar day of the immediately preceding calendar month, including the Hedging Agreements
The test must also be satisfied under the assumption of parallel shifts of the yield curve by 200 basis points
In addition, the Issuer must ensure that on each Applicable Calculation Date, the net present value of the Hedging Agreements are in aggregate less than or equal to 15% of the nominal value (being principal) of the Covered Bonds
Interest Cover Test
(Quarterly1)
On each Applicable Calculation Date the Issuer must ensure that the amount of interest due on the Covered Bonds does not exceed the amount of interest expected in respect of the Loans comprised in the Cover Pool (subject to certain exclusions), including any Interest Rate Swap and any Covered Bond Swaps, in each case, during the period of 12 months from such Applicable Calculation Date
The Nominal Value of the Cover Pool must be in an amount at least equal to the sum of the Euro Equivalent of the aggregate Principal Amount Outstanding of the Covered Bonds plus an amount equal to product of:
the Euro Equivalent of the aggregate Principal Amount Outstanding of the Covered Bonds, and
the Amortisation Test OC Level as calculated on the last day of the immediately preceding calendar month
Amortization Test (Monthly)
Pri
or
to Is
su
er
Eve
nt
Po
st
Issu
er
Eve
nt
Source: Base Prospectus “Eurobank Ergasias S.A. €5 billion Global Covered Bond Programme I” approved on 5th October 2017
Note: (1) Performed on a monthly basis at Eurobank discretion, contractually to be run quarterly
breach

Page 42
Additional Colours NOTE: Eurobank is always red (Chart 10)
Chart 7
Chart 8
Chart 9
Chart 10
Colour 11
Colour 12
Colour 13
Chart 14
Body Text in Calibri
Background
Heading Text, 1st Level Fill
Message Box, Table Highlights
Chart 1
Chart 2
Chart 3
Chart 4
Chart 5
Chart 6
157-177-207
124-179-252
24-56-132
255-255-255
39-58-124
0-176-80
192-0-0
82-76-123
170-178-203
0-78-156
103-141-197
222-221-233
255-192-0
166-166-166
179-209-224
97-91-145
128-128-128
39-58-124
Other structural features
Source: Base Prospectus “Eurobank Ergasias S.A. €5 billion Global Covered Bond Programme I” approved on 5th October 2017 and Supplement as of 16th October 2017, Greek Covered Bond Secondary Law
This is sized to cover interest payments due on the Covered Bonds, all amounts to be paid to a Covered Bond Swap Provider and all amounts paid to other Secured Creditors for the immediately following 12 month period
Fully funded on day one
Following an Issuer Event, if funds are available, payments due on outstanding Covered Bonds due in the next 6 months will be funded in the Accumulation Ledger
Following an Issuer Event of Default
An Eligible Institution, meaning any bank with a short-term, unsecured, unsubordinated and unguaranteed debt obligation of at least P-1 by Moody’s
If the Account Bank ceases to have such rating, unless the Account Bank’s rating rises to P-1 within 30 calendar days, the Bank Account Agreement will be terminated in respect of the Account Bank, the Bank Accounts will be closed and all amounts transferred to accounts held with a bank with an eligible rating
Eurobank will be the servicer of the cover pool
If Eurobank is the Servicer, in case of an Issuer Event its appointment as Servicer will be terminated and a new servicer will be appointed pursuant to the terms of the Servicing and Cash Management Deed and the Covered Bond Legislation
Eurobank may, from time to time, enter into hedging agreements with various swap providers to hedge certain interest rate risk on the cover pool (each an Interest Rate Swap Provider) or enter into hedging agreements associated with interest or/and currency risks associated with the Covered Bonds.
As set out in the Greek Covered Bond Secondary Law: - Hedging counterparty is a EU Member - Credit rating is considered by the Bank of Greece as equivalent to the highest credit quality step
Reserve Ledger
Account Bank
Servicer
IRS / CB Swaps
Description Trigger
Accumulation Ledger

Page 43
Additional Colours NOTE: Eurobank is always red (Chart 10)
Chart 7
Chart 8
Chart 9
Chart 10
Colour 11
Colour 12
Colour 13
Chart 14
Body Text in Calibri
Background
Heading Text, 1st Level Fill
Message Box, Table Highlights
Chart 1
Chart 2
Chart 3
Chart 4
Chart 5
Chart 6
157-177-207
124-179-252
24-56-132
255-255-255
39-58-124
0-176-80
192-0-0
82-76-123
170-178-203
0-78-156
103-141-197
222-221-233
255-192-0
166-166-166
179-209-224
97-91-145
128-128-128
39-58-124
Conditional pass-through mechanism Eurobank’s CPT structure is akin to the Dutch CPT structures
Post Issuer Event tests
6
mo
nth
s
Timely payment of principal and interest by the Issuer
Full Redemption of Principal
Final Maturity Date
The Servicer attempts to sell selected loans on / before the First Refinance Date and on / before each following Refinance Date
No sale below the ARRA1 will be permitted
All cash-flows received by the cover pool are directed into a Third Party Collection Account and transferred to a Transaction Account within one day
Servicer makes payments on each Cover Pool Payment Date according to the Pre Event of Default Priority of Payments using all the funds in the Transaction Account
First Refinance Date
Extended Final Maturity Date
Exte
nsi
on
Pe
rio
d
Ori
gin
al T
en
or
Amortization of Cover Pool
Sale of Selected Loans not less than ARRA
Amortization Test
Issuer Event
Payment on principal and interest due subject to availability of funds
Full Redemption of pass-through bonds
Cover Pool Event of Default
Sufficient Proceeds = Yes Sufficient Proceeds = No
Issue Date
Affected Series becomes pass-through
All Series become Pass-Through Covered Bonds
Pass-Through Covered Bond Fail
No Yes
Source: Base Prospectus “Eurobank Ergasias S.A. €5 billion Global Covered Bond Programme I” approved on 5th October 2017 and Supplement as of 16th October 2017 1. Adjusted Required Redemption Amount (ARRA): the Euro Equivalent of the Required Redemption Amount plus swap termination amounts payable under any Covered Bond Swap Agreement and under any Interest Rate Agreement and reasonable costs & expenses associated with sale of selected loans and of the Portfolio Manager connected with the sale of assets.
The Servicer appoints a Portfolio Manager
The Portfolio Manager attempts to sell assets as quickly as reasonably practicable
Servicer Termination Event
Any non payment by the Issuer is a payment default
Trigger of cross default provisions for the Issuer
Pass
All other Outstanding Bonds do not switch to Pass-Through

Page 44
Additional Colours NOTE: Eurobank is always red (Chart 10)
Chart 7
Chart 8
Chart 9
Chart 10
Colour 11
Colour 12
Colour 13
Chart 14
Body Text in Calibri
Background
Heading Text, 1st Level Fill
Message Box, Table Highlights
Chart 1
Chart 2
Chart 3
Chart 4
Chart 5
Chart 6
157-177-207
124-179-252
24-56-132
255-255-255
39-58-124
0-176-80
192-0-0
82-76-123
170-178-203
0-78-156
103-141-197
222-221-233
255-192-0
166-166-166
179-209-224
97-91-145
128-128-128
39-58-124
Factors Greece
Eligible Issuers
Universal credit institution or Special Purpose Entities (SPE)
Having Greece or another EEA country as home member state
Satisfying certain minimum risk management and internal control requirements
Having an aggregate regulatory capital of at least EUR500mn
Having a capital adequacy ratio of at least 9%
Issuance Structures 1. Direct issuance by the credit institution which maintains ownership of the cover pool
2. Direct issuance by the credit institution and guarantee by an SPE which acquires ownership of the cover pool
3. Issuance by an SPE which acquires ownership of the cover pool, while the credit institution provides a guarantee
Collateral Type
Greek Residential mortgage loans
Greek Commercial mortgage loans
Shipping loans
Loans granted to / guaranteed by government bodies
Government issued securities
Other highly rated securities
[Derivatives to hedge IR, FX or liquidity risk]
Segregation of Collateral Ring fence on Issuer’s balance sheet (statutory pledge) or SPV
Repayment Soft Bullet / Conditional Pass Through
LTV Limits1
80% residential
60% commercial
60% ships
[Soft limit – loans with a higher LTV ratio are eligible but only the amount up to the LTV cap will be taken into account for Statutory Tests]
Protection Against Mismatching Coverage by nominal value and by NPV. Specific coverage of interest rate cash flows through interest cover test
Mandatory Over-collateralisation 5%
Voluntary Over-collateralisation is Protected Yes
Set-off risk The claims constituting cover assets are not subject to set-off
Fulfils UCITS 52(4) Yes (no indirect structure)
ECB CBPP3 Yes (subject to additional criteria)
Greek covered bond legislative framework
Source: Article 152 of Law 4261/2014 and Bank of Greece Act nr. 2620/28.8.2009 1. Valuation of properties must be performed every 12 months for commercial properties and every 3 years for residential properties .
Article 152 of Law 4261/2014 and Bank of Greece Act nr. 2620/28.8.2009

Page 45
Additional Colours NOTE: Eurobank is always red (Chart 10)
Chart 7
Chart 8
Chart 9
Chart 10
Colour 11
Colour 12
Colour 13
Chart 14
Body Text in Calibri
Background
Heading Text, 1st Level Fill
Message Box, Table Highlights
Chart 1
Chart 2
Chart 3
Chart 4
Chart 5
Chart 6
157-177-207
124-179-252
24-56-132
255-255-255
39-58-124
0-176-80
192-0-0
82-76-123
170-178-203
0-78-156
103-141-197
222-221-233
255-192-0
166-166-166
179-209-224
97-91-145
128-128-128
39-58-124
1. Existing Loans, denominated in Euro and owned by individual borrowers
2. Governed by Greek law
3. Secured by a valid and enforceable first ranking mortgage and / or mortgage pre-notation over completed residential property located in Greece
If the mortgage and / or mortgage pre-notation is of lower ranking, the loans that rank higher have also been originated by the Issuer and are included in the Cover Pool
4. Purpose of the loan is to buy, construct or renovate a property or refinance a loan granted by another bank for one of these purposes
5. Only completed properties secure the Loan
6. Fixed or floating rate or a combination of both
7. The total Euro Equivalent Outstanding Principal Balance of any Loans on the date of addition to the Cover Pool does not exceed 1% of the aggregate Outstanding Principal Balance of all Loans
8. Not a subsidised loan
9. Not a loan made to employees of Eurobank
10. Has not been subjected to a restructuring
Covered bond eligibility criteria
Certain Individual Eligibility Criteria
Source: Base Prospectus “Eurobank Ergasias S.A. €5 billion Global Covered Bond Programme I” approved on 5th October 2017
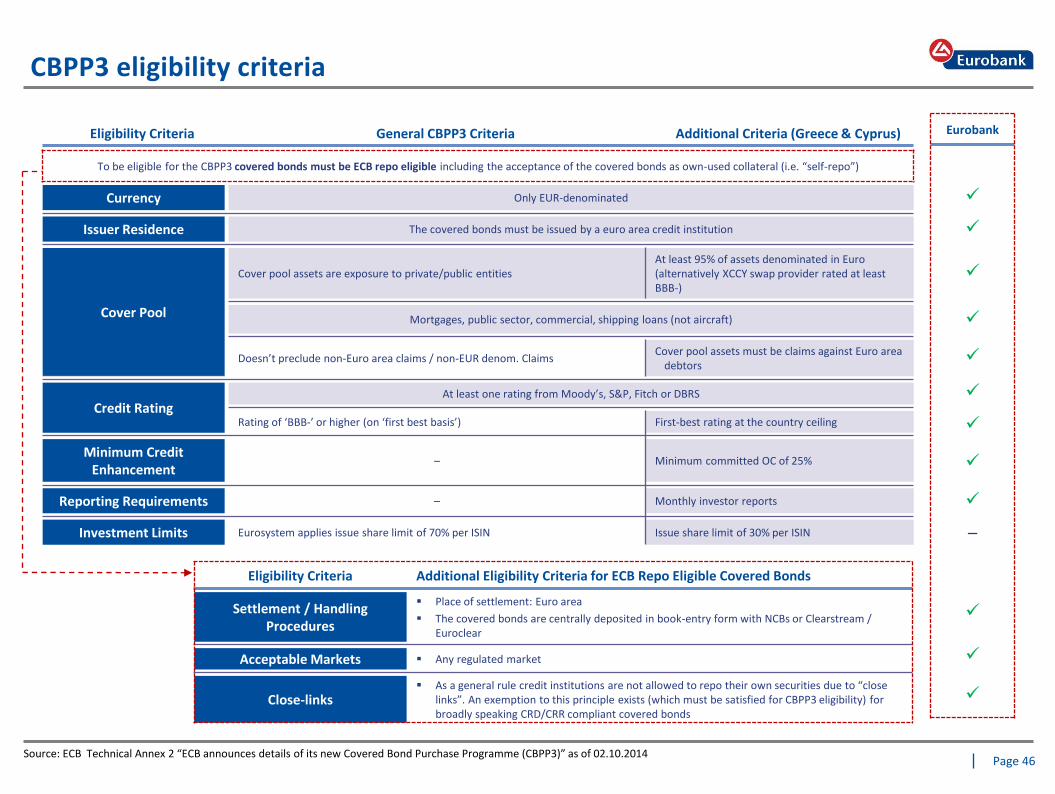
Page 46
Additional Colours NOTE: Eurobank is always red (Chart 10)
Chart 7
Chart 8
Chart 9
Chart 10
Colour 11
Colour 12
Colour 13
Chart 14
Body Text in Calibri
Background
Heading Text, 1st Level Fill
Message Box, Table Highlights
Chart 1
Chart 2
Chart 3
Chart 4
Chart 5
Chart 6
157-177-207
124-179-252
24-56-132
255-255-255
39-58-124
0-176-80
192-0-0
82-76-123
170-178-203
0-78-156
103-141-197
222-221-233
255-192-0
166-166-166
179-209-224
97-91-145
128-128-128
39-58-124
CBPP3 eligibility criteria
Eligibility Criteria General CBPP3 Criteria Additional Criteria (Greece & Cyprus)
To be eligible for the CBPP3 covered bonds must be ECB repo eligible including the acceptance of the covered bonds as own-used collateral (i.e. “self-repo”)
Currency Only EUR-denominated
Issuer Residence The covered bonds must be issued by a euro area credit institution
Cover Pool
Cover pool assets are exposure to private/public entities At least 95% of assets denominated in Euro (alternatively XCCY swap provider rated at least BBB-)
Mortgages, public sector, commercial, shipping loans (not aircraft)
Doesn’t preclude non-Euro area claims / non-EUR denom. Claims Cover pool assets must be claims against Euro area
debtors
Credit Rating At least one rating from Moody’s, S&P, Fitch or DBRS
Rating of ‘BBB-’ or higher (on ‘first best basis’) First-best rating at the country ceiling
Minimum Credit Enhancement
– Minimum committed OC of 25%
Reporting Requirements – Monthly investor reports
Investment Limits Eurosystem applies issue share limit of 70% per ISIN Issue share limit of 30% per ISIN
Eligibility Criteria Additional Eligibility Criteria for ECB Repo Eligible Covered Bonds
Settlement / Handling Procedures
Place of settlement: Euro area
The covered bonds are centrally deposited in book-entry form with NCBs or Clearstream / Euroclear
Acceptable Markets Any regulated market
Close-links As a general rule credit institutions are not allowed to repo their own securities due to “close
links”. An exemption to this principle exists (which must be satisfied for CBPP3 eligibility) for broadly speaking CRD/CRR compliant covered bonds
Eurobank
–
Source: ECB Technical Annex 2 “ECB announces details of its new Covered Bond Purchase Programme (CBPP3)” as of 02.10.2014

Page 47
Additional Colours NOTE: Eurobank is always red (Chart 10)
Chart 7
Chart 8
Chart 9
Chart 10
Colour 11
Colour 12
Colour 13
Chart 14
Body Text in Calibri
Background
Heading Text, 1st Level Fill
Message Box, Table Highlights
Chart 1
Chart 2
Chart 3
Chart 4
Chart 5
Chart 6
157-177-207
124-179-252
24-56-132
255-255-255
39-58-124
0-176-80
192-0-0
82-76-123
170-178-203
0-78-156
103-141-197
222-221-233
255-192-0
166-166-166
179-209-224
97-91-145
128-128-128
39-58-124
Cover pool characteristics (1/3)
Preliminary Mortgage Pool Summary Seasoning(1)
Origination Year(1)
As of 30.09.2017 Currency: EUR
Aggregate Original Principal Outstanding Balance (mn) 1,015.5
Aggregate Current Principal Outstanding Balance (mn) 694.5
Average Current Principal Outstanding Balance 54,856
Average Original Principal Outstanding Balance 80,207.7
Number of loans 12,661
Weighted average seasoning (y) 8.2
Weighted average current Index LTV (%) 65.1
Weighted average original LTV (%) 60.3
Outstanding Principal of Performing Current Loans (%) 90.1
Outstanding Principal of Performing Loans – 0-29 dpd (%) 9.9
2.8% 4.4% 4.7%
7.9%
36.0%
44.2%
0 - 12 12 - 24 24 - 36 36 - 60 60 - 96 over 96
in months
1. As a % of Outstanding Principal Amount Source: Eurobank [(https://www.eurobank.gr/online/home/viewServices.aspx?id=382&mid=636&lang=en)]
0.0
%
0.0
%
0.2
%
0.4
%
0.6
%
1.5
%
1.2
%
1.6
%
2.0
%
5.8
%
10
.1%
9.6
%
4.1
%
2.7
%
6.4
%
14
.2%
14
.3%
6.6
%
4.3
%
3.9
%
4.5
%
4.6
%
1.4
%
W.A. Seasoning: 8.2 years
0.9%
10.1%
19.6%
23.5%
19.1%
16.8%
9.9%
2016 - 2020 2021 - 2025 2026 - 2030 2031 - 2035 2036 - 2040 2041 - 2045 2046 +
Maturity Date(1)
W.A. Remaining Maturity: 17.9 years

Page 48
Additional Colours NOTE: Eurobank is always red (Chart 10)
Chart 7
Chart 8
Chart 9
Chart 10
Colour 11
Colour 12
Colour 13
Chart 14
Body Text in Calibri
Background
Heading Text, 1st Level Fill
Message Box, Table Highlights
Chart 1
Chart 2
Chart 3
Chart 4
Chart 5
Chart 6
157-177-207
124-179-252
24-56-132
255-255-255
39-58-124
0-176-80
192-0-0
82-76-123
170-178-203
0-78-156
103-141-197
222-221-233
255-192-0
166-166-166
179-209-224
97-91-145
128-128-128
39-58-124
3.6%
6.9%
10.1% 11.4%
12.5% 14.0% 13.2%
28.4%
0.00% -20.00%
20.01% -30.00%
30.01% -40.00%
40.01% -50.00%
50.01% -60.00%
60.01% -70.00%
70.01% -80.00%
80.01% +
2.1%
5.2%
9.8%
13.7%
18.4%
20.2% 18.5%
12.1%
0.00% -20.00%
20.01% -30.00%
30.01% -40.00%
40.01% -50.00%
50.01% -60.00%
60.01% -70.00%
70.01% -80.00%
80.01% +
Cover pool characteristics (2/3)
Original Loan to Value(1) Current Loan to Value(1)
Real Estate type(1) Location of Property(1)
W.A. Original Loan to Value: 60.3%
45
.2%
12
.8%
10
.3%
6.5
%
6.0
%
4.9
%
3.6
%
3.6
%
3.1
%
2.3
%
1.6
%
W.A. Current Loan to Value: 65.1%
Flats 72.8%
Houses 27.2%
1. As a % of Outstanding Principal Amount
Source: Eurobank [(https://www.eurobank.gr/online/home/viewServices.aspx?id=382&mid=636&lang=en)], Moody’s
Owner-occupied
90.8%
Vacation/Second home 7.2%
Other 1.9%

Page 49
Additional Colours NOTE: Eurobank is always red (Chart 10)
Chart 7
Chart 8
Chart 9
Chart 10
Colour 11
Colour 12
Colour 13
Chart 14
Body Text in Calibri
Background
Heading Text, 1st Level Fill
Message Box, Table Highlights
Chart 1
Chart 2
Chart 3
Chart 4
Chart 5
Chart 6
157-177-207
124-179-252
24-56-132
255-255-255
39-58-124
0-176-80
192-0-0
82-76-123
170-178-203
0-78-156
103-141-197
222-221-233
255-192-0
166-166-166
179-209-224
97-91-145
128-128-128
39-58-124
19.9%
38.4%
15.7% 15.6%
7.6%
2.8% 0.1%
0 - 37.500 37.501 - 75.000 75.001 - 100.000 100.001 -150.000
150.001 -250.000
250.001 -500.000
500.001 +
Average Current Principal Outstanding Balance: 54,856
Cover pool characteristics (3/3)
Loan Purpose and Delinquencies(1) Loan Interest Rate(1)
Outstanding Notional Amount(1) Interest and Index Payment Type(1)
Purchase 63.1%
Repair 12.7%
Re-mortgage
1.2%
Floating 96.6%
Fixed Converting to Floating
3.1%
Fixed to Maturity
0.4%
1. As a % of Outstanding Principal Amount
Source: Eurobank [(https://www.eurobank.gr/online/home/viewServices.aspx?id=382&mid=636&lang=en)]
16.4%
33.6%
26.1%
18.2%
5.4%
0.4% 0.0%
1.01% - 2.00% 2.01% - 3.00% 3.01% - 4.00% 4.01% - 5.00% 5.01% - 6.00% 6.01% - 7.00% 7.01% +
Weighted average Interest Rate: 3.2%
Construction 23.0%
Euribor 3 Months 61.4%
ECB Tracker 19.7%
Originator Rate
17.4%
Other 1.5%
Performing - Current
90.1%
Perfoming - 0-29 dpd
9.9%

Page 50
Additional Colours NOTE: Eurobank is always red (Chart 10)
Chart 7
Chart 8
Chart 9
Chart 10
Colour 11
Colour 12
Colour 13
Chart 14
Body Text in Calibri
Background
Heading Text, 1st Level Fill
Message Box, Table Highlights
Chart 1
Chart 2
Chart 3
Chart 4
Chart 5
Chart 6
157-177-207
124-179-252
24-56-132
255-255-255
39-58-124
0-176-80
192-0-0
82-76-123
170-178-203
0-78-156
103-141-197
222-221-233
255-192-0
166-166-166
179-209-224
97-91-145
128-128-128
39-58-124
Appendix I – Macroeconomic Update

Page 51
Additional Colours NOTE: Eurobank is always red (Chart 10)
Chart 7
Chart 8
Chart 9
Chart 10
Colour 11
Colour 12
Colour 13
Chart 14
Body Text in Calibri
Background
Heading Text, 1st Level Fill
Message Box, Table Highlights
Chart 1
Chart 2
Chart 3
Chart 4
Chart 5
Chart 6
157-177-207
124-179-252
24-56-132
255-255-255
39-58-124
0-176-80
192-0-0
82-76-123
170-178-203
0-78-156
103-141-197
222-221-233
255-192-0
166-166-166
179-209-224
97-91-145
128-128-128
39-58-124
Key points and summary of views
Recent macro & market developments
Real output grew by 0.6% YoY in H1 2017, after remaining broadly stagnant in the last couple of years
Private consumption currently the main growth driver; investment has yet to record a meaningful recovery
Jobless rate at a 67-month low in June 2017 (21.2%), with employment growing by 2.4% in Q2 2017
FY-2016 primary surplus at 4.2% of GDP, significantly outperforming the respective program target (0.5%)
Following the successful completion of the 2nd program review:
The10-year GGB/Bund yield spread narrowed in mid-July to its lowest level since September 2014
The Hellenic Republic re-accessed markets for the first time since 2014 (€3bn 5-year bond; yield: 4.625%)
ASE hit in mid-July its highest level in 2-½ years; ASE index y-t-d performance: +16.7%
FY-2017 outlook
Completion of 2nd review and strong tourism season support expectations for a further improvement in domestic economic activity in the coming quarters
Full-year GDP growth now seen coming at around 1.5%, the fastest rate in the last decade
Budget execution and positive carry over support attainability of this year’s primary surplus target (1.75%)
Domestic systemic banks expected to meet operational target for 7.2% reduction in NPE stock this year
Source: ELSTAT, Bloomberg, Minfin.gr

Page 52
Additional Colours NOTE: Eurobank is always red (Chart 10)
Chart 7
Chart 8
Chart 9
Chart 10
Colour 11
Colour 12
Colour 13
Chart 14
Body Text in Calibri
Background
Heading Text, 1st Level Fill
Message Box, Table Highlights
Chart 1
Chart 2
Chart 3
Chart 4
Chart 5
Chart 6
157-177-207
124-179-252
24-56-132
255-255-255
39-58-124
0-176-80
192-0-0
82-76-123
170-178-203
0-78-156
103-141-197
222-221-233
255-192-0
166-166-166
179-209-224
97-91-145
128-128-128
39-58-124
Economic activity is recovering after the mid-2015 crisis
Gross Domestic Product Private Consumption Government Consumption
Investment Exports of Goods & Services Imports of Goods & Services
Source: ELSTAT, Eurobank Research

Page 53
Additional Colours NOTE: Eurobank is always red (Chart 10)
Chart 7
Chart 8
Chart 9
Chart 10
Colour 11
Colour 12
Colour 13
Chart 14
Body Text in Calibri
Background
Heading Text, 1st Level Fill
Message Box, Table Highlights
Chart 1
Chart 2
Chart 3
Chart 4
Chart 5
Chart 6
157-177-207
124-179-252
24-56-132
255-255-255
39-58-124
0-176-80
192-0-0
82-76-123
170-178-203
0-78-156
103-141-197
222-221-233
255-192-0
166-166-166
179-209-224
97-91-145
128-128-128
39-58-124
Source: ELSTAT, Eurostat, Eurobank Research
Progress on Economy and Labor Market Employment Improving and Record Tourism Revenue
Unemployment rate: still elevated despite recent declines
27.9% in July 2013
21.2% in June 2017
-2.3 ppts Annual
Change
Employment: positive contribution to GDP growth
International arrivals and receipts, Jan-Jul 2015 to 2017 Tourism revenue: rising contribution to GDP growth
Jan – Jul 2017 tourism revenues up 6.7%YoY

Page 54
Additional Colours NOTE: Eurobank is always red (Chart 10)
Chart 7
Chart 8
Chart 9
Chart 10
Colour 11
Colour 12
Colour 13
Chart 14
Body Text in Calibri
Background
Heading Text, 1st Level Fill
Message Box, Table Highlights
Chart 1
Chart 2
Chart 3
Chart 4
Chart 5
Chart 6
157-177-207
124-179-252
24-56-132
255-255-255
39-58-124
0-176-80
192-0-0
82-76-123
170-178-203
0-78-156
103-141-197
222-221-233
255-192-0
166-166-166
179-209-224
97-91-145
128-128-128
39-58-124
Greek Real Estate Prices Evolution
Apartments Prices by Geographical Area Apartments Prices by Age
Continuous decline of Real Estate prices over the last 8 years.
Yet, there is a clear evidence of a declining pace in prices drop.
Index 2007 = 100 Index 2007 = 100
Source: Bank of Greece
* Provisional Data

Page 55
Additional Colours NOTE: Eurobank is always red (Chart 10)
Chart 7
Chart 8
Chart 9
Chart 10
Colour 11
Colour 12
Colour 13
Chart 14
Body Text in Calibri
Background
Heading Text, 1st Level Fill
Message Box, Table Highlights
Chart 1
Chart 2
Chart 3
Chart 4
Chart 5
Chart 6
157-177-207
124-179-252
24-56-132
255-255-255
39-58-124
0-176-80
192-0-0
82-76-123
170-178-203
0-78-156
103-141-197
222-221-233
255-192-0
166-166-166
179-209-224
97-91-145
128-128-128
39-58-124
At December 2016, the Greek residential mortgage
loan outstanding balances reached €61.0bn, or 35% of
GDP, compared to €68 bn and 38% of GDP as of
EOY2015.
As new loan production remains at current levels
market outstanding balances will keep decreasing,
yet at a decelerating pace.
2017 seems to provide some market opportunities as:
• There is a real GDP forecast for 2017 within
1.5%-1.8% range
• The continuous drop in real estate prices
creates significant buying opportunities
Source: Bank of Greece, Hellenic Statistical Authority, Eurostat, Budesbank
Greek Residential Mortgage Market Evolution
Greek Mortgage Lending Market Outstanding Balances (€bn)
% of GDP
* Over 2016, €3.6bn of market lending balances have been reclassified to General Government
European Mortgage: Market size as % of GDP, 2016 (ESA 2010)
Greek Mortgage Lending Market stands very close
to the European Average.

Page 56
Additional Colours NOTE: Eurobank is always red (Chart 10)
Chart 7
Chart 8
Chart 9
Chart 10
Colour 11
Colour 12
Colour 13
Chart 14
Body Text in Calibri
Background
Heading Text, 1st Level Fill
Message Box, Table Highlights
Chart 1
Chart 2
Chart 3
Chart 4
Chart 5
Chart 6
157-177-207
124-179-252
24-56-132
255-255-255
39-58-124
0-176-80
192-0-0
82-76-123
170-178-203
0-78-156
103-141-197
222-221-233
255-192-0
166-166-166
179-209-224
97-91-145
128-128-128
39-58-124
Appendix II – Legal Framework Comparison
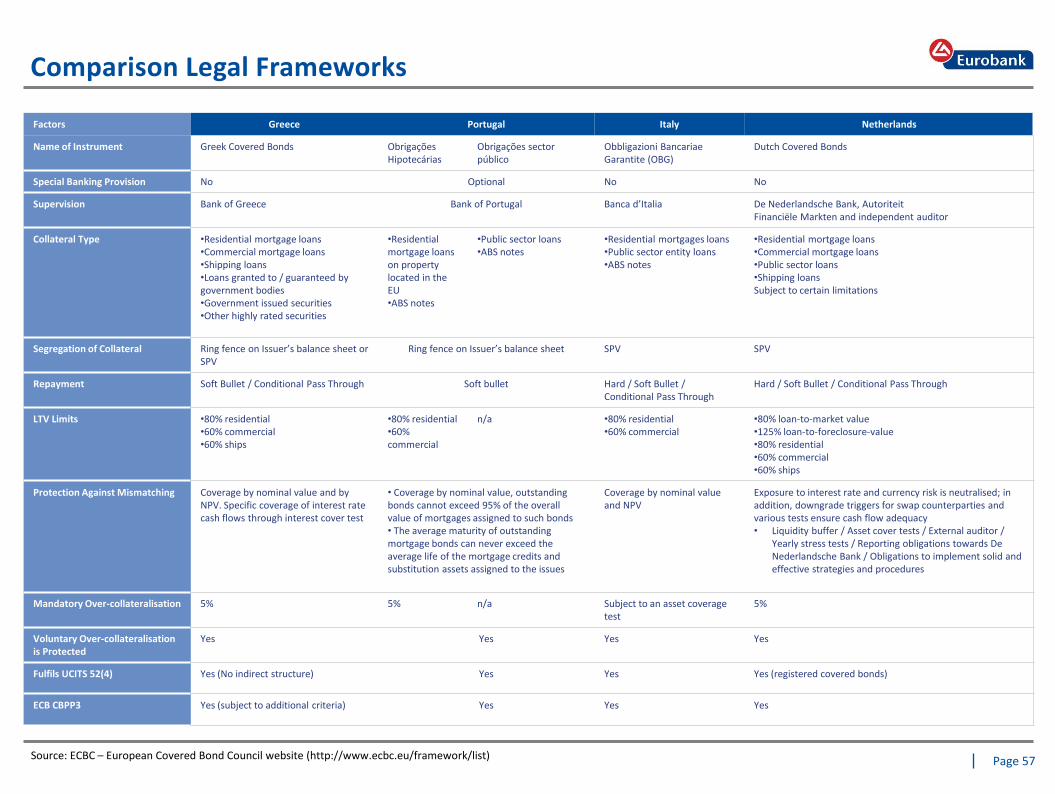
Page 57
Additional Colours NOTE: Eurobank is always red (Chart 10)
Chart 7
Chart 8
Chart 9
Chart 10
Colour 11
Colour 12
Colour 13
Chart 14
Body Text in Calibri
Background
Heading Text, 1st Level Fill
Message Box, Table Highlights
Chart 1
Chart 2
Chart 3
Chart 4
Chart 5
Chart 6
157-177-207
124-179-252
24-56-132
255-255-255
39-58-124
0-176-80
192-0-0
82-76-123
170-178-203
0-78-156
103-141-197
222-221-233
255-192-0
166-166-166
179-209-224
97-91-145
128-128-128
39-58-124
Comparison Legal Frameworks
Factors Greece Portugal Italy Netherlands
Name of Instrument Greek Covered Bonds Obrigações Hipotecárias
Obrigações sector público
Obbligazioni Bancariae Garantite (OBG)
Dutch Covered Bonds
Special Banking Provision No Optional No No
Supervision Bank of Greece Bank of Portugal Banca d’Italia De Nederlandsche Bank, Autoriteit Financiële Markten and independent auditor
Collateral Type •Residential mortgage loans •Commercial mortgage loans •Shipping loans •Loans granted to / guaranteed by government bodies •Government issued securities •Other highly rated securities
•Residential mortgage loans on property located in the EU •ABS notes
•Public sector loans •ABS notes
•Residential mortgages loans •Public sector entity loans •ABS notes
•Residential mortgage loans •Commercial mortgage loans •Public sector loans •Shipping loans Subject to certain limitations
Segregation of Collateral Ring fence on Issuer’s balance sheet or SPV
Ring fence on Issuer’s balance sheet SPV SPV
Repayment Soft Bullet / Conditional Pass Through Soft bullet Hard / Soft Bullet / Conditional Pass Through
Hard / Soft Bullet / Conditional Pass Through
LTV Limits •80% residential •60% commercial •60% ships
•80% residential •60% commercial
n/a •80% residential •60% commercial
•80% loan-to-market value •125% loan-to-foreclosure-value •80% residential •60% commercial •60% ships
Protection Against Mismatching
Coverage by nominal value and by NPV. Specific coverage of interest rate cash flows through interest cover test
• Coverage by nominal value, outstanding bonds cannot exceed 95% of the overall value of mortgages assigned to such bonds • The average maturity of outstanding mortgage bonds can never exceed the average life of the mortgage credits and substitution assets assigned to the issues
Coverage by nominal value and NPV
Exposure to interest rate and currency risk is neutralised; in addition, downgrade triggers for swap counterparties and various tests ensure cash flow adequacy • Liquidity buffer / Asset cover tests / External auditor /
Yearly stress tests / Reporting obligations towards De Nederlandsche Bank / Obligations to implement solid and effective strategies and procedures
Mandatory Over-collateralisation 5% 5% n/a Subject to an asset coverage test
5%
Voluntary Over-collateralisation is Protected
Yes Yes Yes Yes
Fulfils UCITS 52(4) Yes (No indirect structure) Yes Yes Yes (registered covered bonds)
ECB CBPP3 Yes (subject to additional criteria) Yes Yes Yes
Source: ECBC – European Covered Bond Council website (http://www.ecbc.eu/framework/list)

Appendix III – Glossary

Page 59
Additional Colours NOTE: Eurobank is always red (Chart 10)
Chart 7
Chart 8
Chart 9
Chart 10
Colour 11
Colour 12
Colour 13
Chart 14
Body Text in Calibri
Background
Heading Text, 1st Level Fill
Message Box, Table Highlights
Chart 1
Chart 2
Chart 3
Chart 4
Chart 5
Chart 6
157-177-207
124-179-252
24-56-132
255-255-255
39-58-124
0-176-80
192-0-0
82-76-123
170-178-203
0-78-156
103-141-197
222-221-233
255-192-0
166-166-166
179-209-224
97-91-145
128-128-128
39-58-124
Glossary - Methodology
This document contains financial data and measures as published or derived from the published consolidated financial statements which have been prepared in accordance with International Financial Reporting Standards (IFRS). Additional sources used, include information derived from internal information systems consistent with accounting policies and other financial information such as consolidated Pillar 3 report. The financial data are organized into two main reportable segments, Greece view and International Operations view.
Greece view is incorporating the operations of Eurobank Ergasias S.A. Bank and the Greek subsidiaries, incorporating all business activities originated from these entities, after the elimination of intercompany transactions between them.
International Operations are incorporating operations for in Romania, Bulgaria, Serbia, Cyprus and Luxembourg. Each country includes the local Bank and all local subsidiaries, incorporating all business activities originated from these entities, after the elimination of intercompany transactions between them.
Page 60
Additional Colours NOTE: Eurobank is always red (Chart 10)
Chart 7
Chart 8
Chart 9
Chart 10
Colour 11
Colour 12
Colour 13
Chart 14
Body Text in Calibri
Background
Heading Text, 1st Level Fill
Message Box, Table Highlights
Chart 1
Chart 2
Chart 3
Chart 4
Chart 5
Chart 6
157-177-207
124-179-252
24-56-132
255-255-255
39-58-124
0-176-80
192-0-0
82-76-123
170-178-203
0-78-156
103-141-197
222-221-233
255-192-0
166-166-166
179-209-224
97-91-145
128-128-128
39-58-124
Glossary – Definition of Financial measures / ratios
Banking Fee and Commission Income: The total of Net banking fee and commission income and Income from non banking services of the reported period.
Other Income: The total of Dividend income, Net trading income, Gains less losses from investment securities and net other operating income of the reported period.
Deposits Spread: Accrued customer interest expense over matched maturity and currency libor, annualized and divided by the reported period average Due to Customers. The period average for Due to Customers is calculated as the daily average of the customers’ deposit volume as derived by the Bank’s systems.
Deposits Client Rate: Accrued customer interest expense, annualized and divided by the reported period average Due to Customers. The average for Due to Customers is calculated as the daily average of the customers’ deposit volume as derived by the Bank’s systems.
Fees/Assets: Calculated as the ratio of annualized Commission income divided by the average balance of total assets. The average balance of total assets is calculated as the arithmetic average of total assets at the end of the period under review and of total Assets at the end of the previous period.
Cost to Average Assets: Calculated as the ratio of annualised operating expenses divided the by the average balance of total assets for the reported period. The average balance of total Assets is calculated as the arithmetic average of total Assets at the end of the reported period and of total Assets at the end of the previous period.

Page 61
Additional Colours NOTE: Eurobank is always red (Chart 10)
Chart 7
Chart 8
Chart 9
Chart 10
Colour 11
Colour 12
Colour 13
Chart 14
Body Text in Calibri
Background
Heading Text, 1st Level Fill
Message Box, Table Highlights
Chart 1
Chart 2
Chart 3
Chart 4
Chart 5
Chart 6
157-177-207
124-179-252
24-56-132
255-255-255
39-58-124
0-176-80
192-0-0
82-76-123
170-178-203
0-78-156
103-141-197
222-221-233
255-192-0
166-166-166
179-209-224
97-91-145
128-128-128
39-58-124
Glossary – Definition of Financial measures / ratios
Provision/Gross Loans: Impairment Allowance for Loans and Advances to Customers divided by Gross Loans and Advances to Customers at the end of the reported period.
90dpd ratio: Gross Loans more than 90 days past due divided by Gross Loans and Advances to Customers at the end of the reported period.
90dpd Coverage: Impairment Allowance for Loans and Advances to Customers divided by loans more than 90 days past due at the end of the reported period.
90dpd formation: Net increase/decrease of 90 days past due loans in the reported period excluding the impact of write offs, sales and other movements.
Non Performing Exposures (NPEs): Non Performing Exposures (in compliance with EBA Guidelines) are the Bank’s material exposures which are more than 90 days past-due or for which the debtor is assessed as Unlikely to pay its credit obligations in full without realization of collateral, regardless of the existence of any past due amount or the number of days past due.
NPE ratio: Non Performing Exposures (NPEs) divided by Gross Loans and Advances to Customers at the end of the relevant period.
NPE Coverage ratio: Impairment Allowance for Loans and Advances to Customers divided by NPEs at the end of the reported period.
NPE formation: Net increase/decrease of NPEs in the reported period excluding the impact of write offs, sales and other movements.
Forborne: Forborne exposures (in compliance with EBA Guidelines) are debt contracts in respect of which forbearance measures have been extended. Forbearance measures consist of concessions towards a debtor facing or about to face difficulties in meeting its financial commitments (“financial difficulties”).
Forborne Non-performing Exposures (NPF): Forborne Non-performing Exposures (in compliance with EBA Guidelines) are the Bank’s Forborne exposures that meet the criteria to be classified as Non-Performing.

Page 62
Additional Colours NOTE: Eurobank is always red (Chart 10)
Chart 7
Chart 8
Chart 9
Chart 10
Colour 11
Colour 12
Colour 13
Chart 14
Body Text in Calibri
Background
Heading Text, 1st Level Fill
Message Box, Table Highlights
Chart 1
Chart 2
Chart 3
Chart 4
Chart 5
Chart 6
157-177-207
124-179-252
24-56-132
255-255-255
39-58-124
0-176-80
192-0-0
82-76-123
170-178-203
0-78-156
103-141-197
222-221-233
255-192-0
166-166-166
179-209-224
97-91-145
128-128-128
39-58-124
Glossary – Definition of Financial measures / ratios
Loans to Deposits: Loans and Advances to Customers (net of Impairment Allowance) divided by Due to Customers at the end of the reported period.
Risk-weighted assets (RWAs): Risk-weighted assets are the bank's assets and off-balance-sheet exposures, weighted according to risk factors based on Regulation (EU) No 575/2013, taking into account credit, market and operational risk.
Phased in Common Equity Tier I (CET1): Common Equity Tier I regulatory capital as defined by Regulation No 575/2013 based on the transitional rules for the reported period, divided by total Risk Weighted Assets (RWA).
Fully loaded Common Equity Tier I (CET1): Common Equity Tier I regulatory capital as defined by Regulation No 575/2013 without the application of the relevant transitional rules, divided by total Risk Weighted Assets (RWA).
Earnings per share (EPS): Net profit attributable to ordinary shareholders divided by the weighted average number of ordinary common shares excluding own shares.
Tangible Book Value: Total equity attributable to shareholders of the Bank excluding preference shares minus Intangible Assets.
Tangible Book Value/Share: Tangible book value divided by outstanding number of shares as at period end excluding own shares.
Page 63
Additional Colours NOTE: Eurobank is always red (Chart 10)
Chart 7
Chart 8
Chart 9
Chart 10
Colour 11
Colour 12
Colour 13
Chart 14
Body Text in Calibri
Background
Heading Text, 1st Level Fill
Message Box, Table Highlights
Chart 1
Chart 2
Chart 3
Chart 4
Chart 5
Chart 6
157-177-207
124-179-252
24-56-132
255-255-255
39-58-124
0-176-80
192-0-0
82-76-123
170-178-203
0-78-156
103-141-197
222-221-233
255-192-0
166-166-166
179-209-224
97-91-145
128-128-128
39-58-124
Contacts
Anastasios Ioannidis General Manager Global Markets & Treasury
+30 210 3718 935 E-mail: [email protected]
Christina Theofilidi General Manager Individual Banking
+30 210 4849 893 E-mail: [email protected]
Dimitris Psichogios Assistant General Manager Group Treasurer
+30 210 3718 938 E-mail: [email protected]
Eleftheria Volioti Assistant General Manager Head of Credit &Operational Risk
+30 210 4849 583 E-mail: [email protected]
Dimitris Nikolos Head of Investor Relations
+30 210 3704 764 E-mail: [email protected]
Fax: +30 210 3704 774 Internet: www.eurobank.gr
Reuters: EURBr.AT Bloomberg: EUROB GA

Page 64
Additional Colours NOTE: Eurobank is always red (Chart 10)
Chart 7
Chart 8
Chart 9
Chart 10
Colour 11
Colour 12
Colour 13
Chart 14
Body Text in Calibri
Background
Heading Text, 1st Level Fill
Message Box, Table Highlights
Chart 1
Chart 2
Chart 3
Chart 4
Chart 5
Chart 6
157-177-207
124-179-252
24-56-132
255-255-255
39-58-124
0-176-80
192-0-0
82-76-123
170-178-203
0-78-156
103-141-197
222-221-233
255-192-0
166-166-166
179-209-224
97-91-145
128-128-128
39-58-124
Disclaimer
Important Notice –Forward Looking Information
This document has been prepared by Eurobank Ergasias S.A. (Eurobank) and is being provided to you for information purposes only and on the basis of your acceptance of this disclaimer. No representation or warranty, express or implied, is or will be made in relation to, and no responsibility is or will be accepted by Eurobank as to the accuracy or completeness of the information contained in this presentation and nothing in this presentation shall be deemed to constitute such a representation or warranty.
Although the statements of fact and certain industry, market and competitive data in this presentation have been obtained from and are based upon sources that are believed to be reliable, their accuracy is not guaranteed and any such information may be incomplete or condensed. All opinions and estimates included in this presentation are subject to change without notice. Eurobank is under no obligation to update or keep current the information contained herein.
In addition, certain of these data come from Eurobank’ s own internal research and estimates based on knowledge and experience of the management of Eurobank in the market in which Eurobank operates. Such research and estimates and their underlying methodology have not been verified by any independent source for accuracy or completeness. Accordingly, you should not place undue reliance on them.
The information presented herein is an advertisement and does not comprise a prospectus for the purposes of EU Directive 2003/71/EC, as amended, (the Prospectus Directive). The information herein has not been reviewed or approved by any rating agency, government entity, regulatory body or listing authority and does not constitute listing particulars in compliance with the regulations or rules of any stock exchange.
Certain statements in this presentation constitute forward-looking statements. Such forward looking statements are subject to risks and uncertainties that may cause actual results to differ materially. These risks and uncertainties include, among other factors, changing economic, financial, business or other market conditions. As a result, you are cautioned not to place any reliance on such forward-looking statements. Nothing in this presentation should be construed as a profit forecast and no representation is made that any of these statement or forecasts will come to pass. Persons receiving this presentation should not place undue reliance on forward-looking statements and are advised to make their own independent analysis and determination with respect to the forecast periods, which reflect Eurobank’ s view only as of the date hereof.
This document is not intended for distribution to, or use by, any person or entity in any jurisdiction or country where such distribution would be contrary to law or regulation. In particular this document and the information contained herein does not constitute or form part of, and should not be construed as, an offer or sale of securities and may not be disseminated, directly or indirectly, in the United States or to US persons, as such term is defined in Regulation S under the United States Securities Act of 1933, as amended (the Securities Act). This presentation does not constitute or form part of and should not be construed as, an offer, or invitation, or solicitation or an offer, to subscribe for or purchase any securities in any jurisdiction or an inducement to enter into investment activity. Neither this presentation nor anything contained herein shall form the basis of any contract or commitment.
This presentation is not being distributed by, nor has it been approved for the purposes of Section 21 of the Financial Services and Markets Act 2000 (the FSMA) by, a person authorised under the FSMA.
This presentation is being distributed to and is directed only at (i) persons who are outside the United Kingdom or (ii) persons who are investment professionals within the meaning of Article 19(5) of the Financial Services and Markets Act 2000 (Financial Promotion) Order 2005 (the “Order”) (iii) persons falling within Article 49(2)(a) to (d) (“high net worth companies, unincorporated associations etc.”) of the Financial Promotion Order, and (iv) persons to whom an invitation or inducement to engage in investment activity (within the meaning of section 21 of the Financial Services and Markets Act 2000) in connection with the issue or sale of any securities may otherwise lawfully be communicated or caused to be communicated (all such persons together being referred to as Relevant Persons). Any investment activity to which this communication relates will only be available to and will only be engaged with, Relevant Persons. Any person who is not a Relevant Person should not act or rely on this document or any of its contents.
Each person is strongly advised to seek its own independent advice in relation to any investment, financial, legal, tax, accounting or regulatory issues. This presentation should not be construed as legal, tax, investment or other advice.
No reliance may be placed for any purpose whatsoever on the information contained in this presentation or any other material discussed verbally, or on its completeness, accuracy or fairness. This presentation does not constitute a recommendation with respect to any securities.
Recommended