
1
COUNTY GOVERNMENT OF VIHIGA
COUNTY TREASURY
MEDIUM TERM EXPENDITURE
FRAME WORK
PROGRAMMED BASED BUDGET (PBB)
2018/19-2020/21

2
Table of Contents
Contents 1.1 Summary of Departmental Budget 2017/18-2019/20 ................................................................... 9
1.2 SUMMARY OF TOTAL EXPENDITURE 2018/2019 ............................................................. 10
1.3 SUMMARY OF RECURRENT EXPENDITURE 2017/2018 ................................................... 11
1.4 SUMMARY OF DEVELOPMENT EXPENDITURE 2017/2018 ............................................. 12
1.5 SUMMARY OF COMPENSATION OF EMPLOYEES, OTHER RECURRENT
EXPENDITURE& DEVELOPMENT 2018/19 ..................................................................................... 13
1.6 SUMMARY OF COMPENSATION OF EMPLOYEES, OTHER RECURRENT
EXPENDITURE, DEVELOPMENT& % of DEVELOPMENT TO TOTAL BUDGET 2017/18 ....... 14
2. OFFICE OF THE GOVERNOR ................................................................................................................. 15
2.1 Vision .......................................................................................................................................... 15
2.2 Mission ........................................................................................................................................ 15
2.3 Strategic Overview and Context for Budget Intervention;.......................................................... 15
2.4 Part D: Programmes and Objectives ........................................................................................... 16
2.5 Part E: Summary of Expenditure by Programmes, 2017/18-2019/20 (Kshs.Millions)............... 16
2.6 Part G: Summary of Expenditure by Programme, Sub-Programme and Economic Classification
(KShs. Million) ....................................................................................................................................... 18
2.7 Part H: Summary of the Programme Outputs, Performance Indicators and Targets for FY
2017/18- 2020/21 .................................................................................................................................... 25
2. FINANCE & ECONOMIC PLANNING............................................................................................ 27
2.8 Part A: Vision ............................................................................................................................. 27
2.9 Part B: Mission ........................................................................................................................... 27
2.10 Part C: Performance Overview ................................................................................................... 27
2.11 Part D: Programmes and Objectives ........................................................................................... 28
2.12 Part E: Summary of Expenditure by Programmes, 2017/18-2020/21 (Kshs.Millions)............... 28

3
2.13 Part F: Summary of Expenditure by Vote and Economic Classification (Kshs. Million) ......... 30
2.14 Part G: Summary of Expenditure by Programme, Sub-Programme and Economic Classification
(KShs. Million) ....................................................................................................................................... 30
2.15 Part H: Summary of the Programme Outputs, Performance Indicators and Targets for FY
2017/18- 2020/21 .................................................................................................................................... 37
3. DEPARTMENT OF AGRICULTURE, LIVESTOCK, FISHERIES AND COOPERATIVE
DEVELOPMENT ....................................................................................................................................... 39
3.1 Part A: Vision ............................................................................................................................. 39
3.2 Part B: Mission ........................................................................................................................... 39
3.3 Part C: Performance Overview ................................................................................................... 39
3.3.1 Challenges and constraints .................................................................................................. 39
3.4 Part D: Programmes and Objectives ........................................................................................... 41
3.5 Part E: Summary of Expenditure by Programmes, 2017/18-2020/21 (Kshs.Millions)............... 41
3.6 Part F: Summary of Expenditure by Vote and Economic Classification (Kshs. Million) ......... 43
3.7 Part G: Summary of Expenditure by Programme, Sub-Programme and Economic Classification
(KShs. Million) ....................................................................................................................................... 44
3.8 Part H: Summary of the Programme Outputs, Performance Indicators and Targets for FY
2017/18- 2020/21 .................................................................................................................................... 53
4. HEALTH SERVICES ......................................................................................................................... 55
4.1 Vision .......................................................................................................................................... 55
4.2 Mission ........................................................................................................................................ 55
4.3 PERFOMANCE OVERVIEW ................................................................................................... 55
4.3.1 Expenditure trends .............................................................................................................. 55
4.3.2 Constraints and challenges in budget implementation; ..................................................... 55
4.3.3 Major services/outputs to be provided in MTEF period 2017/18-2020/21 ......................... 56
4.4 Part D: PROGRAMMES AND OBJECTIVES .......................................................................... 56
4.5 Part E: Summary of Expenditure by Programmes, 2017/18-2020/21 (Kshs.Millions)............... 57

4
4.6 Part F: Summary of Expenditure by Vote and Economic Classification (Kshs. Million) ......... 58
4.7 Part G: Summary of Expenditure by Programme, Sub-Programme and Economic Classification
(KShs. Million) ....................................................................................................................................... 59
4.8 Part H: Summary of the Programme Outputs, Performance Indicators and Targets for FY
2017/18- 2021/22 .................................................................................................................................... 70
5. EDUCATION, SCIENCE, TECHNICAL & VOCATIONAL TRAINING ....................................... 72
5.1 Vision .......................................................................................................................................... 72
5.2 Mission ........................................................................................................................................ 72
5.3 Performance Overview ............................................................................................................... 72
5.4 Programmes and their Objectives ............................................................................................... 73
5.5 Part E: Summary of Expenditure by Programmes, 2017/18-2019/20 (Kshs.Millions)............... 73
5.6 Part F: Summary of Expenditure by Vote and Economic Classification (Kshs. Million) ............. 74
5.7 Part G: Summary of Expenditure by Programme, Sub-Programme and Economic Classification
(KShs. Million) ......................................................................................................................................... 75
5.8 Part H: Summary of the Programme Outputs, Performance Indicators and Targets for FY
2017/18- 2020/21 .................................................................................................................................... 79
6. GENDER, CULTURE, YOUTH, SPORTS & SOCIAL SERVICES ................................................ 80
6.1 Vision .......................................................................................................................................... 80
6.2 Mission ........................................................................................................................................ 80
6.3 Performance Overview and Background for Programmes ......................................................... 80
6.4 PROGRAMMES AND THEIR OBJECTIVES ..................................................................................... 80
6.5 Part E: Summary of Expenditure by Programmes, 2017/18-2019/20 (Kshs.Millions)............... 81
6.6 Part F: Summary of Expenditure by Vote and Economic Classification (Kshs. Million) ......... 82
6.7 Part G: Summary of Expenditure by Programme, Sub-Programme and Economic Classification
(KShs. Million) ....................................................................................................................................... 83
6.8 Part H: Summary of the Programme Outputs, Performance Indicators and Targets for FY
2017/18- 2020/21 .................................................................................................................................... 90
7. TRADE, INDUSTRY, TOURISM AND ENTREPRENEURSHIP ................................................... 91
5
7.1 Vision .......................................................................................................................................... 91
7.2 Mission ........................................................................................................................................ 91
7.3 Performance Overview and Background for Programmes ......................................................... 91
7.4 Part D: Programmes and their Objectives ................................................................................... 92
7.5 Part E: Summary of Expenditure by Programmes, 2017/18-2019/20 (Kshs.Millions)............... 92
7.6 Part F: Summary of Expenditure by Vote and Economic Classification (Kshs. Million) ......... 93
8. PUBLIC SERVICE BOARD .............................................................................................................. 99
8.1 Part A: Vision ............................................................................................................................. 99
8.2 Part B: Mission ........................................................................................................................... 99
8.3 Part C: PERFOMANCE OVERVIEW ....................................................................................... 99
8.4 Part D; PROGRAMMES AND OBJECTIVES .......................................................................... 99
8.5 Part E: Summary of Expenditure by Programmes, 2017/18-2019/20 (Kshs.Millions) ................ 99
8.6 Part F: Summary of Expenditure by Vote and Economic Classification (Kshs. Million) ........... 100
8.7 Part G: Summary of Expenditure by Programme, Sub-Programme and Economic Classification
(KShs. Million) ..................................................................................................................................... 100
8.8 Part H: Summary of the Programme Outputs, Performance Indicators and Targets for FY
2017/18- 2019/20 .................................................................................................................................. 102
9. ENVIRONMENT, WATER, ENERGY AND NATURAL RESOURCES .................................... 103
9.1 Part A: Vision ........................................................................................................................... 103
9.2 Part B: Mission ......................................................................................................................... 103
9.3 Part C: PERFOMANCE OVERVIEW ..................................................................................... 103
9.4 Part D; PROGRAMMES AND OBJECTIVES ........................................................................ 104
9.5 Part E: Summary of Expenditure by Programmes, 2017/18-2019/20 (Kshs.Millions)............. 105
9.6 Part F: Summary of Expenditure by Vote and Economic Classification (Kshs. Million) ....... 106
9.7 Part G: Summary of Expenditure by Programme, Sub-Programme and Economic Classification
(KShs. Million) ..................................................................................................................................... 106

6
9.8 Part H: Summary of the Programme Outputs, Performance Indicators and Targets for FY
2017/18- 2020/21 .................................................................................................................................. 111
10. TRANSPORT, INFRASTRUCTURE AND COMMUNICATION ................................................. 113
10.1 Vision ........................................................................................................................................ 113
10.2 Mission ...................................................................................................................................... 113
10.3 PERFORMANCE OVERVIEW ............................................................................................... 113
10.4 Programmes and Objectives...................................................................................................... 114
10.5 Part E: Summary of Expenditure by Programmes, 2017/18-2019/20 (Kshs.) .......................... 115
10.6 Part F: Summary of Expenditure by Vote and Economic Classification (Kshs. Million) ....... 116
10.7 Part G: Summary of Expenditure by Programme, Sub-Programme and Economic Classification
(KShs. Million) ..................................................................................................................................... 116
10.8 Part H: Summary of the Programme Outputs, Performance Indicators and Targets for FY
2017/18- 2020/21 .................................................................................................................................. 121
11. PHYSICAL PLANNING, LANDS & HOUSING ........................................................................................ 123
11.1 Part A: Vision ........................................................................................................................... 123
11.2 Part B: Mission ......................................................................................................................... 123
11.3 Part C: Performance Overview and Background for Programmes .......................................... 123
The department recorded achievements during the period 2012/13-2014/15/16-16/17 and 2017/18. Some
of which included: ..................................................................................................................................... 123
11.4 Part D: Programme Objectives.................................................................................................. 124
Programme code ..................................................................................................................................... 124
Programme .............................................................................................................................................. 124
Objectives................................................................................................................................................. 124
P1 124
Administration planning and Support Services ........................................................................................ 124
To increase access to quality, timely and effective services ..................................................................... 124
P2 124

7
Land survey and mapping services ........................................................................................................... 124
To enhance effective land use and administration .................................................................................... 124
P3 124
Urban Physical planning and housing services ......................................................................................... 124
To promote an integrated housing, urban and physical planning management system ............................ 124
11.5 Part E: Summary of Expenditure by Programmes, 2017/18-2019/20 (Kshs.Millions)............. 125
11.6 Part F: Summary of Expenditure by Vote and Economic Classification (Kshs. Million) ....... 126
11.7 Part G: Summary of Expenditure by Programme, Sub-Programme and Economic Classification
(KShs. Million) ..................................................................................................................................... 126
11.8 Part H: Summary of the Programme Outputs, Performance Indicators and Targets for FY
2017/18- 2020/21 .................................................................................................................................. 130
12. ADMINISTRATION AND COORDINATIONOF COUNTY SERVICES .................................... 132
12.1 Part A: Vision ........................................................................................................................... 132
12.2 Part B: Mission ......................................................................................................................... 132
12.3 Part C: Performance Overview and Background for Programmes .......................................... 132
12.4 Part D: Programmes and Objectives ......................................................................................... 134
12.5 Part E: Summary of Expenditure by Programmes, 2017/18-2020/21 (Kshs.Millions)............. 135
12.6 Part F: Summary of Expenditure by Vote and Economic Classification (Kshs. Million) ....... 135
12.7 Part G: Summary of Expenditure by Programme, Sub-Programme and Economic Classification
(KShs. Million) ..................................................................................................................................... 136
12.8 Part H: Summary of the Programme Outputs, Performance Indicators and Targets for FY
2017/18- 2020/21 .................................................................................................................................. 138

8
RESOURCE ENVELOP OVER THE PERIOD APPROPRIATION BUDGET 2018/19
RESOURCE ENVELOP COMPUTATION
Vote and Programme
Title
Appropriatio
n Act 2017
CFSP
Allocations
Conditional
Funding Others
2018 Resource
Envelop
Equitable Share
4,386,168,046
4,770,000,000 4,770,000,000
Compensation for user
fees foregone
13,652,898
12,928,219 12,928,219
Free maternity Health
care
69,793,305 67,908,400 67,908,400
Road Maintenance
Levy
67,393,443 117,237,500 117,237,500
Conditional Allocation
other loans and grants
- 43,635,292 43,635,292
Loans and
Grants(Danida)
7,085,000 14,782,500 14,782,500
Own Resources
220,000,000
153,669,000 153,669,000
conditional for youth
polytechnics 54,148,936 54,148,936
world bank for health
sytem 49,370,571 49,370,571
World bank loan for
Agriculture and rural
inclusive growth project
- 50,000,000 50,000,000
Kenya Devolution
Support Programme
26,782,785 26,782,785 26,782,785
Kenya Urban 0 0
Total b/fwd 0
CRF account 1,080,254,000 1,080,254,000
Danida Account 0
Kenya Roads Board 0
Total Proposed
County Expenditure
4,790,875,477
4,923,669,000
436,794,203
1,080,254,000
6,440,717,203

9
1.1 Summary of Departmental Budget 2017/18-2019/20
Column
1 Departments Budget 2017/18
Estimates
2018/19
Projected
estimates
2019/20
1 Office of The Governor 303,219,192 493,877,139 518,570,996
2 Finance & Economic Planning 472,789,427 631,855,405 663,448,175
3
Agriculture, Livestock,
Fisheries &Cooperatives 183,487,916 397,600,139 417,480,146
4 Health Services 1,253,707,143 1,634,944,844 1,716,692,086
5
Education, Science, Technical
and Vocational Training 468,691,037 721,476,849 757,550,691
6
Gender, Culture, Youth, Sports
and Social Services 256,250,456 245,872,443 258,166,065
7
Trade, Industry, Tourism and
Entrepreneurship. 88,039,961 144,992,980 152,242,629
8 County Public Service Board 61,991,289 52,566,948 55,195,295
9
Environment, Water, Energy &
Natural Resources. 141,946,048 157,963,270 165,861,434
10
Transport, Infrastructure &
Communication 595,696,003 754,027,730 791,729,117
11
Physical Planning, Land and
Housing 85,997,008 137,927,849 144,824,241
12 County Assembly 648,773,279 654,993,358 687,743,026
13
Administration and
Coordination of County Affairs 480,050,783 412,541,951 433,169,049
Total County Expenditure 5,040,639,542 6,440,640,905 6,762,672,950

10
1.2 SUMMARY OF TOTAL EXPENDITURE 2018/2019
VOTE
VOTE TITLE GROSS % of Total
ESTIMATES Estimate
2018/19
1 Office of The Governor 493,877,139 7.7
2 Finance & Economic Planning 631,855,405 9.8
3 Agriculture, Livestock, Fisheries &Cooperatives 397,600,139 6.2
4 Health Services 1,634,944,844 25.4
5
Education, Science, Technical and Vocational
Training 721,476,849 11.2
6
Gender, Culture, Youth, Sports and Social
Services 245,872,443 3.8
7 Trade, Industry, Tourism and Entrepreneurship. 144,992,980 2.3
8 County Public Service Board 52,566,948 0.8
9
Environment, Water, Energy & Natural
Resources. 157,963,270 2.5
10 Transport, Infrastructure & Communication 754,027,730 11.7
11 Physical Planning, Land and Housing 137,927,849 2.1
12 County Assembly 654,993,358 10.2
13
Administration and Coordination of County
Affairs 412,541,951 6.4
TOTAL EXPENDITURE 6,440,640,905 100.00

11
1.3 SUMMARY OF RECURRENT EXPENDITURE 2018/2019
VOTE
VOTE TITLE GROSS % of Total
ESTIMATES Estimate
2018/19
1 Office of The Governor 453,077,139 10.06
2 Finance & Economic Planning 499,733,109 11.10
3 Agriculture, Livestock, Fisheries &Cooperatives 165,100,139 3.67
4 Health Services 1,313,152,026 29.16
5
Education, Science, Technical and Vocational
Training 489,327,913 10.87
6
Gender, Culture, Youth, Sports and Social
Services 158,872,443 3.53
7 Trade, Industry, Tourism and Entrepreneurship. 98,066,501 2.18
8 County Public Service Board 52,566,948 1.17
9
Environment, Water, Energy & Natural
Resources. 86,848,360 1.93
10 Transport, Infrastructure & Communication 186,826,367 4.15
11 Physical Planning, Land and Housing 70,927,849 1.58
12 County Assembly 560,961,344 12.46
13
Administration and Coordination of County
Affairs 367,101,951 8.15
TOTAL RECURRENT EXPENDITURE 4,502,562,089 100.00

12
1.4 SUMMARY OF DEVELOPMENT EXPENDITURE 2018/2019
VOTE
VOTE TITLE GROSS % of Total
ESTIMATES Estimate
2018/19
1 Office of The Governor 40,800,000 2.11
2 Finance & Economic Planning 132,122,296 6.82
3 Agriculture, Livestock, Fisheries &Cooperatives 232,500,000 12.00
4 Health Services 321,792,818 16.60
5
Education, Science, Technical and Vocational
Training 232,148,936 11.98
6
Gender, Culture, Youth, Sports and Social
Services 87,000,000 4.49
7 Trade, Industry, Tourism and Entrepreneurship. 46,926,479 2.42
8 County Public Service Board 0 0.00
9
Environment, Water, Energy & Natural
Resources. 71,114,910 3.67
10 Transport, Infrastructure & Communication 567,201,363 29.27
11 Physical Planning, Land and Housing 67,000,000 3.46
12 County Assembly 94,032,014 4.85
13
Administration and Coordination of County
Affairs 45,440,000 2.34
TOTAL DEVELOPMENT EXPENDITURE 1,938,078,816 100

13
1.5 SUMMARY OF COMPENSATION OF EMPLOYEES, OTHER
RECURRENT EXPENDITURE& DEVELOPMENT 2018/19
VO
TE
VOTE TITLE
Compensation
to Employees
Other
Recurrent
Developmen
t Totals
1 Office of The Governor 119,856,071 333,221,068 40,800,000
493,877,139
2 Finance & Economic Planning 109,610,032 390,123,077 132,122,296
631,855,405
3
Agriculture, Livestock,
Fisheries &Cooperatives 109,991,384 55,108,755 232,500,000
397,600,139
4 Health Services 934,430,356 378,721,670 321,792,818
1,634,944,844
5
Education, Science, Technical
and Vocational Training 245,877,180 243,450,733 232,148,936
721,476,849
6
Gender, Culture, Youth,
Sports and Social Services 22,740,912 136,131,531 87,000,000
245,872,443
7
Trade, Industry, Tourism and
Entrepreneurship. 12,600,000 85,466,501 46,926,479
144,992,980
8 County Public Service Board 28,215,860 24,351,088 0
52,566,948
9
Environment, Water, Energy
& Natural Resources. 26,542,648 60,305,712 71,114,910
157,963,270
10
Transport, Infrastructure &
Communication 49,487,134 137,339,233 567,201,363
754,027,730
11
Physical Planning, Land and
Housing 20,313,346 50,614,503 67,000,000
137,927,849
12 County Assembly 321,768,239 239,193,105 94,032,014
654,993,358
13
Administration and
Coordination of County
Affairs
236,802,555 130,299,396 45,440,000
412,541,951
TOTAL COUNTY
EXPENDITURE 2,238,235,717 2,264,326,372 1,938,078,816
6,440,640,905

14
1.6 SUMMARY OF COMPENSATION OF EMPLOYEES, OTHER
RECURRENT EXPENDITURE, DEVELOPMENT& % of DEVELOPMENT
TO TOTAL BUDGET 2018/19
V
O
T
E
VOTE TITLE Compensation
to Employees
Other
Recurrent
Development Totals % of development to total budget
1
Office of The
Governor 119,856,071 333,221,068 40,800,000
493,877,139
8
2
Finance & Economic
Planning 109,610,032 390,123,077 132,122,296
631,855,405
21
3
Agriculture, Livestock,
Fisheries
&Cooperatives
109,991,384 55,108,755 232,500,000
397,600,139
58
4 Health Services
934,430,356 378,721,670 321,792,818
1,634,944,844
20
5
Education, Science,
Technical and
Vocational Training
245,877,180 243,450,733 232,148,936
721,476,849
32
6
Gender, Culture,
Youth, Sports and
Social Services
22,740,912 136,131,531 87,000,000
245,872,443
35
7
Trade, Industry,
Tourism and
Entrepreneurship.
12,600,000 85,466,501 46,926,479
144,992,980
32
8
County Public Service
Board 28,215,860 24,351,088 0
52,566,948
-
9
Environment, Water,
Energy & Natural
Resources.
26,542,648 60,305,712 71,114,910
157,963,270
45
10
Transport,
Infrastructure &
Communication
49,487,134 137,339,233 567,201,363
754,027,730
75
11
Physical Planning,
Land and Housing 20,313,346 50,614,503 67,000,000
137,927,849
49
12 County Assembly 321,768,239 239,193,105 94,032,014
654,993,358
14
13
Administration and
Coordination of
County Affairs
236,802,555 130,299,396 45,440,000
412,541,951
11
TOTAL COUNTY
EXPENDITURE 2,238,235,717 2,264,326,372 1,938,078,816
6,440,640,905
30

15
1 OFFICE OF THE GOVERNOR
1.7 Vision
To provide leadership, governance and formulation of policies that will enable Vihiga be the lead
County in sustainable utilization of resources in a stable environment.
1.8 Mission
To provide leadership and policy direction aimed at support of food security programmes, agro-
industrial development, trade expansion, employment creation and sustainable utilization of
available resources.
1.9 Strategic Overview and Context for Budget Intervention;
In line with Vision 2030 the county executive will strive to provide leadership and policy
direction that will transform Vihiga to a middle income county offering prosperity to its
citizenry.
Major achievements the county executive has achieved in the last three years of devolution
include; establishment of the administrative and institutional structures in the county, Creation of
ancillary divisions like communication, protocol, special Programmes amongst others to provide
the necessary support programmes, and adoption of e-government platform in county
government operations.
During the fy 2017/18 budget implementation period the county executive faced several
challenges that included: delays in establishing institutional structures to operationalize
devolution in departments, slow disbursements of funds, human resource capacity constraints,
inadequate funding for disaster and emergency response, limited office space, and weak
monitoring and evaluation framework.
The county executive in the fy 2018/19 seeks to focus on strategic reforms that will bolster
broad-based economic and social development that will address the social economic challenges
in the county; increasing poverty, wealth creation and food security. Priority areas will include;
formulation of the necessary institutional and legal frameworks that will strengthen coordination
of county government development agenda at the sub-county and ward levels, effective
intergovernmental relations, improved public participation by constantly engaging the citizens,
and enhanced PPPs in infrastructure development and service delivery. The County Executive
will also institute early warning systems for disaster forecast and response, and set aside an
emergency fund for disaster management.

16
1.10 Part D: Programmes and Objectives
1.11 Part E: Summary of Expenditure by Programmes, 2017/18-2019/20
(Kshs.Millions)
COUNTY EXECUTIVE
Programme Baseline Estimates
Estimates Projected Estimates
2017/18 2018/19 2019/20 2020/21
Programme 1: Administration Plannning and Support services
Sub Programme (SP)
SP 1. 1 GENERAL ADMINISTRATIVE SERVICES
241,879,192 294,373,269 309,091,932 324,546,529
Total Expenditure of Programme 1 241,879,192 294,373,269 309,091,932 324,546,529
Programme 2: Cordination and Supervisory services.
Baseline Estimates
Estimates Projected Estimates
2017/18 2018/19 2019/20 2020/21
SP 2. 1 Audit and accountability 0
9,000,000
9,450,000
9,922,500
SP 2. 2. perfomance management 1,800,000 26,800,000
28,140,000
29,547,000
SP 2. 2. Emmergency and Disaster management
0 34,800,000
36,540,000
38,367,000
Total Expenditure of Programme 2 1,800,000 70,600,000 74,130,000 77,836,500
S/NO PROGRAMES OBJECTIVES
P1 Administration, Planning and Support
Service
To efficiently and effectively plan, and manage
the county resources.
P2 Coordination and supervisory services To provide leadership in coordination and
supervision of county government programmes
P3 Management and administration of
county services
To ensure effective and efficient management
of the county functions in service delivery.
P4 Information and communication
management
To increase access to county information

17
Programme 3: Management and Administration of County services.
Baseline Estimates
Estimates Projected Estimates
2017/18 2018/19 2019/20 2020/21
SP 3. 1 County Executive 19,690,000 42,896,655 45,041,488 47,293,562
SP 3.2 County Secretary 11,400,000 41,750,000 43,837,500 46,029,375
SP 3.3 County Research and Development Services
2,450,000 7,207,215 7,567,576 7,945,955
SP 3.4 Legal services 26,000,000 37,050,000 38,902,500 40,847,625
Total Expenditure of Programme 3 59,540,000 128,903,870 135,349,064 142,116,517
Total Expenditure of Vote ------- 303,219,192 493,877,139 518,570,996 544,499,546
1.2 Part F: Summary of Expenditure by Vote and Economic Classification
(Kshs. Million)
Expenditure Classification Baseline Estimates
Estimates Projected Estimates
2017/18 2018/19 2019/20 2020/21
Current Expenditure
Compensation to Employees 112,340,077 119,856,071 125,848,875 132,141,318
Use of goods and services 140,129,115 326,171,068 342,479,621 359,603,602
Current Transfers Govt. Agencies 0 0 0 0
Other Recurrent 5,750,000 7,050,000 7,402,500 7,772,625
Capital Expenditure
Acquisition of Non-Financial Assets 0 0 0 0
Capital Transfers to Government Agencies 0 0 0 0
Other Development 45,000,000 40,800,000 42,840,000 44,982,000
Total Expenditure of Vote …… 303,219,192 493,877,139 518,570,996 544,499,546

18
1.12 Part G: Summary of Expenditure by Programme, Sub-Programme and
Economic Classification (KShs. Million)
Expenditure Classification Baseline Estimates
Estimates Projected Estimates
2017/18 2018/19 2019/20 2020/21
ADMINSTRATION,PLANNING AND SUPPORT SERVICES.
Current Expenditure
Compensation to Employees 112,340,077 119,856,071 125,848,875 132,141,318
Use of goods and services 80,239,115 139,967,198 146,965,558 154,313,836
Current Transfers Govt. Agencies 0 0 0 0
Other Recurrent 4,300,000 4,550,000 4,777,500 5,016,375
Capital Expenditure
Acquisition of Non-Financial Assets 0 0
- 0
Capital Transfers to Govt. Agencies 0 0
- 0
Other Development 45,000,000 30,000,000
31,500,000
33,075,000
Total Expenditure 241,879,192 294,373,269 309,091,932 324,546,529
Sub-Programme 1.1: General Administration duties
Expenditure Classification Baseline Estimates
Estimates Projected Estimates
2017/18 2018/19 2019/20 2020/21
Current Expenditure
Compensation to Employees 112,340,077 119,856,071 125,848,875 132,141,318
Use of goods and services 80,239,115 139,967,198 146,965,558 154,313,836
Current Transfers Govt. Agencies 0 0 0 0
Other Recurrent 4,300,000 4,550,000 4,777,500 5,016,375
Capital Expenditure
Acquisition of Non-Financial Assets 0 0 0 0

19
Capital Transfers to Govt. Agencies 0 0 0 0
Other Development 45,000,000 30,000,000
31,500,000
33,075,000
Total Expenditure 241,879,192 294,373,269 309,091,932 324,546,529
Program 2: CORDINATION AND SUPERVISORY SERVICES
Expenditure Classification Baseline Estimates
Estimates Projected Estimates
2017/18 2018/19 2019/20 2020/21
Current Expenditure
Compensation to Employees 0 0 0 0
Use of goods and services 1,800,000 59,800,000 62,790,000 65,929,500
Current Transfers Govt. Agencies 0 0 0 0
Other Recurrent 0 0 0 0
Capital Expenditure
Acquisition of Non-Financial Assets 0 0 0 0
Capital Transfers to Govt. Agencies 0 0 0 0
Other Development 0 10,800,000
11,340,000
11,907,000
Total Expenditure 1,800,000 70,600,000 74,130,000 77,836,500
Sub-Programme 2.1: AUDIT AND ACCOUNTABILITY
Expenditure Classification Baseline Estimates
Estimates Projected Estimates
2017/18 2018/19 2019/20 2020/21
Current Expenditure
Compensation to Employees 0 0 0 0
Use of goods and services 0
9,000,000
9,450,000
9,922,500
Current Transfers Govt. Agencies 0 0 0 0

20
Other Recurrent 0 0 0 0
Capital Expenditure
Acquisition of Non-Financial Assets 0 0 0 0
Capital Transfers to Govt. Agencies 0 0 0 0
Other Development 0 0 0 0
Total Expenditure
-
9,000,000
9,450,000
9,922,500
Sub-Programme 2. 2: PERFOMANCE MANAGEMENT
Expenditure Classification Baseline Estimates
Estimates Projected Estimates
2017/18 2018/19 2019/20 2020/21
Current Expenditure
Compensation to Employees 0 0
-
-
Use of goods and services 1,800,000 26,800,000
28,140,000
29,547,000
Current Transfers Govt. Agencies 0 0
-
-
Other Recurrent 0 0
-
-
Capital Expenditure
Acquisition of Non-Financial Assets 0 0 0 0
Capital Transfers to Govt. Agencies 0 0 0 0
Other Development 0 0 0 0
Total Expenditure 1,800,000 1,800,001 1,800,002 1,800,003

21
Sub-Programme 2. 3: Emergency & Disaster management and mitigation
Expenditure Classification Baseline Estimates
Estimates Projected Estimates
2017/18 2018/19 2019/20 2020/21
Current Expenditure
Compensation to Employees 0 0 0 0
Use of goods and services 0 24,000,000 25,200,000 26,460,000
Current Transfers Govt. Agencies 0 0 0 0
Other Recurrent 0 0 0 0
Capital Expenditure
Acquisition of Non-Financial Assets 0 0 0 0
Capital Transfers to Govt. 0 0 0 0
Agencies
Other Development 0 10,800,000 11,340,000 11,907,000
Total Expenditure 0
34,800,000
36,540,000
38,367,000
Programme 3. MANAGEMENT AND ADMINISTRATION OF COUNTY SERVICES.
Expenditure Classification Baseline Estimates
Estimates Projected Estimates
2017/18 2018/19 2019/20 2020/21
Current Expenditure
Compensation to Employees 0 0 0 0
Use of goods and services 58,090,000 126,403,870
132,724,064
139,360,267
Current Transfers Govt. Agencies 0 0
-
-
Other Recurrent 1,450,000 2,500,000
2,625,000
2,756,250

22
Capital Expenditure
Acquisition of Non-Financial Assets 0 0
-
-
Capital Transfers to Govt. Agencies 0 0
-
-
Other Development 0 0
-
-
Total Expenditure 59,540,000 128,903,870 135,349,064 142,116,517
Sub Programme 3.1 : COUNTY EXECUTIVE SERVICES
Expenditure Classification Baseline Estimates
Estimates Projected Estimates
2017/18 2018/19 2019/20 2020/21
Current Expenditure
Compensation to Employees 0 0
-
-
Use of goods and services 19,690,000 42,896,655
45,041,488
47,293,562
Current Transfers Govt. Agencies 0 0
-
-
Other Recurrent 0 0 0 0
Capital Expenditure
Acquisition of Non-Financial Assets 0 0 0 0
Capital Transfers to Govt. Agencies 0 0 0 0
Other Development 0
-
-
-
19,690,000 42,896,655 45,041,488 47,293,562
Total Expenditure
Sub-Programme 3. 2: COUNTY SECRETARY
Expenditure Classification Baseline Estimates
Estimates Projected Estimates

23
2017/18 2018/19 2019/20 2019/20
Current Expenditure
Compensation to Employees 0 0
-
-
Use of goods and services 11,350,000 40,650,000
42,682,500
44,816,625
Current Transfers Govt. Agencies 0 0
-
-
Other Recurrent 50,000 1,100,000
1,155,000
1,212,750
Capital Expenditure
Acquisition of Non-Financial Assets 0 0
-
-
Capital Transfers to Govt. Agencies 0 0
-
-
Other Development 0 0
-
-
Total Expenditure 11,400,000 41,750,000 43,837,500 46,029,375
Sub-Proramme 3.3: County Research and Development Service
Expenditure Classification Baseline Estimates
Estimates Projected Estimates
2017/18 2018/19 2019/20 2020/21
Current Expenditure
Compensation to Employees 0 0
-
-
Use of goods and services 2,450,000 7,207,215
7,567,576
7,945,955
Current Transfers Govt. Agencies 0 0
-
-
Other Recurrent 0 0
-
-
Capital Expenditure
Acquisition of Non-Financial Assets 0 0
-
-

24
Capital Transfers to Govt. Agencies 0 0
-
-
Other Development 0 0
-
-
2,450,000 7,207,215 7,567,576 7,945,955
Total Expenditure
SP 3.4 : Legal services
Expenditure Classification Baseline Estimates
Estimates Projected Estimates
2017/18 2018/19 2019/20 2020/21
Current Expenditure
Compensation to Employees 0 0
-
-
Use of goods and services 24,600,000 35,650,000
37,432,500
39,304,125
Current Transfers Govt. Agencies 0 0
-
-
Other Recurrent 1,400,000 1,400,000
1,470,000
1,543,500
Capital Expenditure
Acquisition of Non-Financial Assets 0 0
-
-
Capital Transfers to Govt. Agencies 0 0
-
-
Other Development 0 0
-
-
Total Expenditure 26,000,000 37,050,000 38,902,500 40,847,625

25
1.13 Part H: Summary of the Programme Outputs, Performance Indicators and
Targets for FY 2017/18- 2020/21
Programme Delivery Unit Key
Outputs
Key
Performance
Indicators
Target Target Target Target
(Baseline)
2018/19 2019/20 2020/21 2021/22
1. ADMNISTRATION, PLANNING AND SUPPORT SERVICE
Outcome: Effective and efficient service delivery.
SP1.1: General
admnistrative
services
Govenors
office
compliance
with county
policies and
standards
No. of
policies
developed 8 10 20 20
improved
leadership
and
cordination
of
departments
overal
ranking in
perfomance
and
management
of county
affairs
7 5 3 3
Program 2: CORDINATION AND SUPERVISORY SERVICES
Outcome: Enhanced provision of services.
SP2.1: audit
and
accountability.
compliance
with county
policies and
standards
% overal
compliance to
policies plans
and standards
70 80 90 90
SP 2.2:
perfomance
management
compliance
with county
policies and
standards
% efficiency
level of
systems and
operations
70 80 90 90
Programme 3. MANAGEMENT AND ADMINISTRATION OF COUNTY
SERVICES.
Outcome: Improved service delivery
Sub
Programme 3.1
: County
executive
services
Administratioin
improved
cordination
for service
delivery
No. of
strategic
board
meetings held
quartely quartely quartely quartely
SP 3.2: county
secretary
Administration improved
cordination
for service
delivery
No. of
reports on
system and
mechanisims
put in place
for effective
service
delivery
quartely quartely quartely quartely

26
SP 3.2: county
secretary
Administration improved
cordination
for service
delivery
No. of
reports on
system and
mechanisims
put in place
for effective
service
delivery
quartely quartely quartely quartely

27
2. FINANCE & ECONOMIC PLANNING
2.1 Part A: Vision
To be a lead entity in provision of quality accounting, financial and economic planning services
to the public sector in Vihiga.
2.2 Part B: Mission
To provide quality accounting services in the public sector through maintenance of accurate
accounting records, provision of quality financial reports and ensuring prudent management of
public funds.
2.3 Part C: Performance Overview
The County Treasury is mandated by the PFM Act 2012 to receive, disburse and control
expenditure of funds. It is also tasked with tracking implementation of projects, formulation and
coordination of policies, and ensuring prudent utilization of public funds and assets by adopting
best practices. During the period under review County Treasury embraced and fully implemented
IFMIS and e-procurement as financial management tools. Electronic system of revenue
collection was also adopted. During this period the department of economic planning undertook
monitorin and evaluation on county programmes and prepared progress reports. The audit
department coordinated capacity building sessions for senior staff on risk management and
corruption control.
During the financial 2017/2018 the department faced several challenges that included; decline in
own revenue collection, delays in disbursement of funds from the national treasury, increasing
expenditure demands from county departments, technical hitches with the IFMIS. In addition,
failure by departments to adhere to procurement procedures and budgetary allocations resulted in
high amounts of pending bills.
During the MTEF period of 2018/19 the department expects to enhence the revenue collection by
expanding the revenue base, increasing surveillance of revenue collection to minimize revenue
loss and ensure compliance.
The Audit department will continue to undertake its oversight role in ensuring that departments
adhere to the financial procedures and regulations. The department intends to prepare a risk
based strategic plan, and capacity building sessions and remuneration of the audit committee
members.
The county treasury will continue to coordinate public participation fora on the budget making,
implementation status of programmes, the Finance bill and all other matters related to public
funds.

28
The economic planning directorate will continue to review the CIDP, coordinate the
implementation of county policies, coordinate M&E, and undertake public participation fora on
county government activities.
2.4 Part D: Programmes and Objectives
Programme
code
Programme Objective
P1 Administration and Support
Service
To increase access to quality, timely and
effective services in the county
P2 County Planning Services
To strengthen formulation and coordination
of policies, planning and tracking
implementation of projects and programmes
Capacity building and resource mobilization
P3 County financial
Management
To ensure prudent management of public
finance and advisory services
2.5 Part E: Summary of Expenditure by Programmes, 2017/18-2020/21
(Kshs.Millions)
COUNTY TREASURY
Programme Baseline
Estimates Estimates Projected Estimates
2017/18 2018/19 2019/20 2020/21
Programme 1: Administration Plannning and Support services
Sub Programme (SP)
SP 1. 1 GENERAL ADMINISTRATIVE
SERVICES 357,489,429 477,155,405 501,013,175 526,063,834
SP 1. 2 Procurement Services 14,050,000 12,050,000 12,652,500 13,285,125
Total Expenditure of Programme 1 371,539,429 489,205,405 513,665,675 539,348,959
Programme 2: County Planning Services.
Baseline
Estimates Estimates Projected Estimates
2017/18 2018/19 2019/20 2020/21

29
SP 2. 1 Monitoring and Evaluation 10,900,000 10,900,000 11,445,000 12,017,250
SP 2. 2. Cordination of 10,200,000 11,700,000 12,285,000 12,899,250
Policy Formulation and Plans
Total Expenditure of Programme 2 21,100,000 22,600,000 23,730,000 24,916,500
Programme 3: County Financial Management
Baseline
Estimates Estimates Projected Estimates
2017/18 2018/19 2019/20 2020/21
SP 3. 1 Accounting Services 12,800,000 18,200,000 19,110,000 20,065,500
SP 3.2 Audit Services 15,850,000 19,150,000 20,107,500 21,112,875
SP 3.3 Budget Policy 11,800,000 11,200,000 11,760,000 12,348,000
Formulation
SP 3.4 Resource Mobilization 20,200,000 47,400,000 49,770,000 52,258,500
Budget Expenditure Management 19,500,000 24,100,000 25,305,000 26,570,250
Total Expenditure of Programme 3 80,150,000 120,050,000 126,052,500 132,355,125
Total Expenditure of Vote ------- 472,789,429 631,855,405 663,448,175 696,620,584

30
2.6 Part F: Summary of Expenditure by Vote and Economic Classification
(Kshs. Million)
Expenditure Classification Baseline
Estimates Estimates Projected Estimates
2017/18 2018/19 2019/20 2020/21
Current Expenditure
Compensation to Employees 72,505,016 109,610,032 115,090,534 120,845,060
Use of goods and services 162,611,478 384,023,077 403,224,231 423,385,442
Current Transfers Govt. Agencies 0 0 0 0
Other Recurrent 7,500,000 6,100,000 6,405,000 6,725,250
Capital Expenditure
Acquisition of Non-Financial Assets 0 0 0 0
Capital Transfers to Government Agencies 0 0 0 0
Other Development 230,172,935 132,122,296 138,728,411 145,664,831
Total Expenditure of Vote …… 472,789,429 631,855,405 663,448,175 696,620,584
2.7 Part G: Summary of Expenditure by Programme, Sub-Programme and
Economic Classification (KShs. Million)
Expenditure Classification Baseline
Estimates Estimates Projected Estimates
2017/18 2018/19 2019/20 2020/21
ADMINSTRATION,PLANNING AND SUPPORT SERVICES.
Current Expenditure
Compensation to Employees 72,505,016 109,610,032 115,090,534 120,845,060
Use of goods and services 61,361,478 241,373,077 253,441,731 266,113,817
Current Transfers Govt. Agencies 0 0 0 0
Other Recurrent 7,500,000 6,100,000 6,405,000 6,725,250

31
Capital Expenditure
Acquisition of Non-Financial Assets 0 0 0 0
Capital Transfers to Govt. Agencies 0 0 0 0
Other Development 230,172,935 132,122,296 138,728,411 145,664,831
Total Expenditure 371,539,429 489,205,405 513,665,675 539,348,959
Sub-Programme 1.1: General Administration duties
Expenditure Classification
Baseline
Estimates Estimates Projected Estimates
2017/18 2018/19 2019/20 2020/21
Current Expenditure
Compensation to Employees 72,505,016 109,610,032 115,090,534 120,845,060
Use of goods and services 47,311,478 229,323,077 240,789,231 252,828,692
Current Transfers Govt. Agencies 0 0 0 0
Other Recurrent 7,500,000 6,100,000 6,405,000 6,725,250
Capital Expenditure
Acquisition of Non-Financial Assets 0 0 0 0
Capital Transfers to Govt. Agencies 0 0 0 0
Other Development 230,172,935 132,122,296 138,728,411 145,664,831
Total Expenditure 357,489,429 477,155,405 501,013,175 526,063,834

32
Sub-Programme 1.2: Procurement Services
Expenditure Classification
Baseline
Estimates Estimates Projected Estimates
2017/18 2018/19 2019/20 2020/21
Current Expenditure
Compensation to Employees 0 0 0 0
Use of goods and services 14,050,000 12,050,000
12,652,500
13,285,125
Current Transfers Govt. Agencies 0 0 0 0
Other Recurrent 0 0 0 0
Capital Expenditure
Acquisition of Non-Financial Assets 0 0 0 0
Capital Transfers to Govt. Agencies 0 0 0 0
Other Development 0 0 0 0
Total Expenditure 14,050,000 12,050,000 12,652,500 13,285,125
Program 2: County Planning Services
Expenditure Classification
Baseline
Estimates Estimates Projected Estimates
2017/18 2018/19 2019/20 2020/21
Current Expenditure
Compensation to Employees 0 0 0 0
Use of goods and services 21,100,000 22,600,000 23,730,000 24,916,500
Current Transfers Govt. Agencies 0 0 0 0
Other Recurrent 0 0 0 0
Capital Expenditure
Acquisition of Non-Financial Assets 0 0 0 0

33
Capital Transfers to Govt. Agencies 0 0 0 0
Other Development 0 0 0 0
Total Expenditure 21,100,000 22,600,000 23,730,000 24,916,500
Sub-Programme 2.1: Monitoring and Evaluation
Expenditure Classification
Baseline
Estimates Estimates Projected Estimates
2017/18 2018/19 2019/20 2020/21
Current Expenditure
Compensation to Employees 0 0 0 0
Use of goods and services 10,900,000 10,900,000 11,445,000 12,017,250
Current Transfers Govt. Agencies 0 0 0 0
Other Recurrent 0 0 0 0
Capital Expenditure
Acquisition of Non-Financial Assets 0 0 0 0
Capital Transfers to Govt. Agencies 0 0 0 0
Other Development 0 0 0 0
Total Expenditure 10,900,000 10,900,000 11,445,000 12,017,250
Sub-Programme 2. 2: Coordination of Policy Formulation and Plans
Expenditure Classification
Baseline
Estimates Estimates Projected Estimates
2017/18 2018/19 2019/20 2020/21
Current Expenditure
Compensation to Employees 0 0 0 0
Use of goods and services 10,200,000 11,700,000 12,285,000 12,899,250
Current Transfers Govt. Agencies 0 0 0 0
Other Recurrent 0 0 0 0

34
Capital Expenditure
Acquisition of Non-Financial Assets 0 0 0 0
Capital Transfers to Govt. Agencies 0 0 0 0
Other Development 0 0 0 0
Total Expenditure 10,200,000 11,700,000 12,285,000 12,899,250
Programme 3. County Financial Management
Expenditure Classification
Baseline
Estimates Estimates Projected Estimates
2017/18 2018/19 2019/20 2020/21
Current Expenditure
Compensation to Employees 0 0 0 0
Use of goods and services 80,150,000 120,050,000 126,052,500 132,355,125
Current Transfers Govt. Agencies 0 0 0 0
Other Recurrent 0 0 0 0
Capital Expenditure
Acquisition of Non-Financial Assets 0 0 0 0
Capital Transfers to Govt. Agencies 0 0 0 0
Other Development 0 0 0 0
Total Expenditure 80,150,000 120,050,000 126,052,500 132,355,125
Sub Programme 3.1 : Accounting Services
Expenditure Classification
Baseline
Estimates Estimates Projected Estimates
2017/18 2018/19 2019/20 2020/21
Current Expenditure
Compensation to Employees 0 0 0 0
Use of goods and services 12,800,000 18,200,000 19,110,000 20,065,500

35
Current Transfers Govt. Agencies 0 0 0 0
Other Recurrent 0 0 0 0
Capital Expenditure
Acquisition of Non-Financial Assets 0 0 0 0
Capital Transfers to Govt. Agencies 0 0 0 0
Other Development 0 0 0 0
Total Expenditure 12,800,000 18,200,000 19,110,000 20,065,500
Sub-Programme 3. 2: Audit Services
Expenditure Classification
Baseline
Estimates Estimates Projected Estimates
2017/18 2018/19 2019/20 2020/21
Current Expenditure
Compensation to Employees 0 0 0 0
Use of goods and services 15,850,000 19,150,000 20,107,500 21,112,875
Current Transfers Govt. Agencies 0 0 0 0
Other Recurrent 0 0 0 0
Capital Expenditure
Acquisition of Non-Financial Assets 0 0 0 0
Capital Transfers to Govt. Agencies 0 0 0 0
Other Development 0 0 0 0
Total Expenditure 15,850,000 19,150,000 20,107,500 21,112,875
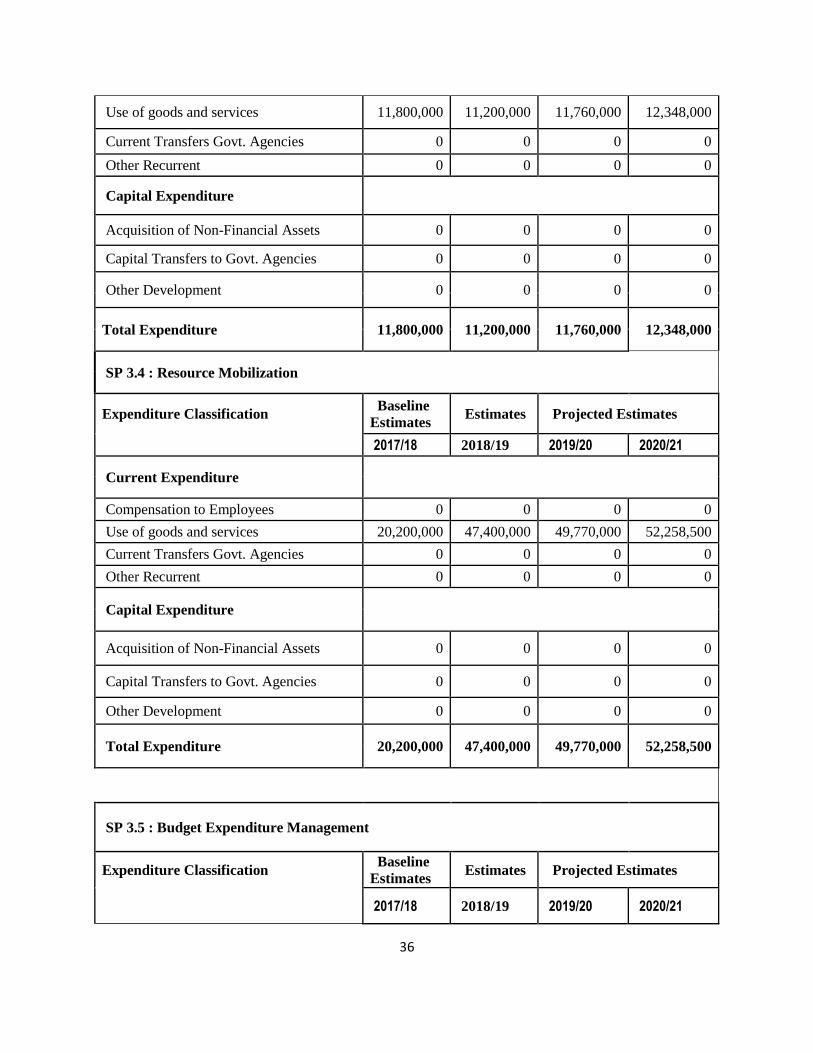
Sub-Proramme 3.3: Budget Policy Formulation
Expenditure Classification
Baseline
Estimates Estimates Projected Estimates
2017/18 2018/19 2019/20 2020/21
Current Expenditure
Compensation to Employees 0 0 0 0
36
Use of goods and services 11,800,000 11,200,000 11,760,000 12,348,000
Current Transfers Govt. Agencies 0 0 0 0
Other Recurrent 0 0 0 0
Capital Expenditure
Acquisition of Non-Financial Assets 0 0 0 0
Capital Transfers to Govt. Agencies 0 0 0 0
Other Development 0 0 0 0
Total Expenditure 11,800,000 11,200,000 11,760,000 12,348,000
SP 3.4 : Resource Mobilization
Expenditure Classification
Baseline
Estimates Estimates Projected Estimates
2017/18 2018/19 2019/20 2020/21
Current Expenditure
Compensation to Employees 0 0 0 0
Use of goods and services 20,200,000 47,400,000 49,770,000 52,258,500
Current Transfers Govt. Agencies 0 0 0 0
Other Recurrent 0 0 0 0
Capital Expenditure
Acquisition of Non-Financial Assets 0 0 0 0
Capital Transfers to Govt. Agencies 0 0 0 0
Other Development 0 0 0 0
Total Expenditure 20,200,000 47,400,000 49,770,000 52,258,500
SP 3.5 : Budget Expenditure Management
Expenditure Classification
Baseline
Estimates Estimates Projected Estimates
2017/18 2018/19 2019/20 2020/21
37
Current Expenditure
Compensation to Employees 0 0 0 0
Use of goods and services 19,500,000 24,100,000 25,305,000 26,570,250
Current Transfers Govt. Agencies 0 0 0 0
Other Recurrent 0 0 0 0
Capital Expenditure
Acquisition of Non-Financial Assets 0 0 0 0
Capital Transfers to Govt. Agencies 0 0 0 0
Other Development 0 0 0 0
Total Expenditure 19,500,000 24,100,000 25,305,000 26,570,250
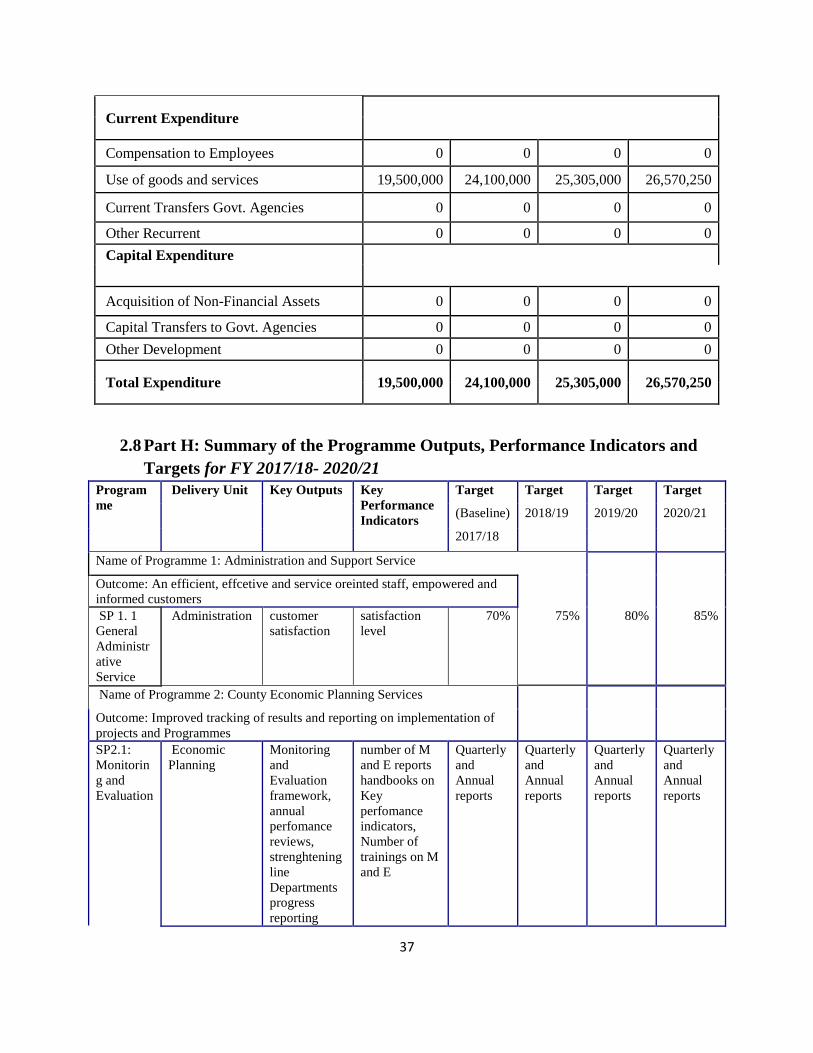
2.8 Part H: Summary of the Programme Outputs, Performance Indicators and
Targets for FY 2017/18- 2020/21
Program
me
Delivery Unit Key Outputs Key
Performance
Indicators
Target Target Target Target
(Baseline) 2018/19 2019/20 2020/21
2017/18
Name of Programme 1: Administration and Support Service
Outcome: An efficient, effcetive and service oreinted staff, empowered and
informed customers
SP 1. 1
General
Administr
ative
Service
Administration customer
satisfaction
satisfaction
level
70% 75% 80% 85%
Name of Programme 2: County Economic Planning Services
Outcome: Improved tracking of results and reporting on implementation of
projects and Programmes
SP2.1:
Monitorin
g and
Evaluation
Economic
Planning
Monitoring
and
Evaluation
framework,
annual
perfomance
reviews,
strenghtening
line
Departments
progress
reporting
number of M
and E reports
handbooks on
Key
perfomance
indicators,
Number of
trainings on M
and E
Quarterly
and
Annual
reports
Quarterly
and
Annual
reports
Quarterly
and
Annual
reports
Quarterly
and
Annual
reports

38
SP 2.2
Coordinati
on of
policy
formulatio
n and
plans
Economic
Planning
policies/plans
formulated/re
viewd
Number of
policiea/plans
formulated/rev
iewed
Quarterly
and
Annual
reports
Quarterly
and
Annual
reports
Quarterly
and
Annual
reports
Quarterly
and
Annual
reports
… e.t.c
Name of Programme 3: County financial Management
Outcome: A transparent and accountable system for the management of
public financial services
SP 3.1
Accountin
g services
Accounts
Department
Accounting
services
Appropriation
accounts for
both recurrent
and
development
votes
Appropria
tion
accounts
for both
recurrent
and
developm
ent votes
prepared
and
tabled in
county
assembly
by 30th
Septembe
r 2015
Appropria
tion
accounts
for both
recurrent
and
developm
ent votes
prepared
and
tabled in
county
assembly
by 30th
Septembe
r 2016
Appropria
tion
accounts
for both
recurrent
and
developm
ent votes
prepared
and
tabled in
county
assembly
by 30th
Septembe
r 2017
Appropria
tion
accounts
for both
recurrent
and
developm
ent votes
prepared
and
tabled in
county
assembly
by 30th
Septembe
r 2018
SP 3.2
Audit
service
Internal Audit
Department
Value- for -
Money
(VFM)
Audits
Number of
departments in
which VFM
audits
conducted
four VFM
audits
conducted
by June
2017
four VFM
audits
conducted
by June
2018
four VFM
audits
conducted
by June
2019
four VFM
audits
conducted
by June
2020
SP 3.3
Budget
formulatio
n
coordinati
on and
manageme
nt
Budget
Department
County
Budget
Sector Budget
Propasal,
Budget Policy
Statement,
Budget review
outlook paper,
Programme
Based Budget
SP 3.4
Resource
mobilizati
on
Revenue
Department
Funds
mobilized
from revenue
sources
% of funds
mobilized as a
percentage of
annual budget

39
3. DEPARTMENT OF AGRICULTURE, LIVESTOCK, FISHERIES
AND COOPERATIVE DEVELOPMENT
3.1 Part A: Vision
To be an innovative, vibrant and lead Department in sustainable management of the Agricultural
sector resources for socio economic development, and sustainable environmental stability.
3.2 Part B: Mission
To promote competitive and commercially oriented Agriculture through creation of an enabling
Environment and sustainable Natural Resource Management in order to improve to ensure Food
and Nutritional security,
3.3 Part C: Performance Overview
During the period under review the agriculture sub-sector recorded increased access to
agricultural credit and inputs, development of market infrastructure. Extension agricultural
services, value addition and development of horticulture however remain slow in the county. In
the fisheries sub-sector, the fish ponds and water pans constructed in the 5 constituencies under
the ESP in 2011/2012 have not been rehabilitated by the county as planned.
The area under cultivation agriculture also increased from 722 hectares to 14,400 hectares.
Further, 5 dairy cold storage facilities were put up. Agricultural production was bolstered by
favorable weather conditions and provision of low priced certified seeds and fertilizers supplied
by the county government.
In the co-operatives sub-sector, the County government procured fertilizers in bulk and
distributed it to the farmers during the reporting period. Also, over 150 co-operatives had been
registered as of august 2015.
3.3.1 Challenges and constraints
In general, challenges that affected the sector include the following:
1. Agricultural Inputs: There have been rising costs of production as a result of high and
fluctuating cost of fertilizers and agro-chemicals.
2. Climate Change: Vihiga County has continued to suffer from adverse effects of climate
change. This has been made worse by the fragile environment and absence of mitigation
measures.
3. Pests and Diseases: Crop pests such as red locusts, qualia birds, grain and stem borer’s
affected agricultural production in the county

40
4. Inadequate legal and policy frameworks: There are several pieces of legislation some of which
are outdated while others are prohibitive and overlapping thus detrimental to agricultural
development.
5. Low application of modern technology and overdependence on rain fed agriculture: Although
Kenya has a well-developed agricultural research infrastructure inadequate research extension-
farmer linkages and lack of demand-driven research are still evident at county level.
6. Inadequate value addition and marketing strategies. Marketing of agricultural products has
faced challenges due to their primary nature, damage during transportation, poor handling and
lack of a quality control.
7. Multiplicity of taxes: Farmers have been subjected to a multiple number of taxes from both
national levels in form of levies and at county level.
8. Inadequate access to affordable credit: This is the main cause of low production of agriculture
in the county. While the financial institutions and the cooperative movement, have made
considerable efforts to provide affordable credit to farmers, the high interest rate make it
impossible for most farmers to access to credit.
9. Land use in agriculture; there has been over-subdivision of land into uneconomic units in most
parts of the county. Moreover, the high population density in the county has put pressure on the
small land area.
10. Inadequate market and marketing infrastructure: The domestic market is small and lacks an
effective marketing information system and infrastructure. The dependence on a few brokers
makes the farmers vulnerable to exploitation.
11. The co-operative sub –sector experienced several challenges that include low capital base,
and management challenges
12. Poor livestock husbandry and fish farming practices.
In the fiscal year 2018/19 the county department of agriculture intends to continue with bulk
procurement of fertilizers and certified seeds and distribution to farmers at discounted prices;
mapping of disease zones in the county, Promotion horticulture and enhancement of value
addition of agricultural produce and extension service will be prioritized. The fisheries sub-
sector will be revitalized while efforts will be made to improve animal breed for higher
production.
The cooperative sub-sector intends to build capacity of members in governance and
accountability over the same period as well as continue the drive to mobilize the community in
forming new cooperative and increasing membership and contributions. Efforts will also be

41
made to develop and support business development services to link farmers with financial
institutions and access to markets.
3.4 Part D: Programmes and Objectives
Programme code Name of programme Objective
P1 Administration, Planning
and Support services
To provide efficient administrative services
to the
agriculture sector actors
P2 Livestock Development and
Management
To improve Veterinary services and
increased livestock
Production
P3 Fisheries Development and
Management
To increase quality fish production for
enhanced food
security and livelihoods
P4 Crop Development and
Management
To increase crop production for enhanced
food
security and livelihoods
P5 Cooperatives Development
To strengthen cooperative movements and
Management
P6 Agribusiness and Market
Development
To improve value chains in agricultural
production for
increased income
3.5 Part E: Summary of Expenditure by Programmes, 2017/18-2020/21
(Kshs.Millions)
Agriculture, Livestock, Fisheries & Co-operatives
Programme
Baseline
Estimates Estimates Projected Estimates
2017/18 2018/19 2019/20 2020/21
Programme 1: Administration Plannning and Support services
Sub Programme (SP)
SP 1. 1 GENERAL
ADMINISTRATIVE SERVICES 157,754,050 229,918,534 241,414,461 253,485,184
SP 1. 2 Research & Development 3,600,000 0 0 0
Total Expenditure of Programme
1 161,354,050 229,918,534 241,414,461 253,485,184
Programme 2: Livestock development and Management Services.

42
Baseline
Estimates Estimates Projected Estimates
2017/18 2018/19 2019/20 2020/21
SP 2. 1, Value Chain Development 1,800,000 - - -
SP 2. 2. Veterinary Services and
Extention 3,716,104 15,217,484
15,978,358
16,777,276
SP 2.3, Livestock Extention 2,016,103 17,089,192
17,943,652
18,840,834
Total Expenditure of Programme
2 7,532,207 32,306,676 33,922,010 35,618,110
Programme 3: Fisheries development & Management Services.
Baseline
Estimates Estimates Projected Estimates
2017/18 2018/19 2019/20 2020/21
SP 3. 1 Promotion of Fish Farming 3,618,606 36,750,290 38,587,805 40,517,195
Total Expenditure of Programme
3 3,618,606 36,750,290 38,587,805 40,517,195
Programme 4: Crop Development and Management Services.
Baseline
Estimates Estimates Projected Estimates
2017/18 2018/19 2019/20 2019/20
SP 4. 1, Crop Extention 4,735,921 11,527,766 12,104,154 12,709,362
SP 4. 2. Farm Input Subsidy 500,000 70,000,000 73,500,000 77,175,000
SP 4.3, Cash crop production and
development 200,000 15000000 15,750,000 16,537,500
SP 4.4, Food Security Initiative 0 0 0 0
Total Expenditure of Programme
4 5,435,921 96,527,766 101,354,154 106,421,862
Programme 5: Co-operative Development.
Baseline
Estimates Estimates Projected Estimates
2017/18 2018/19 2019/20 2020/21
SP 5. 1 Co-operative Development
Services 1,477,402 6,096,873 6,401,717 6,721,802
Total Expenditure of Programme
3 1,477,402 6,096,873 6,401,717 6,721,802
Programme 6: Agri-business.

43
Baseline
Estimates Estimates Projected Estimates
2017/18 2018/19 2019/20 2020/21
SP 6. 1 Market development and
Promotion 3,937,233 - - -
SP 6. 2 Value addition - - - -
Total Expenditure of Programme
3 3,937,233 0 0 0
Total Expenditure of Vote ------- 183,355,419 401,600,139 192,446,854 202,069,197
3.6 Part F: Summary of Expenditure by Vote and Economic Classification
(Kshs. Million)
Expenditure Classification
Baseline
Estimates Estimates Projected Estimates
2017/18 2018/19 2019/20 2020/21
Current Expenditure
Compensation to Employees 100,175,279 109,991,384 115,490,953 121,265,501
Use of goods and services 24,014,571 50,037,761 52,539,649 55,166,631
Current Transfers Govt. Agencies 0 0 0 0
Other Recurrent 1,566,336 5,070,994 5,324,544 5,590,771
Capital Expenditure
Acquisition of Non-Financial Assets 0 0 0 -
Capital Transfers to Government Agencies 0 0 0 -
Other Development 57,599,233 232,500,000
244,125,000
256,331,250
Total Expenditure of Vote …… 183,355,419 397,600,139 417,480,146 438,354,153

44
3.7 Part G: Summary of Expenditure by Programme, Sub-Programme and
Economic Classification (KShs. Million)
Expenditure Classification
Baseline
Estimates Estimates Projected Estimates
2017/18 2018/19 2019/20 2020/21
ADMINSTRATION,PLANNING AND SUPPORT SERVICES.
Current Expenditure
Compensation to Employees 100,175,279 109,991,384 115,490,953 121,265,501
Use of goods and services 7,356,638 34,586,156 36,315,464 38,131,237
Current Transfers Govt. Agencies 0 0 0 0
Other Recurrent 160,133 4,340,994 4,558,044 4,785,946
Capital Expenditure
Acquisition of Non-Financial Assets 0 0 0 -
Capital Transfers to Govt. Agencies 0 0 0 -
Other Development 53,662,000 81,000,000
85,050,000
89,302,500
Total Expenditure 161,354,050 229,918,534 241,414,461 253,485,184
Sub-Programme 1.1: General Administration duties
Expenditure Classification
Baseline
Estimates Estimates Projected Estimates
2017/18 2018/19 2019/20 2020/21
Current Expenditure
Compensation to Employees 100,175,279 109,991,384 115,490,953 121,265,501
Use of goods and services 3,756,638 34,586,156 36,315,464 38,131,237
Current Transfers Govt. Agencies 0 0 0 0
Other Recurrent 160,133 4,340,994 4,558,044 4,785,946
Capital Expenditure
Acquisition of Non-Financial Assets 0 0 0 0
Capital Transfers to Govt. Agencies 0 0 0 0
Other Development 53,662,000 81,000,000
85,050,000
89,302,500
Total Expenditure 157,754,050 229,918,534 241,414,461 253,485,184
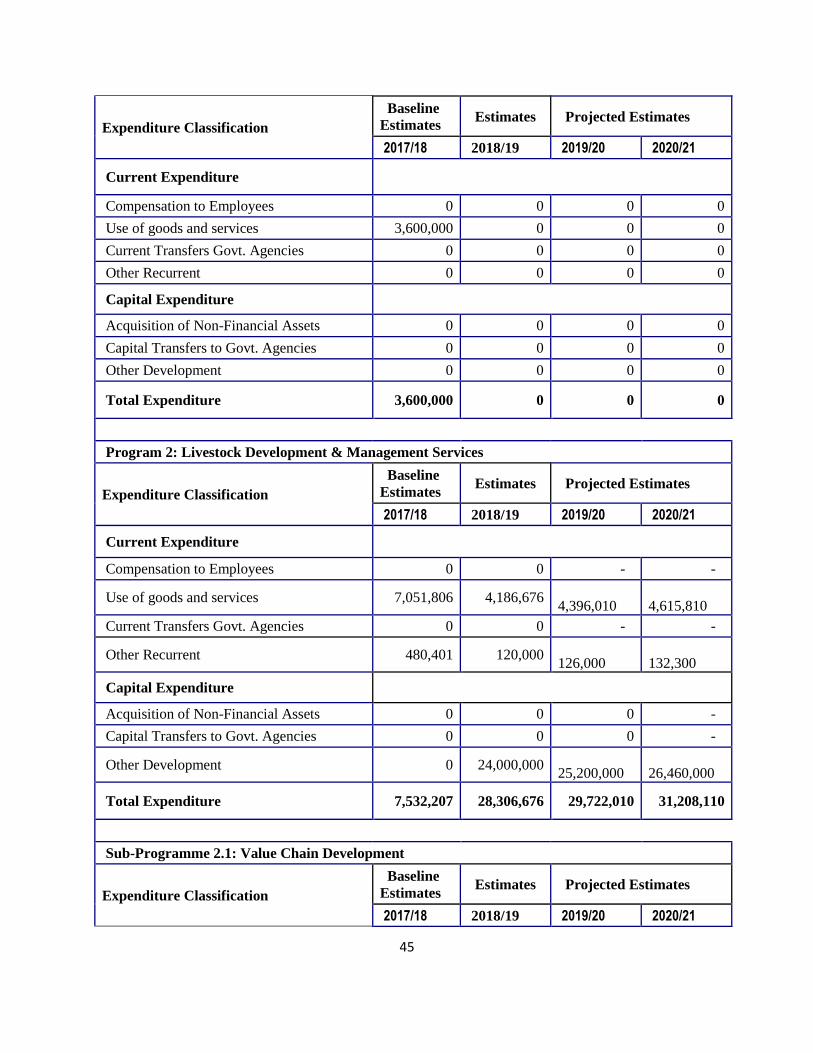
Sub-Programme 1.2: Research and Development
45
Expenditure Classification
Baseline
Estimates Estimates Projected Estimates
2017/18 2018/19 2019/20 2020/21
Current Expenditure
Compensation to Employees 0 0 0 0
Use of goods and services 3,600,000 0 0 0
Current Transfers Govt. Agencies 0 0 0 0
Other Recurrent 0 0 0 0
Capital Expenditure
Acquisition of Non-Financial Assets 0 0 0 0
Capital Transfers to Govt. Agencies 0 0 0 0
Other Development 0 0 0 0
Total Expenditure 3,600,000 0 0 0
Program 2: Livestock Development & Management Services
Expenditure Classification
Baseline
Estimates Estimates Projected Estimates
2017/18 2018/19 2019/20 2020/21
Current Expenditure
Compensation to Employees 0 0 - -
Use of goods and services 7,051,806 4,186,676
4,396,010
4,615,810
Current Transfers Govt. Agencies 0 0 - -
Other Recurrent 480,401 120,000
126,000
132,300
Capital Expenditure
Acquisition of Non-Financial Assets 0 0 0 -
Capital Transfers to Govt. Agencies 0 0 0 -
Other Development 0 24,000,000
25,200,000
26,460,000
Total Expenditure 7,532,207 28,306,676 29,722,010 31,208,110
Sub-Programme 2.1: Value Chain Development
Expenditure Classification
Baseline
Estimates Estimates Projected Estimates
2017/18 2018/19 2019/20 2020/21

46
Current Expenditure
Compensation to Employees 0 0 0 0
Use of goods and services 1,800,000 0 0 0
Current Transfers Govt. Agencies 0 0 0 0
Other Recurrent 0 0 0 0
Capital Expenditure
Acquisition of Non-Financial Assets 0 0 0 0
Capital Transfers to Govt. Agencies 0 0 0 0
Other Development 0 - - -
Total Expenditure 1,800,000 0 0 0
Sub-Programme 2. 2: Veterinary Services & Extention
Expenditure Classification
Baseline
Estimates Estimates Projected Estimates
2017/18 2018/19 2019/20 2020/21
Current Expenditure
Compensation to Employees 0 0 - -
Use of goods and services 3,475,903 3,172,484
3,331,108
3,497,663
Current Transfers Govt. Agencies 0 0 - -
Other Recurrent 240,200 45,000
47,250
49,613
Capital Expenditure
Acquisition of Non-Financial Assets 0 0 0 0
Capital Transfers to Govt. Agencies 0 0 0 0
Other Development 0 12000000 12600000 13230000
Total Expenditure 3,716,103 15,217,484 15,978,358 16,777,276
Sub-Programme 2. 3: Livestock Extention
Expenditure Classification
Baseline
Estimates Estimates Projected Estimates
2017/18 2018/19 2019/20 2020/21
Current Expenditure
Compensation to Employees 0 0 - -

47
Use of goods and services 1,775,903 1,014,192
1,064,902
1,118,147
Current Transfers Govt. Agencies 0 0 - -
Other Recurrent 240,200 75,000
78,750
82,688
Capital Expenditure
Acquisition of Non-Financial Assets 0 0 0 -
Capital Transfers to Govt. Agencies 0 0 0 -
Other Development 0 16,000,000
16,800,000
17,640,000
Total Expenditure 2,016,103 17,089,192 17,943,652 18,840,834
Programme 3. Fisheries Development & Management
Expenditure Classification
Baseline
Estimates Estimates Projected Estimates
2017/18 2018/19 2019/20 2020/21
Current Expenditure
Compensation to Employees 0 0 - -
Use of goods and services 3,378,406 3,700,290
3,885,305
4,079,570
Current Transfers Govt. Agencies 0 0 - -
Other Recurrent 240,200 550,000
577,500
606,375
Capital Expenditure
Acquisition of Non-Financial Assets 0 0 - 0
Capital Transfers to Govt. Agencies 0 0 - 0
Other Development 0 32,500,000
34,125,000
35,831,250
Total Expenditure 3,618,606 36,750,290 38,587,805 40,517,195
Sub Programme 3.1 : Promotion of Fish Farming
Expenditure Classification
Baseline
Estimates Estimates Projected Estimates
2017/18 2018/19 2019/20 2020/21
Current Expenditure
Compensation to Employees 0 0 - -

48
Use of goods and services 3,378,406 3,700,290
3,885,305
4,079,570
Current Transfers Govt. Agencies 0 0 - -
Other Recurrent 240,200 550,000
577,500
606,375
Capital Expenditure
Acquisition of Non-Financial Assets 0 0 - -
Capital Transfers to Govt. Agencies 0 0 - -
Other Development 0 32,500,000
34,125,000
35,831,250
Total Expenditure 3,618,606 36,750,290 38,587,805 40,517,195
Programme 4. Crop Development & Management Services
Expenditure Classification
Baseline
Estimates Estimates Projected Estimates
2017/18 2018/19 2019/20 2020/21
Current Expenditure
Compensation to Employees 0 0 - -
Use of goods and services 4,910,453 1,492,766
1,567,404
1,645,774
Current Transfers Govt. Agencies 0 0 - -
Other Recurrent 525,468 35,000
36,750
38,588
Capital Expenditure
Acquisition of Non-Financial Assets 0 0 - -
Capital Transfers to Govt. Agencies 0 0 - -
Other Development 0 95,000,000
99,750,000
104,737,500
Total Expenditure 5,435,921 96,527,766 101,354,154 106,421,862
Sub-Programme 4. 1: Crop Extention
Expenditure Classification
Baseline
Estimates Estimates Projected Estimates
2017/18 2018/19 2019/20 2020/21
Current Expenditure
Compensation to Employees 0 0 - -
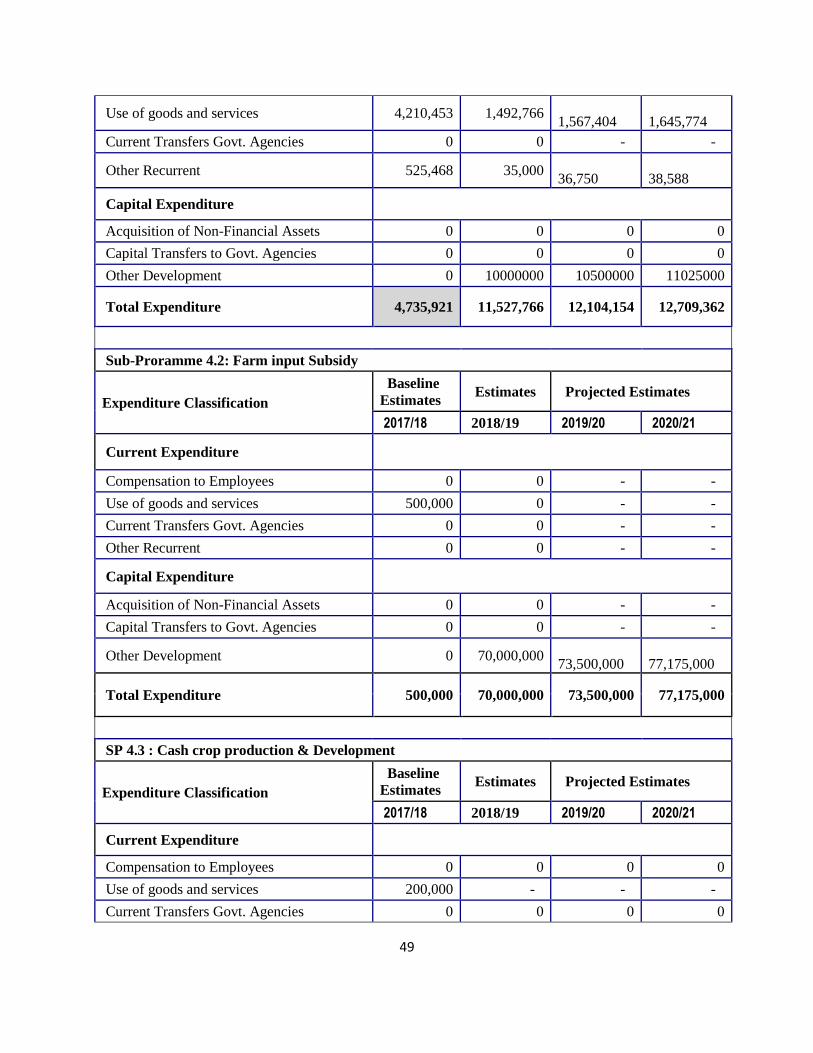
49
Use of goods and services 4,210,453 1,492,766
1,567,404
1,645,774
Current Transfers Govt. Agencies 0 0 - -
Other Recurrent 525,468 35,000
36,750
38,588
Capital Expenditure
Acquisition of Non-Financial Assets 0 0 0 0
Capital Transfers to Govt. Agencies 0 0 0 0
Other Development 0 10000000 10500000 11025000
Total Expenditure 4,735,921 11,527,766 12,104,154 12,709,362
Sub-Proramme 4.2: Farm input Subsidy
Expenditure Classification
Baseline
Estimates Estimates Projected Estimates
2017/18 2018/19 2019/20 2020/21
Current Expenditure
Compensation to Employees 0 0 - -
Use of goods and services 500,000 0 - -
Current Transfers Govt. Agencies 0 0 - -
Other Recurrent 0 0 - -
Capital Expenditure
Acquisition of Non-Financial Assets 0 0 - -
Capital Transfers to Govt. Agencies 0 0 - -
Other Development 0 70,000,000
73,500,000
77,175,000
Total Expenditure 500,000 70,000,000 73,500,000 77,175,000
SP 4.3 : Cash crop production & Development
Expenditure Classification
Baseline
Estimates Estimates Projected Estimates
2017/18 2018/19 2019/20 2020/21
Current Expenditure
Compensation to Employees 0 0 0 0
Use of goods and services 200,000 - - -
Current Transfers Govt. Agencies 0 0 0 0

50
Other Recurrent 0 - - -
Capital Expenditure
Acquisition of Non-Financial Assets 0 0 0 0
Capital Transfers to Govt. Agencies 0 0 0 0
Other Development 0 15000000 15750000 16537500
Total Expenditure 200,000 15,000,000 15,750,000 16,537,500
SP 4.4 : Food security initiatives
Expenditure Classification
Baseline
Estimates Estimates Projected Estimates
2017/18 2018/19 2019/20 2020/21
Current Expenditure
Compensation to Employees 0 0 0 0
Use of goods and services 0 0 0 0
Current Transfers Govt. Agencies 0 0 0 0
Other Recurrent 0 0 0 0
Capital Expenditure
Acquisition of Non-Financial Assets 0 0 0 0
Capital Transfers to Govt. Agencies 0 0 0 0
Other Development 0 0 0 0
Total Expenditure 0 0 0 0
Program 5: Co-operatives Development
Expenditure Classification
Baseline
Estimates Estimates Projected Estimates
2017/18 2018/19 2019/20 2020/21
Current Expenditure
Compensation to Employees 0 0 - -
Use of goods and services 1,317,269 6,071,873
6,375,467
6,694,240
Current Transfers Govt. Agencies 0 0 - -
Other Recurrent 160,133 25,000
26,250
27,563
Capital Expenditure
Acquisition of Non-Financial Assets 0 0 - -

51
Capital Transfers to Govt. Agencies 0 0 - -
Other Development 0 0 - -
Total Expenditure 1,477,402 6,096,873 6,401,717 6,721,802
Sub-Programme 5.1 : Co-operatives Development Services
Expenditure Classification
Baseline
Estimates Estimates Projected Estimates
2017/18 2018/19 2019/20 2020/21
Current Expenditure
Compensation to Employees 0 0 - -
Use of goods and services 1,317,269 6,071,873
6,375,467
6,694,240
Current Transfers Govt. Agencies 0 0 - -
Other Recurrent 160,133 25,000
26,250
27,563
Capital Expenditure
Acquisition of Non-Financial Assets 0 0 - -
Capital Transfers to Govt. Agencies 0 0 - -
Other Development 0 0 - -
Total Expenditure 1,477,402 6,096,873 6,401,717 6,721,802
Program 6: Agri- Business
Expenditure Classification
Baseline
Estimates Estimates Projected Estimates
2017/18 2018/19 2019/20 2020/21
Current Expenditure
Compensation to Employees 0 0 0 0
Use of goods and services 0 0 0 0
Current Transfers Govt. Agencies 0 0 0 0
Other Recurrent 0 0 0 0
Capital Expenditure
Acquisition of Non-Financial Assets 0 0 0 0
Capital Transfers to Govt. Agencies 0 0 0 0
Other Development 3,937,233 - - -
Total Expenditure 3,937,233 0 0 0

52
Sub-Programme 6.1 : Market Development & Promotions
Expenditure Classification
Baseline
Estimates Estimates Projected Estimates
2017/18 2018/19 2019/20 2020/21
Current Expenditure
Compensation to Employees 0 0 0 0
Use of goods and services 0 0 0 0
Current Transfers Govt. Agencies 0 0 0 0
Other Recurrent 0 0 0 0
Capital Expenditure
Acquisition of Non-Financial Assets 0 0 0 0
Capital Transfers to Govt. Agencies 0 0 0 0
Other Development 3,937,233 - - -
Total Expenditure 3,937,233 0 0 0
Sub-Programme 6.2 : Value Addition
Expenditure Classification
Baseline
Estimates Estimates Projected Estimates
2017/18 2018/19 2019/20 2020/21
Current Expenditure
Compensation to Employees 0 0 0 0
Use of goods and services 0 0 0 0
Current Transfers Govt. Agencies 0 0 0 0
Other Recurrent 0 0 0 0
Capital Expenditure
Acquisition of Non-Financial Assets 0 0 0 0
Capital Transfers to Govt. Agencies 0 0 0 0
Other Development 0 - - -
Total Expenditure 0 - - -

53
3.8 Part H: Summary of the Programme Outputs, Performance Indicators and
Targets for FY 2017/18- 2020/21
Programme Delivery
Unit
Key
Outputs
Key
Performance
Indicators
Target Target Target Target
(Baseline
)
2018/19 2019/20 2020/21
2017/18
Programme.1 Administration and Planning and Support Service
Outcome: Efficient and updated management of Agriculture
S.P.1Genera
l
Administrati
ve Service
Administrati
on
Policies,
Bills and
Legal
notices
developed
and
disseminated
No. of policies,
no of bills
no legal notices
3
policies,
2 bills
1 legal
notice
3
policies,
2 bills
1 legal
notice
3
policies,
2 bills
1 legal
notice
3
policies,
2 bills
1 legal
notice
Programme.2 Livestock development and Management
Outcome: Improved performance of livestock industry
CSP.2.1
Value chain
development
Livestock
SP.2.1.
Veterinary
Services and
Extension
Veterinary Improved
disease
control
New animal
breeds
introduced
No. of animal
disease
surveillance
carried out
No. of new
animal breeds
Introduced
4
survillanc
e,
3 new
breeds
introduce
d
3
survilanc
es,
2 new
breeds
4
survilanc
es,
1 new
breed
4
survilanc
es,
I new
breed
SP.2.2
Livestock
extension.
Livestock Livestock
policies and
strategies
disseminated
No. of policies
and strategies
disseminated
4 no field
visits
4 no field
vistis
4 no field
visits
4 no field
visits
Programme.3 Fisheries Development and Management
Outcome: Increased food security and earnings from fisheries sector
SP.3.1
Promotion
of fish
farming
Fisheries Acquacultur
e technology
and
innovations
transfer
Number of
aquaculture
products
marketing
innovations/outle
ts established
Number of fish
consumption
promotion
campaigns
carried out
2,
10
3
20
5
30
7
40
Programme.4 crop development and management
Outcome: Increased food security and earnings

54
SP.4.1. Crop
extension
Crops Farmer
capacity
building
No. of farmers
trained
100 200 300 400
SP.4.2 farm
input
subsidy
crops Bulk
Procurement
of Fertilizers
and seeds in
Metric Tonnes
(MT)
Quantity of
Fertilizer/seeds(
MT)
400T
subsidize
d
fertilizers
/
seeds
450T
subsidize
d
fertilizers
/ seeds
500T
subsidize
d
fertilizers
/ seeds
500T
subsidize
d
fertilizers
/ seeds
Programme.5 Cooperatives development
Outcome: Improved marketing and economies of scale
SP.5.1
Cooperative
Developmen
t Services
Cooperative
s
Cooperative
societies
formed/reviv
ed
No. of
Cooperative
societies
formed/revived
10 20 30 40

55
4. HEALTH SERVICES
4.1 Vision
An excellent, dynamic and globally competitive provider of health services in the County, that
contribute to a healthy and effective and human capital.
4.2 Mission
“To deliberately build progressive, responsive and sustainable technologically driven, evidence-
based and client cantered health systems for accelerated attainment of highest standard of health
care to all residents of Vihiga County.”
4.3 PERFOMANCE OVERVIEW
The Kenya Vision 2030 goal for the Health sector is to provide equitable and affordable quality
health services to all Kenyans. This is in recognition that good health and nutrition enhances the
productivity of human capital. Accordingly, the Vihiga County Department of Health has
continued with its mandate of delivery of health service through provision of preventive, curative
and rehabilitative services. In the FY 2017/18 budget more emphasis was put on improvement of
access to delivery through targeted investments in community health systems. The budget gave
priority to activities aimed at scaling up primary health care services at the community level.
4.3.1 Expenditure trends
Major achievements for the period 2017/2018 include;
Motivation of health workers through job promotion
Procurement and distribution of Drugs to all the public health facilities in the county
Performance appraisal of all health staff support.
Timely Compensation to employees
Successful implementation of free maternity services
Immunization coverage scaled up in the county
National Health Days was successfully observed (e.g. World Aids Day)
4.3.2 Constraints and challenges in budget implementation;
Slow disbursement of funds from the county treasury
Inadequate funding to support sub-county health facilities
Staff shortages in most health facilities
Inadequate equipment and drug supplies
Operationalization of the CDF constructed facilities without the necessary support
systems
Frequent water shortages and power blackouts
Frequent outbreaks of communicable diseases

56
4.3.3 Major services/outputs to be provided in MTEF period 2017/18-2020/21
The 2017/18 budget will give focus on programmes and strategies that shall enhance equitable
access to quality health services. Such measures will include: improving immunization coverage
for children, improving maternal health care by ensuring that most deliveries occur in health
facilities under the care of skilled health attendance, and reducing morbidity and mortality
related to malaria, HIV.AIDs, Tuberculosis and non-communicable diseases. Effort shall also be
made to strengthen referral system, improving patients care, scaling up of community health
strategy and ACSM, recruting, motivation and retention of health staff and regular replenishment
of medical and non-pharmaceutical supplies. Scale up health Nutrition support services and
Monitoring and Evaluation of Health Services will also be a priority. The department will also
continue partnering with the national government and other stakeholders in the sector in
acquiring medical equipment and supplies with the aim of improving health care services in all
the health facilities. Emphasis will also be put to support capacity building in management of
health facilities as well as improving skills of the health workers.
4.4 Part D: PROGRAMMES AND OBJECTIVES
PROGRAMME
CODE
NAME OF PROGRAMME OBJECTIVE
P1 Administration, Planning and Support
Service
To plan and implement policies
that provide effective and efficient
health delivery services
P2 Promotive and Preventive health care
services
To reduce disease incidences for a
healthy society.
P3 Curative health services To provide affordable and
accessible healthcare services.
P3 Infant and maternal healthcare To improve maternal and child
health care
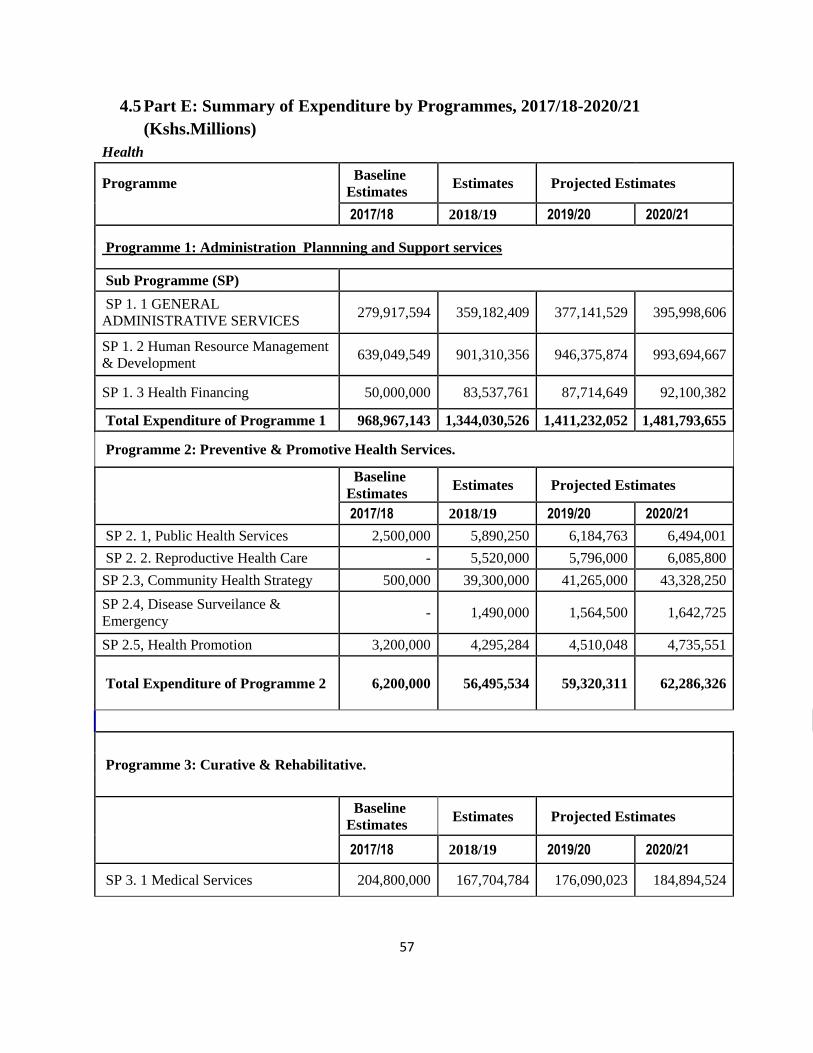
57
4.5 Part E: Summary of Expenditure by Programmes, 2017/18-2020/21
(Kshs.Millions)
Health
Programme
Baseline
Estimates Estimates Projected Estimates
2017/18 2018/19 2019/20 2020/21
Programme 1: Administration Plannning and Support services
Sub Programme (SP)
SP 1. 1 GENERAL
ADMINISTRATIVE SERVICES 279,917,594 359,182,409 377,141,529 395,998,606
SP 1. 2 Human Resource Management
& Development 639,049,549 901,310,356 946,375,874 993,694,667
SP 1. 3 Health Financing 50,000,000 83,537,761 87,714,649 92,100,382
Total Expenditure of Programme 1 968,967,143 1,344,030,526 1,411,232,052 1,481,793,655
Programme 2: Preventive & Promotive Health Services.
Baseline
Estimates Estimates Projected Estimates
2017/18 2018/19 2019/20 2020/21
SP 2. 1, Public Health Services 2,500,000 5,890,250 6,184,763 6,494,001
SP 2. 2. Reproductive Health Care - 5,520,000 5,796,000 6,085,800
SP 2.3, Community Health Strategy 500,000 39,300,000 41,265,000 43,328,250
SP 2.4, Disease Surveilance &
Emergency - 1,490,000 1,564,500 1,642,725
SP 2.5, Health Promotion 3,200,000 4,295,284 4,510,048 4,735,551
Total Expenditure of Programme 2 6,200,000 56,495,534 59,320,311 62,286,326
Programme 3: Curative & Rehabilitative.
Baseline
Estimates Estimates Projected Estimates
2017/18 2018/19 2019/20 2020/21
SP 3. 1 Medical Services 204,800,000 167,704,784 176,090,023 184,894,524

58
SP 3. 2 Drugs & Other Medical
Supplies - 10,240,000 10,752,000 11,289,600
SP 3. 3 County Referal Services 1,300,000 1,740,000 1,827,000 1,918,350
Total Expenditure of Programme 3 206,100,000 179,684,784 188,669,023 198,102,474
Programme 4: Maternal & Child Care Services.
Baseline
Estimates Estimates Projected Estimates
2017/18 2018/19 2019/20 2020/21
SP 4. 1, Immunization 4,000,000 5,740,000 6,027,000 6,328,350
SP 4. 2. Antinatal & 500,000 1,440,000 1,512,000 1,587,600
Postnatal Health Care
SP 4.3, New Born Child & Adolescent 0 3,534,000 3,710,700 3,896,235
SP 4.4, Maternity Services 67,940,000 43,580,000 45,759,000 48,046,950
SP 4.5, Nutrition Services 0 440,000 462,000 485,100
Total Expenditure of Programme 4 72,440,000 54,734,000 57,470,700 60,344,235
Total Expenditure of 1,253,707,143 1,634,944,844 1,716,692,086 1,802,526,691
Vote -------
4.6 Part F: Summary of Expenditure by Vote and Economic Classification
(Kshs. Million)
Expenditure Classification Baseline
Estimates
Baseline
Estimates Projected Estimates
2017/18 2018/19 2019/20 2020/21
Current Expenditure
Compensation to Employees 639,049,549 934,430,356 981,151,874 1,030,209,467
Use of goods and services 321,007,594 365,721,670 384,007,754 403,208,141
Current Transfers Govt. Agencies 0 0 0 0
Other Recurrent 20,000,000 13,000,000 13,650,000 14,332,500

59
Capital Expenditure
Acquisition of Non-Financial Assets 0 0 0 0
Capital Transfers to Government
Agencies 0 0 0 0
Other Development 223,650,000 321,792,818 337,882,459 354,776,582
Total Expenditure of Vote …… 1,203,707,143 1,634,944,844 1,716,692,086 1,802,526,691
4.7 Part G: Summary of Expenditure by Programme, Sub-Programme and
Economic Classification (KShs. Million)
Expenditure Classification Baseline
Estimates Estimates Projected Estimates
2017/18 2018/19 2019/20 2020/21
ADMINSTRATION,PLANNING AND SUPPORT SERVICES.
Current Expenditure
Compensation to Employees 639,049,549 901,310,356 946,375,874 993,694,667
Use of goods and services 50,267,594 113,427,352 119,098,720 125,053,656
Current Transfers Govt. Agencies 0 0 0 0
Other Recurrent 10,000,000 7,500,000 7,875,000 8,268,750
Capital Expenditure
Acquisition of Non-Financial Assets 0 0 0 0
Capital Transfers to Govt. Agencies 0 0 0 0
Other Development 219,650,000 321,792,818 337,882,459 354,776,582
Total Expenditure 918,967,143 1,344,030,526 1,411,232,052 1,481,793,655

60
Sub-Programme 1.1: General Administration duties
Expenditure Classification
Baseline
Estimates Estimates Projected Estimates
2017/18 2018/19 2019/20 2020/21
Current Expenditure
Compensation to Employees 0 0 0 0
Use of goods and services 50,267,594 30,889,591 32,434,071 34,055,774
Current Transfers Govt. Agencies 0 0 0 0
Other Recurrent 0 6,500,000 6,825,000 7,166,250
Capital Expenditure
Acquisition of Non-Financial Assets 0 0 0 0
Capital Transfers to Govt. Agencies 0 0 0 0
Other Development 219,650,000 321,792,818 337,882,459 354,776,582
Total Expenditure 269,917,594 359,182,409 377,141,529 395,998,606
Sub-Programme 1.2: Human Resource Management & Development
Expenditure Classification
Baseline
Estimates Estimates Projected Estimates
2017/18 2018/19 2019/20 2020/21
Current Expenditure
Compensation to Employees 639,049,549 901,310,356 946,375,874 993,694,667
Use of goods and services 0 0 0 0
Current Transfers Govt. Agencies 0 0 0 0
Other Recurrent 0 0 0 0
Capital Expenditure

61
Acquisition of Non-Financial Assets 0 0 0 0
Capital Transfers to Govt. Agencies 0 0 0 0
Other Development 0 0 0 0
Total Expenditure 639,049,549 901,310,356 946,375,874 993,694,667
SP 1. 3 Health Financing
Expenditure Classification
Baseline
Estimates Estimates Projected Estimates
2017/18 2018/19 2019/20 2020/21
Current Expenditure
Compensation to Employees 0 0 0 0
Use of goods and services 0 82,537,761 86,664,649 90,997,882
Current Transfers Govt. Agencies 0 0 0 0
Other Recurrent 0 1000000 1050000 1102500
Capital Expenditure
Capital Transfers to Govt. Agencies 0 0 0 0
Other Development 0 0 0 0
Total Expenditure 0 83,537,761 87,714,649 92,100,382
Programme 2: Preventive & Promotive Health Services.
Expenditure Classification
Baseline
Estimates Estimates Projected Estimates
2017/18 2018/19 2019/20 2020/21
Current Expenditure
Compensation to Employees 0 33120000 34776000 36514800
Use of goods and services 6,200,000 23,375,534
24,544,311
25,771,526

62
Current Transfers Govt. Agencies 0 0 0 0
Other Recurrent 0 0 0 0
Capital Expenditure
Acquisition of Non-Financial Assets 0 0 0 0
Capital Transfers to Govt. Agencies 0 0 0 0
Other Development 0 0 0 0
Total Expenditure 6,200,000 56,495,534 59,320,311 62,286,326
Sub-Programme 2.1: Public Health Services
Expenditure Classification
Baseline
Estimates Estimates Projected Estimates
2017/18 2018/19 2019/20 2020/21
Current Expenditure
Compensation to Employees 0 0 0 0
Use of goods and services 2,500,000 5,890,250 6,184,763 6,494,001
Current Transfers Govt. Agencies 0 0 0 0
Other Recurrent 0 0 0 0
Capital Expenditure
Acquisition of Non-Financial Assets 0 0 0 0
Capital Transfers to Govt. Agencies 0 0 0 0
Other Development 0 0 0 0
Total Expenditure 2,500,000 5,890,250 6,184,763 6,494,001
Sub-Programme 2. 2: Productive Health Care
Expenditure Classification Baseline
Estimates Estimates Projected Estimates
2017/18 2018/19 2019/20 2020/21
Current Expenditure
Compensation to Employee 0 0 0 0

63
Use of goods and services 0 5,520,000 5,796,000 6,085,800
Current Transfers Govt. Agencies 0 0 0 0
Other Recurrent 0 0 0 0
Capital Expenditure
Acquisition of Non-Financial Assets 0 0 0 0
Capital Transfers to Govt. Agencies 0 0 0 0
Other Development 0 0 0 0
Total Expenditure 0 5,520,000 5,796,000 6,085,800
Sub-Programme 2. 3:Community Health Strategy
Expenditure Classification
Baseline
Estimates Estimates Projected Estimates
2017/18 2018/19 2019/20 2020/21
Current Expenditure
Compensation to Employees 0 33120000 34776000 36514800
Use of goods and services 500,000 6,180,000 6,489,000 6,813,450
Current Transfers Govt. Agencies 0 0 0 0
Other Recurrent 0 0 0 0
Capital Expenditure
Acquisition of Non-Financial Assets 0 0 0 0
Capital Transfers to Govt. Agencies 0 0 0 0
Other Development 0 0 0 0
Total Expenditure 500,000 39,300,000 41,265,000 43,328,250
SP 2.4, Disease Surveilance & Emergency
Expenditure Classification
Baseline
Estimates Estimates Projected Estimates
2017/18 2018/19 2019/20 2020/21
Current Expenditure
Compensation to Employees 0 0 0 0

64
Use of goods and services 0 1,490,000 1,564,500 1,642,725
Current Transfers Govt. Agencies 0 0 0 0
Other Recurrent 0 0 0 0 Capital Expenditure Acquisition of Non-Financial Assets 0 0 0 0
Capital Transfers to Govt. Agencies 0 0 0 0
Other Development 0 0 0 0
Total Expenditure 0 1,490,000 1,564,500 1,642,725
SP 2.5, Health Promotion
Expenditure Classification
Baseline
Estimates Estimates Projected Estimates
2017/18 2018/19 2019/20 2020/21
Current Expenditure
Compensation to Employees 0 0 0 0
Use of goods and services 3,200,000 4,295,284 4,510,048 4,735,551
Current Transfers Govt. Agencies 0 0 0 0
Other Recurrent 0 0 0 0
Capital Expenditure Acquisition of Non-Financial Assets 0 0 0 0
Capital Transfers to Govt. Agencies 0 0 0 0
Other Development 0 0 0 0
Total Expenditure 3,200,000 4,295,284 4,510,048 4,735,551
Programme 3: Curative & Rehabilitative.
Expenditure Classification
Baseline
Estimates Estimates Projected Estimates
2017/18 2018/19 2019/20 2020/21
Current Expenditure
Compensation to Employees 0 0 0 0
Use of goods and services 193,100,000 175,184,784 183,944,023 193,141,224

65
Current Transfers Govt. Agencies 0 0 0 0
Other Recurrent 9,000,000 4,500,000 4,725,000 4,961,250
Capital Expenditure
Acquisition of Non-Financial Assets 0 0 0 0
Capital Transfers to Govt. Agencies 0 0 0 0
Other Development 4,000,000 0 0 0
Total Expenditure 206,100,000 179,684,784 188,669,023 198,102,474
SP 3. 1 Medical Services
Expenditure Classification
Baseline
Estimates Estimates Projected Estimates
2017/18 2018/19 2019/20 2020/21
Current Expenditure
Compensation to Employees 0 0 0 0
Use of goods and services 191,800,000 163,204,784 171,365,023 179,933,274
Current Transfers Govt. Agencies 0 0 0 0
Other Recurrent 9,000,000 4,500,000 4,725,000 4,961,250
Capital Expenditure
Acquisition of Non-Financial Assets 0 0 0 0
Capital Transfers to Govt. Agencies 0 0 0 0
Other Development 4,000,000 0 0 0
204,800,000 167,704,784 176,090,023 184,894,524
Total Expenditure
SP 3. 2 Drugs & Other Medical
Supplies
Expenditure Classification
Baseline
Estimates Estimates Projected Estimates
2017/18 2018/19 2019/20 2020/21
Current Expenditure
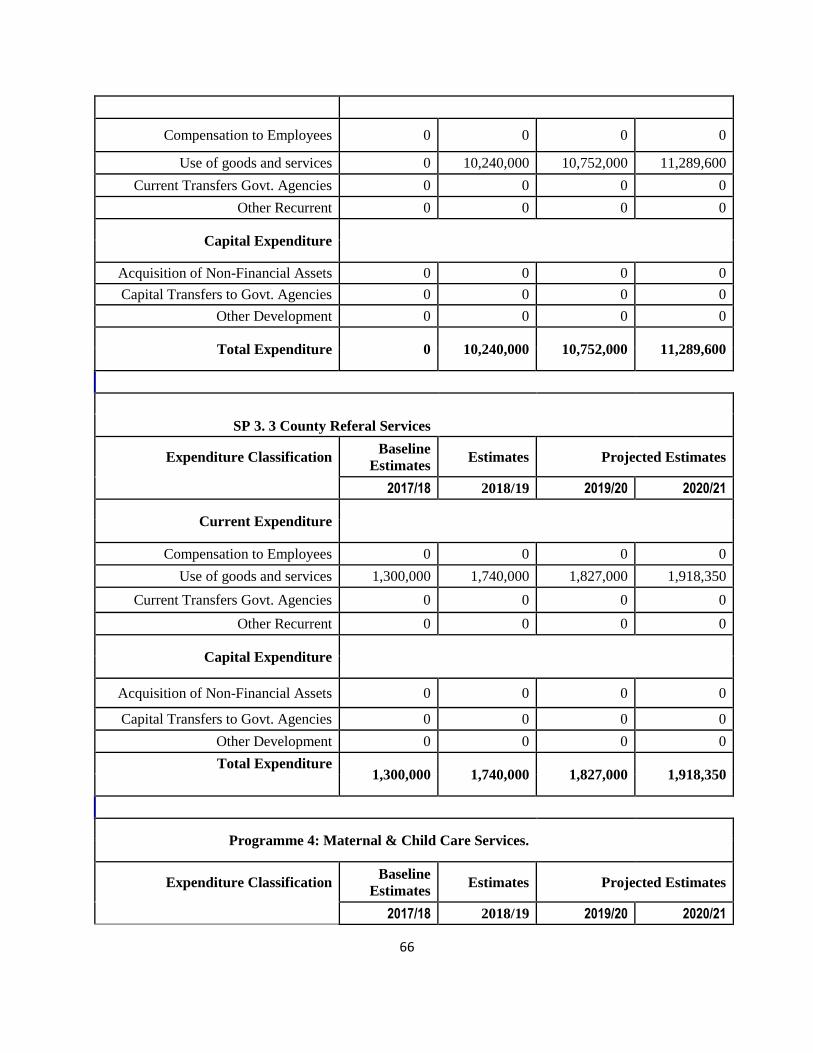
66
Compensation to Employees 0 0 0 0
Use of goods and services 0 10,240,000 10,752,000 11,289,600
Current Transfers Govt. Agencies 0 0 0 0
Other Recurrent 0 0 0 0
Capital Expenditure
Acquisition of Non-Financial Assets 0 0 0 0
Capital Transfers to Govt. Agencies 0 0 0 0
Other Development 0 0 0 0
Total Expenditure 0 10,240,000 10,752,000 11,289,600
SP 3. 3 County Referal Services
Expenditure Classification
Baseline
Estimates Estimates Projected Estimates
2017/18 2018/19 2019/20 2020/21
Current Expenditure
Compensation to Employees 0 0 0 0
Use of goods and services 1,300,000 1,740,000 1,827,000 1,918,350
Current Transfers Govt. Agencies 0 0 0 0
Other Recurrent 0 0 0 0
Capital Expenditure
Acquisition of Non-Financial Assets 0 0 0 0
Capital Transfers to Govt. Agencies 0 0 0 0
Other Development 0 0 0 0
Total Expenditure 1,300,000 1,740,000 1,827,000 1,918,350
Programme 4: Maternal & Child Care Services.
Expenditure Classification
Baseline
Estimates Estimates Projected Estimates
2017/18 2018/19 2019/20 2020/21

67
Current Expenditure
Compensation to Employees 0 0 0 0
Use of goods and services 71,440,000 53,734,000 56,420,700 59,241,735
Current Transfers Govt. Agencies 0 0 0 0
Other Recurrent 1,000,000 1,000,000 1,050,000 1,102,500
Capital Expenditure
Acquisition of Non-Financial Assets 0 0 0 0
Capital Transfers to Govt. Agencies 0 0 0 0
Other Development 0 0 0 0
Total Expenditure 72,440,000 54,734,000 57,470,700 60,344,235
SP 4. 1, Immunization
Expenditure Classification
Baseline
Estimates Estimates Projected Estimates
2017/18 2018/19 2019/20 2020/21s
Current Expenditure
Compensation to Employees 0 0 0 0
Use of goods and services 4,000,000 5,740,000 6,027,000 6,328,350
Current Transfers Govt. Agencies 0 0 0 0
Other Recurrent 0 0 0 0
Capital Expenditure
Acquisition of Non-Financial Assets 0 0 0 0
Capital Transfers to Govt. Agencies 0 0 0 0
Other Development 0 0 0 0
Total Expenditure 4,000,000 5,740,000 6,027,000 6,328,350
SP 4. 2. Antinatal & Postnatal Health Care

68
Expenditure Classification Baseline
Estimates Estimates Projected Estimates
2017/18 2018/19 2019/20 2020/21
Current Expenditure
Compensation to Employees 0 0 0 0
Use of goods and services 4,000,000 1,440,000 1,512,000 1,587,600
Current Transfers Govt. Agencies 0 0 0 0
Other Recurrent 0 0 0 0
Capital Expenditure
Acquisition of Non-Financial Assets 0 0 0 0
Capital Transfers to Govt. Agencies 0 0 0 0
Other Development 0 0 0 0
Total Expenditure 4,000,000 1,440,000 1,512,000 1,587,600
SP 4.3, New Born Child & Adolescent
Expenditure Classification
Baseline
Estimates Estimates Projected Estimates
2017/18 2018/19 2019/20 2020/21
Current Expenditure
Compensation to Employees 0 0 0 0
Use of goods and services 0 3,534,000 3,710,700 3,896,235
Current Transfers Govt. Agencies 0 0 0 0
Other Recurrent 0 0 0 0
Capital Expenditure
Acquisition of Non-Financial Assets 0 0 0 0
Capital Transfers to Govt. Agencies 0 0 0 0
Other Development 0 0 0 0
Total Expenditure 0 3,534,000 3,710,700 3,896,235
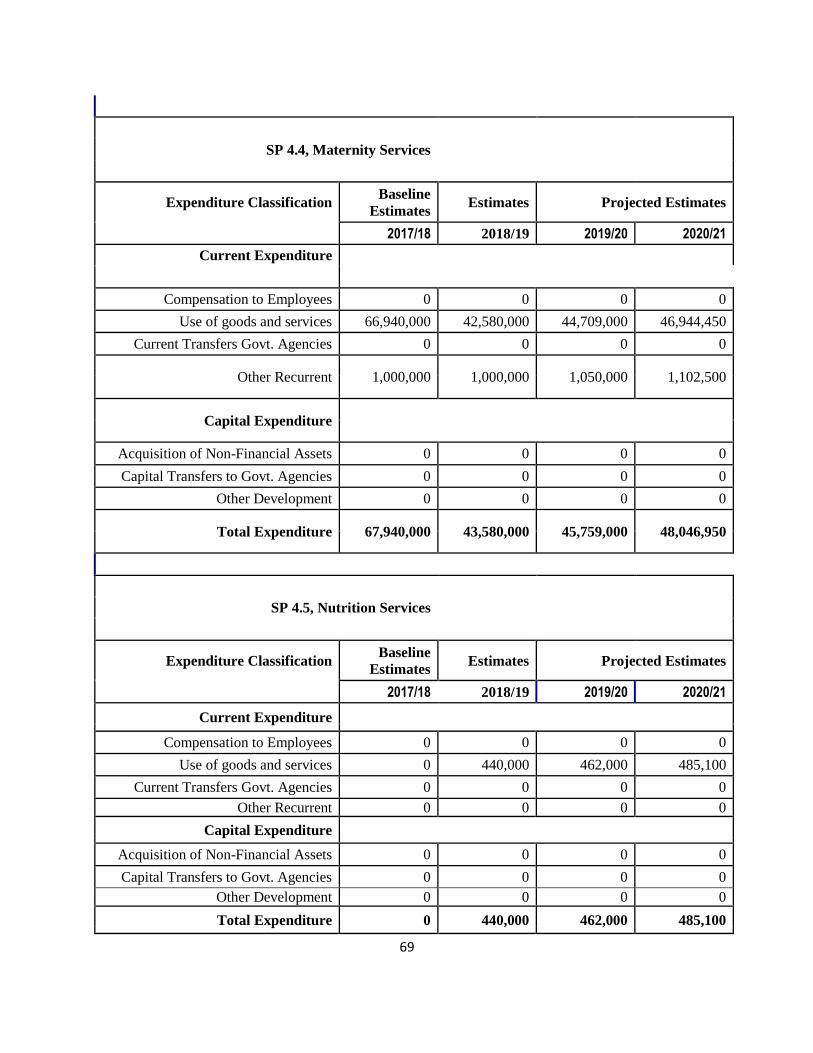
69
SP 4.4, Maternity Services
Expenditure Classification
Baseline
Estimates Estimates Projected Estimates
2017/18 2018/19 2019/20 2020/21
Current Expenditure
Compensation to Employees 0 0 0 0
Use of goods and services 66,940,000 42,580,000 44,709,000 46,944,450
Current Transfers Govt. Agencies 0 0 0 0
Other Recurrent 1,000,000 1,000,000 1,050,000 1,102,500
Capital Expenditure
Acquisition of Non-Financial Assets 0 0 0 0
Capital Transfers to Govt. Agencies 0 0 0 0
Other Development 0 0 0 0
Total Expenditure 67,940,000 43,580,000 45,759,000 48,046,950
SP 4.5, Nutrition Services
Expenditure Classification
Baseline
Estimates Estimates Projected Estimates
2017/18 2018/19 2019/20 2020/21
Current Expenditure Compensation to Employees 0 0 0 0
Use of goods and services 0 440,000 462,000 485,100
Current Transfers Govt. Agencies 0 0 0 0
Other Recurrent 0 0 0 0
Capital Expenditure Acquisition of Non-Financial Assets 0 0 0 0
Capital Transfers to Govt. Agencies 0 0 0 0
Other Development 0 0 0 0
Total Expenditure 0 440,000 462,000 485,100

70
4.8 Part H: Summary of the Programme Outputs, Performance Indicators and
Targets for FY 2017/18- 2021/22
Programme Delivery Unit Key
Outputs
Key
Performance
Indicators
Target Target Target Target
(Baseline) 2018/19 2019/20 2021/22
2017/18
PROGRAMME 1. ADMINISTRATIVE PLANNING AND SUPPORT
SERVICES
Outcome:
SP.1 .1
General
administratve
survices
Administration
Performance
monitoring
systems
No. of
Perfomance
Monitoring
System
50 60 80 100
SP 1. 2.Human
Resource
management
and
development
Administration
Improved
Service
Delivery
% of clients
satisfied 60% 70% 80% 90%
SP 1.3
Healthcare
finanacing
Administration
Improved
service
delivery
% of clients
satisfied 50% 60% 70% 80%
Programme 2: PROMOTIVE AND PREVENTIVE HEALTHCARE
SERVICES
Outcome:
SP 2. 1 Public
health services
public health Improved
hygiene &
sanitation
SP 2.2
Community
health strategy
public health Community
health
strategy
developed
& rolled out
Community
health strategy
rolled out
1 1 1 1
SP 2.5 Health
promotion
public health Advocacy
and
Awareness
on health
issues &
sanitation
% awareness
status of
community
members on
health issues &
sanitation
35% 45% 60% 80%
Programme 3. CURATIVE AND REHABILITATIVE HEALTH
SERVICES
Outcome:
SP. 3.1 Medical
services
SP 3.2 County
referal services Specialised
health care
services
% of referral
cases attended to
60% 70% 85% 100%

71
Programme 4. CHILD AND MATERNAL HEALTH CARE
Outcome:
SP.4.1
Immunisation
Reproductive
Health
Immunisation
&
Vaccination
% of fully
immunized
children
50% 60% 75% 100%
SP. 4.2
Antenatal and
post natal
healthcare
Reproductive
Health
Antenatal
and post
natal clinics
% of expectant
mothers
attending
antenatal/post
natal
healthcare
40% 65% 85% 100%
SP 4.3
Maternity
services
Reproductive
Health
Maternal
Health
Services
% deliveries
conducted by
skilled
attendant
45% 60% 75% 90%

72
5. EDUCATION, SCIENCE, TECHNICAL & VOCATIONAL
TRAINING
5.1 Vision
To be a lead county in the provision of competitive quality education, training, research and
innovation for sustainable development.
5.2 Mission
To provide, promote and coordinate quality education and training, and integration of science,
technology and innovation for sustainable socio- economic development.
5.3 Performance Overview
During the fy 2015/16, the county department continued to facilitate improvement of Early
Childhood Education and vocational training by constructing 32 ECDE centers and equipping
youth polytechnics. Moreover, the department set aside funds for rehabilitation of Kaimosi
University College, and infrastructure improvement in some primary schools. The county
government shall continue to work with the national government in ensuring that high enrolment
and transition rates at all levels of learning is achieved. The education department will also
continue to support the community resource centers and craft centres in the 25 wards.
During the financial year 2017/18 the department faced several challenges and constraints that
included:
limited funding that resulted in high pending bills for the development projects
High demand for bursaries
limited funds for disaster response in schools.
Weak monitoring and evaluation of the projects under construction
Poor workmanship and abandonment of some works by contractors
Limited resources for effective quality assurance and supervision of ECD and vocational
centres
In the Financial year 2018/2019 the department seeks to complete all the stalled projects as well
improve the top-up allowances for the ECD teachers and YP instructors. Efforts shall also be
made to expand on the food feeding programme, bursary allocation, scholarships and other
education support programmes.

73
5.4 Programmes and their Objectives
Programme
code
Programmes Objectives
P1 Administration, Planning and
support services
Promotion and supervision of ECD and
Vocational education services
P2 Education support service Improve access to education through
bursaries and other support programmes
P3 Vocational Education and
training
Improved enrolments in technical training
5.5 Part E: Summary of Expenditure by Programmes, 2017/18-2019/20
(Kshs.Millions)
Education Science & Technology
Programme
Baseline
Estimates Estimates Projected Estimates
2017/18 2018/19 2019/20 2020/21
Programme 1: Administration Plannning and Support services
Sub Programme (SP)
SP 1. 1 GENERAL
ADMINISTRATIVE
SERVICES
221,145,670 324,004,093 340,204,298 357,214,513
Total Expenditure of
Programme 1 221,145,670 324,004,093 340,204,298 357,214,513
Programme 2: Education Support Services.
Baseline
Estimates Estimates Projected Estimates
2017/18 2018/19 2019/20 2020/21
SP 2. 1, Education Support 200,000,000 0 0 0
Total Expenditure of
Programme 2 200,000,000 0 0 0
Programme 3: Vocation Education & Training.

74
Baseline
Estimates Estimates Projected Estimates
2017/18 2018/19 2019/20 2020/21
SP 3. 1 Youth Polytechnic
Development 33,920,367 191,016,056 200,566,859 210,595,202
Total Expenditure of
Programme 3 33,920,367 191,016,056 200,566,859 210,595,202
Programme 4: ECD devlopment & Coordination.
Baseline
Estimates Estimates Projected Estimates
2017/18 2018/19 2019/20 2020/21
SP 4. 1, ECDE Development 13,625,000 206,456,700 216,779,535 227,618,512
Total Expenditure of
Programme 4 13,625,000 206,456,700 216,779,535 227,618,512
Total Expenditure of Vote -
------ 468,691,037 721,476,849 757,550,691 795,428,226
5.6 Part F: Summary of Expenditure by Vote and Economic
Classification (Kshs. Million)
Expenditure Classification
Baseline
Estimates Estimates Projected Estimates
2017/18 2018/19 2019/20 2020/21
Current Expenditure
Compensation to Employees 113,361,180 245,877,180 258,171,039 271,079,591
Use of goods and services 10,989,490 242,300,733 254,415,770 267,136,558
Current Transfers Govt. Agencies 0 0 0 0
Other Recurrent 205,420,000 1,150,000 1,207,500 1,267,875
Capital Expenditure
Acquisition of Non-Financial
Assets 0 0 0 -
Capital Transfers to Government
Agencies 0 0 0 -
Other Development 138,920,367 232,148,936
243,756,383
255,944,202
Total Expenditure of Vote …… 468,691,037 721,476,849 757,550,691 795,428,226

75
5.7 Part G: Summary of Expenditure by Programme, Sub-Programme
and Economic Classification (KShs. Million)
Expenditure Classification
Baseline
Estimates Estimates Projected Estimates
2017/18 2018/19 2019/20 2020/21
ADMINSTRATION,PLANNING AND SUPPORT SERVICES.
Current Expenditure
Compensation to Employees 113,361,180 88,361,180 92,779,239 97,418,201
Use of goods and services 8,864,490 149,043,977 156,496,176 164,320,985
Current Transfers Govt.
Agencies 0 0 0 0
Other Recurrent 420,000 1,150,000 1,207,500 1,267,875
Capital Expenditure
Acquisition of Non-Financial
Assets 0 0 0 0
Capital Transfers to Govt.
Agencies 0 0 0 0
Other Development 98,500,000 85,448,936
89,721,383
94,207,452
Total Expenditure 221,145,670 324,004,093 340,204,298 357,214,513
Sub-Programme 1.1: General Administration duties
Expenditure Classification
Baseline
Estimates Estimates Projected Estimates
2017/18 2018/19 2019/20 2020/21
Current Expenditure
Compensation to Employees 113,361,180 88,361,180 92,779,239 97,418,201
Use of goods and services 8,864,490 149,043,977 156,496,176 164,320,985
Current Transfers Govt.
Agencies 0 0 0 0
Other Recurrent 420,000 1,150,000 1,207,500 1,267,875
Capital Expenditure
Acquisition of Non-Financial
Assets 0 0 0 0
Capital Transfers to Govt.
Agencies 0 0 0 0
Other Development 98,500,000 85,448,936
89,721,383
94,207,452
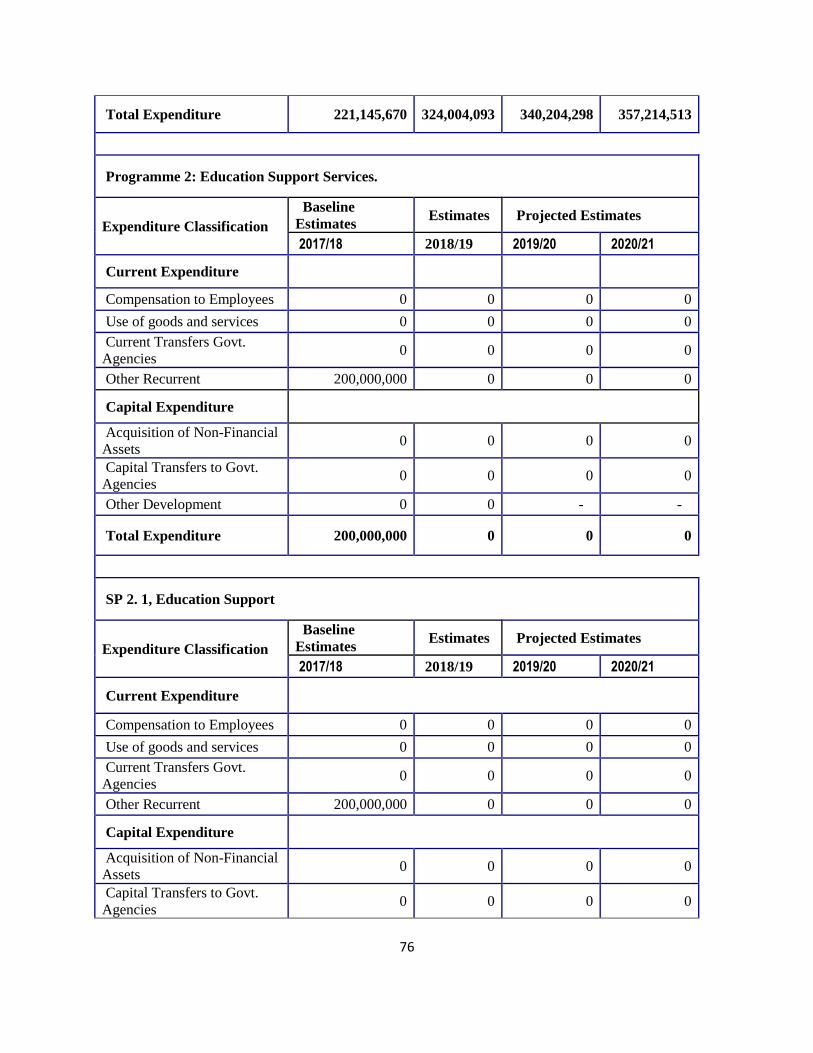
76
Total Expenditure 221,145,670 324,004,093 340,204,298 357,214,513
Programme 2: Education Support Services.
Expenditure Classification
Baseline
Estimates Estimates Projected Estimates
2017/18 2018/19 2019/20 2020/21
Current Expenditure
Compensation to Employees 0 0 0 0
Use of goods and services 0 0 0 0
Current Transfers Govt.
Agencies 0 0 0 0
Other Recurrent 200,000,000 0 0 0
Capital Expenditure
Acquisition of Non-Financial
Assets 0 0 0 0
Capital Transfers to Govt.
Agencies 0 0 0 0
Other Development 0 0 - -
Total Expenditure 200,000,000 0 0 0
SP 2. 1, Education Support
Expenditure Classification
Baseline
Estimates Estimates Projected Estimates
2017/18 2018/19 2019/20 2020/21
Current Expenditure
Compensation to Employees 0 0 0 0
Use of goods and services 0 0 0 0
Current Transfers Govt.
Agencies 0 0 0 0
Other Recurrent 200,000,000 0 0 0
Capital Expenditure
Acquisition of Non-Financial
Assets 0 0 0 0
Capital Transfers to Govt.
Agencies 0 0 0 0

77
Other Development 0 0 - -
Total Expenditure 200,000,000 0 0 0
Programme 3: Vocation Education & Training.
Expenditure Classification
Baseline
Estimates Estimates Projected Estimates
2017/18 2018/19 2019/20 2020/21
Current Expenditure
Compensation to Employees 0 33516000 35191800 36951390
Use of goods and services 1,500,000 64,500,056
67,725,059
71,111,312
Current Transfers Govt.
Agencies 0 0 0 0
Other Recurrent 5,000,000 0 0 0
Capital Expenditure
Acquisition of Non-Financial
Assets 0 0 0 0
Capital Transfers to Govt.
Agencies 0 0 0 0
Other Development 27,420,367 93,000,000
97,650,000
102,532,500
Total Expenditure 33,920,367 191,016,056 200,566,859 210,595,202
SP 3. 1 Youth Polytechnic Development
Expenditure Classification
Baseline
Estimates Estimates Projected Estimates
2017/18 2018/19 2019/20 2020/21
Current Expenditure
Compensation to Employees 0 33516000 35191800 36951390
Use of goods and services 1,500,000 64,500,056 67,725,059 71,111,312
Current Transfers Govt.
Agencies 0 0 0 0
Other Recurrent 5,000,000 0 0 0
Capital Expenditure
Acquisition of Non-Financial
Assets 0 0 0 0

78
Capital Transfers to Govt.
Agencies 0 0 0 0
Other Development 27,420,367 93,000,000
97,650,000
102,532,500
Total Expenditure 33,920,367 191,016,056 200,566,859 210,595,202
Programme 4: ECD devlopment & Coordination.
Expenditure Classification
Baseline
Estimates Estimates Projected Estimates
2017/18 2018/19 2019/20 2020/21
Current Expenditure
Compensation to Employees 0 124000000
130,200,000
136,710,000
Use of goods and services 625,000 28,756,700
30,194,535
31,704,262
Current Transfers Govt.
Agencies 0 0 - -
Other Recurrent 0 0 - -
Capital Expenditure
Acquisition of Non-Financial
Assets 0 0 - -
Capital Transfers to Govt.
Agencies 0 0 - -
Other Development 13,000,000 53,700,000
56,385,000
59,204,250
Total Expenditure 13,625,000 206,456,700 216,779,535 227,618,512
SP 4. 1, ECDE Development
Expenditure Classification
Baseline
Estimates Estimates Projected Estimates
2017/18 2018/19 2019/20 2020/21
Current Expenditure
Compensation to Employees 0 124000000
130,200,000
136,710,000
Use of goods and services 625,000 28,756,700
30,194,535
31,704,262
Current Transfers Govt.
Agencies 0 0 - -

79
Other Recurrent 0 0 - -
Capital Expenditure
Acquisition of Non-Financial
Assets 0 0 - -
Capital Transfers to Govt.
Agencies 0 0 - -
Other Development 13,000,000 53,700,000
56,385,000
59,204,250
Total Expenditure 13,625,000 206,456,700 216,779,535 227,618,512
5.8 Part H: Summary of the Programme Outputs, Performance Indicators and
Targets for FY 2017/18- 2020/21
Programme Delivery Unit Key Outputs Key
Performance
Indicators
Target Target Target Target
(Baseline) 2018/19 2019/20 2020/21
2017/18
ADMNISTRATION, PLANNING AND SUPPORT SERVICE
Outcome: To harmonize and improve coordination of education activities
SP1.1: GENERAL
ADMNISTRATIVE
SERVICES
administration Efficienct and
effective
service delivery
Improved
coordination of
activities in the
department
Number of
reports from
the field
Timely
response to
requests
4 4 4 4
EDUCATION SUPPORT SERVICES
Outcome: To increase enrolment and improve access to education.
SP2.1:EDUCATION
SUPPORT
education enrolment
rates.
No. of
students
funded.
18750 197500 20750 210000
VOCATIONAL EDUCATION AND TRAINING
Outcome: To provide skilled manpower for self reliance
SP3.1: youth
polytechnic
development
youth
development
Enrolment
rates
No. of
students
enrolled
1200 1500 1700 1900
ECDE DEVELOPMENT AND COORDINATING
Outcome: To provide a strong foundation in early childhood education
SP4.1: ECDE
DEVELOPMENT
ECDE
development
Enrolment
rates. .
No. of pupils
enrolled.
26000 28000 30000 32000

80
6. GENDER, CULTURE, YOUTH, SPORTS & SOCIAL SERVICES
6.1 Vision
To be a leader in developing a vibrant and cohesive society thriving on its cultural diversity,
Social protection and Empowerment for all.
6.2 Mission
To coordinate and promote sports and diverse culture, empower and protect vulnerable groups
through socio-Economic development programmes for improved livelihoods.
6.3 Performance Overview and Background for Programmes
During the financial year 2017/18, the department continued to support sporting activities.
stadia and cultural site have been secured through construction of wall fence. The county soccer
team has since joined the national super league. The department of culture has continued to
organize cultural festivals and events.
The department faced the following challenges during the period under review;
Resources constraints and slow disbursement of funds
Procurement red tapes
Gender disparity in governance and access to opportunities
6.4 PROGRAMMES AND THEIR OBJECTIVES
Code Programme Objectives
P1 Administration, Planning and
Support Service
To increase access to quality,
timely and effective services
P2 Management and development of
culture and sports
To promote cultural heritage
and sporting activities
P3 Youth and gender development To enhance Youth and Gender
Empowerment and
Mainstreaming for Sustainable
Development in the County

81
6.5 Part E: Summary of Expenditure by Programmes, 2017/18-2019/20
(Kshs.Millions)
Gender, Culture, Sports & Youth
Programme
Baseline
Estimates Estimates Projected Estimates
2017/18 2018/19 2019/20 2020/21
Programme 1: Administration Plannning and Support services
Sub Programme (SP)
SP 1. 1 GENERAL
ADMINISTRATIVE
SERVICES
174,250,456 46,662,979 48,996,128 51,445,934
SP.1.2: Educational
Conferences 0 800,000 840,000 882,000
SP 1.3: Technical Conferences 0 700,000 735,000 771,750
SP 1.4: Elderly Fund 0 10,000,000 10,500,000 11,025,000
Total Expenditure of
Programme 1 174,250,456 58,162,979 61,071,128 64,124,684
Programme 2: Management & Development of Culture & Sports.
Baseline
Estimates Estimates Projected Estimates
2017/18 2018/19 2019/20 2020/21
SP 2. 1. Recreation and Arts 9,200,000 6,000,000 6,300,000 6,615,000
SP 2. 2. Sports Promotion 27,000,000 130,309,464 136,824,937 143,666,184
SP 2.3. Culture & Heritage 9,250,000 31,350,000 32,917,500 34,563,375
Total Expenditure of
Programme 2 45,450,000 167,659,464 176,042,437 184,844,559
Programme 3: Management of Youth & Gender Development.
Baseline
Estimates Estimates Projected Estimates
2017/18 2018/19 2019/20 2020/21
SP 3. 1. Social Protection 2,500,000 2,750,000 2,887,500 3,031,875
SP 3. 2. Youth & Gender
Development 34,050,000 18,550,000 19,477,500 20,451,375

82
Total Expenditure of
Programme 3 36,550,000 21,300,000 22,365,000 23,483,250
Total Expenditure of Vote -----
-- 256,250,456 247,122,443 259,478,565 272,452,493
6.6 Part F: Summary of Expenditure by Vote and Economic Classification
(Kshs. Million)
Expenditure Classification Baseline
Estimates Estimates Projected Estimates
2017/18 2018/19 2019/20 2020/21
Current Expenditure
Compensation to Employees 17,290,912 22,740,912 23,877,958 25,071,855
Use of goods and services 164,409,544 135,781,531 142,570,608 149,699,138
Current Transfers Govt.
Agencies 0 0 0 0
Other Recurrent 23,500,000 350000 367500 385875
Capital Expenditure
Acquisition of Non-Financial
Assets 0 0 0 0
Capital Transfers to
Government Agencies 0 0 0 0
Other Development 51,050,000 87,000,000 91,350,000 95,917,500
Total Expenditure of Vote
…… 256,250,456 245,872,443 258,166,065 271,074,368

83
6.7 Part G: Summary of Expenditure by Programme, Sub-Programme and
Economic Classification (KShs. Million)
Expenditure Classification
Baseline
Estimates Estimates Projected Estimates
2017/18 2018/19 2019/20 2020/21
ADMINSTRATION,PLANNING AND SUPPORT SERVICES.
Current Expenditure
Compensation to Employees 17,290,912 22,740,912 23,877,958 25,071,855
Use of goods and services 82,409,544 35,072,067 36,825,670 38,666,954
Current Transfers Govt.
Agencies 0 0 0 0
Other Recurrent 23,500,000 350000 367500 385875
Capital Expenditure
Acquisition of Non-Financial
Assets 0 0 0 0
Capital Transfers to Govt.
Agencies 0 0 0 0
Other Development 51,050,000 - - -
Total Expenditure 174,250,456 58,162,979 61,071,128 64,124,684
Sub-Programme 1.1: General Administration duties
Baseline
Estimates Estimates Projected Estimates
2017/18 2018/19 2019/20 2020/21
Current Expenditure
Compensation to Employees 17,290,912 22,740,912 23,877,958 25,071,855
Use of goods and services 82,409,544 23,572,067 24,750,670 25,988,204
Current Transfers Govt.
Agencies 0 0 0 0
Other Recurrent 23,500,000 350000 367,500 385,875
Capital Expenditure
Acquisition of Non-Financial 0 0 0 0

84
Assets
Capital Transfers to Govt.
Agencies 0 0 0 0
Other Development 51,050,000 - - -
Total Expenditure 174,250,456 46,662,979 48,996,128 51,445,934
Sub-Programme 1.2: Educational Conferences
Baseline
Estimates Estimates Projected Estimates
2017/18 2018/19 2019/20 2020/21
Current Expenditure
Compensation to Employees 0 0 0 0
Use of goods and services 0 800,000 840,000 882,000
Current Transfers Govt.
Agencies 0 0 0 0
Other Recurrent 0 0 0 0
Capital Expenditure
Acquisition of Non-Financial
Assets 0 0 0 0
Capital Transfers to Govt.
Agencies 0 0 0 0
Other Development 0 - - -
Total Expenditure 0 800,000 840,000 882,000
Sub-Programme 1.3: Technical Conferences
Baseline
Estimates Estimates Projected Estimates
2017/18 2018/19 2019/20 2020/21
Current Expenditure
Compensation to Employees 0 0 0 0

85
Use of goods and services 0 700,000 735,000 771,750
Current Transfers Govt.
Agencies 0 0 0 0
Other Recurrent 0 0 0 0
Capital Expenditure
Acquisition of Non-Financial
Assets 0 0 0 0
Capital Transfers to Govt.
Agencies 0 0 0 0
Other Development 0 - - -
Total Expenditure 0 700,000 735,000 771,750
Sub-Programme 1.4: Elderly Fund
Baseline
Estimates Estimates Projected Estimates
2017/18 2018/19 2019/20 2020/21
Current Expenditure
Compensation to Employees 0 0 0 0
Use of goods and services 0 10,000,000 10,500,000 11,025,000
Current Transfers Govt.
Agencies 0 0 0 0
Other Recurrent 0 0 0 0
Capital Expenditure
Acquisition of Non-Financial
Assets 0 0 0 0
Capital Transfers to Govt.
Agencies 0 0 0 0
Other Development 0 - - -
Total Expenditure 0 10,000,000 10,500,000 11,025,000
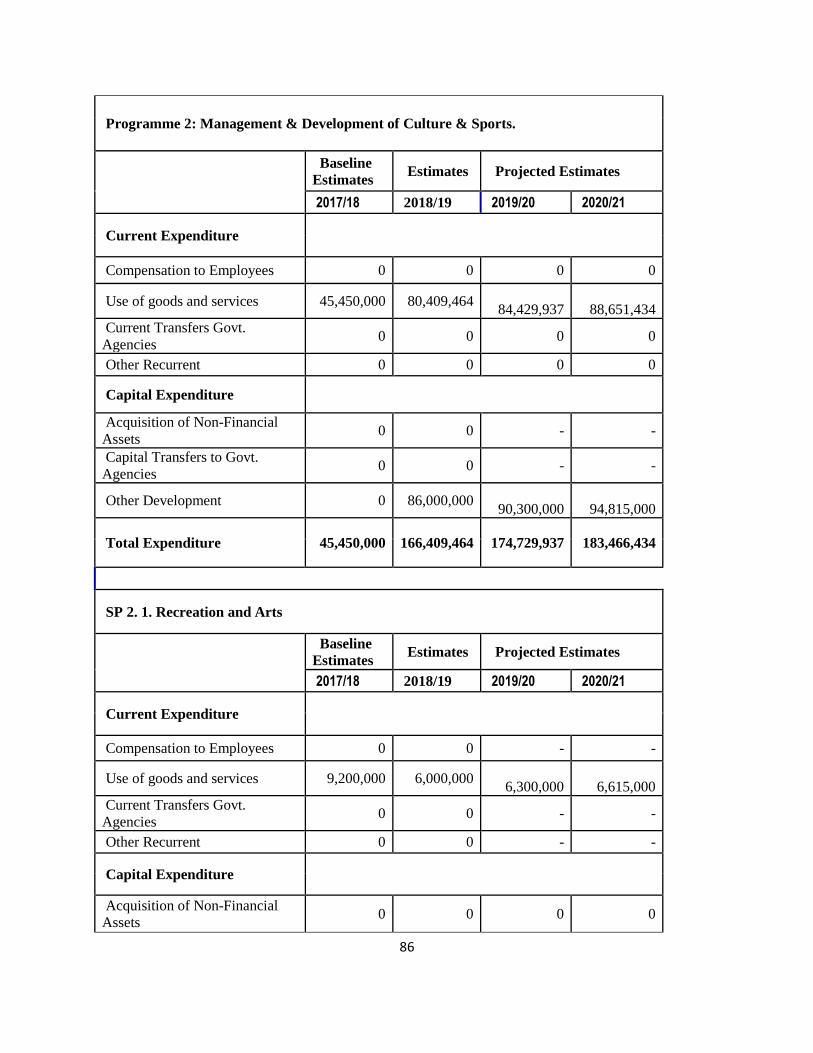
86
Programme 2: Management & Development of Culture & Sports.
Baseline
Estimates Estimates Projected Estimates
2017/18 2018/19 2019/20 2020/21
Current Expenditure
Compensation to Employees 0 0 0 0
Use of goods and services 45,450,000 80,409,464
84,429,937
88,651,434
Current Transfers Govt.
Agencies 0 0 0 0
Other Recurrent 0 0 0 0
Capital Expenditure
Acquisition of Non-Financial
Assets 0 0 - -
Capital Transfers to Govt.
Agencies 0 0 - -
Other Development 0 86,000,000
90,300,000
94,815,000
Total Expenditure 45,450,000 166,409,464 174,729,937 183,466,434
SP 2. 1. Recreation and Arts
Baseline
Estimates Estimates Projected Estimates
2017/18 2018/19 2019/20 2020/21
Current Expenditure
Compensation to Employees 0 0 - -
Use of goods and services 9,200,000 6,000,000
6,300,000
6,615,000
Current Transfers Govt.
Agencies 0 0 - -
Other Recurrent 0 0 - -
Capital Expenditure
Acquisition of Non-Financial
Assets 0 0 0 0

87
Capital Transfers to Govt.
Agencies 0 0 0 0
Other Development 0 0 0 0
Total Expenditure 9,200,000 6,000,000 6,300,000 6,615,000
SP 2. 2. Sports Promotion
Baseline
Estimates Estimates Projected Estimates
2017/18 2018/19 2019/20 2020/21
Current Expenditure
Compensation to Employees 0 0 - -
Use of goods and services 27,000,000 49,309,464
51,774,937
54,363,684
Current Transfers Govt.
Agencies 0 0 - -
Other Recurrent 0 0 - -
Capital Expenditure
Acquisition of Non-Financial
Assets 0 0 - -
Capital Transfers to Govt.
Agencies 0 0 - -
Other Development 0 81,000,000
85,050,000
89,302,500
Total Expenditure 27,000,000 130,309,464 136,824,937 143,666,184
SP 2.3. Culture & Heritage
Baseline
Estimates Estimates Projected Estimates
2017/18 2018/19 2019/20 2020/21
Current Expenditure
Compensation to Employees 0 0 - -
Use of goods and services 9,250,000 26,350,000
27,667,500
29,050,875

88
Current Transfers Govt.
Agencies 0 0 - -
Other Recurrent 0 0 - -
Capital Expenditure
Acquisition of Non-Financial
Assets 0 0 - -
Capital Transfers to Govt.
Agencies 0 0 - -
Other Development 0 5,000,000
5,250,000
5,512,500
Total Expenditure 9,250,000 31,350,000 32,917,500 34,563,375
Programme 3: Management of Youth & Gender Development.
Baseline
Estimates Estimates Projected Estimates
2017/18 2018/19 2019/20 2020/21
Current Expenditure
Compensation to Employees 0 0 - -
Use of goods and services 36,550,000 20,300,000
21,315,000
22,380,750
Current Transfers Govt.
Agencies 0 0 - -
Other Recurrent 0 0 - -
Capital Expenditure
Acquisition of Non-Financial
Assets 0 0 - -
Capital Transfers to Govt.
Agencies 0 0 - -
Other Development 0 1,000,000
1,050,000
1,102,500
Total Expenditure 36,550,000 21,300,000 22,365,000 23,483,250
SP 3. 1. Social Protection
Baseline
Estimates Estimates Projected Estimates
2017/18 2018/19 2019/20 2020/21

89
Current Expenditure
Compensation to Employees 0 0 - -
Use of goods and services 2,500,000 1,750,000
1,837,500
1,929,375
Current Transfers Govt.
Agencies 0 0 - -
Other Recurrent 0 0 - -
Capital Expenditure
Acquisition of Non-Financial
Assets 0 0 0 0
Capital Transfers to Govt.
Agencies 0 0 0 0
Other Development -
1,000,000
1,050,000
1,102,500
Total Expenditure 2,500,000 2,750,000 2,887,500 3,031,875
SP 3. 2. Youth & Gender Development
Baseline
Estimates Estimates Projected Estimates
2017/18 2018/19 2019/20 2020/21
Current Expenditure
Compensation to Employees 0 0 - -
Use of goods and services 34,050,000 18,550,000
19,477,500
20,451,375
Current Transfers Govt.
Agencies 0 0 - -
Other Recurrent 0 0 - -
Capital Expenditure
Acquisition of Non-Financial
Assets 0 0 - -
Capital Transfers to Govt.
Agencies 0 0 - -
Other Development 0 0 - -
Total Expenditure 34,050,000 18,550,000 19,477,500 20,451,375

90
6.8 Part H: Summary of the Programme Outputs, Performance Indicators and
Targets for FY 2017/18- 2020/21
Programme Delivery Unit Key Outputs Key
Performance
Indicators
Target Target Target Target
(Baseline)
2018/19 2019/20 2020/21
2017/18
Programme 1: Administration, Planning and Support services
Outcome: Efficient service delivery
S.P 1:
General
administrative
services
Administration
streamlined
and effective
service
delivery in
Gender,
culture, sports
and children
department
provide policy
guideline in
Gender,
culture, sports
and children
department
sports,
culture,
gender,
children
policies
reviwed
sports,
culture,
gender,
children
policies
reviewed
sports,
culture,
gender,
children
policies
reviewed
sports,
culture,
gender,
children
policies
reviewed
Progamme 2: Management and Development of culture and sports
Outcome: Improved culture and excellence in sports Performance
S.P 2.1:
Recreation
and Arts
Sports
Department
County Team participating in national competition
No. of County Team participating in national competition
1 2 3 3
S.P 2.2
Sports
Promotion
Sports
Department
Sports talent identified and developed
No. of youths skilled in sports identified and developed
100 150 200 250
S.P
2.3:Culture
and Heritage
Culture
Department
Structures and mechanisms for strengthening culture and creative industry
No. of County Music and Cultural Festivals held
1 1 1 1
Progamme 3: Management of Youth and Gender Development
Outcome: Empowered Youth, Children, Women and People with Disabilities
S.P 3.1:
Social
Protection
Gender Targeting of
older persons
to benefit from
cash transfer
Number of elderly benefiting
250 500 1000 2000
S.P 3.2:
Youth and
Gender
development
Youth Identification, nurturing & development talents
Number of youths trained
50 100 150 200
91
7. TRADE, INDUSTRY, TOURISM AND ENTREPRENEURSHIP
7.1 Vision
To position Vihiga county as a preferred destination for Trade, Industrial Investments and
Tourism in Kenya.
7.2 Mission
To effectively coordinate provision of high quality Tourism products, and provide enabling
Environment for Trade and Industrial Investments.
7.3 Performance Overview and Background for Programmes
During the Financial Year 2017/18 the Department achieved the following in the respective
sectors;
Rehabilitation of market centres
Prefeasibility study on terrazzo plant in Luanda
Disbursement of community empowerment funds
Capacity enhancement of SMES on entrepreneurial skills
Organization of Vihiga investment conference
The department faced several challenges during the Financial Year. These included,
understaffing, inadequate and erratic funding, insecurity for traders, unfavorable regulatory
framework, inadequate market infrastructure, limited access to trade credit; low value addition
and limited external markets for the agricutural products, and high levies amongst others.
To address the challenges, the 2018/19 budget will focus on market infrastructural development,
imparting entrepreneurial knowledge as well as development of tourism products. The funds will
be utilized to ensure that the Department sustains Tourism marketing campaigns and also
develops and diversifies new and the existing Tourist’s products in ensuring that Vihiga become
a competitive Tourist destination. Funds will also be allocated in community empowerment
prorammes and activities that will enhance support for micro-small enterprises (MSEs). The
department shall also embark on establishment of modern market infrastructures, rehabilitation

92
of existing markets and enhancement of accessibility of market information as well as promoting
fair trade practices.
7.4 Part D: Programmes and their Objectives
Programme Objective
Administration, Planning and Support Service To increase access to quality , timely and
effective services
Trade development and investment To Promote and provide conducive
environment for trade and investment in the
County.
Tourism Development To promote investment and diversification of
tourism products for increased income
Industrial development and investment To stimulate industrial development and
investment for job creation in the County.
7.5 Part E: Summary of Expenditure by Programmes, 2017/18-2019/20
(Kshs.Millions)
Industrialization Trade and Tourism
Programme
Baseline
Estimates Estimates Projected Estimates
2017/18 2018/19 2019/20 2020/21
Programme 1: Administration Plannning and Support services
Sub Programme (SP)
SP 1. 1 GENERAL
ADMINISTRATIVE
SERVICES
88,039,961 134,658,716 141,391,652 148,461,234
Total Expenditure of
Programme 1 88,039,961 134,658,716 141,391,652 148,461,234
Programme 2: Trade Development and Investment.
Baseline
Estimates Estimates Projected Estimates
2017/18 2018/19 2018/19 2020/21
SP 2. 1, Market Development
and Management - 6,600,000 6,930,000
7,276,500

93
SP 2. 2. Business Suppot and
Consumer Protection - 0 0 -
Total Expenditure of
Programme 2 0 6,600,000 6,930,000 7,276,500
Programme 3: Tourism Development.
Baseline
Estimates Estimates Projected Estimates
2017/18 2018/19 2019/20 2019/20
SP 3. 1 Tourism Promotion - 2,500,000 2,625,000 2,756,250
Total Expenditure of
Programme 3 0 2,500,000 2,625,000 2,756,250
Programme 4: Industrial Development.
Baseline
Estimates Estimates Projected Estimates
2017/18 2018/19 2019/20 2020/21
SP 4. 1, Industrial
Development - 1,234,264 1,295,977 1,360,776
Total Expenditure of
Programme 4 - 1,234,264 1,295,977 1,360,776
Total Expenditure of Vote --
----- 88,039,961 144,992,980 152,242,629 159,854,760
7.6 Part F: Summary of Expenditure by Vote and Economic Classification
(Kshs. Million)
Expenditure Classification
Baseline
Estimates Estimates Projected Estimates
2017/18 2018/19 2019/20 2020/21
Current Expenditure
Compensation to Employees 12,500,000 12,600,000 13,230,000 13,891,500
Use of goods and services 31,939,961 82,226,501 86,337,826 90,654,717
Current Transfers Govt. Agencies 0 0 0 0
Other Recurrent 7,400,000 3,240,000 3,402,000 3,572,100
Capital Expenditure
Acquisition of Non-Financial Assets 0 0 0 0

94
Capital Transfers to Government
Agencies 0 0 0 0
Other Development 36,200,000 46,926,479
49,272,803
51,736,443
Total Expenditure of Vote …… 88,039,961 144,992,980 152,242,629 159,854,760
Part G: Summary of Expenditure by Programme, Sub-Programme and Economic Classification
(KShs. Million)
Expenditure Classification
Baseline
Estimates Estimates Projected Estimates
2017/18 2018/19 2019/20 2020/21
ADMINSTRATION,PLANNING AND SUPPORT SERVICES.
Current Expenditure
Compensation to Employees 12,500,000 12,600,000 13,230,000 13,891,500
Use of goods and services 31,939,961 82,226,501 86,337,826 90,654,717
Current Transfers Govt.
Agencies 0 0 0 0
Other Recurrent 7,400,000 3,240,000 3,402,000 3,572,100
Capital Expenditure
Acquisition of Non-Financial
Assets 0 0 - -
Capital Transfers to Govt.
Agencies 0 0 - -
Other Development 36,200,000 36,592,215
38,421,826
40,342,917
Total Expenditure 88,039,961 134,658,716 141,391,652 148,461,234
Sub-Programme 1.1: General Administration duties
Expenditure Classification
Baseline
Estimates Estimates Projected Estimates
2017/18 2018/19 2019/20 2020/21
Current Expenditure
Compensation to Employees 12,500,000 12,600,000 13,230,000 13,891,500
Use of goods and services 31,939,961 82,226,501 86,337,826 90,654,717
Current Transfers Govt.
Agencies 0 0 0 0
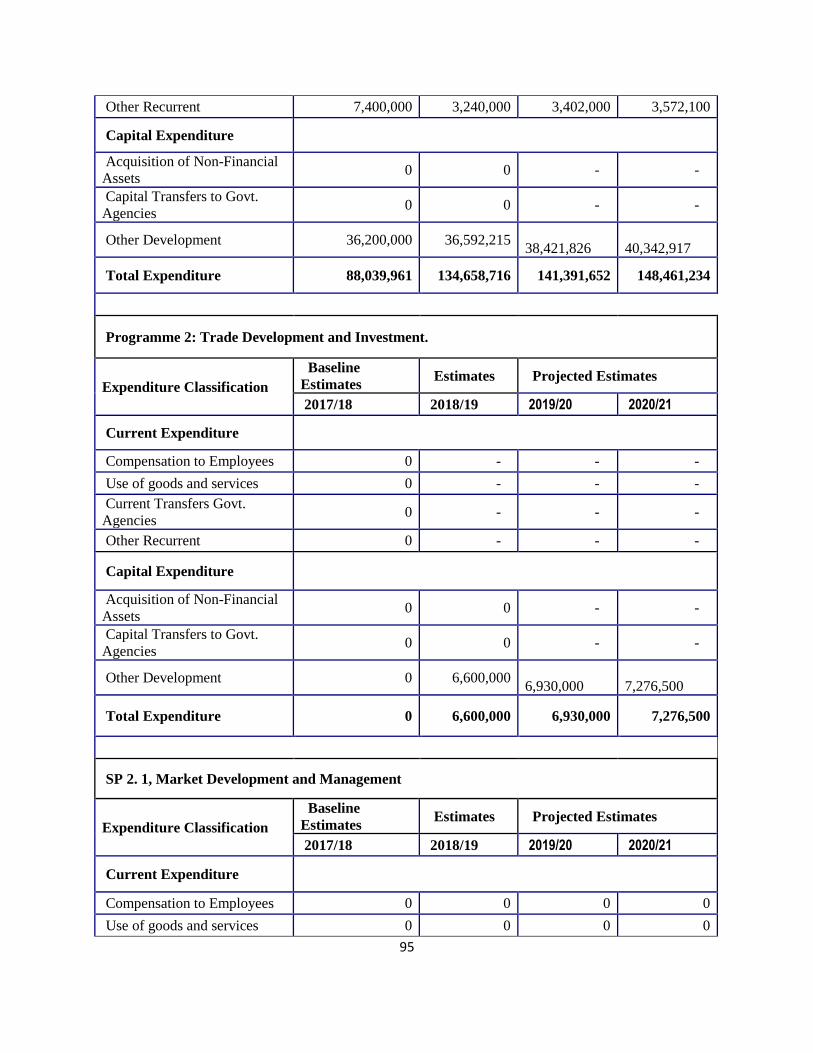
95
Other Recurrent 7,400,000 3,240,000 3,402,000 3,572,100
Capital Expenditure
Acquisition of Non-Financial
Assets 0 0 - -
Capital Transfers to Govt.
Agencies 0 0 - -
Other Development 36,200,000 36,592,215
38,421,826
40,342,917
Total Expenditure 88,039,961 134,658,716 141,391,652 148,461,234
Programme 2: Trade Development and Investment.
Expenditure Classification
Baseline
Estimates Estimates Projected Estimates
2017/18 2018/19 2019/20 2020/21
Current Expenditure
Compensation to Employees 0 - - -
Use of goods and services 0 - - -
Current Transfers Govt.
Agencies 0 - - -
Other Recurrent 0 - - -
Capital Expenditure
Acquisition of Non-Financial
Assets 0 0 - -
Capital Transfers to Govt.
Agencies 0 0 - -
Other Development 0 6,600,000
6,930,000
7,276,500
Total Expenditure 0 6,600,000 6,930,000 7,276,500
SP 2. 1, Market Development and Management
Expenditure Classification
Baseline
Estimates Estimates Projected Estimates
2017/18 2018/19 2019/20 2020/21
Current Expenditure
Compensation to Employees 0 0 0 0
Use of goods and services 0 0 0 0

96
Current Transfers Govt.
Agencies 0 0 0 0
Other Recurrent 0 0 0 0
Capital Expenditure
Acquisition of Non-Financial
Assets 0 0 - -
Capital Transfers to Govt.
Agencies 0 0 - -
Other Development 0 6,600,000
6,930,000
7,276,500
Total Expenditure 0 6,600,000 6,930,000 7,276,500
SP 2. 2. Business Suppot and Consumer Protection
Expenditure Classification
Baseline
Estimates Estimates Projected Estimates
2017/18 2018/19 2019/20 2020/21
Current Expenditure
Compensation to Employees 0 - - -
Use of goods and services 0 - - -
Current Transfers Govt.
Agencies 0 - - -
Other Recurrent 0 - - -
Capital Expenditure
Acquisition of Non-Financial
Assets 0 0 - -
Capital Transfers to Govt.
Agencies 0 0 - -
Other Development 0 0 - -
Total Expenditure - - - -
Programme 3: Tourism Development.
Expenditure Classification
Baseline
Estimates Estimates Projected Estimates
2017/18 2018/19 2019/20 2020/21
Current Expenditure
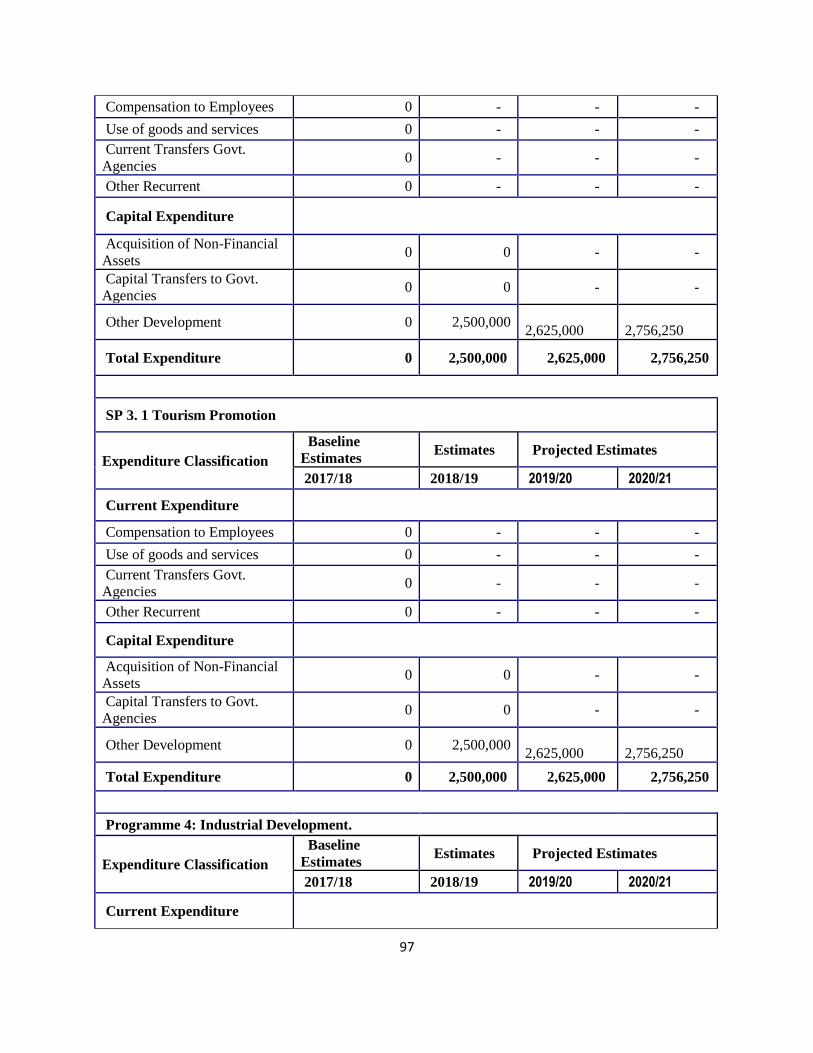
97
Compensation to Employees 0 - - -
Use of goods and services 0 - - -
Current Transfers Govt.
Agencies 0 - - -
Other Recurrent 0 - - -
Capital Expenditure
Acquisition of Non-Financial
Assets 0 0 - -
Capital Transfers to Govt.
Agencies 0 0 - -
Other Development 0 2,500,000
2,625,000
2,756,250
Total Expenditure 0 2,500,000 2,625,000 2,756,250
SP 3. 1 Tourism Promotion
Expenditure Classification
Baseline
Estimates Estimates Projected Estimates
2017/18 2018/19 2019/20 2020/21
Current Expenditure
Compensation to Employees 0 - - -
Use of goods and services 0 - - -
Current Transfers Govt.
Agencies 0 - - -
Other Recurrent 0 - - -
Capital Expenditure
Acquisition of Non-Financial
Assets 0 0 - -
Capital Transfers to Govt.
Agencies 0 0 - -
Other Development 0 2,500,000
2,625,000
2,756,250
Total Expenditure 0 2,500,000 2,625,000 2,756,250
Programme 4: Industrial Development.
Expenditure Classification
Baseline
Estimates Estimates Projected Estimates
2017/18 2018/19 2019/20 2020/21
Current Expenditure
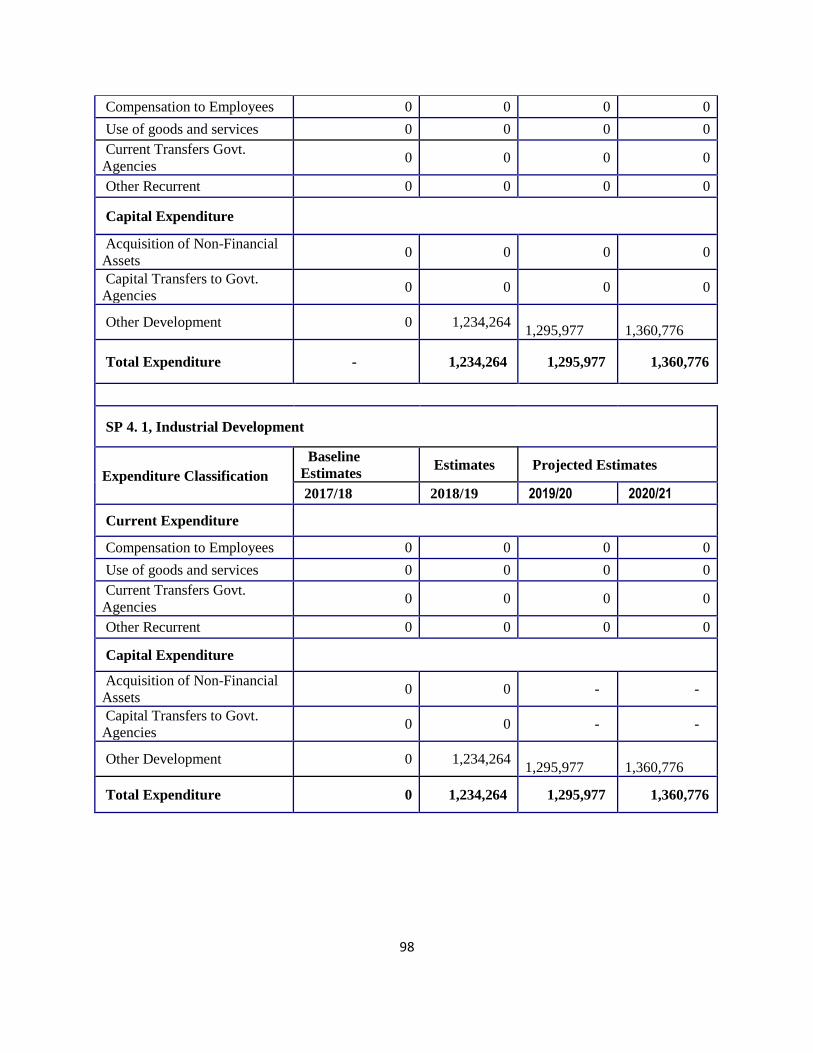
98
Compensation to Employees 0 0 0 0
Use of goods and services 0 0 0 0
Current Transfers Govt.
Agencies 0 0 0 0
Other Recurrent 0 0 0 0
Capital Expenditure
Acquisition of Non-Financial
Assets 0 0 0 0
Capital Transfers to Govt.
Agencies 0 0 0 0
Other Development 0 1,234,264
1,295,977
1,360,776
Total Expenditure - 1,234,264 1,295,977 1,360,776
SP 4. 1, Industrial Development
Expenditure Classification
Baseline
Estimates Estimates Projected Estimates
2017/18 2018/19 2019/20 2020/21
Current Expenditure
Compensation to Employees 0 0 0 0
Use of goods and services 0 0 0 0
Current Transfers Govt.
Agencies 0 0 0 0
Other Recurrent 0 0 0 0
Capital Expenditure
Acquisition of Non-Financial
Assets 0 0 - -
Capital Transfers to Govt.
Agencies 0 0 - -
Other Development 0 1,234,264
1,295,977
1,360,776
Total Expenditure 0 1,234,264 1,295,977 1,360,776

99
8. PUBLIC SERVICE BOARD
8.1 Part A: Vision
To be a lead county in provision of a competitive Human Resource Management and
Development that ensures efficient and effective service delivery in the County.
8.2 Part B: Mission
To recruit, develop, sustain and a motivated human resource that is effective and efficient.
8.3 Part C: PERFOMANCE OVERVIEW
The major achievements made during the fy 2017/18 include facilitating recruitment and
promotion of staffs in varous county department , instituting of organization framework of
departments, and development of County public service human resource manual and strategic
plan.
Some of the challenges faced during the period included;High demand for empoloyment
,Political interferance in recruitment and inadequate budgetary support .
The Board will focus the 2018/19 budget towas establishing of systems and
structures for the promotion of national values and principles of governance as underpinned
under article 10 and article 232 of the constitution of Kenya, 2010. Emphasis will also focus on
staff rattionalization for effectiveness and equity in service delivery.
8.4 Part D; PROGRAMMES AND OBJECTIVES
CODE Programme Objective
P1 Administration, Planning and
Support Service
To increase access to quality,
timely and effective services
8.5 Part E: Summary of Expenditure by Programmes, 2017/18-
2019/20 (Kshs.Millions)
Public Service Board
Programme
Baseline
Estimates
Estimates Projected Estimates
2017/18 2018/19 2019/20 2020/21
Programme 1: Administration Plannning and Support services
Sub Programme (SP)

100
SP 1. 1 GENERAL ADMINISTRATIVE
SERVICES 61,991,289 52,566,948 55,195,295 57,955,060
Total Expenditure of Programme 1 61,991,289 52,566,948 55,195,295 57,955,060
Total Expenditure of Vote ------- 61,991,289 52,566,948 55,195,295 57,955,060
8.6 Part F: Summary of Expenditure by Vote and Economic Classification
(Kshs. Million)
Expenditure Classification
Baseline
Estimates
Estimates Projected Estimates
2017/18 2018/19 2019/20 2020/21
Current Expenditure
Compensation to Employees 32,606,688 28,215,860 29,626,653 31,107,986
Use of goods and services 29,064,601 24,151,088 25,358,642 26,626,575
Current Transfers Govt. Agencies 0 0 0 0
Other Recurrent 320,000 200,000 210,000 220,500
Capital Expenditure
Acquisition of Non-Financial Assets 0 0 0 0
Capital Transfers to Government
Agencies 0 0 0 0
Other Development 0 0 0 0
Total Expenditure of Vote …… 61,991,289 52,566,948 55,195,295 57,955,060
8.7 Part G: Summary of Expenditure by Programme, Sub-Programme and
Economic Classification (KShs. Million)
Expenditure Classification
Baseline
Estimates
Estimates Projected Estimates
2017/18 2018/19 2019/20 2020/21
ADMINSTRATION,PLANNING AND SUPPORT SERVICES.
Current Expenditure
Compensation to Employees 32,606,688 28,215,860 29,626,653 31,107,986
Use of goods and services 29,064,601 24,151,088 25,358,642 26,626,575
Current Transfers Govt. Agencies 0 0 0 0

101
Other Recurrent 320,000 200,000 210,000 220,500
Capital Expenditure
Acquisition of Non-Financial
Assets 0 0 0 0
Capital Transfers to Govt.
Agencies 0 0 0 0
Other Development 0 0 0 0
Total Expenditure 61,991,289 52,566,948 55,195,295 57,955,060
Sub-Programme 1.1: General Administration duties
Expenditure Classification
Baseline
Estimates
Estimates Projected Estimates
2017/18 2018/19 2019/20 2020/21
Current Expenditure
Compensation to Employees 32,606,688 28,215,860 29,626,653 31,107,986
Use of goods and services 29,064,601 24,151,088 25,358,642 26,626,575
Current Transfers Govt. Agencies 0 0 0 0
Other Recurrent 320,000 200,000 210,000 220,500
Capital Expenditure
Acquisition of Non-Financial
Assets 0 0 0 0
Capital Transfers to Govt.
Agencies 0 0 0 0
Other Development 0 0 0 0
Total Expenditure 61,991,289 52,566,948 55,195,295 57,955,060
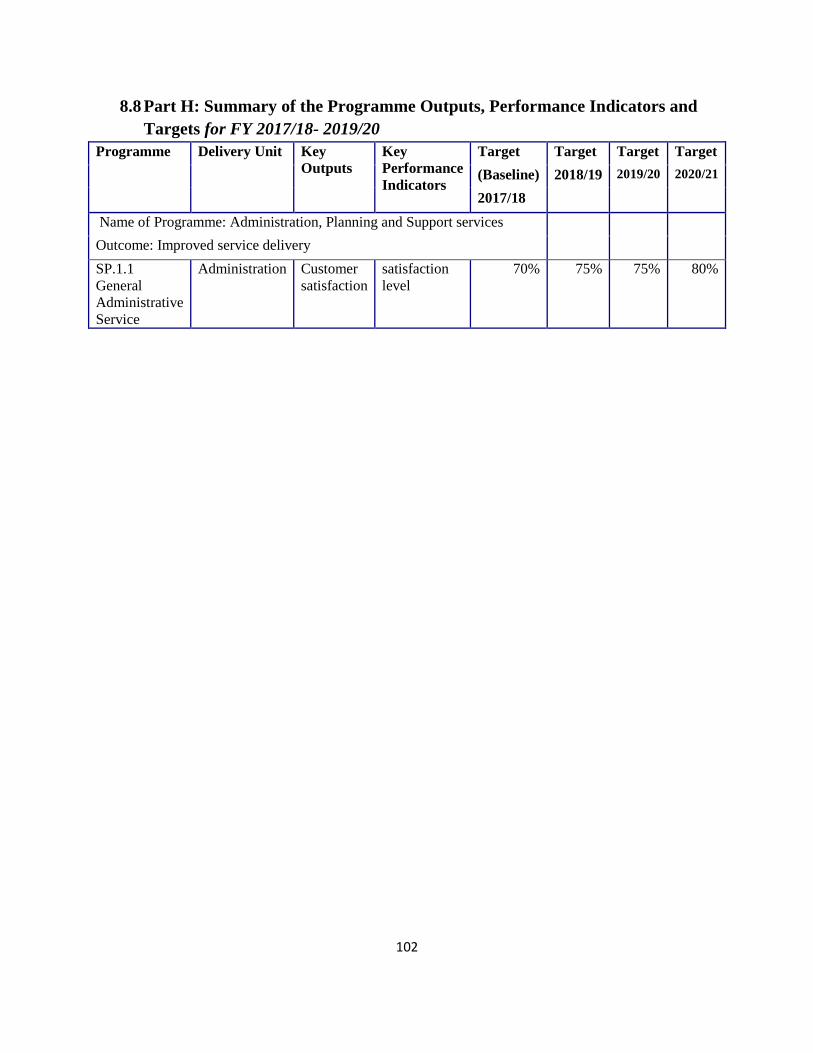
102
8.8 Part H: Summary of the Programme Outputs, Performance Indicators and
Targets for FY 2017/18- 2019/20
Programme Delivery Unit Key
Outputs
Key
Performance
Indicators
Target Target Target Target
(Baseline) 2018/19 2019/20 2020/21
2017/18
Name of Programme: Administration, Planning and Support services
Outcome: Improved service delivery
SP.1.1
General
Administrative
Service
Administration Customer
satisfaction
satisfaction
level
70% 75% 75% 80%

103
9. ENVIRONMENT, WATER, ENERGY AND NATURAL
RESOURCES
9.1 Part A: Vision
To be a lead County in provision of safe and clean water for all, sustainable utilization of
forestry and natural resources , and improved sanitation in a clean and secure environment.
9.2 Part B: Mission
To promote, conserve and protect the environment and natural resources, and improve access
to safe and clean water for sustainable development.
9.3 Part C: PERFOMANCE OVERVIEW
During the financial year 2017/18 the Department centered on completion of projects that were
not completed in the financial year 2018/19 with the key objective of improving access to
adequate water in a clean and secure environment. Fifteen dumpsites were established in the
major urban centers. The Green Schools Initiative established tree nurseries in 50 primary
schools with each school producing 20,000 seedlings for planting in community forests and
within public institutions. Other achievements included;
• protection of 125 springs sinking of 5 boreholes in the 25 wards
• 25 community water projects were completed and commissioned
• 5 rural water projects were rehabilitated and 2 sewerage systems commissioned.
• 83% of the county household had individual or shared toilets
Challenges and Constraints
Inadequate funding for the water sub sector affected field operations and implementation of
sector projects and programmes
high operations and maintenance costs of waterworks.
Water scarcity and water insecurity due to mismatch between the increasing population and
water sources, inadequate water harvesting systems, limited water storage infrastructure,
frequent vandalism, mismanagement of water supply systems and negative effects of climate
change.
Insufficient transport for field operations
Management problems in community managed water scheme
The challenges faced by the Department included;
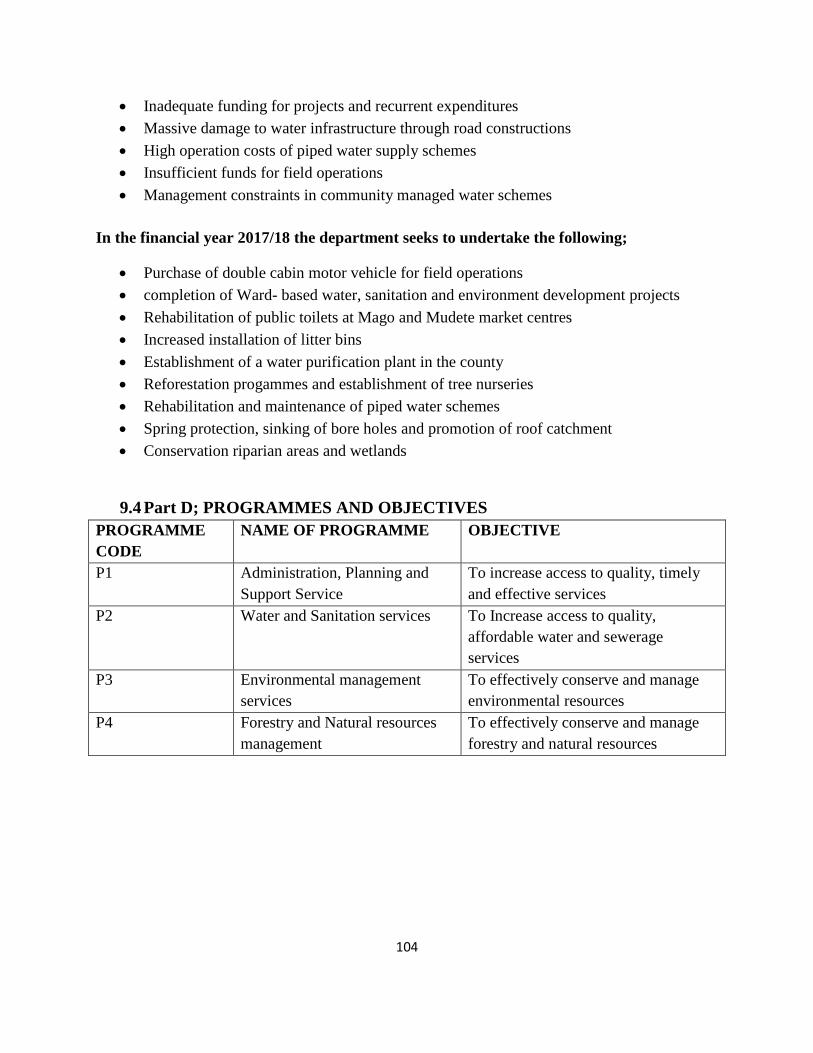
104
Inadequate funding for projects and recurrent expenditures
Massive damage to water infrastructure through road constructions
High operation costs of piped water supply schemes
Insufficient funds for field operations
Management constraints in community managed water schemes
In the financial year 2017/18 the department seeks to undertake the following;
Purchase of double cabin motor vehicle for field operations
completion of Ward- based water, sanitation and environment development projects
Rehabilitation of public toilets at Mago and Mudete market centres
Increased installation of litter bins
Establishment of a water purification plant in the county
Reforestation progammes and establishment of tree nurseries
Rehabilitation and maintenance of piped water schemes
Spring protection, sinking of bore holes and promotion of roof catchment
Conservation riparian areas and wetlands
9.4 Part D; PROGRAMMES AND OBJECTIVES
PROGRAMME
CODE
NAME OF PROGRAMME OBJECTIVE
P1 Administration, Planning and
Support Service
To increase access to quality, timely
and effective services
P2 Water and Sanitation services To Increase access to quality,
affordable water and sewerage
services
P3 Environmental management
services
To effectively conserve and manage
environmental resources
P4 Forestry and Natural resources
management
To effectively conserve and manage
forestry and natural resources
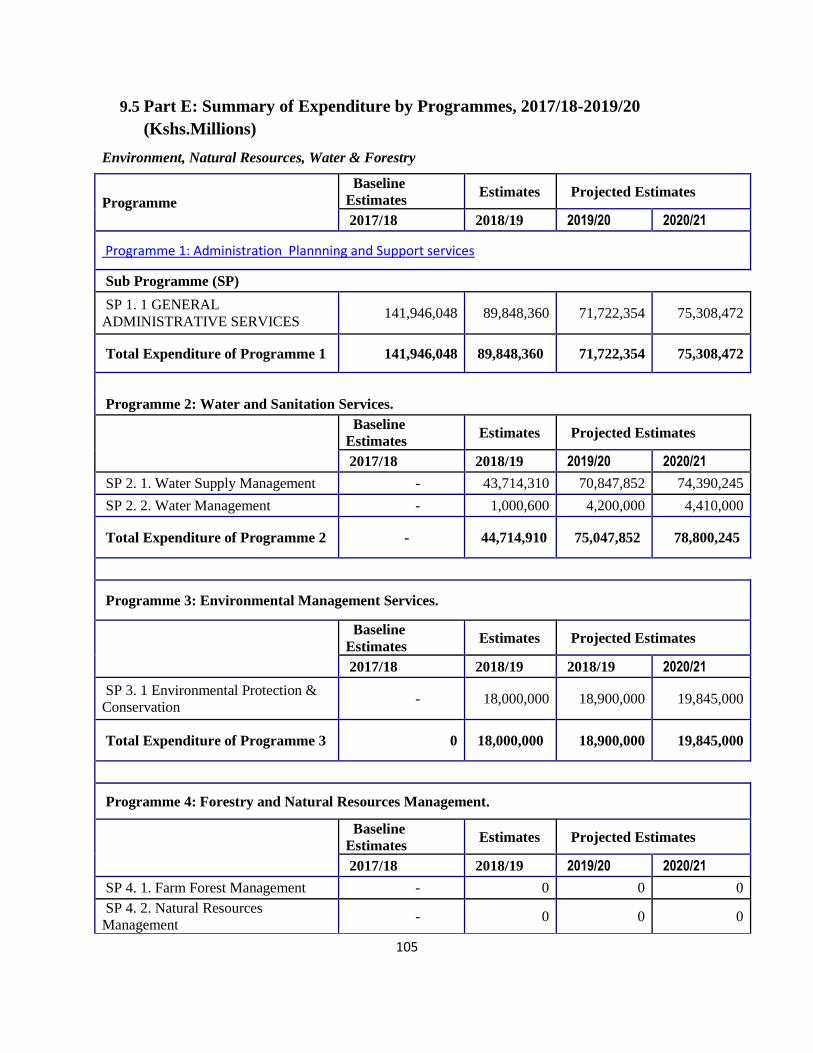
105
9.5 Part E: Summary of Expenditure by Programmes, 2017/18-2019/20
(Kshs.Millions)
Environment, Natural Resources, Water & Forestry
Programme
Baseline
Estimates Estimates Projected Estimates
2017/18 2018/19 2019/20 2020/21
Programme 1: Administration Plannning and Support services
Sub Programme (SP)
SP 1. 1 GENERAL
ADMINISTRATIVE SERVICES 141,946,048 89,848,360 71,722,354 75,308,472
Total Expenditure of Programme 1 141,946,048 89,848,360 71,722,354 75,308,472
Programme 2: Water and Sanitation Services.
Baseline
Estimates Estimates Projected Estimates
2017/18 2018/19 2019/20 2020/21
SP 2. 1. Water Supply Management - 43,714,310 70,847,852 74,390,245
SP 2. 2. Water Management - 1,000,600 4,200,000 4,410,000
Total Expenditure of Programme 2 - 44,714,910 75,047,852 78,800,245
Programme 3: Environmental Management Services.
Baseline
Estimates Estimates Projected Estimates
2017/18 2018/19 2018/19 2020/21
SP 3. 1 Environmental Protection &
Conservation - 18,000,000 18,900,000 19,845,000
Total Expenditure of Programme 3 0 18,000,000 18,900,000 19,845,000
Programme 4: Forestry and Natural Resources Management.
Baseline
Estimates Estimates Projected Estimates
2017/18 2018/19 2019/20 2020/21
SP 4. 1. Farm Forest Management - 0 0 0
SP 4. 2. Natural Resources
Management - 0 0 0

106
Total Expenditure of Programme 4 0 - - -
Total Expenditure of Vote ------- 141,946,048 152,563,270 165,670,206 173,953,717
9.6 Part F: Summary of Expenditure by Vote and Economic Classification
(Kshs. Million)
Expenditure Classification
Baseline
Estimates Estimates Projected Estimates
2017/18 2018/19 2019/20 2020/21
Current Expenditure
Compensation to Employees 16,542,636 26,542,648 27,869,780 29,263,269
Use of goods and services 43,228,336 57,905,712 60,800,998 63,841,047
Current Transfers Govt. Agencies 0 0 0 0
Other Recurrent 2,250,000 2,400,000 2,520,000 2,646,000
Capital Expenditure
Acquisition of Non-Financial Assets 0 0 - -
Capital Transfers to Government Agencies 0 0 - -
Other Development 79,925,076 71,114,910
74,670,656
78,404,188
Total Expenditure of Vote …… 141,946,048 157,963,270 165,861,434 174,154,505
9.7 Part G: Summary of Expenditure by Programme, Sub-Programme and
Economic Classification (KShs. Million)
Expenditure Classification
Baseline
Estimates Estimates Projected Estimates
2017/18 2018/19 2019/20 2020/21
ADMINSTRATION,PLANNING AND SUPPORT SERVICES.
Current Expenditure
Compensation to Employees 16,542,636 26,542,648 27,869,780 29,263,269
Use of goods and services 43,228,336 54,905,712 57,650,998 60,533,547
Current Transfers Govt. Agencies 0 0 0 0

107
Other Recurrent 2,250,000 2,400,000 2,520,000 2,646,000
Capital Expenditure
Acquisition of Non-Financial Assets 0 0 0 0
Capital Transfers to Govt. Agencies 0 0 0 0
Other Development 79,925,076 6000000 6300000 6615000
Total Expenditure 141,946,048 89,848,360 94,340,778 99,057,817
Sub-Programme 1.1: General Administration duties
Expenditure Classification
Baseline
Estimates Estimates Projected Estimates
2017/18 2018/19 2019/20 2020/21
Current Expenditure
Compensation to Employees 16,542,636 26,542,648 27,869,780 29,263,269
Use of goods and services 43,228,336 54,905,712 57,650,998 60,533,547
Current Transfers Govt. Agencies 0 0 0 0
Other Recurrent 2,250,000 2,400,000 2,520,000 2,646,000
Capital Expenditure
Acquisition of Non-Financial Assets 0 0 0 0
Capital Transfers to Govt. Agencies 0 0 0 0
Other Development 79,925,076 6000000 6300000 6615000
Total Expenditure 141,946,048 89,848,360 94,340,778 99,057,817
Programme 2: Water and Sanitation Services.
Expenditure Classification
Baseline
Estimates Estimates Projected Estimates
2017/18 2018/19 2019/20 2020/21
Current Expenditure
Compensation to Employees 0 0 0 0
Use of goods and services 0 0 0 0
Current Transfers Govt. Agencies 0 0 0 0
Other Recurrent 0 0 0 0
Capital Expenditure

108
Acquisition of Non-Financial Assets 0 0 - -
Capital Transfers to Govt. Agencies 0 0 - -
Other Development 0 44,714,910
46,950,656
49,298,188
Total Expenditure 0 44,714,910 46,950,656 49,298,188
SP 2. 1. Water Supply Management
Expenditure Classification
Baseline
Estimates Estimates Projected Estimates
2017/18 2018/19 2019/20 2020/21
Current Expenditure
Compensation to Employees 0 0 0 0
Use of goods and services 0 0 0 0
Current Transfers Govt. Agencies 0 0 0 0
Other Recurrent 0 0 0 0
Capital Expenditure
Acquisition of Non-Financial Assets 0 0 - -
Capital Transfers to Govt. Agencies 0 0 - -
Other Development 0 43,714,310
45,900,026
48,195,027
Total Expenditure 0 43,714,310 45,900,026 48,195,027
SP 2. 2. Water Management
Expenditure Classification
Baseline
Estimates Estimates Projected Estimates
2017/18 2018/19 2019/20 2020/21
Current Expenditure
Compensation to Employees 0 0 0 0
Use of goods and services 0 0 0 0
Current Transfers Govt. Agencies 0 0 0 0
Other Recurrent 0 0 0 0
Capital Expenditure
Acquisition of Non-Financial Assets 0 0 - -

109
Capital Transfers to Govt. Agencies 0 0 - -
Other Development 0 1,000,600
1,050,630
1,103,162
Total Expenditure 0 1,000,600 1,050,630 1,103,162
Programme 3: Environmental Management Services.
Expenditure Classification
Baseline
Estimates Estimates Projected Estimates
2017/18 2018/19 2019/20 2020/21
Current Expenditure
Compensation to Employees 0 0 0 0
Use of goods and services 0 3000000 3150000 3307500
Current Transfers Govt. Agencies 0 0 0 0
Other Recurrent 0 0 0 0
Capital Expenditure
Acquisition of Non-Financial Assets 0 0 - -
Capital Transfers to Govt. Agencies 0 0 - -
Other Development 0 20,400,000
21,420,000
22,491,000
Total Expenditure 0 23,400,000 24,570,000 25,798,500
SP 3. 1 Environmental Protection & Conservation
Baseline
Estimates Estimates Projected Estimates
2017/18 2018/19 2019/20 2020/21
Current Expenditure
Compensation to Employees 0 0 0 0
Use of goods and services 0 3000000 3150000 3307500
Current Transfers Govt. Agencies 0 0 0 0
Other Recurrent 0 0 0 0
Capital Expenditure
Acquisition of Non-Financial Assets 0 0 - -
Capital Transfers to Govt. Agencies 0 0 - -

110
Other Development 0 20,400,000
21,420,000
22,491,000
Total Expenditure 0 23,400,000 24,570,000 25,798,500
Programme 4: Forestry and Natural Resources Management.
Baseline
Estimates Estimates Projected Estimates
2017/18 2018/19 2019/20 2020/21
Current Expenditure
Compensation to Employees 0 0 0 0
Use of goods and services 0 0 0 0
Current Transfers Govt. Agencies 0 0 0 0
Other Recurrent 0 0 0 0
Capital Expenditure
Acquisition of Non-Financial Assets 0 0 - -
Capital Transfers to Govt. Agencies 0 0 - -
Other Development 0 0 - -
Total Expenditure 0 - - -
SP 4. 1. Farm Forest Management
Baseline
Estimates Estimates Projected Estimates
2017/18 2018/19 2019/20 2020/21
Current Expenditure
Compensation to Employees 0 0 0 0
Use of goods and services 0 0 0 0
Current Transfers Govt. Agencies 0 0 0 0
Other Recurrent 0 0 0 0
Capital Expenditure
Acquisition of Non-Financial Assets 0 0 - -
Capital Transfers to Govt. Agencies 0 0 - -
Other Development 0 0 - -
Total Expenditure - - - -

111
SP 4. 2. Natural Resources
Management
Baseline
Estimates Estimates Projected Estimates
2017/18 2018/19 2019/20 2020/21
Current Expenditure
Compensation to Employees 0 0 0 0
Use of goods and services 0 0 0 0
Current Transfers Govt. Agencies 0 0 0 0
Other Recurrent 0 0 0 0
Capital Expenditure
Acquisition of Non-Financial Assets 0 0 - -
Capital Transfers to Govt. Agencies 0 0 - -
Other Development 0 0 - -
Total Expenditure 0 - - -
9.8 Part H: Summary of the Programme Outputs, Performance Indicators and
Targets for FY 2017/18- 2020/21
Programme Delivery Unit Key Outputs Key
Performance
Indicators
Target Target Target Target
(Baseli
ne)
2018/19 2019/20 2020/21
2017/18
Name of Programme: Administration, Planning and Support Service
Outcome: Improved tracking of results and reporting on implementation of
projects and Programmes
SP 1. 1 General
administrative
Service
Environment,
water & natural
resources
operation and
maintenanance
of water systems
undertaken
Quantity of
water
produced
(m3/month)
357930 518610 690150 861690
Name of Programme 2: Water and Sanitation Services
Outcome: Improved tracking of results and reporting on implementation of
projects and Programmes

112
Sp 2. 1 water
supply
management
Environment,
water & natural
resources
Water facilities
developed/
augmented and
rehabilitated
No of water
facilities
developed/
augmented or
rehabilitated
8 12 17 22
Sp 2. 2. Waste
water
management
Environment,
water & natural
resources
Public sanitation
facilities
developed/
rehabilitated
No of public
sanitation
facilities
developed/
rehabilitation
2 4 4 4
Name of Programme 3: Environmental management services
Outcome: Improved tracking of results and reporting on implementation of
projects and Programmes
SP 3. 1
Environmental
protection and
conservation
Environment,
water & natural
resources
Solid waste
sites/points
established
No of solid
waste
points/sites
established
40 40 40 20
Name of Programme 4:Forestry and Natural resources management
Outcome: Improved tracking of results and reporting on implementation of
projects and Programmes
SP 4.1 Farm
forest
management
Environment,
water & natural
resources
Farm forests
established
Area (ha) of
trees planted
15 15 20 25
SP 4.2 Natural
resource
management
Environment,
water & natural
resources
Delapidated and
riverbanks
reclaimed
Area (ha) of
land
reclaimed
0.25 0.375 0.5 0.75

113
10. TRANSPORT, INFRASTRUCTURE AND COMMUNICATION
10.1 Vision
A lead provider of efficient transport system, well maintained infrastructure, ICT and energy in a
secure environment.
10.2 Mission
To provide efficient infrastructure, reliable energy, effective and innovative science and
technology for sustainable development.
10.3 PERFORMANCE OVERVIEW
During the fy 2017/18 the department achieved the following:
Improved Rural/ Urban Road accessibility by opening and maintaining a total of
200kms in various wards.1.8km of of tarmac road was done on Mbale loop road.
Construction of 33no. Box culverts in various wards in the county.
Mapped all projects for FY2017/2018
WIFI connectivity in the county HQs offices.
WAN /LAN was developed.
Connectivity of CCTV at the county HQs.
Continuous maintenance of the IFMIS programme.
I.P telephone system for office communication in County HQ offices.
Initiated the cashless automated system on revenue collection.
Purchased 2no. heavy trucks and a Prime Mover.
Challenges and Constraints
The major constraints that have inhibited effective and efficient implementation of policies, projects and
programme during the review period included:
Slow and cumbersome tendering process, especially with the introduction of e-procurement.
Lack of adequate funds to finance the many projects in the sector.
Over ambitious targets by the proposed by the political class.

114
Slow and late disbursement of funds from the National treasury
Mismatch between the sector budgetary allocation and the procurement process which led large
amounts of pending bills
Lack of legal framework and mechanisms to facilitate private public partnership
Huge maintenance backlog of the existing roads.
Incidence of bad governance in the process of procurement, implementation of projects and
administration of payments at the county treasury
Limited capacity of the contractors in terms of finances and equipment which often led to poor
workmanship, and delayed completion of works
Shortage of technical staff in some sections of the department.
Heavy rains and ruggedness of the terrain which affected the quality of works and
efficiency level.
EXPECTATIONS IN THE NEXT FY2018/2019.
The department will set up an operational Mechanical Section.
The department will continue to open and maintain new roads programmes.
Enhanced Street lighting in market centres
Enhanced supervision of county public buildings
Enhanced supervision of civic works and building.
10.4 Programmes and Objectives
CODE PROGRAMME OBJECTIVE
P1 Administration, Planning
and Support Service
To efficiently and effectively plan and
manage the county resources in-order to
improve access of service by the County
residents

115
P2 Transport Management To ensure effective and efficient transport
system
P3 Infrastructure Development To improve infrastructure supervision and
Development
10.5 Part E: Summary of Expenditure by Programmes, 2017/18-2019/20
(Kshs.)
Transport & Infrastructure
Programme
Baseline
Estimates Estimates Projected Estimates
2017/18 2018/19 2019/20 2020/21
Programme 1: Administration Plannning and Support services
Sub Programme (SP)
SP 1. 1 GENERAL
ADMINISTRATIVE SERVICES 399,279,966 293,637,393 308,319,263 323,735,226
Total Expenditure of Programme
1 399,279,966 293,637,393 308,319,263 323,735,226
Programme 2: Transport & Management.
Baseline
Estimates Estimates Projected Estimates
2017/18 2018/19 2019/20 2020/21
SP 2. 1. Transport System
Management 74,050,000 18,050,000 18,952,500 19,900,125
SP 2. 2. Mechanical Services 15,002,000 15,534,400 16,311,120 17,126,676
Total Expenditure of Programme
2 89,052,000 33,584,400 35,263,620 37,026,801
Programme 3: Infrastructure Development.
Baseline
Estimates Estimates Projected Estimates
2017/18 2018/19 2019/20 2020/21
SP 3.1: Streetlighting.
30,000,000
31,500,000
33,075,000
SP. 3.2: Construction of Low seal
tarmac road
310,350,000
325,867,500
342,160,875

116
SP 3. 1 Roads Maintenance 107,364,037
26,455,937
27,778,734
29,167,671
Total Expenditure of Programme
3 107,364,037 366,805,937 385,146,234 404,403,546
Total Expenditure of Vote ------- 595,696,003 694,027,730 728,729,117 765,165,572
10.6 Part F: Summary of Expenditure by Vote and Economic Classification
(Kshs. Million)
Expenditure Classification
Baseline
Estimates Estimates Projected Estimates
2017/18 2018/19 2019/20 2020/21
Current Expenditure
Compensation to Employees 41,276,064 49,487,134 51,961,491 54,559,565
Use of goods and services 45,765,928 119,727,846 125,714,238 131,999,950
Current Transfers Govt. Agencies 0 0 0 0
Other Recurrent 18,586,750 17,611,387 18,491,956 19,416,554
Capital Expenditure
Acquisition of Non-Financial Assets 0 0 - -
Capital Transfers to Government Agencies 0 0 - -
Other Development 490,067,261 567,201,363
595,561,431
625,339,503
Total Expenditure of Vote …… 595,696,003 754,027,730 791,729,117 831,315,572
10.7 Part G: Summary of Expenditure by Programme, Sub-Programme
and Economic Classification (KShs. Million)
Expenditure Classification
Baseline
Estimates Estimates Projected Estimates
2017/18 2018/19 2019/20 2020/21
ADMINSTRATION,PLANNING AND SUPPORT SERVICES.
Current Expenditure
Compensation to Employees 41,276,064 49,487,134 51,961,491 54,559,565

117
Use of goods and services 41,715,928 75,877,846 79,671,738 83,655,325
Current Transfers Govt. Agencies 0 0 0 0
Other Recurrent 3,584,750 3,676,987 3,860,836 4,053,878
Capital Expenditure
Acquisition of Non-Financial
Assets 0 0 - -
Capital Transfers to Govt. Agencies 0 0 - -
Other Development 312,703,224 164,595,426
172,825,197
181,466,457
Total Expenditure 399,279,966 293,637,393 308,319,263 323,735,226
Sub-Programme 1.1: General Administration duties
Expenditure Classification
Baseline
Estimates Estimates Projected Estimates
2017/18 2018/19 2019/20 2020/21
Current Expenditure
Compensation to Employees 41,276,064 49,487,134 51,961,491 54,559,565
Use of goods and services 41,715,928 75,877,846 79,671,738 83,655,325
Current Transfers Govt. Agencies 0 0 0 0
Other Recurrent 3,584,750 3,676,987 3,860,836 4,053,878
Capital Expenditure
Acquisition of Non-Financial
Assets 0 0 - -
Capital Transfers to Govt. Agencies 0 0 - -
Other Development 312,703,224 164,595,426
172,825,197
181,466,457
Total Expenditure 399,279,966 293,637,393 308,319,263 323,735,226
Programme 2: Transport & Management.
Expenditure Classification
Baseline
Estimates Estimates Projected Estimates
2017/18 2018/19 2019/20 2020/21
Current Expenditure
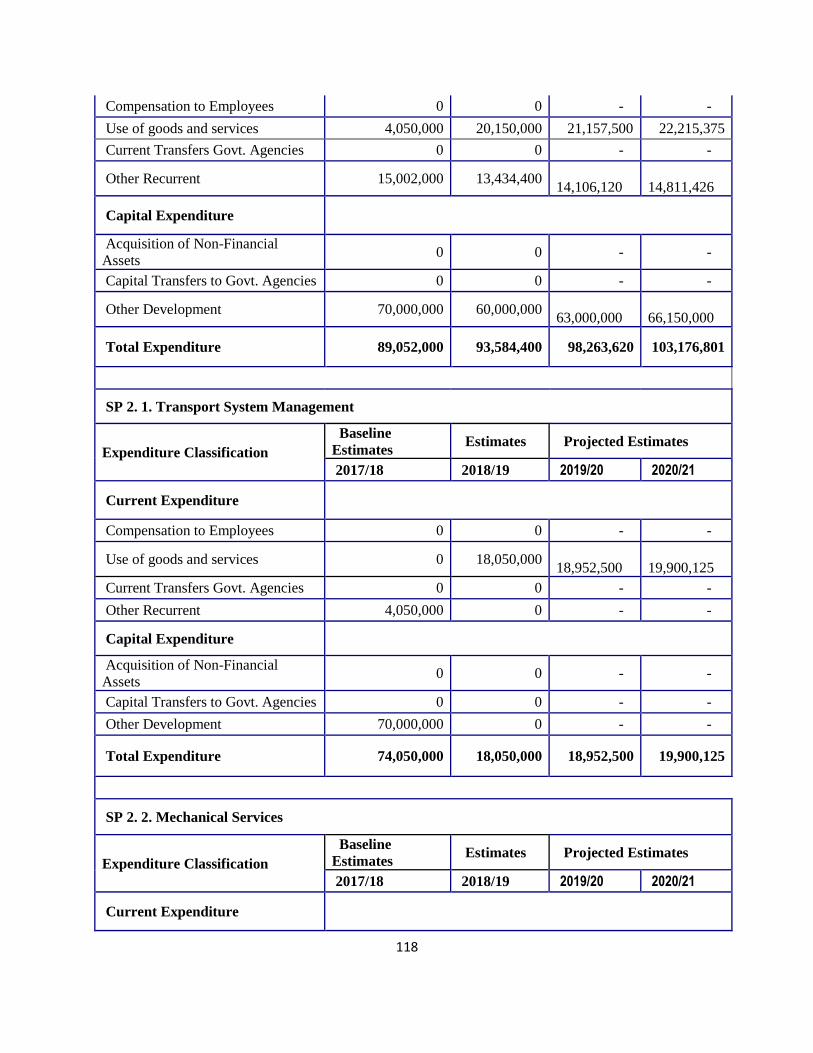
118
Compensation to Employees 0 0 - -
Use of goods and services 4,050,000 20,150,000 21,157,500 22,215,375
Current Transfers Govt. Agencies 0 0 - -
Other Recurrent 15,002,000 13,434,400
14,106,120
14,811,426
Capital Expenditure
Acquisition of Non-Financial
Assets 0 0 - -
Capital Transfers to Govt. Agencies 0 0 - -
Other Development 70,000,000 60,000,000
63,000,000
66,150,000
Total Expenditure 89,052,000 93,584,400 98,263,620 103,176,801
SP 2. 1. Transport System Management
Expenditure Classification
Baseline
Estimates Estimates Projected Estimates
2017/18 2018/19 2019/20 2020/21
Current Expenditure
Compensation to Employees 0 0 - -
Use of goods and services 0 18,050,000
18,952,500
19,900,125
Current Transfers Govt. Agencies 0 0 - -
Other Recurrent 4,050,000 0 - -
Capital Expenditure
Acquisition of Non-Financial
Assets 0 0 - -
Capital Transfers to Govt. Agencies 0 0 - -
Other Development 70,000,000 0 - -
Total Expenditure 74,050,000 18,050,000 18,952,500 19,900,125
SP 2. 2. Mechanical Services
Expenditure Classification
Baseline
Estimates Estimates Projected Estimates
2017/18 2018/19 2019/20 2020/21
Current Expenditure

119
Compensation to Employees 0 - - -
Use of goods and services 0 2,100,000 2,205,000 2,315,250
Current Transfers Govt. Agencies 0 - - -
Other Recurrent 15,002,000
13,434,400
14,106,120
14,811,426
Capital Expenditure
Acquisition of Non-Financial
Assets 0 0 0 0
Capital Transfers to Govt. Agencies 0 0 0 0
Other Development - - - -
Total Expenditure 15,002,000 15,534,400 16,311,120 17,126,676
Programme 3: Infrastructure Development.
Expenditure Classification
Baseline
Estimates Estimates Projected Estimates
2017/18 2018/19 2019/20 2020/21
Current Expenditure
Compensation to Employees 0 - - -
Use of goods and services 0
23,700,000
24,885,000
26,129,250
Current Transfers Govt. Agencies 0 - - -
Other Recurrent 0
500,000
525,000 551,250
Capital Expenditure
Acquisition of Non-Financial
Assets 0 0 0 0
Capital Transfers to Govt. Agencies 0 0 0 0
Other Development 107,364,037 342605937 359736233.9 377723045.5
Total Expenditure 107,364,037 366,805,937 385,146,234 404,403,546
SP.3.1: Streetlighting.
Expenditure Classification
Baseline
Estimates Estimates Projected Estimates
2017/18 2018/19 2019/20 2020/21
Current Expenditure

120
Compensation to Employees 0 0 0 0
Use of goods and services 0 0 0 0
Current Transfers Govt. Agencies 0 0 0 0
Other Recurrent 0 0 0 0
Capital Expenditure
Acquisition of Non-Financial
Assets 0 - - -
Capital Transfers to Govt. Agencies 0 - - -
Other Development 0
30,000,000
31,500,000
33,075,000
Total Expenditure 0 30,000,000 31,500,000 33,075,000
SP.3.2: construction of Low seal tarmac road
Expenditure Classification
Baseline
Estimates Estimates Projected Estimates
2017/18 2018/19 2019/20 2020/21
Current Expenditure
Compensation to Employees 0 0 0 0
Use of goods and services 0 0 0 0
Current Transfers Govt. Agencies 0 0 0 0
Other Recurrent 0 0 0 0
Capital Expenditure
Acquisition of Non-Financial
Assets 0 0 0 0
Capital Transfers to Govt. Agencies 0 0 0 0
Other Development 0 310350000 325867500 342160875
Total Expenditure 0 310,350,000 325,867,500 342,160,875
SP.3.3: Roads maintanance
Expenditure Classification
Baseline
Estimates Estimates Projected Estimates
2017/18 2018/19 2019/20 2020/21
Current Expenditure
Compensation to Employees 0 - - -

121
Use of goods and services 0
23,700,000
24,885,000
26,129,250
Current Transfers Govt. Agencies 0 - - -
Other Recurrent 0
500,000
525,000 551,250
Capital Expenditure
Acquisition of Non-Financial
Assets 0 - - -
Capital Transfers to Govt. Agencies 0 - - -
Other Development 107,364,037
2,255,937
2,368,734
2,487,171
Total Expenditure 107,364,037 26,455,937 27,778,734 29,167,671
10.8 Part H: Summary of the Programme Outputs, Performance Indicators
and Targets for FY 2017/18- 2020/21
Program
me
Delive
ry Unit
Key
Outputs
Key
Performanc
e Indicators
Target Target Target Target
(Baseline)
2017/18 2018/19 2019/20 2020/21
Programme 1. Admnistration, Planning and Support Service
Outcome: Improved and efficient administrative, financial and planning support services.
SP1.1:
General
admnistr
ative
services
County
HQ
admini
strative
Servic
es
Support
services to
user
programmes
Number of
days to
process
requests
from user
department
s
2 days 2 days 2 days 2 days
Programme 2: Transport Management
Outcome: Improved and efficient transport system in the county
SP2.1:Tr
ansport
System
Manage
ment
Transp
ort
Depart
ment
Roads
standards
% aherence
to
prescribed
roads
standards
during
implementa
tion
100%
adherence
to
precribed
road
standards
100%
adherence
to
precribed
road
standards
100%
adherence
to
precribed
road
standards
100% adherence
to
precribed road
standards
SP2.2:M
echanica
l
Services
Mecha
nical
Depart
ment
Revenue
collected
Amount
collected
from hire
of
Collecting
Kshs.
5,000,000
as AIA
Collecting
Kshs.
10,000,000
Collecting
Kshs.11,000
,000
as AIA
Collecting Kshs.
12,100,000 as
AIA

122
machines
Programme 3. Infrastructure Development
Outcome: Increased County and regional road Connectivity and safety
SP 3.1:
Street
lighting
Roads
Depart
ment
Street
lighting
Number of
street lights
installed
55 Number
of street
lights
installed
60 Number
of street
lights
installed
70 Number
of street
lights
installed
80
Number of street
lights installed
SP3.2:
Roads
Construc
tion
(Low
seal
tarmac
road)
Roads
Depart
ment
Tarmac
road
Constructed
KM of
tarmac road
constructed
1 KM of
tarmac road
constructed
1 KM of
tarmac road
constructed
1 KM of
tarmac road
constructed
1 KM of tarmac
road
constructed
SP 3.3:
Roads
maintena
nce
Roads
depart
ment
Roads
Maintained/
rehabilitated
KM of
roads
Maintained
/rehabilated
50 KM of
roads
Maintained/
rehabilitated
100 KM of
roads
Maintained/
rehabilitated
125 KM of
roads
Maintained/
rehabilitated
150 KM of roads
Maintained/rehabi
litated

123
11. PHYSICAL PLANNING, LANDS & HOUSING
11.1 Part A: Vision
To be lead Provider of Urban and Physical Planning services, Prudent Land Management and
Decent Housing for Sustainable Development
11.2 Part B: Mission
To Promote Efficient, Effective and Sustainable Land use practises, and Provide Decent and
Adequate Housing for all in a Clean and Secure Environment using appropriate technologies.
11.3 Part C: Performance Overview and Background for Programmes The department recorded achievements during the period 2012/13-2014/15/16-16/17 and
2017/18. Some of which included:
Establishment of Geographic Information System (GIS)
Survey and mapping of public land parcels that included: Kapkoros Cultural Centre,
Kidundu & Hamisi Sports Grounds.
Purchase of 18 acres of land for banking for the expansion of public utilities
De-gazetement of part of Kibiri forest for the Shiru/Shaviringa settlement program
Implementation of the Social Housing Scheme, where 225 houses were constructed for
the vulnerable (widows, orphans, PDW& the elderly) .
The Department faced numerous challenges during the budget implementation process in the
fy 2015/16, some of which included:
lengthy procurement procedures which slowed down programmes implementation;
inadequate and slow disbursement of funds
Weak supervision of building and other infrastructure development due to human
resource constraints
Lack of survey equipment and inadequate technical personnel among others.
Increasing land disputes
Unsustainable land-use
Conflicting laws governing land administration
Increasing cost of building materials

124
The department has earmark to undertake the following activities in the financial year 2018/19;
Preparation of a strategic physical development plan for Luanda town and an integrated
master plan for major towns in the County to guide the development of urban centres,
Establishment of an Integrated Land Management and Information System
Planning, surveying, demarcation and compensation for lands are acquired.
Establishment of a Map Amendment Centre (MAC)
Completion, staffing and equipping the GIS lab.
Expanding the social housing support programme.
Rehabilitation and maintenance of county government buildings.
11.4 Part D: Programme Objectives
Programme code Programme Objectives
P1 Administration planning and
Support Services
To increase access to
quality, timely and effective
services
P2 Land survey and mapping
services
To enhance effective land
use and administration
P3 Urban Physical planning and
housing services
To promote an integrated
housing, urban and physical
planning management
system
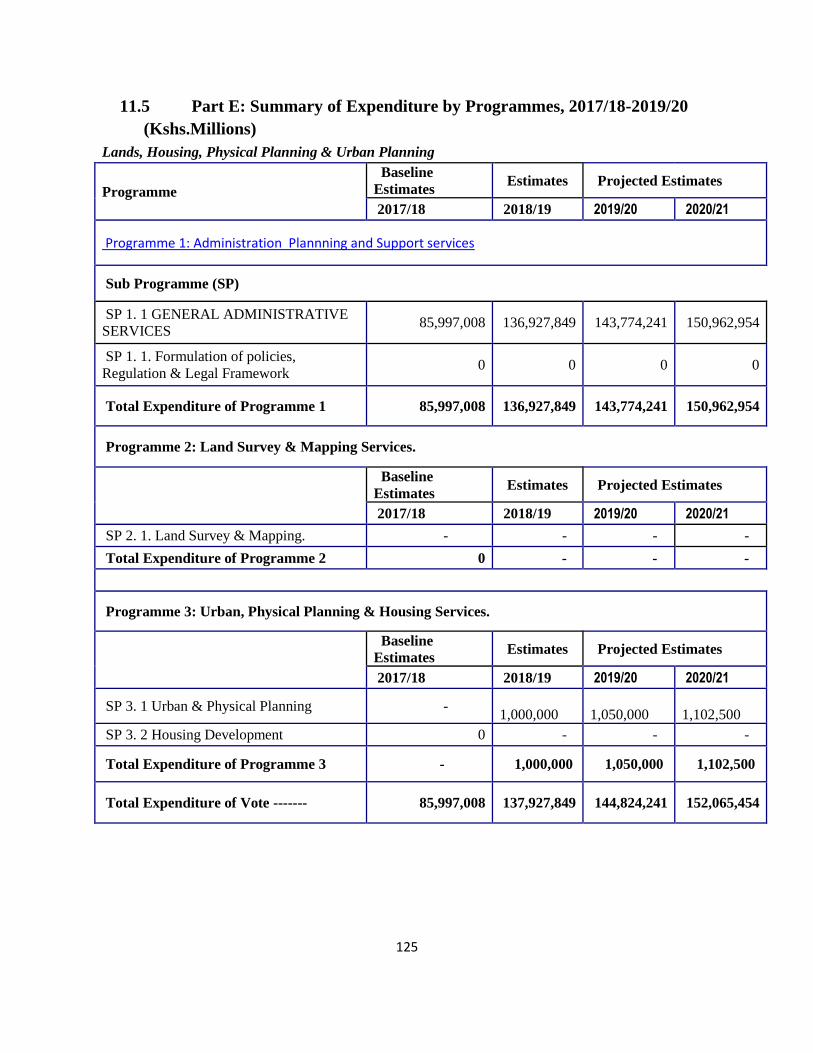
125
11.5 Part E: Summary of Expenditure by Programmes, 2017/18-2019/20
(Kshs.Millions)
Lands, Housing, Physical Planning & Urban Planning
Programme
Baseline
Estimates Estimates Projected Estimates
2017/18 2018/19 2019/20 2020/21
Programme 1: Administration Plannning and Support services
Sub Programme (SP)
SP 1. 1 GENERAL ADMINISTRATIVE
SERVICES 85,997,008 136,927,849 143,774,241 150,962,954
SP 1. 1. Formulation of policies,
Regulation & Legal Framework 0 0 0 0
Total Expenditure of Programme 1 85,997,008 136,927,849 143,774,241 150,962,954
Programme 2: Land Survey & Mapping Services.
Baseline
Estimates Estimates Projected Estimates
2017/18 2018/19 2019/20 2020/21
SP 2. 1. Land Survey & Mapping. - - - -
Total Expenditure of Programme 2 0 - - -
Programme 3: Urban, Physical Planning & Housing Services.
Baseline
Estimates Estimates Projected Estimates
2017/18 2018/19 2019/20 2020/21
SP 3. 1 Urban & Physical Planning -
1,000,000
1,050,000
1,102,500
SP 3. 2 Housing Development 0 - - -
Total Expenditure of Programme 3 - 1,000,000 1,050,000 1,102,500
Total Expenditure of Vote ------- 85,997,008 137,927,849 144,824,241 152,065,454

126
11.6 Part F: Summary of Expenditure by Vote and Economic Classification
(Kshs. Million)
Expenditure Classification
Baseline
Estimates Estimates Projected Estimates
2017/18 2018/19 2019/20 2020/21
Current Expenditure
Compensation to Employees 12,730,286 20,313,346 21,329,013 22,395,464
Use of goods and services 35,069,109 48,280,163 50,694,171 53,228,880
Current Transfers Govt. Agencies 0 0 0 0
Other Recurrent 9,734,200 2,334,340 2,451,057 2,573,610
Capital Expenditure
Acquisition of Non-Financial Assets 0 0 - -
Capital Transfers to Government Agencies 0 0 - -
Other Development 28,463,413 67,000,000
70,350,000
73,867,500
Total Expenditure of Vote …… 85,997,008 137,927,849 144,824,241 152,065,454
11.7 Part G: Summary of Expenditure by Programme, Sub-Programme
and Economic Classification (KShs. Million)
Expenditure Classification
Baseline
Estimates Estimates Projected Estimates
2017/18 2018/19 2019/20 2020/21
ADMINSTRATION,PLANNING AND SUPPORT SERVICES.
Current Expenditure
Compensation to Employees 12,730,286 20,313,346 21,329,013 22,395,464
Use of goods and services 35,069,109 47,280,163 49,644,171 52,126,380
Current Transfers Govt. Agencies 0 0 0 0
Other Recurrent 9,734,200 2,334,340 2,451,057 2,573,610
Capital Expenditure
Acquisition of Non-Financial Assets 0 0 - -
Capital Transfers to Govt. Agencies 0 0 - -
Other Development 28,463,413 67,000,000
70,350,000
73,867,500

127
Total Expenditure 85,997,008 136,927,849 143,774,241 150,962,954
Sub-Programme 1.1: General Administration duties
Expenditure Classification
Baseline
Estimates Estimates Projected Estimates
2017/18 2018/19 2019/20 2020/21
Current Expenditure
Compensation to Employees 12,730,286 20,313,346 21,329,013 22,395,464
Use of goods and services 35,069,109 47,280,163 49,644,171 52,126,380
Current Transfers Govt. Agencies 0 0 0 0
Other Recurrent 9,734,200 2,334,340 2,451,057 2,573,610
Capital Expenditure
Acquisition of Non-Financial Assets 0 0 - -
Capital Transfers to Govt. Agencies 0 0 - -
Other Development 28,463,413 67,000,000
70,350,000
73,867,500
Total Expenditure 85,997,008 136,927,849 143,774,241 150,962,954
SP 1. 2. Formulation of policies, Regulation & Legal Framework
Expenditure Classification
Baseline
Estimates Estimates Projected Estimates
2017/18 2018/19 2019/20 2020/21
Current Expenditure
Compensation to Employees 0 0 0 0
Use of goods and services 0 0 0 0
Current Transfers Govt. Agencies 0 0 0 0
Other Recurrent 0 0 0 0
Capital Expenditure
Acquisition of Non-Financial Assets 0 0 0 0
Capital Transfers to Govt. Agencies 0 0 0 0
Other Development 0 0 0 0
Total Expenditure 0 0 0 0

128
Programme 2: Land Survey & Mapping Services.
Expenditure Classification
Baseline
Estimates Estimates Projected Estimates
2017/18 2018/19 2019/20 2020/21
Current Expenditure
Compensation to Employees 0 - - -
Use of goods and services 0 - - -
Current Transfers Govt. Agencies 0 - - -
Other Recurrent 0 - - -
Capital Expenditure
Acquisition of Non-Financial Assets 0 - - -
Capital Transfers to Govt. Agencies 0 - - -
Other Development 0 - - -
Total Expenditure 0 - - -
SP 2. 1. Land Survey & Mapping.
Expenditure Classification
Baseline
Estimates Estimates Projected Estimates
2017/18 2018/19 2019/20 2020/21
Current Expenditure
Compensation to Employees 0 - - -
Use of goods and services 0 - - -
Current Transfers Govt. Agencies 0 - - -
Other Recurrent 0 - - -
Capital Expenditure
Acquisition of Non-Financial Assets 0 - - -
Capital Transfers to Govt. Agencies 0 - - -
Other Development 0 - - -
Total Expenditure 0 - - -
Programme 3: Urban, Physical Planning & Housing Services.

129
Expenditure Classification
Baseline
Estimates Estimates Projected Estimates
2017/18 2018/19 2019/20 2020/21
Current Expenditure
Compensation to Employees 0 - - -
Use of goods and services 0
1,000,000
1,050,000
1,102,500
Current Transfers Govt. Agencies 0 - - -
Other Recurrent 0 - - -
Capital Expenditure
Acquisition of Non-Financial Assets 0 - - -
Capital Transfers to Govt. Agencies 0 - - -
Other Development 0 - - -
Total Expenditure 0 1,000,000 1,050,000 1,102,500
SP 3. 1 Urban & Physical Planning
Expenditure Classification
Baseline
Estimates Estimates Projected Estimates
2017/18 2018/19 2019/20 2020/21
Current Expenditure
Compensation to Employees 0 0 0 0
Use of goods and services 0 1000000 1050000 1102500
Current Transfers Govt. Agencies 0 0 0 0
Other Recurrent 0 0 0 0
Capital Expenditure
Acquisition of Non-Financial Assets 0 0 0 0
Capital Transfers to Govt. Agencies 0 0 0 0
Other Development 0 - - -
Total Expenditure 0 1,000,000 1,050,000 1,102,500
SP 3. 2 Housing Development
Expenditure Classification
Baseline
Estimates Estimates Projected Estimates
2017/18 2018/19 2019/20 2020/21

130
Current Expenditure
Compensation to Employees 0 0 0 0
Use of goods and services 0 0 0 0
Current Transfers Govt. Agencies 0 0 0 0
Other Recurrent 0 0 0 0
Capital Expenditure
Acquisition of Non-Financial Assets 0 0 0 0
Capital Transfers to Govt. Agencies 0 0 0 0
Other Development 0 - - -
Total Expenditure 0 - - -
11.8 Part H: Summary of the Programme Outputs, Performance Indicators and
Targets for FY 2017/18- 2020/21
Programme Delivery Unit Key Outputs Key
Performance
Indicators
Target
(Baseli
ne)
2017/18
Target
2018/19
Target
2019/20
Target
2020/21
Programme 1. Administration, Planning and Support Service
Outcome: To increase access to quality , timely and effective services
SP1.1:
General
administrati
ve Service
Administrati
on Customer
satisfaction
% of customers
satisfied
60% 65% 70% 75%
SP.1.2:
Formulation
of polices,
regulations
and legal
framework
Administrati
on Policies
and
regulations
No. of
policies/regulatio
ns enacted
3 5 7 9
Programme 2. Land survey and mapping services
Outcome: To enhance effective land use and administration
SP2.1: Land
survey and
mapping
Survey Deed plans
prepared
County
No. of deeds
prepared
Number of
3 5 8 10

131
topographic
al and
thematic
maps
updated
County
topographical
and
thematic maps
updated
Programme 3. Urban and Physical planning and housing services
Outcome: To promote an integrated housing, urban and physical planning management system
SP3.1:
Urban and
physical
planning
Urban and
Physical
Planning
Plans
prepared
No. Of Plans
prepared
Phase/stage/proc
ess of plan
development
3 5 7 10
SP3.2:
Housing
developmen
t
Housing Housing
units
constructed
No. Of housing
units constructed
225 300 350 400

132
12. ADMINISTRATION AND COORDINATIONOF COUNTY
SERVICES
12.1 Part A: Vision
To be a lead entity in Public Administration, Human Resource Management and Performance
Management.
12.2 Part B: Mission
To provide leadership in Public Administration, Human Resource Management and Performance
Management for effective public service delivery
12.3 Part C: Performance Overview and Background for Programmes
The budgetary allocation for the Department of Public Service, Administration and Special
Programmes has progressively increased since inception of devolved government system in
2013/14. Subsequently, the County Government of Vihiga has witnessed marked improvement
in service delivery over the same period.
Major achievements recorded in the period include;
Equipping and staffing of the sub-county and ward administrator’s offices.
Several public participation fora held on county government programmes as required by
the constitution
Various officers undertook trained to improve and build on their capacity
Civic awareness, and enforcing National Values and Principles of Governance in Public
Service.
Gender mainstreaming, cohesion and peace building fora
Establishing liquor licensing offices in sub-counties
Setting up and equipping the radio infrastructure
Creation of institutional framework to operationalize the county radio station
Recruitment and capacity building of county radio staff
During the last fiscal year, the County Department of Public Service and Administration faced
several challenges that included; high demand for employment despite the ballooning wage bill,
capacity constraints in some disciplines, wage disparities in the county government, slow

133
embracement of devolution, and slow transfer of liquor licensing function by the national
government.
To address some of the challenges, the department in conjunction with the County Public
Service Board is committed to ensure that competent public servants are recruited, motivated,
retained and deployed. The HR Department will develop an integrated HR strategy that will
address disparities in remuneration, and capacity gaps experienced in the county government
departments. The Department will also institute a performance management system, job
evaluation exercises and proper reward for efficient and productive civil service. Training and
capacity building will be prioritized during the period as guided by policy guidelines, and based
on needs assessment reports.
A strong foundation and basic understanding of research and development and its universal
importance is needed to make certain breakthroughs or decisions that ensure prosperity in the
county. To this end the directorate of research and development will continue to undertake
meaningful research and surveys to provide the much needed critical data and information for
policy formulation and implementation.
To efficiently regulate liquor sale in the county, the capacity of the liquor licensing department
will be strengthened at sub-county levels for effective coordination.
The county radio is now on air after getting the frequency from the Communication Authority of
Kenya.
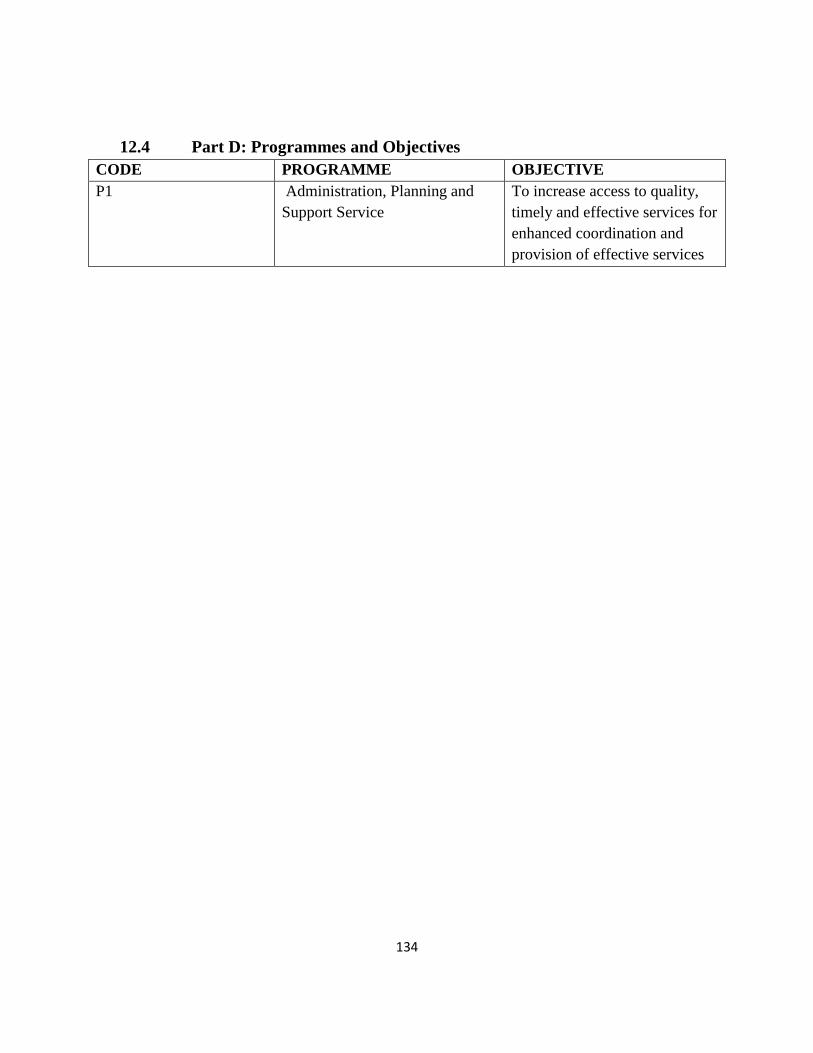
134
12.4 Part D: Programmes and Objectives
CODE PROGRAMME OBJECTIVE
P1 Administration, Planning and
Support Service
To increase access to quality,
timely and effective services for
enhanced coordination and
provision of effective services

135
12.5 Part E: Summary of Expenditure by Programmes, 2017/18-2020/21
(Kshs.Millions)
Public Service &Administration
Programme
Baseline
Estimates Estimates Projected Estimates
2017/18 2018/19 2019/20 2020/21
Programme 1: Administration Plannning and Support services
Sub Programme (SP)
SP 1. 1 GENERAL
ADMINISTRATIVE SERVICES 390,516,247 327,531,951 343,908,549 361,103,976
SP 1.2 County/Subcounty
Administration 43,750,000 55,910,000 58,705,500 61,640,775
SP 1.3 County FM Radio 45,784,536 29,100,000 30,555,000 32,082,750
Total Expenditure of Programme
1 480,050,783 412,541,951 433,169,049 454,827,501
Total Expenditure of Vote ------- 480,050,783 412,541,951 433,169,049 454,827,501
12.6 Part F: Summary of Expenditure by Vote and Economic Classification
(Kshs. Million)
Expenditure Classification
Baseline
Estimates Estimates Projected Estimates
2017/18 2018/19 2019/20 2020/21
Current Expenditure
Compensation to Employees 281,437,677 236,802,555 248,642,683 261,074,817
Use of goods and services 175,644,106 124,872,396 131,116,016 137,671,817
Current Transfers Govt. Agencies 0 0 0 0
Other Recurrent 7,969,000 5,427,000 5,698,350 5,983,268
Capital Expenditure
Acquisition of Non-Financial
Assets 0 0 0 0
Capital Transfers to Government
Agencies 0 0 0 0
Other Development 15,000,000 45,440,000 47,712,000 50,097,600
Total Expenditure of Vote …… 480,050,783 412,541,951 433,169,049 454,827,501

136
12.7 Part G: Summary of Expenditure by Programme, Sub-Programme
and Economic Classification (KShs. Million)
Expenditure Classification
Baseline
Estimates Estimates Projected Estimates
2017/18 2018/19 2019/20 2020/21
Current Expenditure
Compensation to Employees 281,437,677 236,802,555 248,642,683 261,074,817
Use of goods and services 175,644,106 124,872,396 131,116,016 137,671,817
Current Transfers Govt. Agencies 0 0 0 0
Other Recurrent 7,969,000 5,427,000 5,698,350 5,983,268
Capital Expenditure
Acquisition of Non-Financial
Assets 0 0 0 0
Capital Transfers to Government
Agencies 0 0 0 0
Other Development 15,000,000 45,440,000
47,712,000
50,097,600
Total Expenditure of Vote …… 480,050,783 412,541,951 433,169,049 454,827,501
Sub-Programme 1.1: General
Administration duties
Expenditure Classification
Baseline
Estimates Estimates Projected Estimates
2017/18 2018/19 2019/20 2020/21
Current Expenditure
Compensation to Employees 263,339,141 219,602,555 230,582,683 242,111,817
Use of goods and services 109,100,106 61,712,396 64,798,016 68,037,917
Current Transfers Govt. Agencies 0 0 0 0
Other Recurrent 3,077,000 1,977,000 2,075,850 2,179,643
Capital Expenditure
Acquisition of Non-Financial
Assets 0 0 0 0
Capital Transfers to Government
Agencies 0 0 0 0

137
Other Development 15,000,000 44,240,000
46,452,000
48,774,600
Total Expenditure of Vote …… 390,516,247 327,531,951 343,908,549 361,103,976
Sub-Programme 1.2 County/Subcounty
Administration
Expenditure Classification
Baseline
Estimates Estimates Projected Estimates
2017/18 2018/19 2019/20 2020/21
Current Expenditure
Compensation to Employees 0 0 0 0
Use of goods and services 41,300,000 52,860,000 55,503,000 58,278,150
Current Transfers Govt. Agencies 0 0 0 0
Other Recurrent 2,450,000 2,850,000 2,992,500 3,142,125
Capital Expenditure
Acquisition of Non-Financial
Assets 0 0 0 0
Capital Transfers to Government
Agencies 0 0 0 0
Other Development 0 200,000
210,000
220,500
Total Expenditure of Vote …… 43,750,000 55,910,000 58,705,500 61,640,775
Sub-Programme 1.3 County FM Radio
Expenditure Classification
Baseline
Estimates Estimates Projected Estimates
2017/18 2018/19 2019/20 2020/21
Current Expenditure
Compensation to Employees 18,098,536 17,200,000 18,060,000 18,963,000
Use of goods and services 25,244,000 10,300,000 10,815,000 11,355,750
Current Transfers Govt. Agencies 0 0 0 0
Other Recurrent 2,442,000 600,000 630,000 661,500
Capital Expenditure
Acquisition of Non-Financial
Assets 0 0 0 0

138
Capital Transfers to Government
Agencies 0 0 0 0
Other Development 0 1,000,000
1,050,000
1,102,500
Total Expenditure of Vote …… 45,784,536 29,100,000 30,555,000 32,082,750
12.8 Part H: Summary of the Programme Outputs, Performance Indicators
and Targets for FY 2017/18- 2020/21
Programme Delivery Unit Key
Outputs
Key
Performance
Indicators
Target Target
2018/19
Target
2019/20
Target
2020/21
(Baseline)
2017/18
Name of Programme: General Administration Services
Outcome: Improved efficiency and effectiveness in public service delivery
SP1.1: General
Administration
Services
Public Service
and
Administration
Harmonized
public
service
Functions
Approved
service
structure &
job
descriptions
manuals
New
appointments
and
promotions
Equity and
fairness in
distribution
Percentage of
harmonized
functions
No. of
structures
approved
No. of
approved job
descriptions
manuals
No. of
Schemes of
service
Revised
No. of months
taken
Ratio of
gender
distribution
% No. of
Persons With
100% 100%
1
3 Months
1:3
100%
2
2
Months
1:3
100%
3
1
Month
1:3

139
of
employment
opportunities
Adjudicated
discipline
Disability
% No. of
monority and
marginalized
groups
No. of weeks
taken
1%
3%
3 weeks
10
1%
3%
2 weeks
1%
3%
2 weeks
SP.2
County/Sub
County
Administration
services
Sub County
and ward
Administration
Office
Customer
Satisfaction Satisfaction
level - 60% 70% 80%
SP. 3 County
Radio
information
Services
County radio
Station
Audience
reached
No. of
audience
reahed
100,0000 200,000 300,000

140
COUNTY ASSEMBLY
A. VISION
To transform Vihiga a prosperous County by formilating and implementing good
Government and Development systems.
B. MISSION
Establish Accountable and Transparent Government systems.
C. OBJECTIVES
Erradicate poverty.
Provide education its people
Create job opportunity
Provide clean water and passable roads.
1.1 Part E: Summary of Expenditure by Programmes, 2017/18-2019/20
(Kshs.Millions)
County Assembly
Programme
Baseline
Estimates Estimates Projected Estimates
2017/18 2018/19 2019/20 2020/21
Programme 1: Administration Plannning and Support services
Sub Programme (SP)
SP 1. 1 GENERAL
ADMINISTRATIVE SERVICES
571,213,332 403,733,696 423,920,381 445,116,400
Total Expenditure of Programme 1 571,213,332 403,733,696 423,920,381 445,116,400
Programme Baseline
Estimates Estimates Projected Estimates
2017/18 2018/19 2019/20 2020/21
SP 1. 2. Formulation of policies,
Regulation & Legal Framework - 251,259,662 263,822,645 277,013,777
Total Expenditure of Programme 2 0 251,259,662 263,822,645 277,013,777

141
Programme
Baseline
Estimates Estimates Projected Estimates
2017/18 2018/19 2019/20 2020/21
SP 1. 3 Oversight - 0 0 0
Total Expenditure of Programme 3 - - - -
Total Expenditure of Vote ------- 571,213,332 654,993,358 687,743,026 722,130,177
1.2 Part F: Summary of Expenditure by Vote and Economic Classification
(Kshs. Million)
Expenditure Classification Baseline
Estimates Estimates Projected Estimates
2017/18 2018/19 2019/20 2020/21
Current Expenditure
Compensation to Employees
318,779,464 321,768,239 337,856,651 354,749,483
Use of goods and services
200,873,816 230,643,105 242,175,260 254,284,023
Current Transfers Govt. Agencies 0 0 0 0
Other Recurrent
11,120,000 8,550,000 8,977,500 9,426,375
Capital Expenditure
Acquisition of Non-Financial Assets 0 0 0 0
Capital Transfers to Government
Agencies 0 0 0 0
Other Development
40,440,052 94,032,014
98,733,615
103,670,295
Total Expenditure of Vote …… 571,213,332 654,993,358 687,743,026 722,130,177

142
Part G: Summary of Expenditure by Programme, Sub-Programme and Economic Classification
(KShs. Million)
Expenditure Classification Baseline
Estimates Estimates Projected Estimates
2017/18 2018/19 2019/20 2020/21
ADMINSTRATION,PLANNING AND SUPPORT SERVICES.
Current Expenditure
Compensation to Employees
318,779,464 321,768,239 337,856,651 354,749,483
Use of goods and services
200,873,816 230,643,105 242,175,260 254,284,023
Current Transfers Govt. Agencies 0 0 0 0
Other Recurrent
11,120,000 8,550,000 8,977,500 9,426,375
Capital Expenditure
Acquisition of Non-Financial Assets 0 0 0 0
Capital Transfers to Govt. Agencies 0 0 0 0
Other Development
40,440,052 94,032,014
98,733,615
103,670,295
Total Expenditure 571,213,332 654,993,358 687,743,026 722,130,177
Sub-Programme 1.1: General Administration duties
Expenditure Classification
Baseline
Estimates Estimates Projected Estimates
2017/18 2018/19 2019/20 2020/21
Current Expenditure
Compensation to Employees 126,035,160 131,990,581
138,590,110 145,519,616
Use of goods and services
75,729,515 169,161,101
177,619,156 186,500,114
Current Transfers Govt. Agencies 0 0 - 0
Other Recurrent
8,120,000 8,550,000
8,977,500 9,426,375

143
Capital Expenditure
Acquisition of Non-Financial Assets 0 0 0 0
Capital Transfers to Govt. Agencies 0 0 0 0
Other Development
40,440,052 94,032,014
98,733,615
103,670,295
Total Expenditure 250,324,727 403,733,696 423,920,381 445,116,400
SP 1. 2. Formulation of policies, Regulation & Legal Framework
Expenditure Classification
Baseline
Estimates Estimates Projected Estimates
2017/18 2018/19 2019/20 2020/21
Current Expenditure
Compensation to Employees 116,649,904 189,777,658 199,266,541 209,229,868
Use of goods and services
95,003,640 61,482,004 64,556,104 67,783,909
Current Transfers Govt. Agencies 0 0 0 0
Other Recurrent
1,000,000 0 0 0
Capital Expenditure
Acquisition of Non-Financial Assets 0 0 0 0
Capital Transfers to Govt. Agencies 0 0 0 0
Other Development 0 0 0 0
Total Expenditure 212,653,544 251,259,662 263,822,645 277,013,777
Programme 1:3 Oversight
Expenditure Classification
Baseline
Estimates Estimates Projected Estimates
2017/18 2018/19 2019/20 2020/21
Current Expenditure
Compensation to Employees
76,094,400 0 0

144
Use of goods and services
32,140,660 0 0
Current Transfers Govt. Agencies 0 0 0 0
Other Recurrent 0 0 0
Capital Expenditure
Acquisition of Non-Financial Assets 0 0 0 0
Capital Transfers to Govt. Agencies 0 0 0 0
Other Development 0 0 0
Total Expenditure 108,235,060 - - -

145
Recommended


