Cost estimates for nuclear power in
the UK
ICEPT Working Paper
August 2012
Ref: ICEPT/WP/2012/014
Grant Harris ([email protected])
Phil Heptonstall ([email protected])
Robert Gross ([email protected])
David Handley ([email protected])
The authors welcome comments on this working paper. In the first instance these should
be addressed to [email protected]
Imperial College Centre for Energy Policy and Technology
http://www3.imperial.ac.uk/icept

ii
Contents
Executive Summary ___________________________________ 1
1. Introduction _____________________________________ 3
2. Approach and Methodology __________________________ 5
3. Findings from analysis of US and European nuclear
programmes _________________________________________ 5
Pre-construction period _________________________________________ 5
Construction period ____________________________________________ 7
Other key cost input assumptions ________________________________ 15
4. Implications for the UK nuclear cost estimates _________ 18
5. Conclusions and implications for policy _______________ 21
References _________________________________________ 22

1
Executive Summary
The primary conclusion of this paper is that the capital cost estimates for nuclear power
that are being used to inform current UK Government policy rely on costs escalating over
the pre-construction and construction phase of the new build programme at a level
below those that have been experienced by past US and European nuclear build
programmes. This suggests that nuclear power may be more expensive than recent
Government commissioned reports have indicated, and may therefore require greater
levels of financial support (reflected, for example, in the strike price for the Contracts for
Difference envisaged in the UK’s Energy Bill) than policymakers might have originally
envisaged.
Current UK Government policy documents rely upon a central estimate of ‘overnight
cost’ (i.e. construction costs excluding financing costs) of £3,742/kW for the new build
programme and an associated levelised cost of £95/MWh. This estimate is based upon
the following major assumptions:
Construction costs escalating over the construction phase of the new build
programme at an implied rate of ~1.5% (real, compounded).
A construction phase of 6 years.
The technical specifications of nuclear reactors to inform assumptions on reactor
operating lifetimes and plant load factors.
The capital cost of nuclear plants represents around 80% of the overall cost of nuclear
power generation, and the scope and complexity of nuclear reactor plants drive pre-
construction and construction phases to span upwards of 14 years, in turn exposing the
nuclear build process to a significant amount of exogenous pressures that impact final
‘out-turn’ capital costs.
This paper has analysed the cost escalation rates of 179 reactors from US and European
nuclear build programmes. The implied ~1.5% cost escalation rate that current
estimates for the UK market rely upon is significantly below the escalation rates that
have been experienced by previous French (3.6%) and US (8.1%) nuclear build
programmes and current European (11.1%) and US (14.2%) new build programmes. For
the purposes of the analysis, this paper uses an escalation rate of 5.4% which
represents the weighted average escalation rate of the 58 reactors in the French build
programme between the 1970s and 1990s, the 99 reactors in the US new build
programme between the 1970s and 1990s and the IHS/Cambridge Energy Research Associates
(CERA) European Power Capital Cost index. Applying this cost escalation rate to the ‘more
than £9 billion’ cost estimate provided by EDF Energy to construct two new reactors at
the Hinkley C site, results in the overnight cost estimate for the UK market increasing
from the current estimate of £3,742/kW to c£4,885/kW.
The 6 year construction phase estimate that is being used to inform cost projections for
the UK new build programme is 2 years shorter than the current global average. With
construction phase times in the US and France increasing due to new reactor
technologies and regulatory requirements, the paper uses the global average
construction time of 8 years as a baseline.

2
Following a similar approach, this paper relies upon global averages and historical
performance as the primary indicators of future plant operating performance rather than
relying on the technical specifications of reactors that are yet to begin operation
anywhere in the world.
Finally, based on industry estimates for the nuclear new build programme in the UK
market we base our calculations on a Weighted Average Cost of Capital (WACC) of 11%
versus the current estimate of 10%.
Figure 1 below demonstrates how sensitive existing levelised cost estimates are to these
revised assumptions, with levelised costs increasing from £95/MWh to £164/MWh.
Figure 1 Sensitivity of UK Government levelised cost estimates to changes in key assumptions, Sources: (Mott
MacDonald, 2010) and the analysis presented in this paper.
Due to the significant uncertainties that surround cost estimates for nuclear power in
general it is very difficult to give a high level of confidence to any single levelised cost
estimate. This paper does however show that there is sufficient empirical evidence to
support the notion that costs may be substantially higher than recently envisaged.
It is of course possible that nuclear project developers will take a more optimistic view
on the potential for cost escalation during the pre-construction and construction phase,
and chose to take projects forward with a level of policy support that is consistent with
this more optimistic perspective. In doing so, they would be bearing the risk of cost
escalations unless they believe that there may be a possibility in future to seek
additional support if costs do rise. A further possible outcome is that it proves impossible
for Government and project developers to agree on the support level required, leaving
the UK with the challenge of how to achieve its energy policy objectives without any
additional contribution from nuclear power.
£0
£20
£40
£60
£80
£100
£120
£140
£160
Nuclear - PWR (current
UK new build estimate)
Increase construction
phase from 6 to 8 years
Decrease operating phase
from 60 to 40 years
Decrease load factor from 90%
to 80.5%
Increase WACC from 10% to 11%
Escalate overnight costs
@ 5.4%
£/MWhLevelised cost of energy (£/MWh) in 2013
Long term waste disposalCO2 Transport and storageDecommissioning / waste storageCarbon Costs
Fuel cost
Variable O&M
Fixed O&M
Capital cost
£164
£102 £104£110
£123
£95
~1.5% overnight escalation rate applied

3
1. Introduction
As recently as 2002, the view of the UK Government was that the focus for its energy
policy should be energy efficiency and a substantial increase in electricity generation
from renewables, with the option of new nuclear power ‘kept open’ but with no direct
support (PIU, 2002). By the mid-2000’s however, the UK Government’s disposition
towards new nuclear power was much more positive. The 2006 Energy Review concluded
that the economics of the technology had improved and that, ‘new nuclear power
stations would make a significant contribution to meeting our energy policy goals’, albeit
with the clear proviso that, ‘it will be for the private sector to initiate, fund, construct and
operate new nuclear plants’, with the role of Government limited to, ‘addressing
potential barriers’(DTI, 2006). This position was informed, at least in part, by an
assessment of the relative costs of the range of large-scale low-carbon electricity
generating technologies available to the UK (DTI, 2006, Kennedy, 2007), and was
followed by the 2008 White Paper on Nuclear Power (BERR, 2008) which confirmed the
UK Government’s view that, ‘nuclear power has a key role to play as part of the UK’s
energy mix’.
The current UK Government was formed in 2010 from a coalition of the Conservative and
Liberal Democrat parties and its initial position with regards to support for new nuclear
power reflected the divergent positions of the coalition members, with the Conservative
party supportive and the Liberal Democrats opposed (Cabinet Office, 2010). The
resolution to this conflict involved an agreement that Government would support new
nuclear power projects, ‘provided that they receive no public subsidy’ (ibid). Whilst the
position of no public subsidy is still government policy, the on-going Electricity Market
Reform (EMR) process appears likely to offer support for new nuclear power stations
(and other low carbon generation options) through a package of measures including a
Feed-in Tariff (FiT) via a Contract for Difference (CfD) and an underpinning of the price
of CO2 emissions (DECC, 2011a, HM Government, 2012).
Since the change of heart towards nuclear from the mid-2000s onwards, projected costs
for new nuclear plants have risen considerably, as have costs for many other electricity
generation technologies (Greenacre et al., 2010, Heptonstall et al., 2012). That
notwithstanding, as Figure 2 shows, recent cost projections for electricity from nuclear
power in a UK context are up to around £100/MWh, which if realised, puts this
technology towards the lower end of costs for low-carbon generation. These cost
estimates helps to underpin the current UK Government’s commitment to nuclear power
described above.

4
Figure 2: Range of recent estimates for large-scale electricity generation in the UK. Note that these estimates
are for projects starting around the time the sources were published (i.e. they are not forecasts for projects
starting some years into the future). Carbon costs are included where applicable. Sources: (Mott MacDonald,
2010, Mott MacDonald, 2011, Arup, 2011, Parsons Brinckerhoff, 2011)
More recent analysis suggests even lower costs for ‘nth of a kind’ (NOAK) plants built
after the first wave of new generation plants, with the latest projections commissioned
by DECC suggesting a levelised cost for electricity from nuclear plants of around
£65/MWh for a notional NOAK plant with a 2017 project start date (Parsons Brinckerhoff,
2011).
Of course, cost projections for any of the technologies outlined in Figure 2 can turn out
be wrong for a range of reasons including unanticipated changes in commodity prices,
currency movements, supply chain constraints, lack of technological maturity, appraisal
optimism, and changes to the regulatory environment (Greenacre et al., 2010). The
central contention of this paper is that recently published levelised cost estimates for
nuclear new build in the UK may not be fully adjusted to reflect the following market
realities that surround new build nuclear economics:
In the US, European and the UK markets nuclear new build programmes have been
effectively dormant for the past 15 – 20 years.
The pre-construction and construction phases of nuclear plants last around 14 years.
This time frame exposes the nuclear build process to a significant amount of
exogenous pressures that impact final ‘out-turn’ capital costs.
There are no reactors of any generation type that have been built in liberalised
energy markets under commercial terms that the UK new build programme will
operate under.
These factors all increase the uncertainty surrounding new build nuclear capital cost
estimates and, in turn, there has been a wide range of levelised cost estimates for
nuclear power.
This paper therefore examines the potential impact on nuclear cost projections of
adopting different assumptions for key time and cost variables, based on historic and
current observed values. Section 2 explains the approach and methodology for the
analysis, Section 3 summarises the findings from an examination of the history of
nuclear power projects, Section 4 explains the results of applying these historical lessons
0
20
40
60
80
100
120
140
160
180
200
Nuclear Offshore wind Onshore wind CCGT CCGT+CCS Coal Coal+CCS
£/M
Wh
Technology
Upper boundary of estimates
Lower boundary of estimates

5
to current estimates for nuclear power in the UK and Section 5 concludes with
observations on the implications for policymakers.
2. Approach and Methodology
In their series of ‘Projected Costs of Generating Electricity’ reports the International
Energy Agency (IEA) define levelised cost per unit of electricity output (LCOE) as, ‘the
average price that would have to be paid by consumers to repay exactly the
investor/operator for the capital, operation and maintenance and fuel expenses, with a
rate of return equal to the discount rate’ (IEA, 2005). The calculation results in a cost
per unit of output (£/MWh) that has been used by policymakers to understand the
relative costs of different electricity generation technologies.
The results from such cost projections, whatever the technology, depend on the set of
assumptions around variables such as capital cost, construction times, the expected
plant life, operational and maintenance costs, fuel costs, plant availability, load factor
and discount rates (Gross et al., 2010). This paper focuses in particular on the length of
the pre-construction and construction phases and how capital costs can change over
these phases, drawing on evidence from US and European nuclear programmes. It then
compares this experience with assumptions that feed into current UK nuclear cost
estimates and goes on to substitute values based on the observed experience into a
levelised cost model to examine the effect that using these alternative values may have
on the projected costs of nuclear power. Finally it looks at the possible implications for
UK energy policy.
The analysis that underpins this paper uses a LCOE model that calculates cash flows for
each of the phases of the nuclear life-cycle on a real, pre-tax basis, based on a flexible
set of inputs. The model then discounts these cash flows and divides the resultant value
by the discounted energy generated by the plant throughout its lifetime in order to
calculate the levelised cost of generation on a £/MWh basis. In order to maintain
comparability with most other studies, our assumptions and calculations focus on
‘busbar’ costs (i.e. up to where the power station connects to the transmission grid) and
ignores any items such as losses in transmission and distribution or additional system
balancing costs (Gross et al., 2006, Strbac et al., 2012).
3. Findings from analysis of US and European
nuclear programmes
Pre-construction period
The pre-construction phase involves securing operating licenses, reviewing technical
designs, conducting public enquiries, performing site acquisition/preparation and
completing financing negotiations.
Length of the pre-construction period
The World Nuclear Association estimated a global average pre-construction phase of
approximately 3-7 years for nuclear power (World Nuclear Association, 2011a). Based on
an analysis of the applications that are currently before the US Nuclear Regulatory
Commission (NRC), the shortest pre-construction phase is estimated to be around 4-5

6
years. This figure is for the Vogtle 3 & 4 plants which applied to the NRC in March 2008
and received their construction and operating license in February 2012. Twelve further
plants that applied at a similar time have all experienced significant delays and have yet
to begin construction due to the time taken to secure Federal level (e.g. loan
guarantees) and state level (e.g. Construction Work in Progress) subsidies, delays to
reactor design approvals and the challenges inherent in securing project partners (due
primarily to the Fukushima incident in Japan which has increased the uncertainty
surrounding the capital and regulatory environments supporting nuclear new build
programmes).
In the UK the pre-construction phase is estimated to take 4 years (Mott MacDonald,
2011). Currently Hinkley C is the most advanced site which has made positive progress
since 2010; however due to a range of on-going uncertainties in the UK market (e.g.
what companies and what reactor technologies might replace the capacity proposed by
the defunct Horizon Nuclear Power consortium, what will be the final implications of the
Fukushima incident on the approval/licensing process and the regulatory uncertainty
surrounding the UK Government’s Electricity Market Reforms) we suggest that a pre-
construction period of 5-6 years is a reasonable estimate for the first reactor builds. This
figure is consistent with other recent estimates (Deloitte, 2010).
We consider that it is too early to revise current estimates of the associated costs of the
pre-construction phase as the uncertainties identified above could either serve to
increase or decrease the costs associated with this phase in the future.
Cost changes during the pre-construction period
The most recent and relevant case studies relating to how overnight cost estimates can
change during the pre-construction period come from the US due to this market having
similar labour costs, licensing procedures and reactor technologies to the UK. Analysis of
publicly available information on US projects indicates that, on average, overnight
construction cost estimates in the pre-construction phase increased at 14.2% per annum
on a real compounded basis between 2005 and 2011, see Figure 3.

7
Figure 3: Overnight cost escalations in the pre-construction phase of US reactors between 2005 and 2011 (EPR
and AP1000 reactor types only). All costs are expressed in 2011 values using the US CPI to index historic
costs. For the Bell Bend and Callaway plants, where pure overnight cost estimates were not available, we have
reduced quoted construction cost estimates by 23% (the average reduction that was experienced from other
US plants in this analysis). Data sources are diverse and of varying credibility and content, so emphases should
be placed on overall trends in the data, rather than on individual project-level estimates. Source: Authors own
analysis from a range of sources outlined in Appendix 1.
The reasons behind these cost escalations are wide-ranging however, in general, they
stem from the same reasons that lie behind why the majority of plants have experienced
delays in progressing through the pre-construction phase.
Construction period
The construction phase includes the engineering, procurement and construction (EPC) of
reactors, associated infrastructure development, grid connection and first fuelling.
Length of the construction period
Estimated construction times for new reactors have varied primarily due to the type of
reactors being built (for example, between Generation III/Generation III+ and
Generation II designs), how the technical approval process is structured (for example,
whether the design approval is required before construction commences) and who is
making the estimates (utilities, vendors, independent sources or the media). As with
many major infrastructure projects, actual completion times can vary substantially from
initial estimates. The reason why this uncertainty is so crucial to the nuclear industry is
that, due to high levels of capital at risk, for every year a project is delayed the LCOE
increases by approximately 10%.
Figure 4 shows that, since the 1970s, the median global construction time including
reactors constructed in Asia is 7.7 years whilst the median figure excluding Asia is 8.3
years.
£0
£500
£1,000
£1,500
£2,000
£2,500
£3,000
£3,500
£4,000
£4,500
£5,000
2003 2004 2005 2006 2007 2008 2009 2010 2011 2012
£/k
W (£
20
11
)
Year of quote
Overnight cost escalation trend of 15 EPR and AP1000 reactorsin the US (pre-construction phase)
Calvert Cliffs 3 (1*EPR)
Bell Bend (1*EPR)
Bellefonte 3 & 4 (2*AP1000)
Callaway (1*EPR)
Levy County 1 & 2 (2*AP1000)
Vogtle 3 & 4 (2*AP1000)
Turkey 6 & 7 (2*AP1000)
Summer Plant (2*AP1000)
Lee Plant (2*AP1000)
Average compounded costescalation of 14.2% (real) per
annum between 2005 and 2011

8
Figure 4: Construction time of global reactors (construction start to first grid connection). Source: Authors own
analysis using IAEA-PRIS database (IAEA, 2012).
In 2007, the UK Department of Trade and Industry estimated that the construction
phase was likely to last between 5 to 10 years (DTI, 2007a). The two Generation III+
reactors currently being built in France and Finland reflect the higher end estimate with a
currently forecasted construction time of 9 years for Flamanville-3 (originally estimated
to be completed in 6 years) and an unknown construction time for Olkiluoto-3 which was
originally estimated to be completed by 2009 (within 4 years). The reason why the
Olkiluoto-3 plant still has an undetermined construction timeline is that, in July 2012, the
utility responsible for Olkiluoto-3 confirmed that due to slower than expected progress
on key installations, the plant would not be constructed by their revised estimate of
2014 (representing a 9 year construction phase) and is unable to confirm any new
timeline. (Johnstone, 2011, NCE, 2009, Kinnunen, 2012, BBC, 2012).
Of key relevance to the UK new build programme is understanding the impacts that new
reactor technologies and larger reactor sizes have had on construction times. Using US
Department of Energy data, Davis (2011), estimated that due primarily to increase
regulatory requirements in the US, ‘reactors ordered during the 1950s took an average
of about 5 years to build, whereas reactors ordered during the 1970s took on average 14
years’.
Supporting this upward trend, Figure 5 shows the results of analysis by (Grubler, 2009)
of the French reactor history.
-
2.0
4.0
6.0
8.0
10.0
12.0
14.0
16.0
18.0
20.0
0
20
40
60
80
100
120
140
Me
dia
n c
on
stru
ctio
n t
ime
No
. of
reac
tors
un
de
r co
nst
ruct
ion
Global median construction time (years)
Global (ex Asia) median construction time (years)
Global no. of reactors under construction
Global (ex Asia) no. of reactors under construction
Weighted global median construction time (years)
Weighted global (ex Asia) median construction time (years)

9
Figure 5: Construction time of French reactors (construction start to first grid connection). Source: (Grubler,
2009).
Whilst EDF has recently estimated a 5.5 to 6 year construction period for the Hinkley
point plant (EDF, 2011b), for the analysis in Section 4 we have used an estimate of 7 to
8 years, based on the global median construction time of 7.7 years. We consider this
estimate (which is based on data from 381 reactors over the period 1976-2010) to be
relatively conservative taking into account that the average construction times for
reactors built outside of Asian markets has increased from an median of 9.3 years for
the 1991-1995 period to 15.3 years for the 1996-2010 period, and that the last five
completed French reactors have taken more than 8 years to be constructed.
Cost changes during the construction period
US history
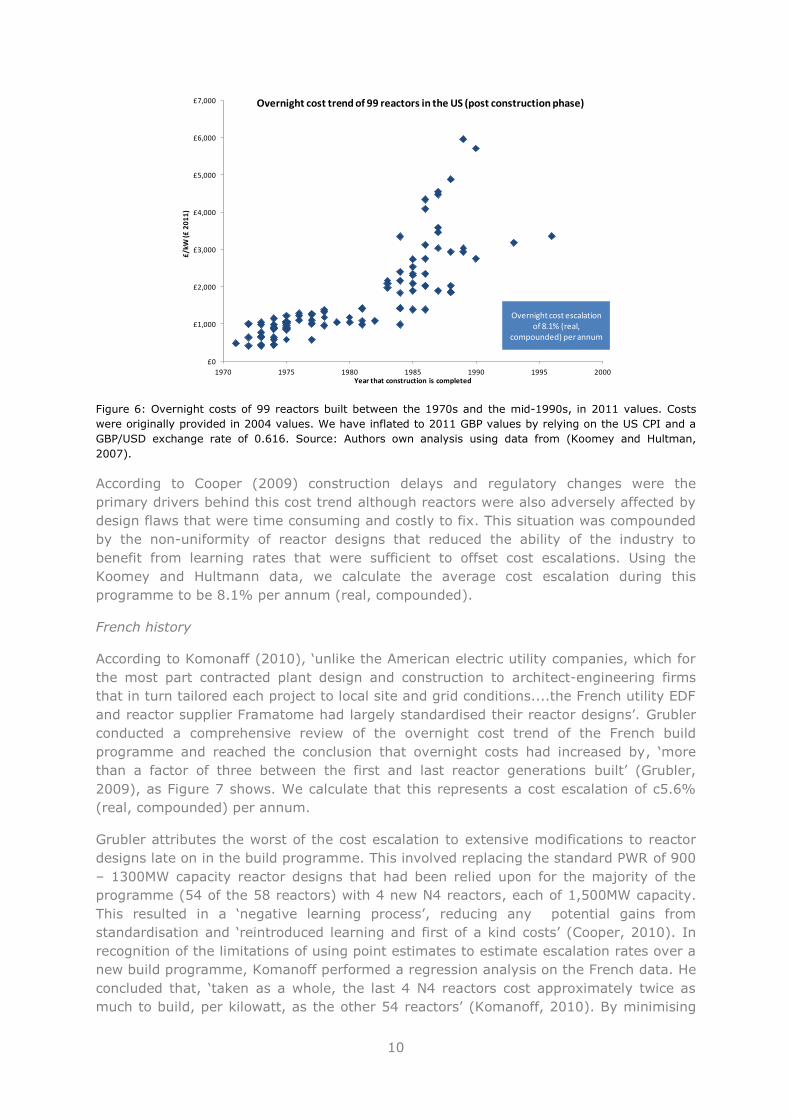
Based on data from Koomey and Hultmann (2007), Figure 6 shows the post-construction
overnight costs of 99 reactors that were built in the United States between the 1970s
and the mid-1990s.
Projection for the new 1650 MW EPR reactor
Flamanville-3 submitted by the French
authorities to the IAEA (Grubler, 2009)
10
Figure 6: Overnight costs of 99 reactors built between the 1970s and the mid-1990s, in 2011 values. Costs
were originally provided in 2004 values. We have inflated to 2011 GBP values by relying on the US CPI and a
GBP/USD exchange rate of 0.616. Source: Authors own analysis using data from (Koomey and Hultman,
2007).
According to Cooper (2009) construction delays and regulatory changes were the
primary drivers behind this cost trend although reactors were also adversely affected by
design flaws that were time consuming and costly to fix. This situation was compounded
by the non-uniformity of reactor designs that reduced the ability of the industry to
benefit from learning rates that were sufficient to offset cost escalations. Using the
Koomey and Hultmann data, we calculate the average cost escalation during this
programme to be 8.1% per annum (real, compounded).
French history
According to Komonaff (2010), ‘unlike the American electric utility companies, which for
the most part contracted plant design and construction to architect-engineering firms
that in turn tailored each project to local site and grid conditions....the French utility EDF
and reactor supplier Framatome had largely standardised their reactor designs’. Grubler
conducted a comprehensive review of the overnight cost trend of the French build
programme and reached the conclusion that overnight costs had increased by, ‘more
than a factor of three between the first and last reactor generations built’ (Grubler,
2009), as Figure 7 shows. We calculate that this represents a cost escalation of c5.6%
(real, compounded) per annum.
Grubler attributes the worst of the cost escalation to extensive modifications to reactor
designs late on in the build programme. This involved replacing the standard PWR of 900
– 1300MW capacity reactor designs that had been relied upon for the majority of the
programme (54 of the 58 reactors) with 4 new N4 reactors, each of 1,500MW capacity.
This resulted in a ‘negative learning process’, reducing any potential gains from
standardisation and ‘reintroduced learning and first of a kind costs’ (Cooper, 2010). In
recognition of the limitations of using point estimates to estimate escalation rates over a
new build programme, Komanoff performed a regression analysis on the French data. He
concluded that, ‘taken as a whole, the last 4 N4 reactors cost approximately twice as
much to build, per kilowatt, as the other 54 reactors’ (Komanoff, 2010). By minimising
£0
£1,000
£2,000
£3,000
£4,000
£5,000
£6,000
£7,000
1970 1975 1980 1985 1990 1995 2000
£/k
W (£
20
11
)
Year that construction is completed
Overnight cost trend of 99 reactors in the US (post construction phase)
Overnight cost escalation of 8.1% (real,
compounded) per annum

11
the impacts of the last 4 reactors, Komanoff calculated a lower cost escalation rate of
3.6% (real, compounded) per annum for the French build programme.
Figure 7: Overnight costs of PWR reactors in France. Source:(Komanoff, 2010).
Adjusting US and European cost estimates to reflect observed costs escalations
Table 1 summarises the most recent overnight costs estimates of EPR and AP1000
reactors in the US and European markets.
Table 1: Most recent overnight cost estimates for EPR & AP1000 reactors. All costs are expressed in 2011
values using the US CPI to index historic costs and using a GBP/ USD exchange rate of 0.616. Flamanville-3
quoted overnight costs do not include fuel so we have added fuel costs based on a 24 month fuel cycle as per
EPR technical specifications. Olkiluoto 3 construction cost include financing costs so we have reduced this
estimate by 9% (due to the low interest rate of 2.6% obtained for 60% of the debt portion, interest during
construcion is significantly lower than US plants). The Flamanville quote was provided in 2011. The Olkiluoto
quote was provided in 2009 so we have expressed this quote in 2011 values using Finnish CPI data. We have
used a GBP/ EUR exchange rate of 0.882. Source: Authors own analysis using various sources outlined in
Appendix 1 and (BankTrack, 2011, IEER, 2011, World Nuclear Association, 2011b, Thomas, 2010, Hollinger,
2010).
In order to place these recent estimates in their historical context, Figure 8 combines
data from Table 1 and the Koomey and Hultman data set (Figure 6).
Site Reactor type Phase Overnight cost £/kW
(£ 2011)
Turkey 6 & 7 2*AP1000 Pre-construction £2,635
Bellefonte 3 & 4 2* AP1000 Pre-construction £2,347
Callaway 1*EPR Pre-construction £2,874
Summer Plant 2*AP1000 Pre-construction £2,843
Lee Plant 2*AP1000 Pre-construction £3,226
Vogtle 3 & 4 2*AP1000 Pre-construction £3,249
Calvert Cliffs 3 1*EPR Pre-construction £3,606
Levy County 1 & 2 2*AP1000 Pre-construction £3,257
Bell Bend 1*EPR Pre-construction £4,351
Flamanville-3 1*EPR Construction £3,527
Olkiluoto-3 1*EPR Construction £3,131

12
Figure 8: Most recent overnight cost estimates for EPR and AP1000 reactors. Source: (Koomey and Hultman,
2007), and authors analysis using various sources outlined in Appendix 1, and (BankTrack, 2011, IEER, 2011,
World Nuclear Association, 2011b, Thomas, 2010, Hollinger, 2010).
It is important to note that the recent utility estimates are not directly comparable with
the historical data set as the recent estimates are for reactors that are yet to be
constructed and it will be several years before the final costs of these rectors will be
known.
To aid in the estimation of this final cost, cost escalation rates have historically been
applied by utilities and market analysts to initial capital cost estimates provided at the
bidding stage. As Table 2 shows, there is a wide range of cost escalation rates that could
plausibly be used for this process and so a decision must be taken as to which rate to
use in the face of considerable uncertainty. For example, the drawback from simply
relying upon the IHS/CERA power capital cost indices for an appropriate escalation rate
is that these indices rely only on the price trends of the key components of nuclear
reactors and ignore some of the major reasons behind nuclear cost escalations (for
example, regulatory delays, technical design requirements, safety requirements,
incorrect materials being used and human errors). This is the reason why the range of
the indices (between 4.4% and 5.2%) is so much narrower than the range of actual
reactor cost escalations during the same period (9.9% to 16.4%, taken from Table 2).
£0
£1,000
£2,000
£3,000
£4,000
£5,000
£6,000
£7,000
1970 1980 1990 2000 2010 2020 2030
£/k
W (£
20
11
)
Year of cost estimate
Average US and European
utility cost estimate:£3,238/kW
Utility estimates (Construction phase)
Historical US reactors (Post construction phase)
Utility estimates (Pre-construction phase)

13
Table 2: Examples of approaches that could be used to model potential cost escalations during the pre-
construction and construction phases of a new nuclear build programme. Inflation rates for EPCCI rely on the
Eurozone CPI data. The PCCI, US, France, Finland and Bulgaria build programme uses respective national CPI
data. Source: Authors own analysis, (Koomey and Hultman, 2007, IHS, 2011)
Given this uncertainty we have taken a conservative approach and use an annual
escalation rate of 5.4% for the analysis presented in Section 4. This 5.4% represents the
weighted average real escalation rate of the 58 reactors in the French build programme
between the 1970s and 1990s, the 99 reactors in the US new build programme between
the 1970s and 1990s and the IHS/Cambridge Energy Research Associates (CERA)
European Power Capital Cost index. Note that for this analysis, the IHS/CERA index was
assigned a weight equal to the combined weight of the French and US escalation rates.
Due to the costs escalations being more recent, involving only EPR and AP1000 reactor
designs and, in the case of the US reactors, drawn from projects that are at the same
stage as the UK new build programme, there is an argument that the escalation rate
associated with the plants in the pre-construction phase in the US (14.2%) and the
European reactors currently in the construction phase (11.1%) are more relevant to the
UK new build programme. The reason why we have not included these recent estimates
in our analysis is that we would prefer to use ‘out-turn’ escalation rates from reactors
that have completed the construction phase to inform our estimate.
Without having access to the commercial terms of the majority of the quoted overnight
costs it is impossible to estimate what escalation rates have been included in quoted
numbers or, if they have been included, to analyse their appropriateness. Based on the
information available from the sources in Appendix 1, the Bell Bend, Summer, Turkey,
Levy and Vogtle plant quotes have indicated that escalation rates have been included in
their overall construction cost estimates. The Levy and Vogtle plants have specified that
Source of cost escalation
Cost escalation: Real
(compounded per
annum)
4.4%
5.2%
3.6%
8.1%
9.9%
12.2%
13.7%
16.4%
14.2%
15.7%Escalation rate of 19 reactors currently in the pre-construction phase in
the US (all reactor types) (2005 - 2011)
Escalation rate of IHS CERA European Power Capital Costs Index (EPCCI),
including nuclear (2000 - 1HY 2011)
Escalation rate of Olkiluoto-3 (1 reactor, 2004 - 2009)
Escalation rate of IHS CERA US Power Capital Costs Index (PCCI), including
nuclear (2000 - 1HY 2011)
Escalation rate US build programme (50 reactors, 1980 - 1990)
Escalation rate of total US build programme (99 reactors, 1970s - 1990s)
Escalation rate of Flamanville-3 (1 reactor, 2006 - 2011 )
Escalation rate of European reactors currently in the pre-construction
(Belene) and construction (Olkiluoto and Flamanville) phases (3 reactors,
2004 - 2011)
Escalation rate of 15 reactors currently in the pre-construction phase in
the US (EPR & AP1000 reactors only) (2005 - 2011)
Escalation rate of total French build programme (58 reactors, 1970s -
1990s)

14
a 2% and 2.5% (respectively) escalation rate has been included in their overall
construction cost estimates. Although the Levy plant specifies that this is a real
escalation rate, there is little information as to whether the Vogtle plant is applying this
on a real or nominal rate basis and what proportion of the total construction cost is
subject to this escalation rate. To remain conservative we have assumed that this is
provided on a real basis and applied to 100% of the overnight costs. We have therefore
applied a 3.2% cost escalation rate to the overnight costs estimates of these 9 reactors.
Figure 9 builds on Figure 8 to show the impact of applying the 5.4% real escalation rate
(or the 3.2% rate where applicable) to the current EPR and AP1000 reactor estimates in
the US and Europe through to the end of the construction phase. Applying the escalation
rate increases the average cost estimate from £3,238/kW to £4,613/kW.
Figure 9: Impact of applying a real 5.4% escalation rate to current US, Canadian and European reactors. The
escalated overnight costs are plotted against a notional completion year for each project shown in Table 1. For
the US plants, we have estimated potential construction dates based on the current status of the reactors. We
have assumed the Flamanville 3 reactor will be operational by 2016 and the Olkiluoto 3 plant will become
operational in 2015. Source: Authors own analysis.
Adjusting UK cost estimates to reflect observed costs escalations
In December 2010, the EDF-led consortium was reported to have estimated costs of
‘more than’ £9bn ($13.9bn) for building two 1600MW EPR reactors in the UK (Hollinger,
2010). It has recently been reported that this cost has subsequently escalated to £14bn
(The Times, 2012). Since this latter estimate has not been confirmed our analysis uses
the December 2010 estimate. Since it is not clear what this cost includes (for example,
whether this is the full capital cost of the plants including financing charges and interest
during construction or if escalation rates are included) we have modelled four sets of
assumptions to determine which sets give the best fit with the post-escalation estimates
shown in Figure 9. Each set of assumptions and the resultant overnight cost is described
in Table 3 below.
£0
£1,000
£2,000
£3,000
£4,000
£5,000
£6,000
£7,000
£8,000
£9,000
1970 1980 1990 2000 2010 2020 2030
£/k
W (£
20
11
)
Year construction is completed
Average US and European
utility cost estimate: £4,613/kW
Utility estimates (Construction phase)
Historical US reactors (Post construction phase)
Utility estimates (Pre-construction phase)
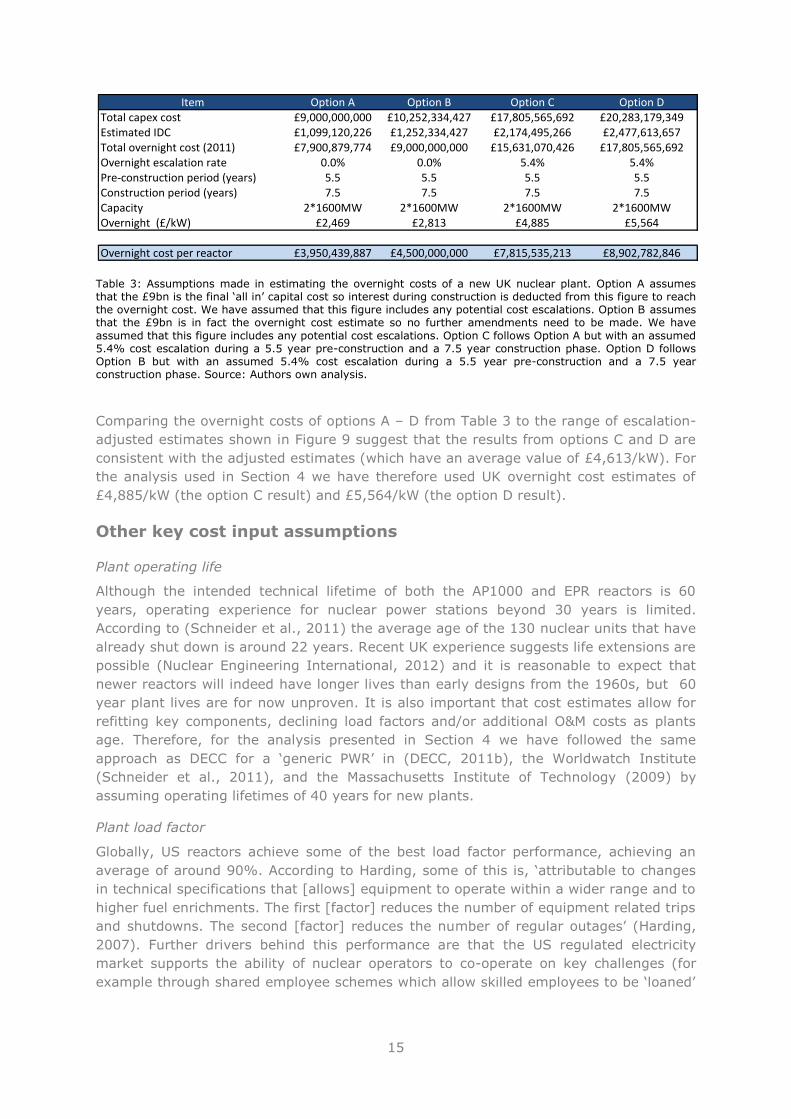
15
Table 3: Assumptions made in estimating the overnight costs of a new UK nuclear plant. Option A assumes that the £9bn is the final ‘all in’ capital cost so interest during construction is deducted from this figure to reach the overnight cost. We have assumed that this figure includes any potential cost escalations. Option B assumes that the £9bn is in fact the overnight cost estimate so no further amendments need to be made. We have
assumed that this figure includes any potential cost escalations. Option C follows Option A but with an assumed 5.4% cost escalation during a 5.5 year pre-construction and a 7.5 year construction phase. Option D follows Option B but with an assumed 5.4% cost escalation during a 5.5 year pre-construction and a 7.5 year construction phase. Source: Authors own analysis.
Comparing the overnight costs of options A – D from Table 3 to the range of escalation-
adjusted estimates shown in Figure 9 suggest that the results from options C and D are
consistent with the adjusted estimates (which have an average value of £4,613/kW). For
the analysis used in Section 4 we have therefore used UK overnight cost estimates of
£4,885/kW (the option C result) and £5,564/kW (the option D result).
Other key cost input assumptions
Plant operating life
Although the intended technical lifetime of both the AP1000 and EPR reactors is 60
years, operating experience for nuclear power stations beyond 30 years is limited.
According to (Schneider et al., 2011) the average age of the 130 nuclear units that have
already shut down is around 22 years. Recent UK experience suggests life extensions are
possible (Nuclear Engineering International, 2012) and it is reasonable to expect that
newer reactors will indeed have longer lives than early designs from the 1960s, but 60
year plant lives are for now unproven. It is also important that cost estimates allow for
refitting key components, declining load factors and/or additional O&M costs as plants
age. Therefore, for the analysis presented in Section 4 we have followed the same
approach as DECC for a ‘generic PWR’ in (DECC, 2011b), the Worldwatch Institute
(Schneider et al., 2011), and the Massachusetts Institute of Technology (2009) by
assuming operating lifetimes of 40 years for new plants.
Plant load factor
Globally, US reactors achieve some of the best load factor performance, achieving an
average of around 90%. According to Harding, some of this is, ‘attributable to changes
in technical specifications that [allows] equipment to operate within a wider range and to
higher fuel enrichments. The first [factor] reduces the number of equipment related trips
and shutdowns. The second [factor] reduces the number of regular outages’ (Harding,
2007). Further drivers behind this performance are that the US regulated electricity
market supports the ability of nuclear operators to co-operate on key challenges (for
example through shared employee schemes which allow skilled employees to be ‘loaned’
Item Option A Option B Option C Option DTotal capex cost £9,000,000,000 £10,252,334,427 £17,805,565,692 £20,283,179,349Estimated IDC £1,099,120,226 £1,252,334,427 £2,174,495,266 £2,477,613,657Total overnight cost (2011) £7,900,879,774 £9,000,000,000 £15,631,070,426 £17,805,565,692Overnight escalation rate 0.0% 0.0% 5.4% 5.4%Pre-construction period (years) 5.5 5.5 5.5 5.5Construction period (years) 7.5 7.5 7.5 7.5Capacity 2*1600MW 2*1600MW 2*1600MW 2*1600MWOvernight (£/kW) £2,469 £2,813 £4,885 £5,564
Overnight cost per reactor £3,950,439,887 £4,500,000,000 £7,815,535,213 £8,902,782,846

16
from one plant to another) and that the US nuclear industry is able to benefit from
around 900 reactor years of experience.
According to the EPRs Generic Design Assessment (GDA) submission the EPR reactor has
a target availability of 90% (EDF, 2009). As reactors of this design have not been
constructed yet it is impossible to empirically test this figure against actual operational
performance, and it is our view that it would be optimistic to take this technical potential
as certain. Based on Citibank and HSBC estimates there is approximately a 5%
difference between availability and load factors that EDF have reported for their operated
plants with an average load factor of 76%. The last 7 years of load factor performance
for EDF is summarised in Table 4.
Table 4: Overview of EDF average load factor performance versus plant availability. Sources: (HSBC, 2010,
Citigroup, 2009)
We recognise that French nuclear load factors can be affected by the partial load
following role that nuclear performs in the French energy market, however it appears
reasonable to rely upon EDF’s actual operating experience. Therefore, our assumption
for the analysis in Section 4 is that reactors will have an average load factor of between
76% and 85%, with the higher figure calculated by subtracting the difference between
load factors and availability factors found in Table 4 (5%) from the target load factor for
the UK new build programme (90%). This range is backed up by a study (Thomas et al.,
2007) which found that only the top 100 out of the 414 plants which had been operating
for at least one year had a lifetime load factor of more than 80% (compared to the mid-
point of 80.5% in our range). Interestingly, that study also suggested, after analysing
the characteristics of the top 13 plants, that performance was not due to what reactor
technology was being used but rather determined by the skills of the operators and
management experience.
Plant operation and maintenance costs
For the analysis in Section 4 we will rely upon the figures from the Mott Macdonald 2010
work commissioned by DECC, shown in Table 5, with two revisions. The first is to
remove the £2.1/MWh that Mott Macdonald use for on-site waste and decommissioning
costs, and use the cost confirmed by the UK Government in early 2011 (DECC, 2010a).
This has a very marginal impact of increasing the costs to £2.4/MWh. The second
amendment is to add the costs associated with the price cap on long term disposal of
waste, estimated to be c£0.45/MWh (ibid) because we believe that owners of nuclear
plant will have a preference for incurring a fixed cost per unit of output to limit their
exposure to the uncertainty surrounding potential future waste disposal costs.
EDF load factors 2004 2005 2006 2007 2008 2009 2010 (HY)
Load Factor (LF) 77% 78% 77% 76% 76% 71% 78%
Availability Factor (AF) 83% 83% 84% 80% 79%
Δ AF - LF 6% 6% 6% 5% 4%
Average Load Factor 76%
Average Δ AF - LF 5%

17
Table 5: Mott Macdonald estimates for total variable and fixed operating costs. Source:(Mott MacDonald, 2010). These costs are provided in real terms and yield a total O&M cost of around £8.5/MWh which is close to the estimates by the (World Energy Council, 2007) of around £10.1/MWh, broken down as £6.6/MWh for O&M and £3.5/MWh for fuel costs. (Severance, 2009) also has a similar overall O&M cost of £9.2MWh.
Financing costs and structures
The high capital cost of nuclear plants means that their overall economics, and the
feasibility of their financing, depend greatly on the cost of that capital, and more
accurately the Weighted Average Cost of Capital (WACC), which is essentially the
weighted sum of the interest rate on loans and the rate of return on equity investment
(Gross et al., 2010, NEA, 2010).
One of the biggest challenges in estimating what WACC will be appropriate for the new
build programme is that there is more than one consortium bidding for the work and
each consortium is made up of companies that will follow different routes in order to
access the UK market. For example, there is uncertainty surrounding what role Export
Credit Agreements (ECAs) will play. Based on past experience, it seems likely that non-
UK governments, through ECAs, will expand the pool of capital available to UK nuclear
projects, and with favourable terms (Koplow, 2011). In 2001 for example, of the 25
reactors that were under construction throughout the world 14 were part funded by an
ECA from a G8 country. This support can take the form of direct credits or financing,
refinancing, interest-rate support (where the government supports a fixed interest-rate
for the life of the credit), aid financing (credits and grants), export credit insurance and
guarantees. Examples include the Compagnie Française d'Assurance pour le Commerce
Extérieur (Coface) €0.6 billion export credit guarantee to the Olkiluoto project, repayable
over 17 years, allowing the project to re-finance approximately 30% of the project debt
portion (€2.4 billion). Coface has also been involved with the recent EPR reactors being
built in Taishan, China, providing a €1.5 billion guarantee to Areva NP (BNP Paribas,
2004, OECD, 2011, EC, 2011).
The detailed terms associated with these agreements are not publicly available so the
associated impact on the WACC is difficult to confirm. However, to provide an indication
of the possible impact, if 30% of the debt for a project is able to be financed via an ECA,
at around 3.6% (BNP Paribas, 2004) this would be sufficient to reduce an estimated cost
of debt from 5.0% to 4.6%. Due to this lower cost of debt, developers could potentially
increase project gearing to 55:45 or 60:40 if we assume a 50:50 debt to equity ratio is
the baseline (Du and Parson, 2009, Lekander et al., 2011, MIT, 2009). This would in turn
reduce the WACC from approximately 13% to approximately 12% (or approximately
11% if 60:40 debt to equity ratio is used). As we discuss in Section 4, due to high levels
of capital at risk and lengthy construction times, relatively small percentage changes in
WACC result in significant changes to the levelised costs of nuclear power.
Operating costs unit FOAK NOAK
O&M fixed £/MW/yr 50,000 37,500
£m/yr 80 60
O&M variable £/MWh 2 1.8
£m/yr 21.8 20.1
Total O&M costs £m/yr 101.8 80.1
Insurance £/MW/yr 22,000 18,000
£m/yr 35.2 28.8
Connection and UoS charges £/MW/yr 6,000 6,000
£m/yr 9.6 9.6
Total variable + fixed operating costs £m/yr 146.6 118.5

18
In February 2011, Citigroup stated that EDF Energy had confirmed that it would build
new nuclear plants in the UK based on a 10% post-tax, nominal cost of capital (E&CCC,
2011). Supporting this view, in September 2010 HSBC estimated EDF’s overall post tax,
nominal WACC to be approximately 6.4% (HSBC, 2010), a view supported by Morgan
Stanley in January 2011 (Turpin and Lee, 2011), and financial statements ending 30 July
2011 stated that EDF will, ‘invest in projects that create value at 300 basis points (i.e.
3%) above the weighted average cost of capital’ (EDF, 2011a).
It is of course possible that this WACC estimate for EDF is not representative of the
wider market, so we have also assessed more general estimates for the nuclear
programme in the UK. Taking the measures outlined in the UK Government’s December
2010 White Paper consultation on Electricity Market Reform (DECC, 2010b) into account,
in April 2011 Oxera Consulting prepared a report (Oxera, 2011) for the UK Committee on
Climate Change that looked specifically at the cost of capital required for the UK’s new
nuclear build programme by conducting a survey of market participants to ascertain
expected rates of return. This survey produced a range of between 9% and 13% (pre-
tax, real). Providing support for figures towards the mid-point of this range is the
estimate provided by Areva, whose view in March 2010 was that liberalised markets
would require a 11% (pre-tax, real) WACC (Gautrot, 2010). By way of comparison,
Citigroup’s July 2011 view was that some companies would be, ‘looking at a project cost
of capital of at least 15 per cent’ (Chestney, 2011).
Taking these findings into account, it appears that 11% is a reasonable starting point for
the analysis presented in Section 4.
4. Implications for the UK nuclear cost
estimates
The assumptions used for key variables in the levelised cost model, drawn from the
observed experience discussed in Section 3, are summarised in Table 6 below together
with the resultant LCOE. It is important to note that, due the high level of uncertainty
surrounding new nuclear economics, that there is a wide range of estimates for LCOE
even amongst relatively recent figures, ranging from around £40/MWh (DTI, 2007b,
World Energy Council, 2007), gradually increasing to £56/MWh (Du and Parson, 2009),
to £81/MWh (Lazard, 2008) and £95/MWh (Mott MacDonald, 2010).
Drawing upon the observed historical cost trends, recent overnight cost estimates, likely
financing costs for UK new build reactors, and the other assumptions that we identify in
Section 3, our calculations suggest that the levelised cost of nuclear generation in the UK
could potentially be between £164/MWh (in our Scenario 1) and £175/MWh (in our
Scenario 2), well above even the higher figures in recent market estimates.

19
Table 6: Levelised cost of electricity results. Source: Authors own analysis.
The right hand bar of Figure 10 shows that the main driver for this is the application of
the 5.4% escalation rate to current utility overnight cost estimates. The remaining five
bars of Figure 10 show the impact of each of the other assumptions of our Scenario 1
before the application of a 5.4% escalation rate, with the decrease in plant operating life
having the least impact and the increase in the cost of capital having the second greatest
impact after the overnight cost escalation rate.
Major Assumptions
Market
Technical Assumptions
Pre construction (years)
Construction time (years)
Operating period (years)
Power output (MW)
Plant efficiency (%)
Load factor (%)
Aux load (%)
Financing Assumptions
Debt : Equity
WACC
Inflation rate
Tax rate
Cost assumptions
Pre-construction cost (£/kW)
Overnight cost (£/kW)
Levelised cost breakdown
Levelised cost
(£/MWh)
% of total Levelised cost
(£/MWh)
% of total
Capital cost £144 87.8% £155 88.6%
Fixed O&M £12 7.1% £12 6.6%
Variable O&M £2 1.2% £2 1.1%
Fuel cost £3 2.1% £3 1.9%
Decommissioning / waste storage £2 1.5% £2 1.4%
Long term storage £0 0.3% £0 0.3%
Total £164 £175
£4,885 £5,564
Scenario 1 (2011) Scenario 2 (2011)
2.2% 2.2%
30% 30%
£197 £203
5.00% 5.00%
50:50 60:40
11.00% 11.00%
8 7
40 40
1600 1600
35% 35%
80.5% 80.5%
Scenario 1 (2011) Scenario 2 (2011)
UK UK
6 5

20
Figure 10: Levelised cost estimates for nuclear power, assuming 2013 project start. Source: (Mott MacDonald,
2010), authors own analysis.
Levelised costs are extremely sensitive to input assumptions (Heptonstall, 2007) so,
using our Scenario 1 as a baseline, Figure 11 shows the sensitivity of our results to
variations of the key input assumptions of overnight cost, length of construction period,
operating life of the plant and WACC.
Because the levelised cost calculation attributes proportionally greater value to costs and
output that occur closer to the calculation start year, reducing plant operating lifetime
has a greater (negative) impact on levelised costs then increasing plant operating
lifetime by the same quantum. Somewhat counter-intuitively, any increase in the
construction phase timeline results in lower total (discounted) costs because the impact
of discounting the cost stream by a further year offsets the increase in interest costs and
commitment fees that result from an extended construction timeline. However, because
the generating phase is also delayed, the impact of discounting the power output by a
further year more than offsets this cost reduction, resulting in an increase in the overall
levelised cost.
Figure 11: Levelised cost sensitivities using our Scenario 1 as the baseline. Source: Authors own analysis.
£0
£20
£40
£60
£80
£100
£120
£140
£160
Nuclear - PWR (current
UK new build estimate)
Increase construction
phase from 6 to 8 years
Decrease operating phase
from 60 to 40 years
Decrease load factor from 90%
to 80.5%
Increase WACC from 10% to 11%
Escalate overnight costs
@ 5.4%
£/MWhLevelised cost of energy (£/MWh) in 2013
Long term waste disposalCO2 Transport and storageDecommissioning / waste storageCarbon Costs
Fuel cost
Variable O&M
Fixed O&M
Capital cost
£164
£102 £104£110
£123
£95
~1.5% overnight escalation rate applied
Scenario 1
Overnight cost Δ in overnight cost -25% (£3,727) -20% (£3,975) -15% (£4,224) -10% (£4,472) -5% (£4,720) 0% (£4,969) 5% (£5,217) 10% (£5,466) 15% (£5,714) 20% (£5,963) 25% (£6,211)
Levelised Cost £132 £139 £146 £153 £159 £164 £173 £180 £187 £193 £200
Δ in Levelised Cost -20% -15% -11% -7% -3% 0% 5% 10% 14% 18% 22%
Construction timeline Δ in construction time -4 (4) -3 (5) -2 (6) -1 (7) 8 +1 (9) +2 (10) +3 (11) +4 (12)
Levelised Cost £130 £137 £147 £159 £164 £181 £193 £211 £231
Δ in Levelised Cost -21% -16% -10% -3% 0% 10% 18% 29% 41%
Operating timeline Δ in operating time -20 (20) -15 (25) -10 (30) -5 (35) 40 +5 (45) +10 (50) +15 (55) +20 (60)
Levelised Cost £188 £177 £172 £168 £164 £165 £164 £163 £163
Δ in Levelised Cost 15% 8% 5% 2% 0% 1% 0% -1% -1%
WACC / Hurdle rate Δ in WACC 6% 7% 8% 9% 10% 11% 12% 13% 14% 15% 16%
Levelised Cost £90 £102 £116 £131 £148 £164 £186 £208 £231 £256 £284
Δ in Levelised Cost -45% -38% -29% -20% -10% 0% 13% 27% 41% 56% 73%

21
5. Conclusions and implications for policy
The UK Government believes that nuclear power can play a key role in reducing CO2
emissions and maintaining security of supplies (DECC, 2011a). Government policy has
been informed by cost estimates that suggest that electricity from new nuclear power
stations will be competitive with alternative low carbon generation options. Indeed,
recent estimates suggest that the levelised cost of nuclear power are towards the lower
end of the range of low carbon generation alternatives, with some analyses projecting
even lower costs for so-called ‘nth of a kind’ (NOAK) plants built after the first wave of
new generation plants.
However the evidence and analysis presented in this paper suggests that the capital cost
estimates for nuclear power that are being used to inform these projections rely on costs
escalating over the pre-construction and construction phase of the new build programme
at a level significantly below those that have been experienced by past US and European
programmes. Importantly, the evidence suggests that construction costs in real terms
have often increased relative to expectations, and there is no evidence of a consistent
declining cost trend during any period over the last past 40 years in the US, France and
Europe. The notion (based on technology learning rates) that costs could decline for
reactors being constructed as early as 2017 would therefore appear to be inconsistent
with the historical evidence reviewed above.
Indeed, the empirical evidence reviewed in this paper suggests that the capital costs of
nuclear power may be substantially higher, and construction periods longer, than
anticipated, and that the resultant effect on levelised cost estimates could be dramatic,
with our analysis suggesting that it is possible that costs may turn out to be over £160
MWh. Recent academic estimates (Mitchell, 2012), and indications from industry
(Gosden, 2012, Clark, 2012) suggest that costs may indeed approach this level.
The UK Government is currently considering the level of support that will be available
through the proposed CfD FiT. Whilst at the time of writing the level of support has yet
to be agreed, it will be interesting to compare the results of our analysis with the
outcome of this process and the government’s negotiations with nuclear developers.
Clearly it is possible to take a different view on the potential for cost escalations but the
analysis presented above has sought to be conservative with regards to cost escalation
during the pre-construction and construction phases. There is evidence to suggest that
some nuclear build programmes have experienced escalation rate well above the 5.4%
used in this paper. What is clear is that levelised costs for nuclear power will be
extremely high if UK projects experience the higher end of the cost escalation rates
recently encountered elsewhere.
It is possible that nuclear project developers will take a more optimistic view on the
potential for cost escalation and chose to take projects forward with a lower level of
support. In doing so, they would be bearing the risk of cost escalations unless they
believe that there may be a possibility in future to seek additional support if costs do
rise. Another possible outcome is that it proves impossible for Government and project
developers to agree on the support level required, and so new nuclear projects will not
go ahead, leaving the UK with the challenge of how to achieve its energy policy
objectives without any additional contribution from nuclear power.

22
References
Arup 2011. Review of the generation costs and deployment potential of renewable electricity technologies in the UK. Study Report for DECC, Department of Energy and Climate Change, London.
BankTrack. 2011. Organisation website [Online]. Nijmegen, Netherlands Available: http://www.banktrack.org/show/pages/about_banktrack [Accessed April 2011].
BBC. 2012. Finland's Olkiluoto 3 nuclear plant delayed again [Online]. Available: http://www.bbc.co.uk/news/world-europe-18862422 [Accessed July 2012].
BERR 2008. Meeting the Energy Challenge, A White Paper on Nuclear Power. Department for Business, Enterprise & Regulatory Reform, London.
BNP Paribas. 2004. Financing of Nuclear Projects - Lessons from a recent Experience [Online]. BNP Paribas. Bulgaria Available: http://www.iaea.org/inis/collection/NCLCollectionStore/ [Accessed 15/8/11].
Cabinet Office 2010. The Coalition: our programme for government. HM Government, London.
Chestney, N. 2011. UK nuclear investment environment "dire"- Citigroup [Online]. Reuters. Available: http://www.reuters.com/article/2011/07/06/us-nuclear-citigroup-idUSTRE76548820110706 [Accessed 24/08/2011].
Citigroup 2009. New Nuclear – The Economics Say No. Citigroup Global Markets, London.
Clark, P. 2012. Nuclear ‘hard to justify’, says GE chief [Online]. FT. London Available: http://www.ft.com/cms/s/0/60189878-d982-11e1-8529-00144feab49a.html#axzz226TRNSsc [Accessed 30/7/12].
Cooper, M. 2009. The Economics of Nuclear Reactors: Renaissance or Relapse? Vermont Law School.
Cooper, M. 2010. Policy Challenges of Nuclear Reactor Construction, Cost escalation and Crowding Out Alternatives. Vermont Law School.
Davis, L. 2011. Prospects for nuclear power. National Bureau of Economic Research, Massachusetts.
DECC 2010a. Consultation on a methodology to determine a fixed unit price for waste disposal and updated cost estimates for nuclear decommissioning, waste management and waste disposal. Department of Energy and Climate Change, London.
DECC 2010b. Electricity Market Reform Consultation Document. Department of Energy and Climate Change, London.
DECC 2011a. Planning our electric future: a White Paper for secure, affordable and low-carbon electricity. Department of Energy and Climate Change, London.
DECC 2011b. Waste Transfer Pricing Methodology for the disposal of higher activity waste from new nuclear power stations. Department of Energy and Climate Change, London.
Deloitte 2010. Nuclear renaissance and the global supply chain. Deloitte Center for Energy Solutions, Houston, Texas.
DTI 2006. The Energy Challenge (Energy Review). Department of Trade and Industry, London.
DTI 2007a. Cost Benefit Analysis of Nuclear Power. Department of Trade and Industry, London.
DTI 2007b. Meeting the Energy Challenge. A White Paper on Energy. Department of Trade and Industry, London.

23
Du, Y. & Parson, J. 2009. Update on the Cost of Nuclear Power. MIT Center for Energy and Environmental Policy Research, Massachusetts.
E&CCC 2011. Minutes of evidence taken before the energy and climate change committee: Electricity Market Reform. House of Commons Energy and Climate Change Committee, London.
EC. 2011. Trade Topics: Export credits [Online]. European Commission. Available: http://ec.europa.eu/trade/creating-opportunities/trade-topics/export-credits/ [Accessed 15/8/11].
EDF. 2009. Overview of the UK EPR GDA Submission [Online]. Available: http://www.epr-reactor.co.uk/ssmod/liblocal/docs/overview/Overview%20of%20the%20UK%20EPR.pdf [Accessed 09/08/2011].
EDF. 2011a. 2011 First half year results [Online]. Available: http://shareholders-and-investors.edf.com/fichiers/fckeditor/Commun/Finance/Publications/Annee/2011/H12011/H12011EDFGroupResultats_transcript_va.pdf [Accessed 30/07/2011].
EDF. 2011b. Draft overview of HPC Construction [Online]. EDF Energy. Available: http://hinkleypoint.edfenergyconsultation.info/websitefiles/Overview-of-HPC-Construction-FINAL.pdf [Accessed 19/07/2011].
Gautrot, J. Costs factors of nuclear electricity, Areva. Sharing Knowledge across the Mediterranean, 2010 Jordan.
Gosden, E. 2012. EDF chief Vincent de Rivaz's nuclear vision aims to inspire a generation [Online]. The Telegraph. London Available: http://www.telegraph.co.uk/finance/newsbysector/energy/9470555/EDF-chief-Vincent-de-Rivazs-nuclear-vision-aims-to-inspire-a-generation.html [Accessed 12/08/12].
Greenacre, P., Gross, R. & Heptonstall, P. 2010. Great Expectations: The Cost of Offshore Wind in UK Waters - Understanding the past and projecting the future. UK Energy Research Centre, London.
Gross, R., Blyth, W. & Heptonstall, P. 2010. Risks, revenues and investment in electricity generation: Why policy needs to look beyond costs. Energy Economics, 32, 796-804.
Gross, R., Heptonstall, P., Anderson, D., Green, T., Leach, M. & Skea, J. 2006. The Costs and Impacts of Intermittency. UK Energy Research Centre, London.
Grubler, A. 2009. An assessment of the costs of the French nuclear PWR program 1970–2000. International Institute for Applied Systems Analysis, Laxenburg, Austria.
Harding, J. 2007. Economics of New Nuclear Power and Proliferation Risks in a Carbon-Constrained World.
Heptonstall, P. 2007. A Review of Electricity Unit Cost Estimates, Working Paper, December 2006 - Updated May 2007. UK Energy Research Centre, London.
Heptonstall, P., Gross, R., Greenacre, P. & Cockerill, T. 2012. The cost of offshore wind: Understanding the past and projecting the future. Energy Policy, 41, 815-821.
HM Government 2012. Draft Energy Bill. The Stationery Office, London.
Hollinger, P. 2010. EDF reveals strategy for UK nuclear expansion [Online]. Financial Times. Available: http://www.ft.com/cms/s/0/5376fc24-0a06-11e0-9bb4-00144feabdc0.html#axzz1ANdUnOjq [Accessed 17/07/2011].
HSBC 2010. EDF Company Report. HSBC Global Research, London.
IAEA 2012. Power Reactor Information System (PRIS). International Atomic Energy Agency, Vienna.

24
IEA 2005. Projected costs of generating electricity. OECD, Paris.
IEER. 2011. Organisation website [Online]. The Institute for Energy and Environmental Research. Maryland Available: http://ieer.org/ [Accessed January 2011].
IHS 2011. US Power Capital Cost Index (PCCI) including nuclear. IHS CERA, Colorado.
Johnstone, H. 2011. EDF delays Flamanville reactor for two years [Online]. Power Engineering International. Available: http://www.powerengineeringint.com/articles/2011/07/edf-delays-flamanville-reactor-for-two-years.html [Accessed 02/08/2011].
Kennedy, D. 2007. New nuclear power generation in the UK: Cost benefit analysis. Energy Policy, 35, 3701–3716.
Kinnunen, T. 2012. UPDATE 2-Finland's Olkiluoto 3 reactor delayed again [Online]. Available: http://in.reuters.com/article/2012/07/16/finland-tvo-areva-idINL6E8IG8OX20120716 [Accessed July 2012].
Komanoff, C. 2010. Cost escalation in France’s Nuclear Reactors: A Statistical Examination. New York.
Koomey, J. & Hultman, N. E. 2007. A reactor-level analysis of busbar costs for US nuclear plants, 1970-2005. Energy Policy, 35, 5630-5642.
Koplow, D. 2011. Nuclear Power: Still not viable without subsidies. Union of Concerned Scientists, Cambridge, MA.
Lazard. 2008. Levelized cost of energy analysis - version 2.0 [Online]. Available: http://www.narucmeetings.org/Presentations/2008%20EMP%20Levelized%20Cost%20of%20Energy%20-%20Master%20June%202008%20(2).pdf.
Lekander, P., Oldfield, S., von Riesemann, J. & Srivastav, P. 2011. Can nuclear power survive Fukushima? UBS Investment Research.
MIT 2009. Update of the MIT 2003 Future of Nuclear Power Study. Massachusetts Institute of Technology, Massachusetts.
Mitchell, C. 2012. Opinion: A few words on EMR. UK Energy Research Centre, London.
Mott MacDonald 2010. UK Electricity Generation Costs Update. Department of Energy and Climate Change, London.
Mott MacDonald 2011. Costs of low carbon generation technologies. Committee on Climate Change, London.
NCE 2009. EDF plays down concerns over Flamanville plant. New Civil Engineer.
NEA. 2010. Technology Road Map: Nuclear Energy [Online]. Nuclear Energy Agency. Available: http://www.iea.org/papers/2010/nuclear_roadmap.pdf [Accessed 26/09/2011].
Nuclear Engineering International. 2012. EDF plans longer life extensions for UK AGRs [Online]. Progressive Media Group Ltd. Kent, UK Available: http://www.neimagazine.com/story.asp?storyCode=2061782 [Accessed August 2012].
OECD. 2011. The arrangement for officially supported export credits [Online]. OECD. Paris Available: http://www.oecd.org/dataoecd/15/47/39085836.pdf [Accessed 15/8/11].
Oxera 2011. Discount rates for low-carbon and renewable technologies. Committee on Climate Change, London.

25
Parsons Brinckerhoff 2011. Electricity Generation Cost Model - 2011 Update Revision 1. Department of Energy and Climate Change, London.
PIU 2002. The Energy Review. Performance and Innovation Unit, HM Government, London.
Schneider, M., Froggatt, A. & Thomas, S. 2011. Nuclear Power in a Post-Fukushima World – 25 years after the Chernobyl Accident. Worldwatch institute, Washington, DC.
Severance, C. 2009. Business Risks and Costs of New Nuclear Power. Center for American Progress, Washington DC.
Strbac, G., Aunedi, M., Pudjianto, D., Djapic, P., Gammons, S. & Druce, R. 2012. Understanding the Balancing Challenge. Department of Energy and Climate Change, London.
The Times 2012. http://www.thetimes.co.uk/tto/business/industries/utilities/article3476326.ece London.
Thomas, S. 2010. The EPR in Crises. PSIRU, Business School, University of Greenwich, London.
Thomas, S., Bradford, P., Froggatt, A. & Milborrow, D. 2007. The Economics of Nuclear Power. Greenpeace International, Amsterdam.
Turpin, E. & Lee, S. 2011. EDF – Feedback from French Energy Conference. Morgan Stanley Research.
World Energy Council 2007. The Role of Nuclear Power in Europe. World Energy Council, London.
World Nuclear Association. 2011a. Emerging Nuclear Energy Countries [Online]. London Available: http://www.world-nuclear.org/info/inf102.html [Accessed 21/09/2011].
World Nuclear Association. 2011b. Organisation website [Online]. London Available: http://www.world-nuclear.org/ [Accessed July 2011].
Appendix 1
Rosner, R; Goldberg, S; Hezir, J; Davis, E, 2011, Analysis of GW-Scale Overnight Capital Costs, EPIC – Energy Policy Institute at Chicago, The University of Chicago
Turnage, J. 'New Nuclear Development: Part of the Strategy for a Lower Carbon Energy Future', Unistar Nuclear, October 2008;
Rich, D & Fisher, R. 'Florida Power and Light Company's Project Management internal controls for nuclear plant uprate and construction projects', June 2011;
Florida Public Service Commission, 'Docket No. 07 - Direct Testimony of Steven D. Scroggs', October 2007;
Nuclear Regulatory Commission, Docket no. 50-039, June 2009;
Tennessee Valley Authority, 'Single Nuclear Unit at the Bellefonte Plant Site', May 2010;
Institute for Energy and Environmental Research, 'Nuclear Costs and Alternatives', May 2009;
'Schneider, M. Froggatt, A. Thomas, S. ‘Nuclear Power in a Post-Fukushima World – 25 years after the Chernobyl Accident’, Worldwatch institute, April 2011;
Du, Y & Parsons, J. 'Update on the Cost of Nuclear Power', Center for Energy and Environmental Policy Research, May 2009;
Tennessee Valley Authority, 'Additional information regarding cost estimates for construction of new nuclear, coal and gas field electricity generation units', Submission to U.S. Nuclear Regulatory Commission, November 2008;
Public Service Commission of Georgia, 'Direct Testimony of David A Schlissel on behalf of Southern Alliance for Clean Energy', December 2008;
Walker, A. 'French-owned UniStar not eligible to build nuclear reactor at Calvert Cliffs', Baltimore Sun, April 2011;
Bell Bend reactor website
Ganey, T. 'Ameren UE pulls plug on project', Columbia Daily Tribune, April 2009;
O'Grady, E. “DOE drops Luminant Texas from nuclear loan talks', Reuters, 8 May 2009;
Schneider, M, Thomas, S, Froggatt, A & Koplow, D. 'The World Nuclear Industry Status Report 2009';
German Federal Ministry of Environment Nature Conservation and Reactor Safety, August 2009;
Souder, E. 'NRG ends project to build new reactors', Dallas News, April 2011;

26
World Nuclear News, 'Construction work delayed at Levy as costs rise', May 2010;
World Nuclear Association, 'The Economics of Nuclear Power', March 2011;
Ligon, J, 'Update on the new nuclear reactors', Columbia Star, June 2011;
Nuclear Information and Resource Service, ‘The nuclear “renaissance” stalls with pending collapse of Calvert Cliffs’, August 2010;
Flessner, D, 'Tennessee: Estimates rise for nuclear plant', Times Free Press, December 2008;
Matthew L. Wald. U.S. Supports New Nuclear Reactors in Georgia, New York Times, February, 2010;
Stiers, M. ‘More Hearings For Plant Vogtle Expansion’, GPB News (Georgia Public Broadcasting, Atlanta), November 2010;
Tatum, G.'Georgia Power, PSC Sticks it to Ratepayers, Atlanta Progressive News, December 2010;
Power Engineering International, 'Surging new nuclear build costs start to stabilise', January 2010;
World Nuclear News, 'Construction work delayed at Levy as costs rise', May 2010;
UBS Investment Research, 'Can nuclear power survive Fukushima?', April 2011;
Nuclear Engineering International, 'The American Way', June 2008;
Temple, J. 'Update on the new nuclear stations', Columbia Star, June 2011;
Beyond Nuclear, 'FPL halts two new reactors targeted at Turkey Point', January 2011;
Downey, J. 'Duke doubles cost estimate for nuclear plant', The Business Journal, November 2008;
World Nuclear News, ‘US new nuclear build before 2012’, August 2011;
Koplow, D. 'Subsidies to nuclear power in the United States: The case of Calvert Cliffs Unit III', May 2008;
Smith, R. 'U.S. chooses four utilities to revive nuclear industry', Wall Street Journal, June 2009;
Behr, P. 'Nuclear power: A key energy industry nervously awaits its “rebirth”', Environment & Energy Daily, April 2009;
Physicians for Social Responsibility, 'Nuclear Power: The Renaissance that wasn't', May 2011;
Behr, P. 'A key energy industry nervously awaits its 'rebirth', New York Times, April 2009;
Reuters, 'Update 1 - Luminant seeks new Texas filing', September 2008;
CJEnergy Consulting, 'Costs of Current and Planned Nuclear Power Plants in Texas, A Consumer Perspective, March 2009;
Reed, D. 'Ameren suspends Callaway nuclear project', Columbia Business Times, April 2009;
Reuters, 'New U.S. nuclear reactors close to construction-S&P', May 2011;
Sturgis, S. 'Concerns grow over risk of U.S. nuclear projects post-Fukushima', August 2011;
Souder, E. 'NRG ends project to build new nuclear reactors', April 2011;
FPL website (2011).
Recommended