
Consumer Confidence and Asset Prices:
Some Empirical Evidence
Michael Lemmon
University of Utah
Evgenia Portniaguina
University of Oklahoma
We explore the time-series relationship between investor sentiment and the small-stock
premium using consumer confidence as a measure of investor optimism. We estimate
the components of consumer confidence related to economic fundamentals and inves-
tor sentiment. After controlling for the time variation of beta, we study the time-series
variation of the pricing error with sentiment. Over the last 25 years, investor sentiment
measured using consumer confidence forecasts the returns of small stocks and stocks
with low institutional ownership in a manner consistent with the predictions of models
based on noise-trader sentiment. Sentiment does not appear to forecast time-series
variation in the value and momentum premiums. (JEL G10, G12, G14)
In this article, we explore the time-series relationship between investor
sentiment and stock returns using consumer confidence as a measure of
investor optimism. Our goal is to assess the extent to which sentimentaffects the prices of different stocks in times of optimistic or pessimistic
assessment of market conditions by investors. Our analysis examines both
behavioral and rational channels through which sentiment might be
manifested in asset prices.
The behavioral hypopthesis suggests that when arbitrage is limited,
noise-trader sentiment can persist in financial markets and affect asset
prices. For example, Delong et al. (1990) show that if the sentiment of
noise traders is correlated, then the prices of assets that are predominantlyheld by these investors may deviate from their fundamental values for
extended periods of time. This hypothesis thus predicts a negative rela-
tionship between the level of investor sentiment and the future returns of
stocks widely held by noise traders as the mispricing is eventually cor-
rected. Alternatively, Jagannathan and Wang (1996) argue that firms on
We thank Nicholas Bollen, Michael Cliff, Campbell Harvey (the editor), Avner Kalay, Scott Linn, UriLowenstein, William Megginson, an anonymous referee, and the seminar participants at the University ofUtah, the University of Houston, the University of Oklahoma, Barclay’s Global Investors, and theEastern Finance Meetings for helpful comments and suggestions. We thank Malcolm Baker, KennethFrench, Stefan Nagel, Ludovic Phalippou, and Jeffrey Wurgler for providing data. All errors are ours.Address correspondence to Evgenia Portniaguina, Michael F. Price College of Business, University ofOklahoma, 307 West Brooks, Room 205A, Adams Hall, Norman, OK 73019-4005, or email:[email protected].
ª The Author 2006. Published by Oxford University Press on behalf of The Society for Financial Studies. All rights
reserved. For permissions, please email: [email protected].
doi:10.1093/rfs/hhj038 Advance Access publication March 15, 2006
at Biblioteque de la Sorbonne on O
ctober 24, 2012http://rfs.oxfordjournals.org/
Dow
nloaded from
the fringe and firms with a higher likelihood of financial distress will have
conditional market betas that are more sensitive to changes in the busi-
ness cycle. Under this view, investor sentiment is related to time variation
in the expected returns of these firms, because sentiment rationally fore-
casts future macroeconomic conditions.
Following prior literature, we focus primarily on differences between
small and large firms. Firm size represents a natural variable to use for
examining the relationship between investor sentiment and stock returns.Lee, Shleifer, and Thaler (1991) identify noise traders with individual
investors and show that small stocks are disproportionately held by
individuals as opposed to institutions. More recent evidence by Nagel
(2005) also shows a strong positive correlation between ownership by
institutions and firm size. Chan and Chen (1991) show that small firms
are also associated with higher levels of financial distress risk and other
characteristics that are likely to affect their conditional covariances with
the market over the business cycle, while Jagannathan and Wang (1996)provide evidence that accounting for time variation in expected returns
related to changing macroeconomic conditions helps to explain the size
premium in returns.
As measures of investor sentiment, we use the two surveys of consumer
confidence that have been conducted in the United States. One is col-
lected by the Conference Board [the Index of Consumer Confidence
(CBIND)] and the other is independently conducted by the University
of Michigan Survey Research Center [the Index of Consumer Sentiment(ICS)]. These surveys poll a large number of households on their personal
financial situation, their expectations regarding the US economy, and
their propensity to consume major household items. CBIND is included
in the list of 10 major leading economic indicators by the Conference
Board, having proven useful in predicting past recessions. Several papers
[Acemoglu and Scott, (1994), Carroll, Fuhrer, and Wilcox (1994), Bram
and Ludvigson (1998), Ludvigson (2004)] find that consumer confidence
predicts future household spending. According to the University ofMichigan Survey Research Center, consumers also anticipate changes in
interest rates, unemployment, inflation, real gross domestic product
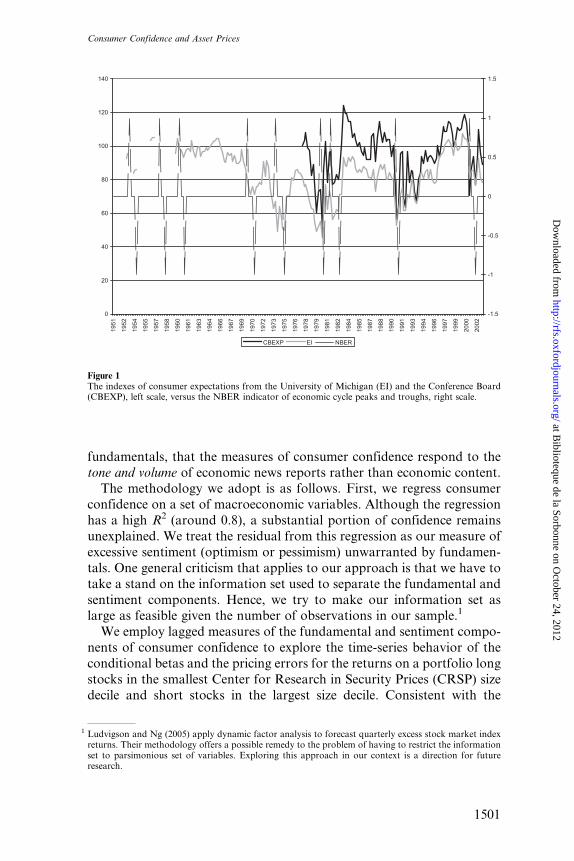
(GDP), and house sales. Figure 1 shows that consumer expectations are
good predictors of business cycle peaks and troughs.
Consumer sentiment has also received some attention in the literature
as a potential measure of investor optimism. Fisher and Statman (2002)
report positive correlations between the measures of consumer confidence
and a direct measure of investor sentiment compiled by the AmericanAssociation of Individual Investors over the period 1987–2000. There is
also evidence of the presence of an irrational element in consumer con-
fidence. Doms and Morin (2004) find, after controlling for economic
The Review of Financial Studies / v 19 n 4 2006
1500
at Biblioteque de la Sorbonne on O
ctober 24, 2012http://rfs.oxfordjournals.org/
Dow
nloaded from
fundamentals, that the measures of consumer confidence respond to the
tone and volume of economic news reports rather than economic content.The methodology we adopt is as follows. First, we regress consumer
confidence on a set of macroeconomic variables. Although the regression
has a high R2 (around 0.8), a substantial portion of confidence remains
unexplained. We treat the residual from this regression as our measure of
excessive sentiment (optimism or pessimism) unwarranted by fundamen-
tals. One general criticism that applies to our approach is that we have to
take a stand on the information set used to separate the fundamental and
sentiment components. Hence, we try to make our information set aslarge as feasible given the number of observations in our sample.1
We employ lagged measures of the fundamental and sentiment compo-
nents of consumer confidence to explore the time-series behavior of the
conditional betas and the pricing errors for the returns on a portfolio long
stocks in the smallest Center for Research in Security Prices (CRSP) size
decile and short stocks in the largest size decile. Consistent with the
0
20
40
60
80
100
120
140
1951
1952
1954
1955
1957
1958
1960
1961
1963
1964
1966
1967
1969
1970
1972
1973
1975
1976
1978
1979
1981
1982
1984
1985
1987
1988
1990
1991
1993
1994
1996
1997
1999
2000
2002
-1.5
-1
-0.5
0
0.5
1
1.5
CBEXP EI NBER
Figure 1The indexes of consumer expectations from the University of Michigan (EI) and the Conference Board(CBEXP), left scale, versus the NBER indicator of economic cycle peaks and troughs, right scale.
1 Ludvigson and Ng (2005) apply dynamic factor analysis to forecast quarterly excess stock market indexreturns. Their methodology offers a possible remedy to the problem of having to restrict the informationset to parsimonious set of variables. Exploring this approach in our context is a direction for futureresearch.
Consumer Confidence and Asset Prices
1501
at Biblioteque de la Sorbonne on O
ctober 24, 2012http://rfs.oxfordjournals.org/
Dow
nloaded from

rational view, we find that the conditional market betas of this portfolio
increase following quarters of low confidence. However, consistent with
the behavioral view, after we allow for time variation in the conditional
market betas, we still find that the pricing errors are negatively correlated
with the sentiment component of confidence—small stocks earn low
returns relative to large stocks following quarters when the sentiment
component of consumer confidence is high. The relationship between
the sentiment component of confidence and the size premium is robustto allowing the conditional market beta to vary with additional macro
variables and to the inclusion of returns on the book-to-market and
momentum factors.
Our evidence is consistent with the idea that investors appear to over-
value small stocks relative to large stocks during periods when consumer
confidence is high and vice versa. When we perform analysis on different
subperiods, we find that the predictive power of consumer confidence is
present only in the most recent 25-year subsample. One potential expla-nation for this result is that the influence of individual investors in
financial markets has risen over time, thus creating a stronger link
between sentiment and stock returns in the latter part of the sample.
We also compare the sentiment component of confidence extracted
from the various confidence indexes to both the closed-end fund discount
(CEFD) [e.g., Lee, Shleifer, and Thaler (1991) and Swaminathan (1996)]
and the overall sentiment measure developed by Baker and Wurgler
(2005). Over the period from 1962 to 1977, the sentiment component ofconfidence and the Baker and Wurgler index are negatively correlated.
Over the period 1978–2002, we find that the two measures align better
than in the earlier period but that the correlations are relatively small. The
correlations of the sentiment component of confidence with CEFD are
weak in both subperiods, and the signs of the correlations are not con-
sistent across the different confidence indexes. More interestingly, in the
post-1977 period, CEFD exhibits essentially no forecasting power for the
size premium after controlling for the the sentiment measure based onconsumer confidence.
A key assumption behind the focus of the sentiment literature on the
size premium is that small stocks are disproportionately held by indivi-
dual investors (as opposed to institutions) and that individual investors
are more likely to be affected by sentiment. We test this hypothesis
directly and perform the same time-series analysis using the returns on a
portfolio of stocks with low institutional ownership less the returns on a
high institutional ownership portfolio. We find that stocks with lowinstitutional ownership exhibit low (high) returns following periods of
high (low) residual confidence. The results provide additional support for
the view that stocks held predominantly by individual investors are more
prone to mispricing arising from changes in sentiment.
The Review of Financial Studies / v 19 n 4 2006
1502
at Biblioteque de la Sorbonne on O
ctober 24, 2012http://rfs.oxfordjournals.org/
Dow
nloaded from
Finally, we also examine whether the sentiment component of consumer
confidence is related to time-series variation of returns to value and
momentum strategies. The results show that the confidence-based senti-
ment measures do not exhibit any significant predictive power for either
the book-to-market or the momentum factors. Exploring further, we find
evidence that high levels of sentiment forecast lower future returns on value
stocks, but no evidence that sentiment forecasts the returns on growth
stocks. Our result differs from that reported by Baker and Wurgler (2005),who find a U-shaped relationship between their measure of sentiment and
the returns on portfolios sorted by book to market. For portfolios sorted
on past returns, we find no evidence that our measure of sentiment fore-
casts the subsequent returns on either past winner or past loser stocks.
Our analysis contributes to several strands of the literature. The exist-
ing studies of the effect of sentiment on asset prices have largely relied on
the use of the discount on closed-end funds as a sentiment measure. For
example, Lee, Shleifer, and Thaler (1991) find that CEFDs are contem-poraneously correlated with small stock returns, whereas Chen, Kan, and
Miller (1993) and Doukas and Milonas (2002) provid evidence to the
contrary. Swaminathan (1996) finds that the CEFD forecasts the size
premium and that information in discounts is related to expectations of
future earnings growth and inflation. Neal and Wheatley (1998) find that
CEFDs and net mutual fund redemptions forecast the size premium,
especially at long horizons. Baker and Wurgler (2005) design a measure
of investor sentiment based on the CEFD and several other market-basedvariables, such as the number of IPOs, NYSE turnover, and so on. They
show that the returns on equity portfolios with different ‘‘salient’’ (e.g.,
age, size, dividend payout, distress) investment characteristics are prone
to speculation and are difficult to arbitrage making their prices sensitive
to changes in investor sentiment. Consistent with this argument, they
report that periods of low sentiment are followed by high returns on
small, young, unprofitable, and dividend-nonpaying stocks.
In contrast to these studies that rely predominantly on the use ofmarket prices to measure sentiment, we focus on a direct measure
of sentiment compiled from survey data. Some recent papers provide
additional evidence that complements the findings that we report.
Charoenrook (2002) finds that changes in consumer confidence help to
forecast aggregate market returns in the United States. Brown and Cliff
(2004) use data on investor sentiment from a survey conducted by the
American Association of Individual Investors and did not find evidence
that fund discounts reflect investor sentiment. Qiu and Welch (2004) findthat the measures of consumer confidence that we use and CEFD do not
correlate well and that only the confidence measures are correlated with a
measure of investor sentiment derived from UBS/Gallup. Moreover, they
also found that only the consumer confidence measures yield robust
Consumer Confidence and Asset Prices
1503
at Biblioteque de la Sorbonne on O
ctober 24, 2012http://rfs.oxfordjournals.org/
Dow
nloaded from
contemporaneous correlations with the small-firm premium and with the
spread in returns between stocks held by individuals and those predomi-
nantly held by institutions. Kumar and Lee (2005) find direct evidence of
correlated trading by individual investors and provide evidence that a
factor capturing the buy–sell imbalalnce of individual traders helps to
explain the return comovements of stocks with a high concentration of
retail investors (including small stocks). In comparison, we focus on
the ability of the confidence measures to forecast the size premium andattempt to separate out the effects of confidence that are related to eco-
nomic fundamentals from those potentially associated with behavioral
biases.
The rest of this article is organized as follows. In the next section, we give a
detailed description of the consumer confidence survey data along with the
other data used in our study. In Section 2, we present initial evidence on the
link between consumer confidence and the size premium. In Section 3,
we discuss the ability of consumer confidence to predict macroeconomicactivity. In Section 4, we describe the decomposition of consumer confidence
into components related to economic fundamentals and to investor senti-
ment and compare the confidence-based measure of sentiment to other
measures of investor sentiment in the literature. In Section 5, we revisit the
link between the consumer confidence and the size premium using the
fundamental and sentiment-based components of consumer confidence. In
Section 6, we discuss the relationship between the consumer confidence and
the book-to-market and momentum factors. We conclude in Section 7.
1. Data
As measures of investor sentiment, we employ data from two surveys.One is the University of Michigan survey of consumer sentiment and the
other is the Conference Board survey of consumer confidence.
The University of Michigan survey of consumer sentiment started in
1947 on a quarterly basis for months 2, 5, 8, and 11. Beginning in 1978,
the index is available on a monthly basis. The main reason for increasing
the sampling frequency in 1978, according to the University of Michigan
Survey Research Center, was the increased frequency in the reporting of
other macroeconomic data around that time. The final survey results foreach month become available either at the end of that month or at the
beginning of the following month. The survey is sent to 500 households,
and the respondents are asked the following questions: (1) Would you say
that you (and your family living there) are better off or worse off finan-
cially than you were a year ago? (2) Do you think that a year from now,
you (and your family living there) will be better off financially, or worse
off, or about the same as now? (3) Now turning to business conditions in
the country as a whole—do you think that during the next 12 months, we
The Review of Financial Studies / v 19 n 4 2006
1504
at Biblioteque de la Sorbonne on O
ctober 24, 2012http://rfs.oxfordjournals.org/
Dow
nloaded from

will have good times financially or bad times or what? (4) Looking ahead,
which would you say is more likely—that in the country as a whole we
will have continuous good times during the next five years or so or that
we will have periods of widespread unemployment or depression, or
what? and (5) Do you think now is a good or bad time for people to
buy major household items?
The relative score for each question is then calculated as the percent of
favorable replies minus the percent of unfavorable replies, plus 100,rounded to the nearest whole number. The relative scores for questions
(1) and (5) compose the Index of Current Economic Conditions (CI), the
relative scores for questions (2)–(4) compose the Index of Consumer
Expectations (EI), and all five questions compose the overall ICS.
The Conference Board survey is available over a shorter time interval.
The survey began on a bimonthly basis in 1967 and turned into a monthly
poll in 1977.2 The survey is mailed to 5000 households; a much larger pool
of respondents compared with the University Michigan survey. Thesurvey is similar in spirit to that of the University of Michigan, although
the questions are somewhat different. Respondents are asked the follow-
ing five questions: (1) How would you rate present general business
conditions in your area? (2) What would you say about available jobs in
your area right now? (3) Six months from now, do you think business
conditions in your area will be better, same, or worse? (4) Six months
from now, do you think there will be more, same, or fewer jobs available
in your area? and (5) Would you guess your total family income to behigher, same, or lower six months from now?
The scores for each question are calculated as the percent of favorable
replies divided by the sum of favorable and unfavorable replies. The scores
for questions (1) and (2) compose the Current Index, the scores for ques-
tions (3)–(5) compose the Expectations Index (CBEXP), and all five ques-
tions compose the overall CBIND. The final results for each survey month
become available on the last Tuesday of the following month. For this
survey, we have the data on the overall CBIND and CBEXP. All our tablesreport the results for the major confidence indexes and omit those for the
individual survey questions in the interest of parsimony.
Despite the obvious similarities in the two survey methodologies, we
should mention several differences important for our study. First, the
Current Index of the University of Michigan is somewhat backward
looking, because the respondents are asked to compare their present
situation with that one year before. Second, the University of Michigan
survey asks specifically about current buying conditions, whereas the
2 Note that both surveys of consumer confidence switched to monthly sampling frequency in 1977–1978.Even though the survey questions stayed exactly the same as before (we could not find any evidence to thecontrary), still the increase in sampling frequency may have indicated that the indexes of consumerconfidence have become more meaningful and more closely followed indicators.
Consumer Confidence and Asset Prices
1505
at Biblioteque de la Sorbonne on O
ctober 24, 2012http://rfs.oxfordjournals.org/
Dow
nloaded from

Conference Board survey does not. Third, the expectations index of the
University of Michigan measures expectations over a longer term (one to
five years) than the similar index from the Conference Board (six
months). Fourth, the Conference Board index (CBIND) is considerably
more focused on job availability, whereas the other survey asks generally
about the individual’s financial situation. Fifth, the University of Michi-
gan survey asks about the economic conditions in the country as a whole,
whereas the Conference Board survey focuses on the respondent’s specificarea of residence. These differences substantiate the need to test the
robustness of our results to the use of either survey.3
Regressing the consumer confidence indexes on monthly dummies does
not reveal significant seasonality in any index. In addition, none of the
indexes exhibit noticeable trends. Confidence is only reported bimonthly
(the Conference Board) or for months 2, 5, 8, and 11 (the University of
Michigan) before 1978, whereas other macroeconomic variables available
on a quarterly basis are reported as of months 3, 6, 9, and 12. Our finalsample uses quarterly values of the confidence indexes from 1956 (1967 for
the Conference Board) through 2002. We begin the sample in 1956, because
the University of Michigan data are only available sporadically before this
date. In our empirical tests, we use observations for months 2, 5, 8, and 11
for the confidence indices and months 3, 6, 9, and 12 for the macroeco-
nomic variables. For example, in our forecasting regressions, we use the
consumer confidence level reported for November to forecast returns over
the first quarter of the following year (January through March).Other studies have argued that investor sentiment is reflected in the
discounts on closed-end funds. To compare and contrast our findings
with those of other studies, we control for the information in CEFD
in some of our empirical tests. The monthly CEFD data were provided
by Brown and Cliff for 1965–1998 and updated through 2002 using
Bloomberg data on all diversified domestic equity closed-end funds.4
The correlation between our extension with the Brown and Cliff (2004)
original series over the 12 months of 1998 is 0.92.We employ several macroeconomic variables drawn from the literature
either as controls or as dependent variables, observed quarterly, and
measured in percent: default spread (DEF), measured as the difference
between the yields to maturity on Moody’s Baa-rated and Aaa-rated
bonds; the yield on three-month Treasury bills (YLD3); dividend
yield (DIV) measured as the total cash ordinary dividend of the CRSP
3 See Bram and Ludvigson (1998) and Charoenrook (2002) for additional details regarding the surveys.
4 For the Bloomberg QSRC search criteria, country ¼United States, security type ¼mutual fund, industrygroup ¼ closed-end fund. For search display, asset class focus ¼ equity, geographical focus ¼ UnitedStates. We did not exclude based on trading status. During 1998, our CEFD measure is the averagebetween the Bloomberg data and the original data from Brown and Cliff. After 1998, we switch to theBloomberg data.
The Review of Financial Studies / v 19 n 4 2006
1506
at Biblioteque de la Sorbonne on O
ctober 24, 2012http://rfs.oxfordjournals.org/
Dow
nloaded from

value-weighted index over the last four quarters and divided by the value
of the index at the end of the current quarter (as in Fama and French,
1988); GDP growth (GDP) measured as 100 times the quarterly change in
the natural logarithm of chained (1996 dollars) GDP; consumption growth
(CONS) measured as 100 times the quarterly change in the natural logarithm
of personal consumption expenditures; labor income growth (LABOR)
measured as 100 times the quarterly change in the natural logarithm of
labor income, computed as total personal income minus dividend income,per capita, and deflated by the PCE deflator; unemployment rate
(URATE), seasonally adjusted, as reported by the Bureau of Labor
Statistics and averaged over the most recent three months; growth in
URATE (URCHG) measured as the difference between the end-of-quar-
ter and the beginning-of-quarter levels of the URATE; the inflation rate
(CPIQ), from CRSP, cumulated over the most recent three months; and
the consumption-to-wealth ratio (CAY) from Lettau and Ludvigson
(2001).5
As our measure of the size premium, we use the difference between the
returns on the smallest and the largest size decile portfolios (M110). We
also consider the difference between the return on the lowest decile and
the highest decile of institutional ownership (IO110). The data on institu-
tional ownership portfolio sorts are from Phalippou (2005). The returns
on the difference portfolios are holding-period returns measured in per-
cent. Our main analysis uses nonoverlapping quarterly observations. In
addition, we report some results using quarterly overlapping forecasts of6- and 12-month holding period returns.
Tables 1 and 2 summarize the descriptive statistics and the correlations.
We break the sample into two subperiods for analysis. The first subperiod
covers 1956–1977, and the second subperiod covers 1978–2002. The break
point corresponds to the dates that both surveys began reporting data on
a monthly basis.
The overall CBIND has a mean value of 101.34 in the pre-1977 period and
a mean value of 97.71 in the post-1977 period. The corresponding values forthe overall University of Michigan index (ICS) are 88.64 and 87.81 in the
two subperiods. In both subperiods, the standard deviation of the the
Michigan index is about half that of the CBIND. CEFD decreases substan-
tially across the two subperiods. The average discount is –30.04% in the first
subperiod and declines to –9.09% in the second subperiod. The standard
deviation in the discount is comparable across the two periods however.
The mean value of the size premium (M110) is 1.18% per quarter in the
pre-1977 period and falls to 0.61% per quarter in the post-1977 period.The reduction in the size premium over time is consistent with the
5 See, e.g., Chen, Roll, and Ross (1986), Nelson (1976), Lee (1992), Chen (1991), Fama and French (1988),Baker and Wurgler (2005), and Lewellen and Nagel (2005).
Consumer Confidence and Asset Prices
1507
at Biblioteque de la Sorbonne on O
ctober 24, 2012http://rfs.oxfordjournals.org/
Dow
nloaded from
Table 1Descriptive statistics
Pre-1977 Post-1977
NOBS Mean SD Minimum Maximum NOBS Mean SD Minimum Maximum
CBIND 21 101.34 24.88 54.50 138.20 102 97.71 23.54 47.30 144.70CBEXP 21 101.02 18.80 53.90 123.70 102 94.77 15.04 50.00 124.30ICS 85 88.64 10.51 57.60 105.40 102 87.81 12.92 51.70 111.30CI 85 90.70 8.66 69.30 109.00 102 99.43 12.46 61.70 121.10EI 85 87.91 13.45 49.40 105.20 102 80.34 14.00 45.30 107.80CEFD 49 �30.04 7.72 �41.86 �13.88 102 �9.09 7.74 �31.26 1.23DIV 85 3.44 0.69 2.57 5.49 102 3.09 1.25 1.10 5.54DEF 85 0.81 0.35 0.32 1.98 102 1.09 0.45 0.55 2.61YLD3 85 4.25 1.81 0.72 8.33 102 6.53 3.01 1.17 15.02CAY 85 0.00 0.01 �0.03 0.02 102 0.00 0.01 �0.04 0.03GDP 85 0.90 1.06 �1.61 3.26 102 0.74 0.81 �2.06 3.78CONS 85 1.00 0.83 �1.65 3.46 102 0.79 0.63 �2.30 2.14LABOR 85 0.69 0.78 �1.65 3.26 102 0.45 0.77 �2.20 1.95URATE 85 5.26 1.37 2.70 8.87 102 6.28 1.45 3.93 10.67CPIQ 85 0.87 0.80 �0.37 3.46 102 1.08 0.90 �0.90 4.43M110 85 1.18 10.38 �18.05 25.97 102 0.61 9.19 �16.06 26.58IO110 85 NA NA NA NA 86 1.11 14.02 �36.59 55.20MKT 85 2.83 8.51 24.66 24.75 102 3.38 8.50 �22.98 21.66SMB 85 0.35 6.12 �12.82 15.19 102 0.67 5.32 �11.03 17.52HML 85 1.31 4.77 �10.26 14.68 102 0.68 6.76 �26.59 23.71MTM 85 2.75 6.33 –17.65 26.34 102 2.95 7.05 –16.59 26.09
CAY, consumption-to-wealth ratio; CEFD, closed-end fund discount; CI, the Index of Current Economic Conditions; CONS, 100 times the change in the natural log of personalconsumption expenditures; CPIQ, inflation rate, CRSP, cumulated over three months; DEF, the difference between Baa- and Aaa-rated bond yields; DIV, dividend yield on theCRSP value-weighted index; EI, Index of Consumer Expectations; GDP, 100 times the change in the natural log of chained gross domestic product; ICS, the Index of ConsumerSentiment; IO110, difference in returns between the smallest and the largest institutional ownership deciles; LABOR, 100 times the change in the natural log of labor income,measured as total personal income net of dividend income, per capita, deflated by the PCE deflator; M110, difference in returns between the smallest and the largest size deciles;MKT, SMB, HML, MTM, the Fama–French factors and the momentum factor; URATE, unemployment rate, averaged over three months; YLD3, yield on three-monthTreasury bill. The sample is from 1956 to 2002. All data are as of months 3, 6, 9, 12, except confidence (2, 5, 8, 11). The Conference Board Index of Consumer Confidence and itsExpectations component (CBIND and CBEXP) are observed for months 2 and 8 pre-1977. All returns are holding period, quarterly.
The
Review
of
Fin
ancia
lS
tudies
/v
19
n4
2006
15
08
at Biblioteque de la Sorbonne on October 24, 2012 http://rfs.oxfordjournals.org/ Downloaded from
Table 2Correlations between confidence indicators and macroeconomic variables
CBIND CBEXP ICS CI EI CEFD DIV DEF YLD3 CAY GDP CONS LABOR URATE CPIQ M110 IO110
Pre-1977CBIND 1.00CBEXP 0.73 1.00ICS 0.84 0.89 1.00CI 0.74 0.72 0.83 1.00EI 0.84 0.91 0.97 0.69 1.00CEFD 0.45 0.17 0.21 0.02 0.27 1.00DIV �0.50 �0.36 �0.41 �0.68 �0.27 �0.30 1.00DEF �0.58 �0.10 �0.70 �0.55 �0.69 �0.30 0.25 1.00YLD3 �0.20 �0.66 �0.49 �0.12 �0.61 0.19 �0.26 0.35 1.00CAY �0.31 �0.04 �0.06 �0.27 0.06 �0.03 0.50 0.16 �0.40 1.00GDP 0.39 0.75 0.47 0.47 0.41 �0.10 �0.32 �0.26 �0.16 �0.23 1.00CONS 0.31 0.66 0.40 0.32 0.37 0.00 �0.21 �0.21 �0.21 �0.18 0.73 1.00LABOR 0.65 0.83 0.50 0.51 0.43 0.01 �0.43 �0.27 0.01 �0.38 0.70 0.68 1.00URATE �0.71 �0.16 �0.36 �0.19 �0.36 �0.57 0.10 0.62 �0.07 0.34 �0.02 �0.01 �0.16 1.00CPIQ �0.37 �0.67 �0.65 �0.27 �0.75 �0.13 0.00 0.48 0.85 �0.22 �0.33 �0.36 �0.24 0.14 1.00M110 �0.33 �0.22 0.07 0.07 0.06 0.02 �0.12 �0.03 �0.03 �0.05 0.20 0.24 0.01 0.03 �0.07 1.00IO110 NA NA NA NA NA NA NA NA NA NA NA NA NA NA NA NA NA
Post-1977CBIND 1.00CBEXP 0.74 1.00ICS 0.85 0.78 1.00CI 0.84 0.63 0.94 1.00EI 0.81 0.82 0.98 0.85 1.00CEFD �0.06 0.09 0.36 0.28 0.39 1.00DIV �0.51 �0.25 �0.69 �0.66 �0.66 �0.48 1.00DEF �0.47 �0.22 �0.54 �0.65 �0.45 �0.08 0.63 1.00YLD3 �0.16 �0.02 �0.42 �0.46 �0.37 �0.53 0.76 0.62 1.00
Consu
mer
Confid
ence
and
Asset
Prices
15
09
at Biblioteque de la Sorbonne on October 24, 2012 http://rfs.oxfordjournals.org/ Downloaded from
Table 2(continued)
CBIND CBEXP ICS CI EI CEFD DIV DEF YLD3 CAY GDP CONS LABOR URATE CPIQ M110 IO110
CAY �0.48 �0.33 �0.39 �0.26 �0.44 �0.08 0.35 �0.07 0.01 1.00GDP 0.30 0.50 0.40 0.36 0.41 �0.00 �0.10 �0.25 �0.05 �0.03 1.00CONS 0.31 0.53 0.47 0.41 0.48 0.14 �0.18 �0.16 �0.14 �0.17 0.63 1.00LABOR 0.38 0.53 0.40 0.35 0.40 �0.08 �0.03 �0.15 0.11 �0.25 0.63 0.53 1.00URATE �0.75 �0.20 �0.57 �0.69 �0.47 0.07 0.67 0.67 0.40 0.29 �0.04 0.03 �0.10 1.00CPIQ �0.15 �0.23 �0.47 �0.40 �0.49 �0.66 0.58 0.28 0.64 0.08 �0.05 �0.29 �0.02 0.10 1.00M110 �0.17 �0.16 �0.17 �0.21 �0.14 �0.16 �0.01 �0.01 �0.07 �0.11 �0.09 0.16 �0.07 0.11 0.15 1.00IO110 –0.07 –0.12 –0.02 –0.02 –0.03 0.00 –0.15 –0.15 –0.13 –0.07 0.00 0.19 0.06 –0.04 0.24 0.70 1.00
CAY, consumption-to-wealth ratio; CEFD, closed-end fund discount; CI, the Index of Current Economic Conditions; CONS, 100 times the change in the natural log ofpersonal consumption expenditures; CPIQ, inflation rate, CRSP, cumulated over three months; DEF, the difference between Baa- and Aaa-rated bond yields; DIV, dividendyield on the CRSP value-weighted index; EI, Index of Consumer Expectations; GDP, 100 times the change in the natural log of chained gross domestic product; ICS, the Indexof Consumer Sentiment; IO110, difference in returns between the smallest and the largest institutional ownership deciles; LABOR, 100 times the change in the natural log oflabor income, measured as total personal income net of dividend income, per capita, deflated by the PCE deflator; M110, difference in returns between the smallest and thelargest size deciles; URATE, unemployment rate, averaged over three months; YLD3, yield on 3-month Treasury bill.The sample is from 1956 to 2002. All data are as of months 3, 6, 9, 12, except confidence (2, 5, 8, 11). The Conference Board Index of Consumer Confidence and its Expectationscomponent (CBIND and CBEXP) are observed for months 2 and 8 pre-1977. All returns are holding period, quarterly.
The
Review
of
Fin
ancia
lS
tudies
/v
19
n4
2006
15
10
at Biblioteque de la Sorbonne on October 24, 2012 http://rfs.oxfordjournals.org/ Downloaded from
evidence in Fama and French (1992). Nevertheless, in both subperiods,
there is substantial time-series variation in the size premium. The returns
to the difference portfolio of firms with low institutional ownership less
those with high institutional ownership (IO110) are only available begin-
ning in 1980. The average return on the IO110 portfolio is 1.11% per
quarter, with a quarterly standard deviation of 14.02%.
Despite the differences in the consumer confidence surveys conducted
by the Conference Board and the University of Michigan, their respectiveindexes are highly correlated. The correlations between the indexes range
from 0.69 to 0.97 in the pre-1977 period and from 0.63 to 0.98 in the post-
1977 period. Most of the macroeconomic variables exhibit strong con-
temporaneous correlations with consumer confidence, suggesting that
consumer confidence is connected to overall economic activity. The
CEFD is generally positively correlated with the various consumer con-
fidence indexes, indicating that discounts on closed-end funds tend to
widen when confidence is low (recall that the discount is measured as anegative number). The correlations between the size premium and the
University of Michigan confidence indexes are all positive but small in the
first subperiod and become negative in the second subperiod. A similar
pattern is found in the correlations with the fund discounts. The discount
is positively correlated with the size premium in the first subperiod and
negatively correlated with the size premium in the second subperiod.
2. Consumer Confidence and the Size Premium
Both the rational and the behavioral hypotheses suggest a negative rela-
tionship between the lagged levels of consumer confidence and the size
premium. To test whether consumer confidence forecasts time-seriesvariation in the size premium, we estimate OLS regressions in which the
returns on the M110 portfolio computed over various holding periods are
regressed on lagged measures of consumer confidence and control vari-
ables. The forecasting regressions are similar to those employed by
Swaminathan (1996) to forecast the size premium using the discount on
closed-end funds. We consider holding periods of one, two, and four
quarters. The quarterly regressions use nonoverlapping periods, whereas
the longer horizon returns exhibit overlaps of three and six months for thetwo- and four-quarter holding periods, respectively. Statistical signifi-
cance is assessed using Newey West standard errors. As control variables,
the regressions include the lagged size premium, and lags of DIV, DEF,
YLD3, and CAY. The results are reported for each forecasting horizon
and each subperiod separately in Table 3.
Panel A of the table reports the results of the three-month forecast
horizon. In the pre-1977 period, there is a positive but statistically insig-
nificant relation between the size premium and the lagged measures of
Consumer Confidence and Asset Prices
1511
at Biblioteque de la Sorbonne on O
ctober 24, 2012http://rfs.oxfordjournals.org/
Dow
nloaded from
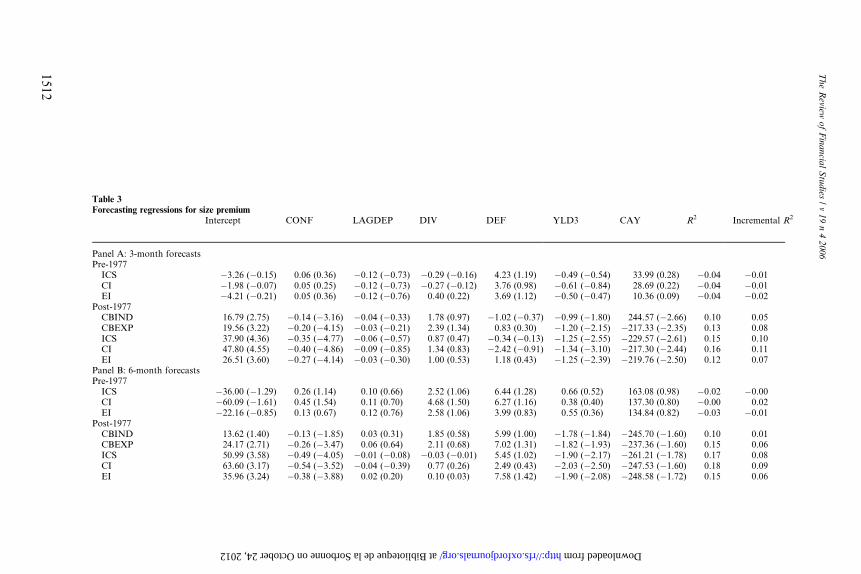
Table 3Forecasting regressions for size premium
Intercept CONF LAGDEP DIV DEF YLD3 CAY R2 Incremental R2
Panel A: 3-month forecastsPre-1977
ICS �3.26 (�0.15) 0.06 (0.36) �0.12 (�0.73) �0.29 (�0.16) 4.23 (1.19) �0.49 (�0.54) 33.99 (0.28) �0.04 �0.01CI �1.98 (�0.07) 0.05 (0.25) �0.12 (�0.73) �0.27 (�0.12) 3.76 (0.98) �0.61 (�0.84) 28.69 (0.22) �0.04 �0.01EI �4.21 (�0.21) 0.05 (0.36) �0.12 (�0.76) 0.40 (0.22) 3.69 (1.12) �0.50 (�0.47) 10.36 (0.09) �0.04 �0.02
Post-1977CBIND 16.79 (2.75) �0.14 (�3.16) �0.04 (�0.33) 1.78 (0.97) �1.02 (�0.37) �0.99 (�1.80) 244.57 (�2.66) 0.10 0.05CBEXP 19.56 (3.22) �0.20 (�4.15) �0.03 (�0.21) 2.39 (1.34) 0.83 (0.30) �1.20 (�2.15) �217.33 (�2.35) 0.13 0.08ICS 37.90 (4.36) �0.35 (�4.77) �0.06 (�0.57) 0.87 (0.47) �0.34 (�0.13) �1.25 (�2.55) �229.57 (�2.61) 0.15 0.10CI 47.80 (4.55) �0.40 (�4.86) �0.09 (�0.85) 1.34 (0.83) �2.42 (�0.91) �1.34 (�3.10) �217.30 (�2.44) 0.16 0.11EI 26.51 (3.60) �0.27 (�4.14) �0.03 (�0.30) 1.00 (0.53) 1.18 (0.43) �1.25 (�2.39) �219.76 (�2.50) 0.12 0.07
Panel B: 6-month forecastsPre-1977
ICS �36.00 (�1.29) 0.26 (1.14) 0.10 (0.66) 2.52 (1.06) 6.44 (1.28) 0.66 (0.52) 163.08 (0.98) �0.02 �0.00CI �60.09 (�1.61) 0.45 (1.54) 0.11 (0.70) 4.68 (1.50) 6.27 (1.16) 0.38 (0.40) 137.30 (0.80) �0.00 0.02EI �22.16 (�0.85) 0.13 (0.67) 0.12 (0.76) 2.58 (1.06) 3.99 (0.83) 0.55 (0.36) 134.84 (0.82) �0.03 �0.01
Post-1977CBIND 13.62 (1.40) �0.13 (�1.85) 0.03 (0.31) 1.85 (0.58) 5.99 (1.00) �1.78 (�1.84) �245.70 (�1.60) 0.10 0.01CBEXP 24.17 (2.71) �0.26 (�3.47) 0.06 (0.64) 2.11 (0.68) 7.02 (1.31) �1.82 (�1.93) �237.36 (�1.60) 0.15 0.06ICS 50.99 (3.58) �0.49 (�4.05) �0.01 (�0.08) �0.03 (�0.01) 5.45 (1.02) �1.90 (�2.17) �261.21 (�1.78) 0.17 0.08CI 63.60 (3.17) �0.54 (�3.52) �0.04 (�0.39) 0.77 (0.26) 2.49 (0.43) �2.03 (�2.50) �247.53 (�1.60) 0.18 0.09EI 35.96 (3.24) �0.38 (�3.88) 0.02 (0.20) 0.10 (0.03) 7.58 (1.42) �1.90 (�2.08) �248.58 (�1.72) 0.15 0.06
The
Review
of
Fin
ancia
lS
tudies
/v
19
n4
2006
15
12
at Biblioteque de la Sorbonne on October 24, 2012 http://rfs.oxfordjournals.org/ Downloaded from

Table 3(continued)
Intercept CONF LAGDEP DIV DEF YLD3 CAY R2 Incremental R2
Panel C: 12-month forecastsPre-1977
ICS �5.53 (�0.14) �0.05 (�0.18) 0.33 (2.10) 4.11 (0.99) �6.01 (�0.83) 1.72 (0.77) 480.95 (2.01) 0.09 �0.01CI �54.27 (�0.99) 0.32 (0.76) 0.33 (1.98) 7.13 (1.52) �3.56 (�0.39) 2.22 (1.32) 467.29 (1.92) 0.11 �0.00EI 0.82 (0.02) �0.12 (�0.40) 0.36 (2.37) 5.18 (1.17) �9.46 (�1.28) 1.43 (0.53) 455.85 (2.02) 0.11 �0.01
Post-1977CBIND 44.05 (2.59) �0.39 (�3.25) 0.03 (0.19) �0.72 (�0.13) 6.36 (0.60) �1.33 (�0.82) �657.66 (�2.08) 0.23 0.07CBEXP 65.95 (5.65) �0.70 (�8.52) 0.08 (0.71) �0.24 (�0.06) 11.28 (1.65) �1.53 (�1.07) �586.79 (�2.17) 0.37 0.21ICS 117.25 (5.63) �1.12 (�6.41) �0.01 (�0.11) �4.49 (�0.93) 8.60 (1.17) �1.98 (�1.50) �622.16 (�2.35) 0.36 0.20CI 116.58 (3.82) �1.00 (�4.36) �0.03 (�0.23) �1.13 (�0.22) 4.39 (0.45) �2.57 (�1.90) �570.29 (�1.97) 0.29 0.13EI 93.09 (5.76) –0.97 (�6.91) 0.03 (0.29) –5.27 (�1.11) 13.47 (1.98) –1.87 (�1.39) –603.94 (�2.34) 0.36 0.10
CAY, consumption-to-wealth ratio; CBEXP, the Expectations Index; CBIND, the Conference Board Index of Consumer Confidence; CI, the Index of Current EconomicConditions; DEF, the difference between Baa- and Aaa-rated bond yields; DIV, dividend yield on the CRSP value-weighted index; EI, Index of Consumer Expectations; ICS, theIndex of Consumer Sentiment; YLD3, yield on three-month Treasury bill; CONF, confidence measure; LAGDEP, lagged dependent variable.Regressions of size premium on lagged confidence control for lagged values of: dependent variable, DIV, DEF, YLD3, and CAY. Confidence is lagged additionally by onemonth because of data availability: month 2 confidence (along with month 3 controls) forecasts premium over months 4–6, 4–9, or 4–3. CBIND and CBEXP are availablebimonthly pre-1977, thus they do not appear in the pre-1977 quarterly regressions. Adjusted R2 and incremental adjusted R2 relative to the base regression that includes noconfidence are reported. Newey–West t-statistics for lag ¼ 2(K – 1), where K is data overlap are in parentheses. K ¼ 3, 3 and 9 for the nonoverlapping three-month forecasts (A)and the overlapping 6-month (B) and 12-month (C) forecasts, respectively.
Consu
mer
Confid
ence
and
Asset
Prices
15
13
at Biblioteque de la Sorbonne on October 24, 2012 http://rfs.oxfordjournals.org/ Downloaded from

consumer confidence from the University of Michigan survey. None of
the other forecasting variables are statistically significant, and all of the
adjusted R2 values in the regressions are negative. We do not report
results using the Conference Board data, because we have only 21 quar-
terly observations in the pre-1977 period. After 1977, we consistently
observe a strong negative relationship between consumer confidence
and the subsequent quarter’s size premium. Both YLD3 and CAY also
exhibit some forecasting power for the size premium. Neither DIV norDEF exhibit any evidence of consistent forecasting ability. The overall
adjusted R2 of the regressions ranges from 0.10 for the overall index from
the Conference Board to 0.16 for the index of current conditions from the
University of Michigan. The incremental increase in the adjusted R2 of
the regressions including consumer confidence as an additional predictor
ranges from 0.05 to 0.11. The values of the regression coefficients indicate
that a one standard deviation increase in the confidence measure implies a
corresponding decrease in the size premium of 3–5% over the subsequentquarter depending on the confidence index.
Panels B and C summarize quarterly forecasting regressions for the 6-
and the 12-month holding periods, respectively. The results are qualitatively
similar to those for the quarterly holding periods presented in Panel A.
Before 1977, consumer confidence has no forecasting power for the size
premium. After 1977, however, all of the confidence indices exhibit strong
forecasting power for the size premium over the different forecasting hor-
izons, the only exception being CBIND for the 6-month holding period. Asadditional robustness checks, we perform the analysis on the post-1977
subsample using the average confidence levels over the quarter instead of
quarter-end levels and without lagging confidence indicators by one addi-
tional month. The results are similar to our base results and are not
reported.
Overall, the results in the post-1977 period are consistent with both the
rational and the behavioral views that predict a link between current
levels of investor sentiment and the size premium. In the pre-1977 period,however, we find no evidence that consumer confidence is linked to the
size premium. The results are strikingly different for the two subperiods in
terms of sign, statistical significance and R2. In the remainder of the
article, we attempt to distinguish between the rational and the behavioral
views and to better understand the differences across the two subperiods.
3. Forecasting Future Economic Activity
In this section, we examine whether consumer confidence forecasts future
macroeconomic conditions in a manner that is consistent with its fore-
casting power for the size premium. Previous evidence suggests that
consumer confidence indicators forecast future economic activity. For
The Review of Financial Studies / v 19 n 4 2006
1514
at Biblioteque de la Sorbonne on O
ctober 24, 2012http://rfs.oxfordjournals.org/
Dow
nloaded from

example, Bram and Ludvigson (1998) and Ludvigson (2004) perform a
detailed comparison between the two US consumer sentiment surveys and
report that consumer sentiment forecasts various categories in future
household spending, with the Conference Board indicator generally
doing a better job overall. Garrett, Hernandez-Murillo, and Owyang
(2005) find that consumer confidence adds explanatory power for future
changes in retail spending in different states. The University of Michigan
Survey Research Center reports that consumers assess future economicconditions rather accurately. The corresponding correlation coefficients
are 0.74 for changes in interest rate (six months ahead), 0.80 for URATE
(nine months ahead), 0.90 for CPI (three months ahead), 0.90 for real
GDP growth (contemporaneous), 0.77 for house sales (six months
ahead), and 0.73 for vehicle sales (six months ahead).6
In Table 4, we test the forecasting ability of consumer confidence for
quarterly GDP growth, CONS, LABOR, and the change in URATE. In
addition to the lagged level of consumer confidence, the regressions alsoinclude lagged values of the dependent variable, DEF, DIV, and YLD3.
Following Bram and Ludvigson (1998), lagged growth in labor income is
included as an additional control. The table reports the coefficient esti-
mates and t-statistics on the lagged confidence measures and the incre-
mental adjusted R2 of the regressions due to the inclusion of confidence.
The coefficient estimates for the control variables are not reported. In the
pre-1977 period, the ability of consumer confidence to forecast changes
in future macroeconomic variables is generally weak with the exceptionthat two of the three University of Michigan indexes are statistically
significant predictors of GDP growth. For example, the relationship
between the University of Michigan ICS and GDP growth over the
next quarter is negative, indicating that GDP growth declines following
periods of high confidence. This finding is potentially consistent with a
precautionary savings argument—if higher confidence is associated with
lower uncertainty about the future and therefore a reduction in precau-
tionary saving, then high confidence will be associated with a higher levelof current consumption relative to future consumption and lower con-
sumption growth going forward. The coefficient estimates when using
CONS as the dependent variable, however, are not statistically signifi-
cant.
The forecasting power of consumer confidence for future macroeco-
nomic conditions improves significantly in the post-1977 period. The
components of consumer confidence that measure expectations (EI and
CBEXP) do a particularly good job predicting future economic activity,
6 This information is from the University of Michigan Survey Research Center Website. The reportedcorrelations are based on separate questions asked specifically about inflation, interest rates, and so on,which are not a part of the ICS.
Consumer Confidence and Asset Prices
1515
at Biblioteque de la Sorbonne on O
ctober 24, 2012http://rfs.oxfordjournals.org/
Dow
nloaded from

Table 4Consumer confidence as a predictor of economic activity
GDP CONS LABOR URCHG
Slope Incremental R2 Slope Incremental R2 Slope Incremental R2 Slope Incremental R2
A. Pre-1977ICS �0.0433 (�2.25) 0.04 �0.0090 (�0.58) �0.00 �0.0008 (�0.05) �0.01 0.0063 (0.98) �0.00CI �0.0357 (�1.79) 0.03 �0.0069 (�0.50) �0.01 �0.0028 (�0.20) �0.01 0.0074 (1.01) 0.00EI �0.0313 (�2.27) 0.03 �0.0105 (�0.83) �0.00 �0.0066 (�0.50) �0.00 0.0054 (1.24) 0.00
B. Post-1977CBIND 0.0046 (0.95) �0.00 0.0050 (1.63) 0.01 0.0071 (1.62) 0.01 0.0009 (0.47) �0.00CBEXP 0.0249 (3.48) 0.13 0.0188 (3.69) 0.11 0.0230 (3.48) 0.13 �0.0069 (�2.46) 0.04ICS 0.0206 (2.33) 0.03 0.0219 (3.54) 0.06 0.0312 (2.96) 0.10 �0.0066 (�2.17) 0.01CI 0.0033 (0.35) �0.01 0.0050 (0.59) �0.00 0.0154 (1.52) 0.02 0.0005 (0.10) �0.00EI 0.0253 (3.06) 0.07 0.0259 (4.36) 0.11 0.0327 (3.75) 0.14 –0.0089 (�2.69) 0.04
CBEXP, the Expectations Index; CBIND, the Conference Board Index of Consumer Confidence; CI, the Index of Current Economic Conditions; CONS, 100 times the change inthe natural log of personal consumption expenditures; EI, Index of Consumer Expectations; LABOR, 100 times the change in the natural log of labor income, measured as totalpersonal income net of dividend income, per capita, deflated by the PCE deflator; ICS, the Index of Consumer Sentiment; URCHG, growth in unemployment rate.The table reports the results of the regression of macroeconomic variables on lagged confidence indicators, controlling for the lagged dependent variable, labor income growth,default spread, dividend yield, and three-month Treasury bill yield. All variables are as defined in Table 1, except URCHG, the difference between end-of-quarter and beginning-of-quarter unemployment rate. Newey–West t-statistics are in parentheses. The incremental adjusted R2 is reported relative to the base regression that includes only laggeddependent variable and other controls but no confidence.
The
Review
of
Fin
ancia
lS
tudies
/v
19
n4
2006
15
16
at Biblioteque de la Sorbonne on October 24, 2012 http://rfs.oxfordjournals.org/ Downloaded from
especially for CONS and LABOR, as measured by the incremental
adjusted R2 of the regressions.7 Moreover, the relationship between lagged
consumer confidence and the macroeconomic variables changes signs com-
pared with the earlier period. In contrast, the components of confidence
related to current conditions (CI and CBIND) exhibit poor predictive
ability for future economic activity, both in terms of statistical significance
and in terms of the incremental R2 of the regressions. The positive relation-
ship between confidence and growth in consumption and labor income isnot consistent with the precautionary savings argument but is consistent
with the results of prior research in this area [see, e.g., Carroll, Fuhrer, and
Wilcox (1994), Bram and Ludvigson (1998), and Ludvigson (2004)].
Overall, the evidence indicates that consumer confidence contains
information regarding future macroeconomic conditions, at least in
the post-1977 period. The difference in the results across the two sub-
periods suggests that consumer confidence has become a much better
barometer of future economic activity in the last 25 years of our sampleperiod.
4. Fundamental and Sentiment Components of Confidence
The fact that consumer confidence has forecasting power for both the sizepremium and for future macroeconomic activity in the post-1977 period
provides some suggestive evidence consistent with a rational link between
sentiment and stock returns, particularly for small firms. However, the
behavioral and rational hypotheses are not mutually exclusive, and it is
possible that consumer confidence also reflects investor sentiment that is
unrelated to economic fundamentals. To explore this possibility, we sepa-
rate confidence into two components; one rooted in fundamentals and one
reflecting sentiment. To separate consumer confidence into the two compo-nents, we regress the various consumer confidence indexes on contempora-
neous and lagged values of a number of macro variables as shown below:
CONFt ¼ aþ b1DIVt þ b2DEFt þ b3YLD3t þ b4GDPt þ b5CONSt
þ b6LABORþ b7URATEt þ b8CPIt þ b9CAYt
þ b10DIVt�1 þ b11DEFt�1 þ b12YLD3t�1 þ b13GDPt�1
þ b14CONSt�1 þ b15LABORt�1 þ b16URATEt�1
þ b17CPIt�1 þ b18CAYt�1 þ �t ð1Þ
The predicted value from the regression is our measure of the
fundamental component of confidence, and the residual represents
sentiment. The regression has an adjusted R2 of about 0.8–0.85
7 We used our data to run tests similar to Bram and Ludvigson (1998). Our results are similar to theirs.Adding four lags of confidence improves forecasting ability for future consumption substantially whenwe use the CBIND and insignificantly if we use the University of Michigan index.
Consumer Confidence and Asset Prices
1517
at Biblioteque de la Sorbonne on O
ctober 24, 2012http://rfs.oxfordjournals.org/
Dow
nloaded from

depending on the confidence index used as the dependent variable (not
reported), indicating that a large part of the variation in consumer
confidence can be explained by economic fundamentals. As an alterna-
tive, we also augment regression (1) by including the leading values of
the macroeconomic variables in addition to the contemporaneous and
lagged values. The regression’s adjusted R2 increases only slightly by
about 5% from including the additional regressors. Although not
reported, the correlations between the predicted and the residual com-ponents obtained under the two alternative regression specifications are
closely aligned for all of the confidence measures. The correlations
between the predicted components range from 0.95 to 0.97, and the
correlations between the residual components of confidence range
between 0.82 and 0.89.
Table 5 compares our measure of the sentiment component of
confidence with two other measures of investor sentiment from the
literature. One widely used indicator of investor sentiment is the dis-count on closed-end funds. The finding that closed-end fund shares tend
to sell at prices difference from NAV (i.e., the ‘‘closed-end fund puzzle’’)
has motivated the argument that discounts on closed-end funds reflect
individual investor sentiment. In many papers, researchers, including
Lee, Shleifer, and Thaler (1991), Neal and Wheatley (1998), and Swami-
nathan (1996), find a relationship between fund discounts and small
stock returns. Recent evidence, however, suggests that closed-end fund
discounts may not be a good measure of investor sentiment. Qiu andWelch (2004) show that fund discounts do not align particularly well
Table 5Correlations between confidence residuals and other sentiment measures
Pre-1977 Post-1977
CBIND CBEXP ICS CI EI CBIND CBEXP ICS CI EI
SENT NA NA �0.47 �0.62 �0.30 0.32 0.29 0.30 �0.06 0.46CEFD �0.05 0.14 �0.13 �0.36 0.00 �0.11 �0.01 0.06 �0.04 0.12
CAY, consumption-to-wealth ratio; CBEXP, the Expectations Index; CBIND, the Conference BoardIndex of Consumer Confidence; CI, the Index of Current Economic Conditions; CONS, 100 times thechange in the natural log of personal consumption expenditures; CPI, inflation rate, CRSP, cumulatedover three months DEF, the difference between Baa- and Aaa-rated bond yields; DIV, dividend yield onthe CRSP value-weighted index; DIV, dividend yield on the CRSP value-weighted index; EI, Index ofConsumer Expectations; GDP, 100 times the change in the natural log of chained gross domestic product;ICS, the Index of Consumer Sentiment; LABOR, 100 times the change in the natural log of labor income,measured as total personal income net of dividend income, per capita, deflated by the PCE deflator;URATE, unemployment rate, averaged over three months; YLD3, yield on three-month Treasury bill.Correlations of confidence residuals with the sentiment measure (SENT) of Baker and Wurgler (2005)and closed-end fund discounts (CEFD) from Brown and Cliff (2004). Confidence residuals estimatedfrom regressing confidence on contemporaneous and lagged [regression (1)] values of DIV, DEF, YLD3,GDP, CONS, LABOR, URATE, CPI, and CAY.
The Review of Financial Studies / v 19 n 4 2006
1518
at Biblioteque de la Sorbonne on O
ctober 24, 2012http://rfs.oxfordjournals.org/
Dow
nloaded from
with either the consumer confidence indicators or the UBS/Gallup investor
sentiment data, and Brown and Cliff (2004) detect only a weak relationship
between fund discounts and the measure of investor sentiment from the
American Association of Individual Investors survey.
In a recent paper, Baker and Wurgler (2005) create an index of investor
sentiment based on several commonly used sentiment variables: the value-
weighted dividend premium, the number of IPOs, the average first-day
IPO return, the value-weighted CEFD, the equity share in new issues, andNYSE turnover. They extract the first principal component of these
sentiment measures and regress it on several macroeconomic variables,
including the industrial production index, personal consumption expen-
ditures, and a recession indicator as defined by the NBER data. The
residual from the regression is their primary measure of investor senti-
ment unwarranted by economic fundamentals.
Table 5 reports correlations among our measure of residual confidence
based on regression (1), CEFD, and the Baker and Wurgler sentimentmeasure (SENT). We use quarter-end values of the CEFD that corre-
spond to the reporting of our consumer confidence data and year-end
values of the Baker and Wurgler measure as their data are only available
on an annual basis.8
In the case of the Baker and Wurgler measure, the difference between the
two subperiods is rather striking. Before 1977, the correlations between
SENT and residual consumer confidence are negative for all of the indexes,
indicating that low levels of residual confidence are associated with higherlevels of sentiment as measured by the Baker and Wurgler measure. After
1977, the correlations mostly have the expected positive sign, the exception
being the correlation of SENT with the residual measure of confidence
computed from the index of current conditions from the University of
Michigan survey. For CEFD, the correlations are generally weak in both
of the subperiods and the signs of the correlations are not consistent across
the different residual confidence measures. The results show that sentiment
as measured by the component of consumer confidence unrelated to macro-economic conditions is only weakly correlated with measures of sentiment
based on stock market variables. The evidence is consistent with the findings
of Qiu and Welch (2004), who also find relatively small correlations between
changes in CEFD’s and the overall confidence measures.
5. Consumer Confidence and the Size Premium (Revisited)
In this section, we revisit the link between consumer confidence and
the size premium based on our decomposition of consumer confidence
8 For robustness, we estimated confidence residuals using year-end observations of macroeconomic vari-ables, such that our residual data were available on the annual basis to begin with. Comparing thoseresiduals to the measures used by Baker and Wurgler (2005) yields similar results.
Consumer Confidence and Asset Prices
1519
at Biblioteque de la Sorbonne on O
ctober 24, 2012http://rfs.oxfordjournals.org/
Dow
nloaded from

into fundamental and residual components. To do so, we estimate the
following time-series regression for the portfolio long in stocks repre-
senting the smallest size decile and short in stocks representing the
largest size decile (M110).
Rt ¼ ða1 þ a2RESt�1Þ þ ðb1 þ b2CONFt�1ÞRmt þ "t, ð2Þ
where Rt is the three-month holding period return on the M110 portfolio
for quarter t, and where RESt-1 and CONFt-1 are the lagged values of the
residual (sentiment) component of consumer confidence and the raw level
of confidence respectively, and Rm,t is the excess return on the CRSP
value-weighted index. In this regression, we allow the conditional market
beta to be a function of consumer confidence and allow the pricing errorto depend on the residual component of confidence. To the extent that
consumer confidence rationally forecasts changes in the business cycle
that are correlated with changes in the market betas of small stocks, we
expect that the coefficient b2 will be negative. If, however, variation in the
size premium is also affected by noise-trader sentiment that is unrelated to
fundamentals, we expect the coefficient a2 to be negative. The results are
reported in Table 6. Based on our prior evidence, we report results only
for the post-1977 period.As seen in the table, the results provide some support for both hypoth-
eses. For all of the confidence measures, the coefficient estimate on the
residual component of confidence and the estimate for the interaction
between the confidence measure and the return on the market index are
negative and statistically significant. The coefficient estimates on the
residual component of confidence are all significant at the 0.01 level,
and the coefficient estimates on the interaction of lagged confidence
with the market return are all significant at the 0.10 level or better. Theoverall adjusted R2 of the regressions ranges from 0.09 to 0.17.
In terms of economic significance, as summarized in the table, the
incremental adjusted R2 of the regressions because of residual confidence
is between 0.05 and 0.10 depending on the confidence index. For compar-
ison (not reported), the incremental adjusted R2 because of the interaction
term between confidence and the market excess return is between 0.02 and
0.06. The table also reports the value of the average pricing errors a ¼ a1
+ a2 RESt�1 over all the observations where the confidence residual isbelow its median value (alow) and over all the observations where the
confidence residual is above median value (ahigh). The difference between
the two is the quarterly return difference in the size premium in periods of
low versus high confidence. The magnitude of this difference is quite large
ranging from 2.98 to 4.93% per quarter. For comparison, although not
reported, the difference in returns that can be accounted for by changes in
The Review of Financial Studies / v 19 n 4 2006
1520
at Biblioteque de la Sorbonne on O
ctober 24, 2012http://rfs.oxfordjournals.org/
Dow
nloaded from

Table 6Size premium regressed on the sentiment component of consumer confidence, controlling for the business cycle variations of the conditional market beta
CBIND CBEXP ICS CI EI
Intercept �0.19 (�0.18) �2.11 (�1.27) �0.14 (�0.13) �2.15 (�1.29) �0.21 (�0.23) �1.30 (�0.89) �0.05 (�0.06) �1.09 (�0.76) �0.26 (�0.27) �1.57 (�1.02)RESt � 1 �0.24 (�3.66) �0.27 (�3.52) �0.25 (�3.33) �0.27 (�3.43) �0.61 (�5.51) �0.66 (�4.72) �0.61 (�4.57) �0.57 (�3.48) �0.44 (�4.86) �0.49 (�4.36)CEFDt – 1 �0.23 (�2.04) �0.20 (�1.58) �0.10 (�0.89) �0.11 (�1.18) �0.12 (�1.04)Rm,t 1.06 (2.35) 2.16 (1.83) 1.26 (2.36) 1.04 (1.04) 2.13 (3.48) 3.93 (3.98) 2.23 (3.29) 3.40 (2.75) 1.79 (3.53) 2.80 (2.92)CONFt – 1Rm,t �0.01 (�1.83) �0.02 (�2.00) �0.01 (�1.99) �0.01 (�1.41) �0.02 (�2.95) �0.04 (�4.24) �0.02 (�2.86) �0.03 (�2.98) �0.02 (�2.89) �0.03 (�3.30)DIVt – 1Rm,t 0.18 (1.13) 0.32 (2.03) 0.16 (1.21) 0.18 (1.24) 0.20 (1.34)DEFt – 1Rm,t �0.85 (�2.69) �0.54 (�1.95) �0.78 (�3.19) �0.68 (�2.57) �0.68 (�2.48)YLD3t – 1Rm,t 0.05 (1.21) 0.00 (0.07) 0.02 (0.46) 0.01 (0.36) 0.01 (0.18)CAYt – 1Rm,t �24.23 (�2.47) �19.40 (�2.13) �25.17 (�2.82) �19.59 (�1.80) �25.24 (�2.79)HMLt 0.23 (0.93) 0.24 (0.97) 0.28 (1.20) 0.22 (0.92) 0.28 (1.21)MTMt �0.03 (�0.27) 0.04 (0.28) 0.10 (0.90) 0.04 (0.31) 0.09 (0.70)R2 0.10 0.14 0.09 0.12 0.17 0.20 0.17 0.18 0.14 0.17Incremental R2 0.05 0.05 0.05 0.06 0.10 0.11 0.10 0.08 0.07 0.08alow 1.29 �0.48 1.44 �0.43 2.07 1.15 2.38 1.20 1.67 0.57ahigh �1.69 �3.78 �1.75 �3.91 �2.53 �3.80 �2.44 �3.42 �2.22 �3.75alow – ahigh 2.98 3.30 3.20 3.48 4.60 4.95 4.93 4.62 3.89 4.33
Size premium M110 regressed over 1978–2002 on lagged confidence residual RES with the market beta conditioned on lagged confidence and other macroeconomic variables, controlling for laggedclosed-end fund discounts (CEFD), value factor (HML), and momentum factor (MTM):
Rt ¼ a1 þ a2RESt�1 þ ðb1 þ b2CONFt�1ÞRm;t:
Rt ¼ a1 þ a2RESt�1 þ a3CEFDt�1 þ ðb1 þ b2CONFt�1 þ b3DIVt�1 þ b4DEFt�1 þ b5YLD3t�1 þ b6CAYt�1ÞRm;t þ c1HMLt þ c2MTMt
Confidence residuals are estimated at the first stage from regressing confidence on contemporaneous and lagged [regression (1)] values of DIV, DEF, YLD3, GDP, CONS, LABOR, URATE, CPI, andCAY. Also reported are adjusted R2; incremental adjusted R2 relative to the base regression that includes all independent regressors above but no confidence residual; pricing error a¼ a1 + a2RESt – 1 for theobservations where lagged confidence residuals are below median (low) and above median (high); the difference between a(low) and a(high). Newey–West t-statistics for lag ¼ 2(K – 1), K ¼ 3 are inparentheses.
Consu
mer
Confid
ence
and
Asset
Prices
15
21
at Biblioteque de la Sorbonne on October 24, 2012 http://rfs.oxfordjournals.org/ Downloaded from

the market betas across periods of low and high confidence is between
0.73 and 1.09%.
To assess the robustness of our results, we report in Table 6 the
results from regressions that allow the market betas to vary directly
with other variables (DIV, DEF, YLD3, and CAY) in addition to
consumer confidence and that also include the returns on the book-
to-market (HML) and momentum (MTM) factors as additional expla-
natory variables. We do not include the size factor (SMB), because ourdependent variable is highly correlated with SMB by construction.
Finally, the regressions also include CEFD as an additional measure
of investor sentiment. As seen in the table, the basic results are
unchanged. The residual component of consumer confidence continues
to be statistically significant in all of the regressions. In contrast, CEFD
is only statistically significant in one of the regressions, indicating that
fund discounts are not consistently related to variation in the size
premium after controlling for the sentiment component of consumerconfidence. The incremental adjusted R2 of the regressions because of
residual confidence is between 0.05 and 0.11 depending on the confi-
dence index. The incremental adjusted R2 because of the interaction
term of the market return with the macroeconomic variables (not
reported) is between 0.03 and 0.09, indicating that time variation in
market beta is also an important component of the time-series variation
in the size premium. In addition, although not reported in the table, we
also re-estimate all of the regressions using the residual confidencemeasure based on the augmented version of regression (1) that also
includes leading observations of the macro variables. The results are
qualitatively identical to those reported, although the statistical signifi-
cance is slightly weaker.9
The noise-trader hypothesis proposed by Lee, Shleifer, and Thaler
(1991) argues that sentiment should affect stock returns for assets pre-
dominantly held by noise traders. Furthermore, they suggest that indivi-
dual traders are more likely to be affected by sentiment and provideevidence that small firms are more widely held by individuals. Therefore,
to provide additional evidence on whether the forecasting ability of the
residual component of consumer confidence is consistent with the noise-
trader hypothesis, we perform the same regression analysis in Table 6 but
using the difference in returns between the lowest and the highest institu-
tional ownership deciles (IO110) as the dependent variable. The results
for the post-1977 period are reported in Table 7. In addition, we also
9 We also performed simultaneous estimation of the decomposition of confidence into its fundamental andsentiment components from equation (1) and the forecasting regressions in equation (2) using GMM. Todo so, however, we had to eliminate the lagged macro variables from Equation (1) to have sufficientdegrees of freedom to estimate the system. The sentiment component of confidence remained statisticallysignificant in all of the regressions.
The Review of Financial Studies / v 19 n 4 2006
1522
at Biblioteque de la Sorbonne on O
ctober 24, 2012http://rfs.oxfordjournals.org/
Dow
nloaded from
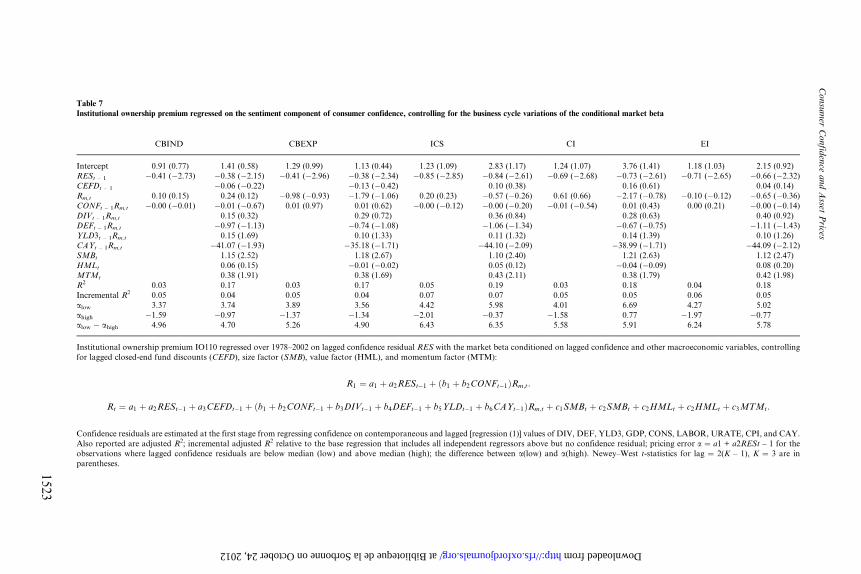
Table 7
Institutional ownership premium regressed on the sentiment component of consumer confidence, controlling for the business cycle variations of the conditional market beta
CBIND CBEXP ICS CI EI
Intercept 0.91 (0.77) 1.41 (0.58) 1.29 (0.99) 1.13 (0.44) 1.23 (1.09) 2.83 (1.17) 1.24 (1.07) 3.76 (1.41) 1.18 (1.03) 2.15 (0.92)RESt – 1 �0.41 (�2.73) �0.38 (�2.15) �0.41 (�2.96) �0.38 (�2.34) �0.85 (�2.85) �0.84 (�2.61) �0.69 (�2.68) �0.73 (�2.61) �0.71 (�2.65) �0.66 (�2.32)
CEFDt – 1 �0.06 (�0.22) �0.13 (�0.42) 0.10 (0.38) 0.16 (0.61) 0.04 (0.14)
Rm,t 0.10 (0.15) 0.24 (0.12) �0.98 (�0.93) �1.79 (�1.06) 0.20 (0.23) �0.57 (�0.26) 0.61 (0.66) �2.17 (�0.78) �0.10 (�0.12) �0.65 (�0.36)
CONFt – 1Rm,t �0.00 (�0.01) �0.01 (�0.67) 0.01 (0.97) 0.01 (0.62) �0.00 (�0.12) �0.00 (�0.20) �0.01 (�0.54) 0.01 (0.43) 0.00 (0.21) �0.00 (�0.14)
DIVt – 1Rm,t 0.15 (0.32) 0.29 (0.72) 0.36 (0.84) 0.28 (0.63) 0.40 (0.92)DEFt – 1Rm,t �0.97 (�1.13) �0.74 (�1.08) �1.06 (�1.34) �0.67 (�0.75) �1.11 (�1.43)
YLD3t – 1Rm,t 0.15 (1.69) 0.10 (1.33) 0.11 (1.32) 0.14 (1.39) 0.10 (1.26)
CAYt – 1Rm,t �41.07 (�1.93) �35.18 (�1.71) �44.10 (�2.09) �38.99 (�1.71) �44.09 (�2.12)
SMBt 1.15 (2.52) 1.18 (2.67) 1.10 (2.40) 1.21 (2.63) 1.12 (2.47)
HMLt 0.06 (0.15) �0.01 (�0.02) 0.05 (0.12) �0.04 (�0.09) 0.08 (0.20)MTMt 0.38 (1.91) 0.38 (1.69) 0.43 (2.11) 0.38 (1.79) 0.42 (1.98)
R2 0.03 0.17 0.03 0.17 0.05 0.19 0.03 0.18 0.04 0.18
Incremental R2 0.05 0.04 0.05 0.04 0.07 0.07 0.05 0.05 0.06 0.05
alow 3.37 3.74 3.89 3.56 4.42 5.98 4.01 6.69 4.27 5.02
ahigh �1.59 �0.97 �1.37 �1.34 �2.01 �0.37 �1.58 0.77 �1.97 �0.77alow � ahigh 4.96 4.70 5.26 4.90 6.43 6.35 5.58 5.91 6.24 5.78
Institutional ownership premium IO110 regressed over 1978–2002 on lagged confidence residual RES with the market beta conditioned on lagged confidence and other macroeconomic variables, controlling
for lagged closed-end fund discounts (CEFD), size factor (SMB), value factor (HML), and momentum factor (MTM):
R1 ¼ a1 þ a2RESt�1 þ ðb1 þ b2CONFt�1ÞRm;t:
Rt ¼ a1 þ a2RESt�1 þ a3CEFDt�1 þ ðb1 þ b2CONFt�1 þ b3DIVt�1 þ b4DEFt�1 þ b5YLDt�1 þ b6CAYt�1ÞRm;t þ c1SMBt þ c2SMBt þ c2HMLt þ c2HMLt þ c3MTMt:
Confidence residuals are estimated at the first stage from regressing confidence on contemporaneous and lagged [regression (1)] values of DIV, DEF, YLD3, GDP, CONS, LABOR, URATE, CPI, and CAY.
Also reported are adjusted R2; incremental adjusted R2 relative to the base regression that includes all independent regressors above but no confidence residual; pricing error a ¼ a1 + a2RESt – 1 for the
observations where lagged confidence residuals are below median (low) and above median (high); the difference between a(low) and a(high). Newey–West t-statistics for lag ¼ 2(K – 1), K ¼ 3 are in
parentheses.
Consu
mer
Confid
ence
and
Asset
Prices
15
23
at Biblioteque de la Sorbonne on October 24, 2012 http://rfs.oxfordjournals.org/ Downloaded from

include the returns on the SMB factor to ensure that our results are not
driven by the correlation between institutional ownership and firm size
[e.g., Nagel (2005)]. The pattern observed is similar to that found for the
size premium. The coefficient estimate on the residual component of
confidence is negative and statistically significant at the 0.05 level in all
of the regressions indicating that, similar to the results for the size
premium, the returns on stocks with low institutional ownership decline
relative to the returns on stocks with high institutional ownership follow-ing periods when sentiment is high.
Overall, the results generally support the view that sentiment unrelated
to macroeconomic fundamentals can affect the prices of assets that are
predominantly held by noise traders (i.e., small stocks and stocks with
low levels of institutional ownership). Nevertheless, a caveat is in order.
Although we allow the market beta to vary with a variety of macroeco-
nomic variables and also include other factors that have been shown to
help explain the cross-section of expected stock returns in other studies,the possibility remains that our measure of sentiment is a proxy for an
omitted risk factor. To provide some evidence on this possibility, Figure 2
-15
-10
-5
0
5
10
15
1980.03 1980.09 1981.09 1982.12 1990.09 1991.03 2001.03 2001.12
date
NB
ER
in
dic
ato
r o
f p
eaks a
nd
tro
ug
hs;
co
nte
mp
ora
neo
us s
en
tim
en
t;
ne
xt
qu
art
er'
s p
ort
ion
of
the s
ize
pre
miu
m f
ore
cas
tab
le b
ased
on
cu
rren
t se
nti
me
nt
NBER sentiment next quarter's sentiment-based forecast of the size premium
Figure 2This graph presents the result of a two-stage regression. On the first stage, the size-premium M110 isregressed on the market return (with the market beta conditioned on a set of lagged macroeconomicvariables), HML, and MTM over 1978–2002. In the second stage, the first-stage size-premium residual isregressed on lagged consumer ‘‘sentiment’’ component (the University of Michigan index is taken for thisgraph). The predicted value from the second-stage regression is plotted here against the sentimentcomponent and against the NBER peaks (NBER ¼ 10) and troughs (NBER ¼ –10). Sentiment iscontemporaneous with the NBER indicator. The predicted value of the size premium is for the quarterfollowing the peak (recession).
The Review of Financial Studies / v 19 n 4 2006
1524
at Biblioteque de la Sorbonne on O
ctober 24, 2012http://rfs.oxfordjournals.org/
Dow
nloaded from

plots the peaks and troughs of the business cycle as defined by the NBER
data along with the contemporaneous sentiment level computed using the
ICS measure of confidence and along with the portion of the following
quarter’s size premium that is forecastable based on sentiment.10 To the
extent that investor-sentiment proxies for an omitted macroeconomic risk
factor, one would expect sentiment to be procyclical. As seen in the figure,
however, this does not appear to be the case. Specifically, the sentiment
component of confidence is essentially unrelated to the state of theeconomy over the eight reported business cycle peaks and troughs during
our sample period. Furthermore, the sentiment-based forecast of the
following quarter’s size premium is negatively related to sentiment but
not to the business cycle.11
6. Consumer Confidence and the Value and Momentum Premiums
Based on arguments in the prior literature, our analysis focuses on the
link between the consumer confidence and the returns on small stocks and
stocks held primarily by individuals. In this section, we explore whether
the sentiment component of consumer confidence is also related to the
time-series variation of returns to value and momentum strategies. Bakerand Wurgler (2005) suggest that both extreme growth and distressed firms
are prone to speculation and are also difficult to arbitrage and so should
be most affected by investor sentiment. Using their measure of investor
sentiment, they find that both extreme growth and value stocks earn high
returns following periods of low sentiment and earn low returns following
periods when sentiment is high. Cooper, Gutierrez, and Hameed (2004)
find that momentum profits conditional on positive past market returns
are significantly larger than momentum profits following negative marketreturns. They view their results as being consistent with an extended
version of the behavioral theory developed by Daniel, Hirshleifer, and
Subrahmanyam (1998) in which overconfidence of investors in the aggre-
gate increases following market gains, resulting in higher momentum
profits following periods of positive market returns. We re-examine
these findings using our residual confidence measure as an alternative
measure of investor sentiment.
To do so, we estimate the extended version of regression (2) that allowsfor time variation in market beta with confidence as well as the other
10 The forecastable portion of the size premium based on sentiment is computed in two stages. First, weestimate the regression in column 6 of Table 6 for ICS, which allows for time variation in market beta andalso includes the HML and MTM factors, but we exclude the confidence residual and CEFD from theregression. Second, the residual size premium from that regression is regressed on the lagged sentimentcomponent of confidence. The predicted value of the second-stage regression is retained.
11 Interestingly, when we plot the NBER indicator against the lagged quarterly sentiment level, thecorrelation is negative. In other words, the sentiment component of confidence tends to be low beforethe peak of an expansion, resulting in a positive contemporaneous correlation between the sentiment-based forecast of the size premium and the state of the economy.
Consumer Confidence and Asset Prices
1525
at Biblioteque de la Sorbonne on O
ctober 24, 2012http://rfs.oxfordjournals.org/
Dow
nloaded from
macroeconomic variables and with the difference between the returns on
portfolios in the highest and lowest deciles of stocks sorted on either
book-to-market or past returns as dependent variables instead of the
size premium.12 The results (not reported) show that the confidence-
based sentiment measures do not exhibit any significant predictive
power for either of the high minus low portfolios. The result for the
book-to-market portfolio is similar to that reported by Swaminathan
(1996), who finds that the CEFD forecasts the size premium but not thereturns to the book-to-market factor of Fama and French (1993).13 The
fact that our residual confidence measure does not forecast the momen-
tum premium suggests that it captures different information about inves-
tor sentiment than what is contained in past market returns.
To explore further, we re-estimate the regressions using excess returns
on value and growth and past winner and loser stocks separately as the
dependent variables. We find evidence (not reported) that value stocks
tend to respond to changes in sentiment. Specifically, the subsequentreturns on value stocks are higher following periods of low sentiment
and lower following periods of high sentiment. We find no evidence,
however, that growth stocks respond to changes in sentiment. This find-
ing differs from the U-shaped pattern between sentiment and the returns
on portfolios sorted by book-to-market reported in Baker and Wurgler
(2005). Providing some support for our result, however, Kumar and Lee
(2005) find that retail investors tend to overweight value stocks relative to
growth stocks in their portfolios. They also report a positive contempora-neous correlation between the buy–sell imbalance of retail traders and the
returns on high book-to-market stocks, but no correlation between the
buy–sell imbalance and the returns on stocks with low book to market,
suggesting that sentiment shifts of individual investors are more impor-
tant for value stocks. With respect to portfolios sorted on past returns, we
find no evidence that our measure of sentiment forecasts the subsequent
returns on either past winner or past loser stocks. In sum, understanding
what factors drive time-series variation in the value and momentumpremiums and the role that investor sentiment plays in explaining this
variation remains an unresolved question in our opinion.
7. Concluding Remarks
We find evidence that over the last two decades consumer confidence
exhibits forecasting power for the returns on small stocks and for future
12 The regressions also include the returns on the small-minus-big (SMB) and momentum (MTM) factors inthe case where the book-to-market premium is used as the dependent variable and the SMB and high-minus-low (HML) factors when the momentum premium is used as the dependent variable.
13 Baker and Wurgler (2005) also find that their measure of sentiment does not forecast returns to aportfolio long high book-to-market stocks and short low book-to-market stocks.
The Review of Financial Studies / v 19 n 4 2006
1526
at Biblioteque de la Sorbonne on O
ctober 24, 2012http://rfs.oxfordjournals.org/
Dow
nloaded from

macroeconomic activity. We estimate the components of consumer con-
fidence related to economic fundamentals and investor sentiment and
model the size premium, allowing market beta to vary with consumer
confidence and other macro variables. Our evidence indicates that the
sentiment component of confidence forecasts time-series variation in the
size premium after allowing for time-series variation in market beta. We
view our results as consistent with the predictions of models in which limits
of arbitrage and correlated trading by noise traders (individual investors)can cause prices of assets predominantly held by these investors to deviate
from economic fundamentals. Consistent with this view, we find that the
sentiment component of confidence also forecasts returns on stocks pri-
marily held by individuals (i.e., stocks with low institutional ownership).
We also find that the sentiment component of consumer confidence is
not strongly related to either the closed-end fund discount or the compo-
site measure of sentiment constructed by Baker and Wurgler (2005). This
evidence suggests that the different measures either capture some unre-lated components of investor sentiment or perhaps fail altogether to
capture some important aspects of sentiment. Finally, we find no evidence
that the confidence-based measure of sentiment forecasts the time-series
variation in returns to value and momentum strategies.
One puzzling feature of our results is that the relationship between
consumer confidence and subsequent stock returns and macroeconomic
activity is nonexistent in the period before 1977. For whatever reason,
consumer confidence appears to have become a much better barometerof economic activity and of investor attitudes in the last 25 years. One
possible explanation is that the dynamics of the participation of households
in the equity markets has changed over time. For example, Schlarbaum,
Lewellen, and Lease (1978) study common stock trades of individual retail
investors at a full-service brokerage firm during 1964–1970 and provide
evidence of prudent security selection decisions made by these investors. In
contrast, Barber and Odean (2000) study a sample of individual house-
holds’ common stock positions held directly through discount brokerageaccounts during 1991–1996 and find strong evidence of irrational biases
that affect individual trading. Obtaining a more thorough understanding of
the information contained in the consumer confidence data and its link to
stock returns remains a topic for future research.
ReferencesAcemoglu, D., and A. Scott, 1994, ‘‘Consumer Confidence and Rational Expectations: Are Agents’Beliefs Consistent with the Theory?,’’ Economic Journal, 104, 1–19.
Baker, M., and J. Wurgler, 2005, ‘‘Investor Sentiment and the Cross-Section of Stock Returns,’’Journal ofFinance [Epub ahead of print].
Barber, B. M., and T. Odean, 2000, ‘‘Trading is Hazardous to Your Wealth: The Common StockInvestment Performance of Individual Investors,’’ Journal of Finance, 55, 773–806.
Consumer Confidence and Asset Prices
1527
at Biblioteque de la Sorbonne on O
ctober 24, 2012http://rfs.oxfordjournals.org/
Dow
nloaded from

Bram, J., and S. Ludvigson, 1998, ‘‘Does Consumer Confidence Forecast Household Expenditure? ASentiment Index Horse Race,’’ FRBNY Policy Review, 59–78.
Brown, G. W., and M. T. Cliff, 2004, ‘‘Investor Sentiment and the Near-Term Stock Market,’’ Journal ofEmpirical Finance, 11, 1–27.
Carroll, C. D., J. C. Fuhrer, and D. W. Wilcox, 1994, ‘‘Does Consumer Sentiment Forecast HouseholdSpending? If So, Why?,’’ American Economic Review, 84, 1397–1408.
Chan, K. C., and N. F. Chen, 1991, ‘‘Structural and Return Characteristics of Small and Large Firms,’’Journal of Finance, 46, 1467–1484.
Charoenrook, A., 2002, ‘‘Change in Consumer Sentiment Index and Aggregate Stock Returns,’’ workingpaper, Vanderbilt University.
Chen, N. F., 1991, ‘‘Financial Investment Opportunities and the Macroeconomy,’’ Journal of Finance, 46,529–554.
Chen, N. F., R. Kan, and M. H. Miller, 1993, ‘‘Are the Discounts on Closed-End Funds a SentimentIndex?,’’ Journal of Finance, 48, 795–800.
Chen, N. F., R. Roll, and S. A. Ross, 1986, ‘‘Economic Forces and the Stock Market,’’ Journal ofBusiness, 59, 383–403.
Cooper, M. J., R. C. Gutierrez, and A. Hameed, 2004, ‘‘Market States and Momentum,’’ Journal ofFinance, 59, 1345–1365.
Daniel, K., D. Hirshleifer, and A. Subrahmanyam, 1998, ‘‘Investor Psychology and Security MarketUnder- and Overreactions,’’ Journal of Finance, 53, 1839–1867.
Delong, J. B., A. Shleifer, L. H. Summers, and R. J. Waldman, 1990, ‘‘Positive Feedback InvestmentStrategies and Destabilizing Rational Speculation,’’ Journal of Finance, 45, 379–396.
Doms, M., and N. Morin, 2004, ‘‘Consumer Sentiment, the Economy, and the News Media,’’ workingpaper, Federal Reserve Bank of San Francisco.
Doukas, J. A., and N. T. Milonas, 2002, ‘‘Investor Sentiment and the Closed-End Fund Puzzle: Out-of-Sample Evidence,’’ working paper, New York University.
Fama, E. F., and K. French, 1988, ‘‘Dividend Yields and Expected Stock Returns,’’ Journal of FinancialEconomics, 22, 3–25.
Fama, E. F., and K. French, 1992, ‘‘The Cross-Section of Expected Stock Returns,’’ Journal of Finance,47, 427–465.
Fama, E. F., and K. French, 1993, ‘‘Common Risk Factors in Return on Stocks and Bonds,’’ Journal ofFinancial Economics, 33, 3–56.
Fisher, K. L., and M. Statman, 2002, ‘‘Consumer Confidence and Stock Returns,’’ working paper, SantaClara University.
Garrett, T. A., R. Hernandez-Murillo, and M. T. Owyang, 2005, ‘‘Does Consumer Sentiment PredictRegional Consumption?,’’ FRB St. Louis - Review, 87, 123–135.
Jagannathan, R., and Z. Wang, 1996, ‘‘The Conditional CAPM and the Cross-Section of ExpectedReturns,’’ Journal of Finance, 51, 3–53.
Kumar, A., and C. M. C. Lee, 2005, ‘‘Retail Investor Sentiment and Return Comovements,’’ Journal ofFinance [Epub ahead of print].
Lee, B. S., 1992, ‘‘Casual Relations Among Stock Returns, Interest Rates, Real Activity, and Inflation,’’Journal of Finance, 47, 1592–1603.
Lee, C. M. C., A. Shleifer, and R. H. Thaler, 1991, ‘‘Investor Sentiment and the Closed-End FundPuzzle,’’ Journal of Finance, 46, 75–109.
The Review of Financial Studies / v 19 n 4 2006
1528
at Biblioteque de la Sorbonne on O
ctober 24, 2012http://rfs.oxfordjournals.org/
Dow
nloaded from

Lettau, M., and S. Ludvigson, 2001, ‘‘Resurrecting the (C)CAPM: A Cross-Sectional Test when RiskPremia are Time-Varying,’’ Journal of Political Economy, 109, 1238–1287.
Ludvigson, S., 2004, ‘‘Consumer Confidence and Consumer Spending,’’ Journal of Economic Perspectives,18, 29–50.
Ludvigson, S. C., and S. Ng, 2005, ‘‘The Empirical Risk-Return Relation: A Factor Analysis Approach,’’working paper #11477, NBER, forthcoming, Journal of Financial Economics.
Nagel, S., 2005, ‘‘Short Sales, Institutional Investors and the Cross-Section of Stock Returns,’’ Journal ofFinancial Economics, 78, 277–309.
Neal, R., and S. M. Wheatley, 1998, ‘‘Do Measures of Investor Sentiment Predict Market Returns?,’’Journal of Financial and Quantitative Analysis, 33, 523–547.
Nelson, C. R., 1976, ‘‘Inflation and Rates of Return on Common Stocks,’’ Journal of Finance, 31, 471–483.
Phalippou, L., 2005, ‘‘Institutional Ownership and the Value Premium,’’ working paper, INSEAD.
Qiu, L., and I. Welch, 2004, ‘‘Investor Sentiment Measures,’’ working paper #10794, NBER.
Schlarbaum, G. G., W. G. Lewellen, and R. C. Lease, 1978, ‘‘The Common Stock Portfolio PerformanceRecord of Individual Investors: 1964–1970,’’ Journal of Finance, 33, 429–441.
Swaminathan, B., 1996, ‘‘Time-Varying Expected Small Firm Returns and Closed-End Fund Discounts,’’Review of Financial Studies, 9, 845–887.
Consumer Confidence and Asset Prices
1529
at Biblioteque de la Sorbonne on O
ctober 24, 2012http://rfs.oxfordjournals.org/
Dow
nloaded from
Recommended


![[Longstaff] Electricity Forward Prices - A High Frequency Empirical Analysis](https://img.dokumen.tips/doc/110x75/577cdf411a28ab9e78b0ce0d/longstaff-electricity-forward-prices-a-high-frequency-empirical-analysis.jpg)