zxcv Copyright © 2014 TAIYO HOLDINGS CO., LTD. All Rights Reserved.
Consolidated Financial Result Digest FY2015 Q2 (Fiscal Year Ended March 31, 2015)
TAIYO HOLDINGS CO., LTD
October 31, 2014
Any information incorporated in this document is not intended for suggestion of purchase or sale of equity share of the company. All the description and projection are based on the company's own analysis at the time of compilation, and their accuracy is not guaranteed. These data may be revised without prior announcement. The company will neither assume nor compensate any loss of anybody resulting from decision based on information provided here.
Z
zxcv Copyright © 2014 TAIYO HOLDINGS CO., LTD. All Rights Reserved. 1
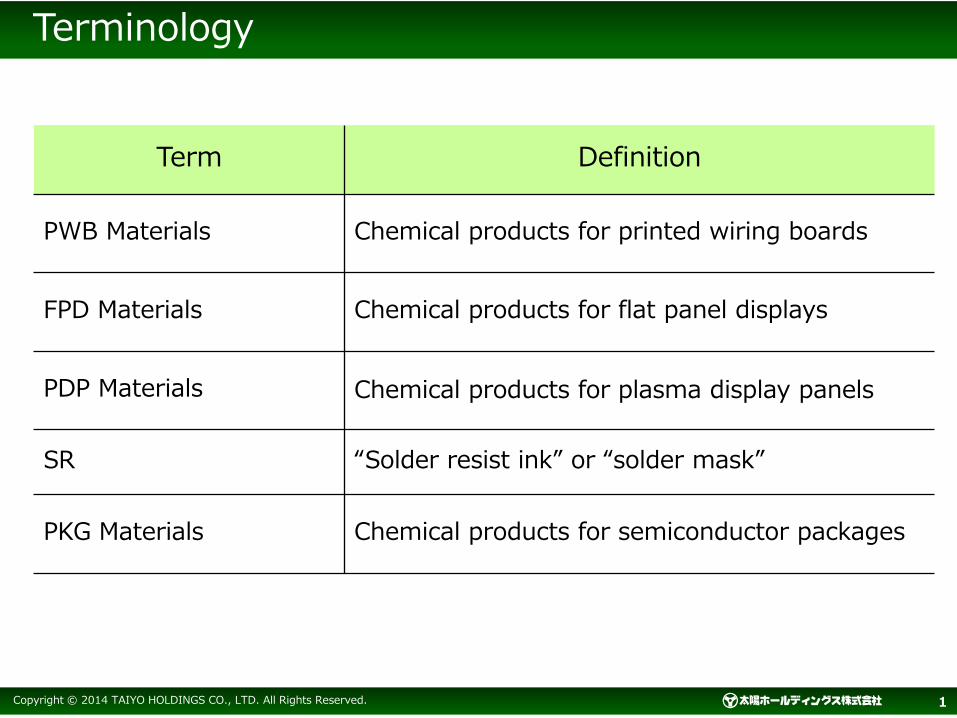
Terminology
Term Definition
PWB Materials Chemical products for printed wiring boards
FPD Materials Chemical products for flat panel displays
PDP Materials Chemical products for plasma display panels
SR “Solder resist ink” or “solder mask”
PKG Materials Chemical products for semiconductor packages

zxcv Copyright © 2014 TAIYO HOLDINGS CO., LTD. All Rights Reserved. 2
Classification of product
Group Category Type Remarks
PWB insulating materials
Rigid Liquid for protecting surface and insulating SR materials
PKG/FPC Liquid/Dry Film
Build-up Liquid/Dry Film for interlayer insulating and hole plugging build-up materials
FPD conductive materials
FPD Liquid for PDP, touch panel, and shielding silver paste
Other related products
Other Liquid for marking, etching and plating flux, solvent etc.

zxcv Copyright © 2014 TAIYO HOLDINGS CO., LTD. All Rights Reserved. 3
FY2015 Q2 Topics
Consolidated subsidiary, Onstatic Technology Co., Ltd.(OTC) ※ Statements of income of OTC, whose profit and loss was accounted under the equity method in the FY2014 Q1, is consolidated from the FY2015 Q1.
China market continuously remained strong from the previous fiscal year
Increase in sales volume of Dry Film Type SR
Fall in silver prices and shrinkage in PDP market (production of PDP discontinued in the end of Sept.)
JPY was slightly weaker than estimated exchange rate of 100yen/USD
1
2
3
4
5
6
7
Market entry into photovoltaic business
Giving consideration to build domestic production base from the viewpoint of BCP
zxcv Copyright © 2014 TAIYO HOLDINGS CO., LTD. All Rights Reserved. 4
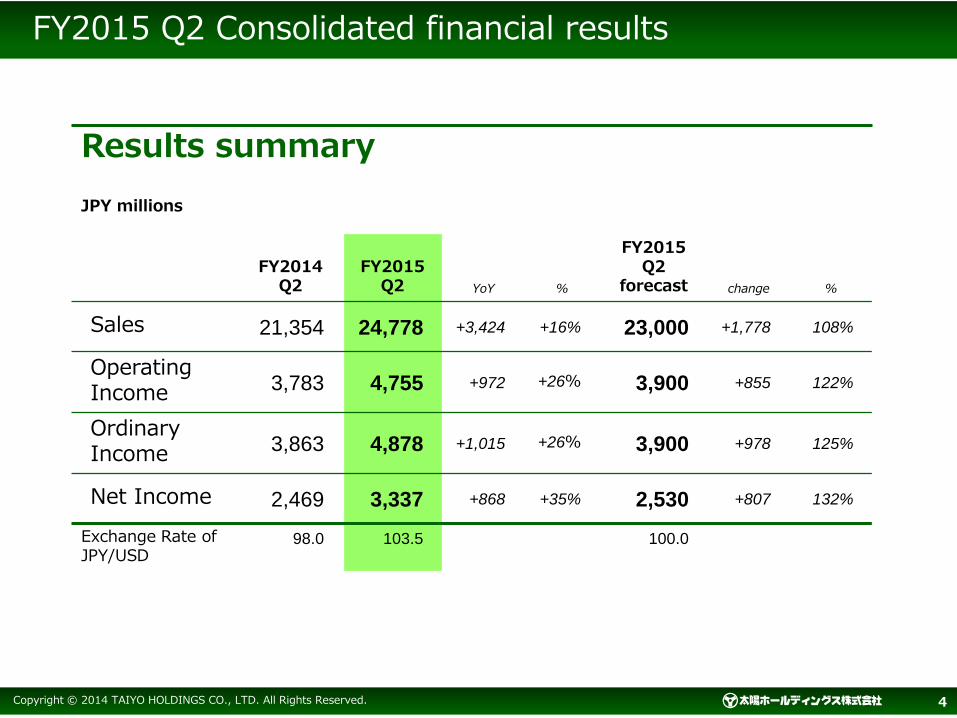
FY2015 Q2 Consolidated financial results
Results summary
JPY millions
FY2014 Q2
FY2015 Q2 YoY %
FY2015 Q2
forecast change %
Sales 21,354 24,778 +3,424 +16% 23,000 +1,778 108%
Operating Income 3,783 4,755 +972 +26% 3,900 +855 122%
Ordinary Income 3,863 4,878 +1,015 +26% 3,900 +978 125%
Net Income 2,469 3,337 +868 +35% 2,530 +807 132%
Exchange Rate of JPY/USD
98.0 103.5 100.0

zxcv Copyright © 2014 TAIYO HOLDINGS CO., LTD. All Rights Reserved. 5
FY2015 Q2 Sales (YoY)
Breakdown of sales JPY millions
FY2014 Q2 FY2015 Q2
21,354
24,778
+1,269
+1,347
Newly consolidated subsidiary, OTC
+1,204
Increase in sales volume of PWB etc.
Decrease in sales volume of FPD,
fall in sliver prices
FX rate appreciation, change in product
mix, etc.
-397
zxcv Copyright © 2014 TAIYO HOLDINGS CO., LTD. All Rights Reserved. 6
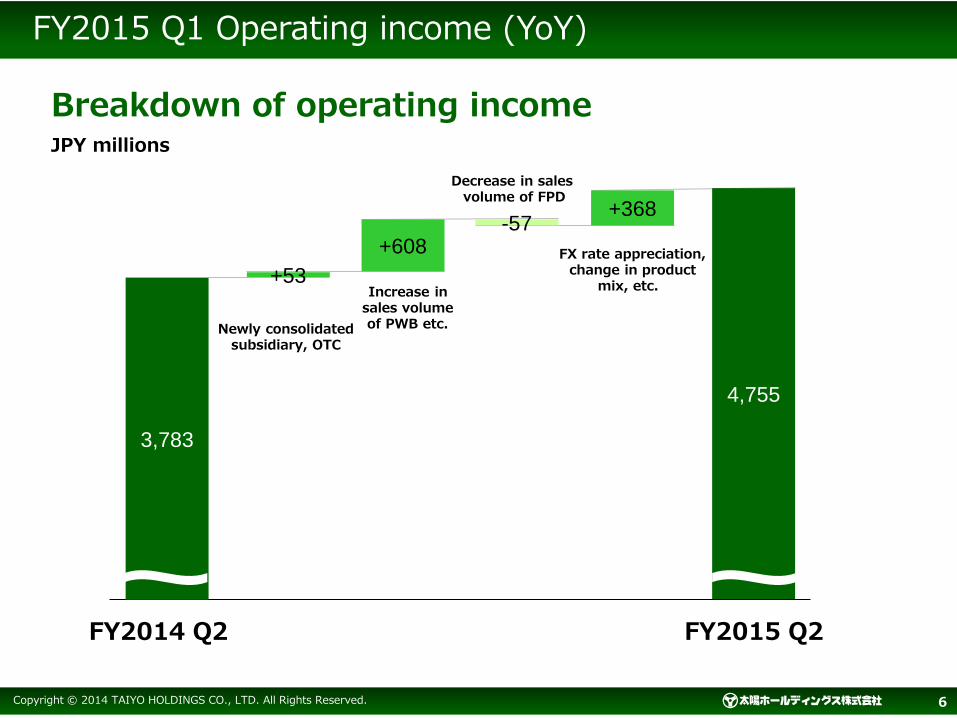
FY2015 Q1 Operating income (YoY)
Breakdown of operating income JPY millions
3,783
4,755
+53
FY2014 Q2 FY2015 Q2
+608
Decrease in sales volume of FPD
+368 -57
FX rate appreciation, change in product
mix, etc.
Newly consolidated subsidiary, OTC
Increase in sales volume of PWB etc.
zxcv Copyright © 2014 TAIYO HOLDINGS CO., LTD. All Rights Reserved. 7
FY2015 Q2 BS highlights
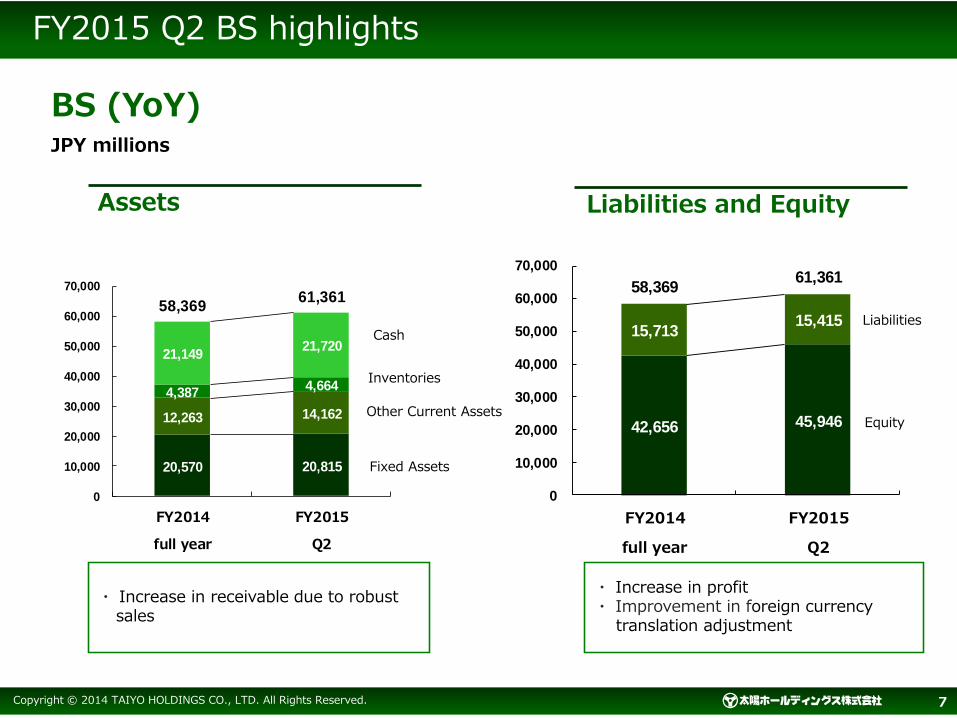
BS (YoY) JPY millions
20,570 20,815
12,263 14,162
4,3874,664
21,14921,720
58,36961,361
0
10,000
20,000
30,000
40,000
50,000
60,000
70,000
FY2014
full year
FY2015
Q2
・ Increase in receivable due to robust sales
・ Increase in profit ・ Improvement in foreign currency translation adjustment
Assets Liabilities and Equity
42,656 45,946
15,71315,415
58,36961,361
0
10,000
20,000
30,000
40,000
50,000
60,000
70,000
FY2014
full year
FY2015
Q2
Cash
Inventories
Other Current Assets
Fixed Assets
Liabilities
Equity
zxcv Copyright © 2014 TAIYO HOLDINGS CO., LTD. All Rights Reserved. 8
FY2015 Q2 CF highlights
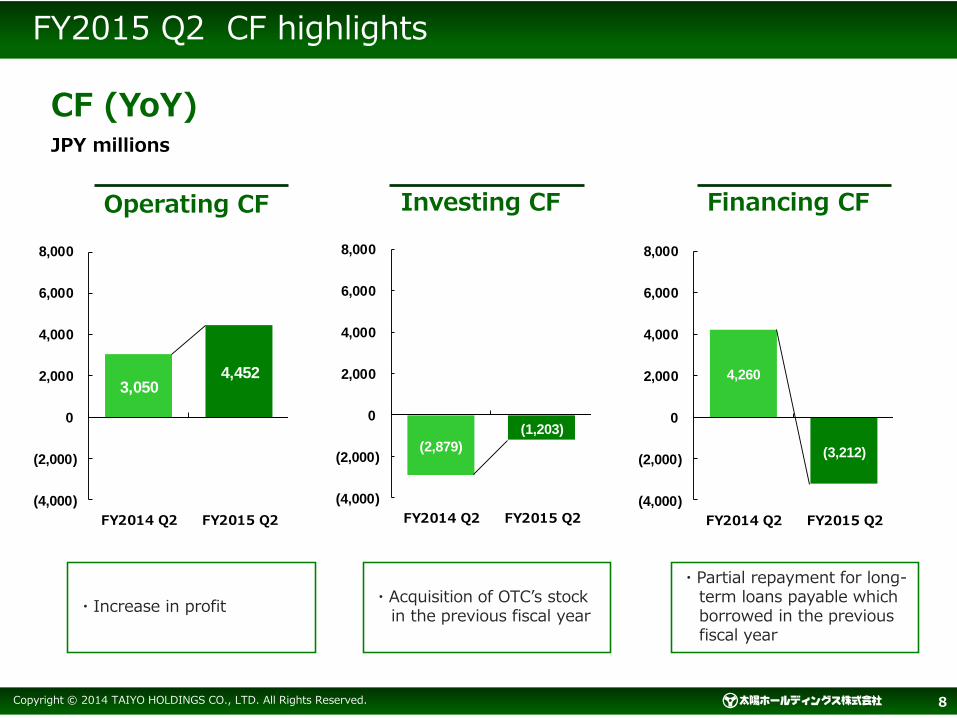
CF (YoY) JPY millions
Operating CF Investing CF Financing CF
3,0504,452
(4,000)
(2,000)
0
2,000
4,000
6,000
8,000
FY2014 Q2 FY2015 Q2
(2,879)
(1,203)
(4,000)
(2,000)
0
2,000
4,000
6,000
8,000
FY2014 Q2 FY2015 Q2
4,260
(3,212)
(4,000)
(2,000)
0
2,000
4,000
6,000
8,000
FY2014 Q2 FY2015 Q2
・Increase in profit ・Acquisition of OTC’s stock
in the previous fiscal year
・Partial repayment for long-term loans payable which borrowed in the previous fiscal year
zxcv Copyright © 2014 TAIYO HOLDINGS CO., LTD. All Rights Reserved. 9
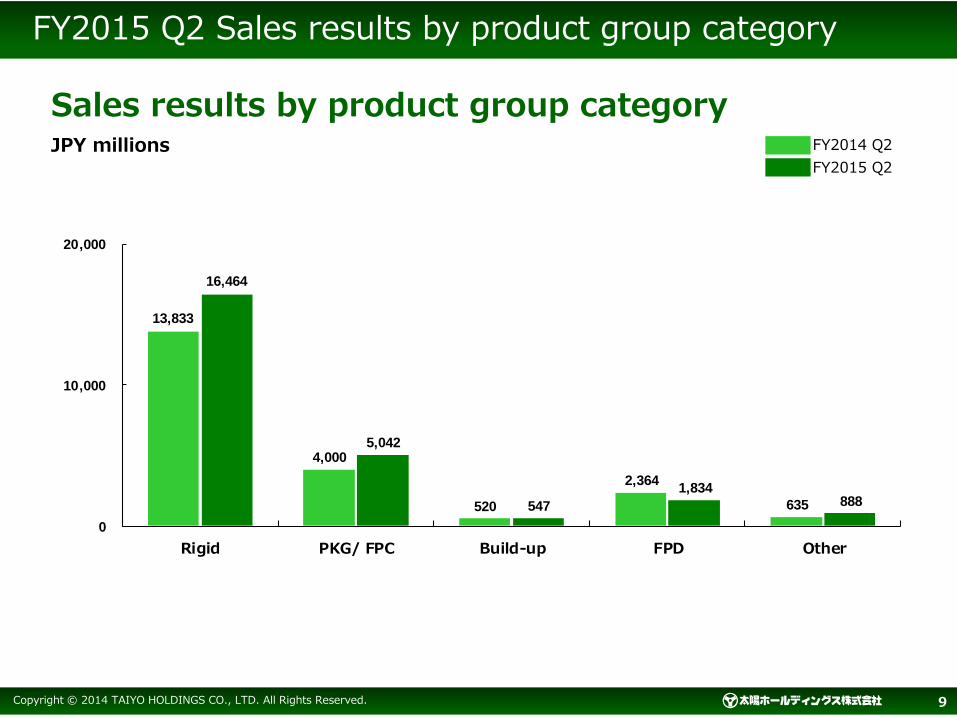
FY2015 Q2 Sales results by product group category
13,833
4,000
520
2,364
635
16,464
5,042
547
1,834888
0
10,000
20,000
Rigid PKG/ FPC Build-up FPD Other
Sales results by product group category JPY millions FY2014 Q2
FY2015 Q2

zxcv Copyright © 2014 TAIYO HOLDINGS CO., LTD. All Rights Reserved. 10
FY2015 Q2 Segment information
Sales by segment JPY millions
Operating income by segment JPY millions
7,0178,447
3,6065,305
1,668
8,2129,965
4,802 5,3022,025
0
2,000
4,000
6,000
8,000
10,000
12,000
Japan China Taiwan Korea Other
9801,244
610 607205
1,3591,668
878616 286
0
1,000
2,000
Japan China Taiwan Korea Other
FY2014 Q2
FY2015 Q2

zxcv Copyright © 2014 TAIYO HOLDINGS CO., LTD. All Rights Reserved. 11
Trend of quarterly performance
Sales vs. operating income JYP millions
●
Sales(left axis)
Operating Income (right axis)
0
500
1,000
1,500
2,000
2,500
3,000
0
2,000
4,000
6,000
8,000
10,000
12,000
14,000
Q1 Q2 Q3 Q4 Q1 Q2 Q3 Q4 Q1 Q2 Q3 Q4 Q1 Q2 Q3 Q4 Q1 Q2 Q3 Q4 Q1 Q2 Q3 Q4
FY2010 FY2011 FY2012 FY2013 FY2014 FY2015

zxcv Copyright © 2014 TAIYO HOLDINGS CO., LTD. All Rights Reserved. 12
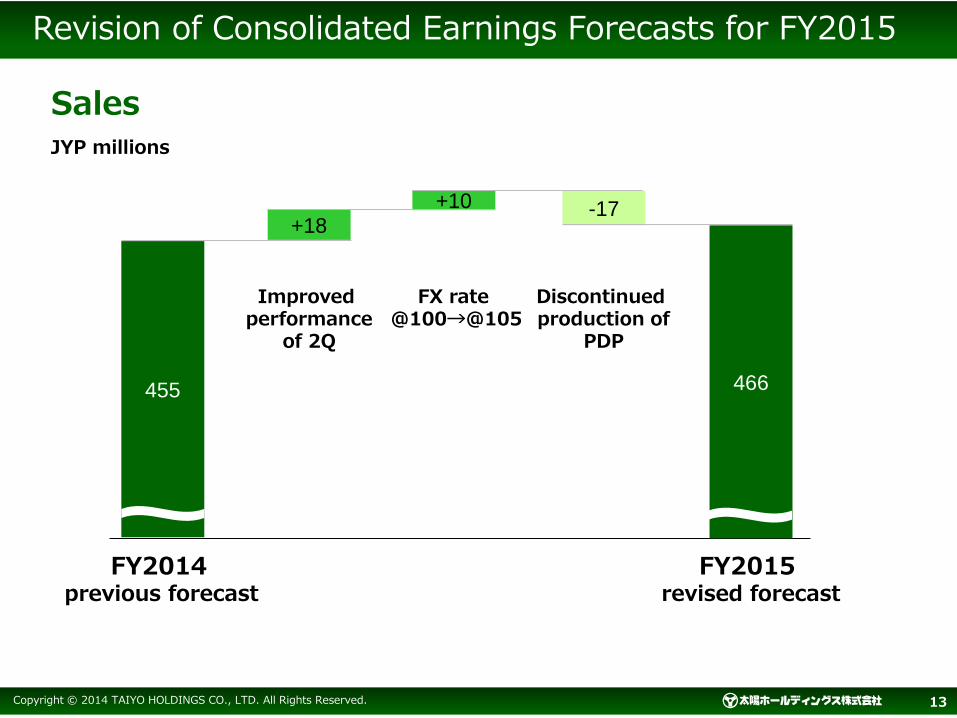
Revision of Consolidated Earnings Forecasts for FY2015
Sales
(JPY millions)
Operating Income
(JPY millions)
Ordinary Income
(JPY millions) Net Income
(JPY millions)
Previous forecast(A) 45,500 7,700 7,700 5,000
Revised forecast(B) 46,600 8,700 8,800 5,900
Change(B-A) 1,100 1,000 1,100 900
Change(%) 2.4 13.0 14.3 18.0
(Reference) FY 2014
44,224 7,568 7,827 4,930
zxcv Copyright © 2014 TAIYO HOLDINGS CO., LTD. All Rights Reserved. 13
Sales
FY2014 previous forecast
FY2015 revised forecast
455 466
+18 +10 -17
Improved performance
of 2Q
FX rate @100→@105
Discontinued production of
PDP
JYP millions
Revision of Consolidated Earnings Forecasts for FY2015
zxcv Copyright © 2014 TAIYO HOLDINGS CO., LTD. All Rights Reserved. 14
Recommended


![INDEX [controlwell.com]controlwell.com/cataloguepdf/cableglands.pdf · 4 Size Cat. No. Grey BS-01 BS-02 BS-03 BS-04 BS-05 BS-06 BS-07 BS-08 BS-09 BS-10 Clamping Range (mm) 3 - 6.5](https://img.dokumen.tips/doc/110x75/5aa168cf7f8b9a07758b8558/index-4-size-cat-no-grey-bs-01-bs-02-bs-03-bs-04-bs-05-bs-06-bs-07-bs-08-bs-09.jpg)


