Connecticut Downtown Revitalization Institute
Economic Realities of Downtown Revitalization
July 28, 2006Berlin, Connecticut
MY Definitions of Economic Restructuring
Creating an Economic Environment where More Dollars go in More Cash Registers
Increasing the VALUE of Downtown
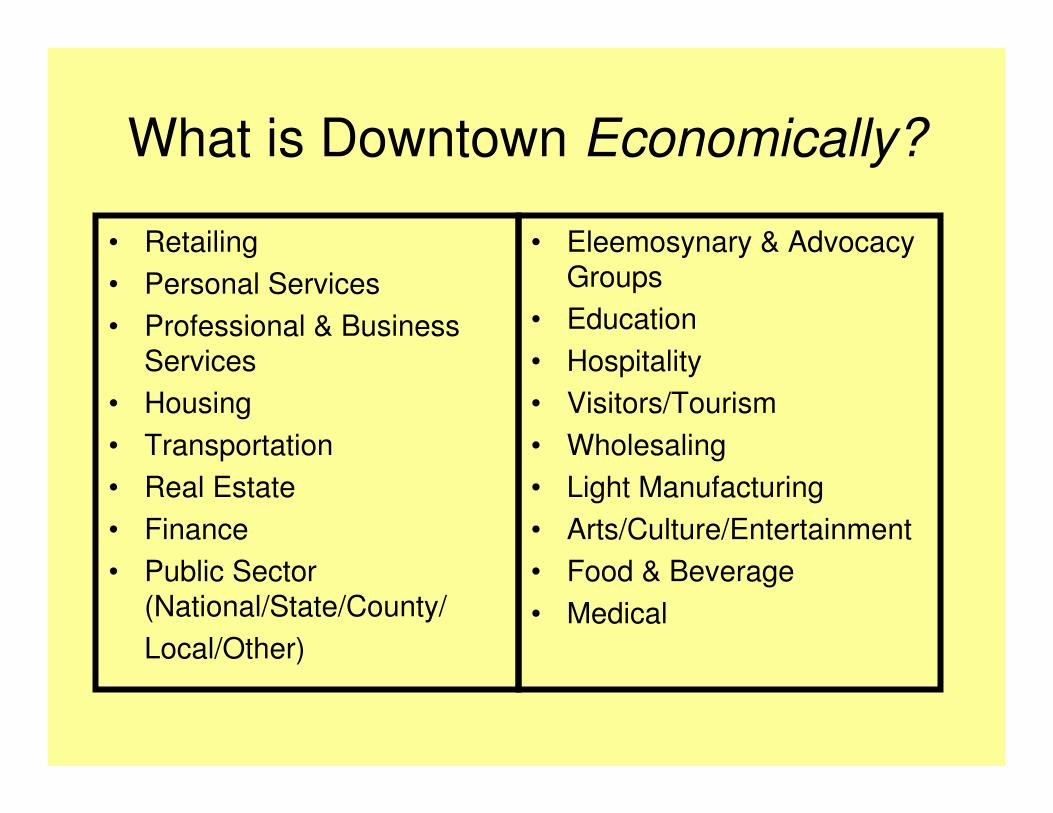
What is Downtown Economically?
• Retailing• Personal Services• Professional & Business
Services• Housing• Transportation• Real Estate• Finance• Public Sector
(National/State/County/Local/Other)
• Eleemosynary & Advocacy Groups
• Education• Hospitality • Visitors/Tourism• Wholesaling• Light Manufacturing• Arts/Culture/Entertainment• Food & Beverage• Medical
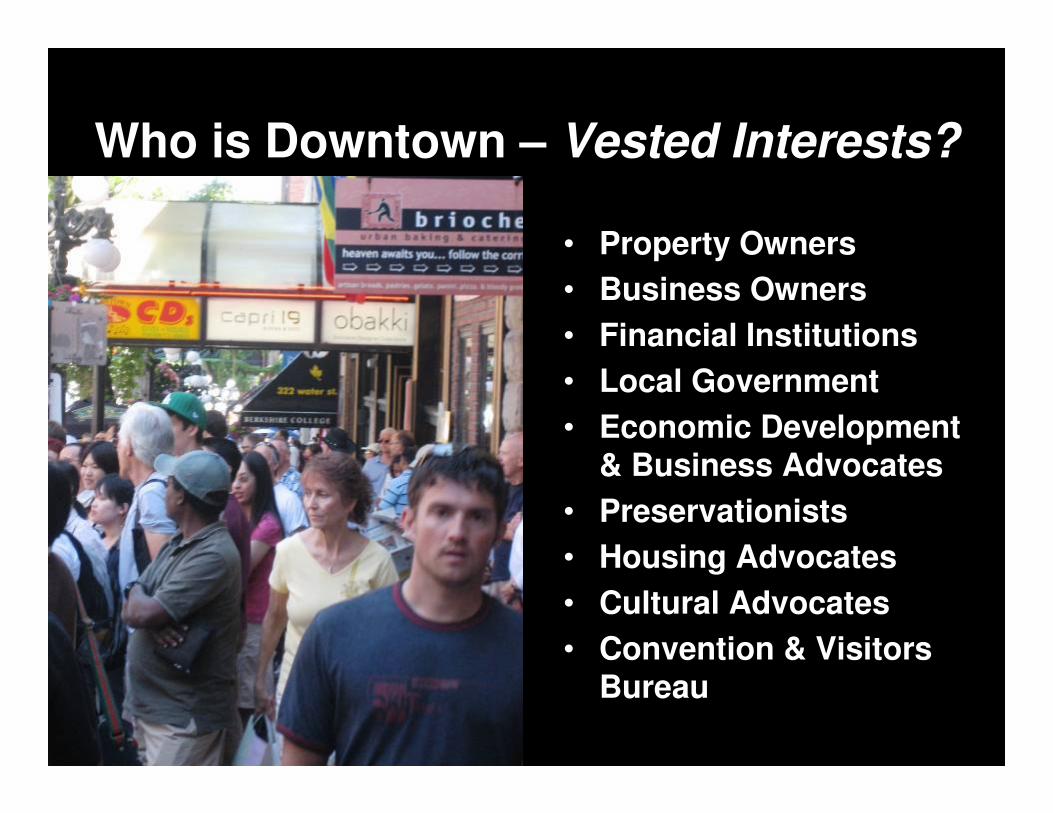
Who is Downtown – Vested Interests?
• Property Owners• Business Owners• Financial Institutions• Local Government• Economic Development
& Business Advocates• Preservationists• Housing Advocates• Cultural Advocates• Convention & Visitors
Bureau

Where is Downtown?
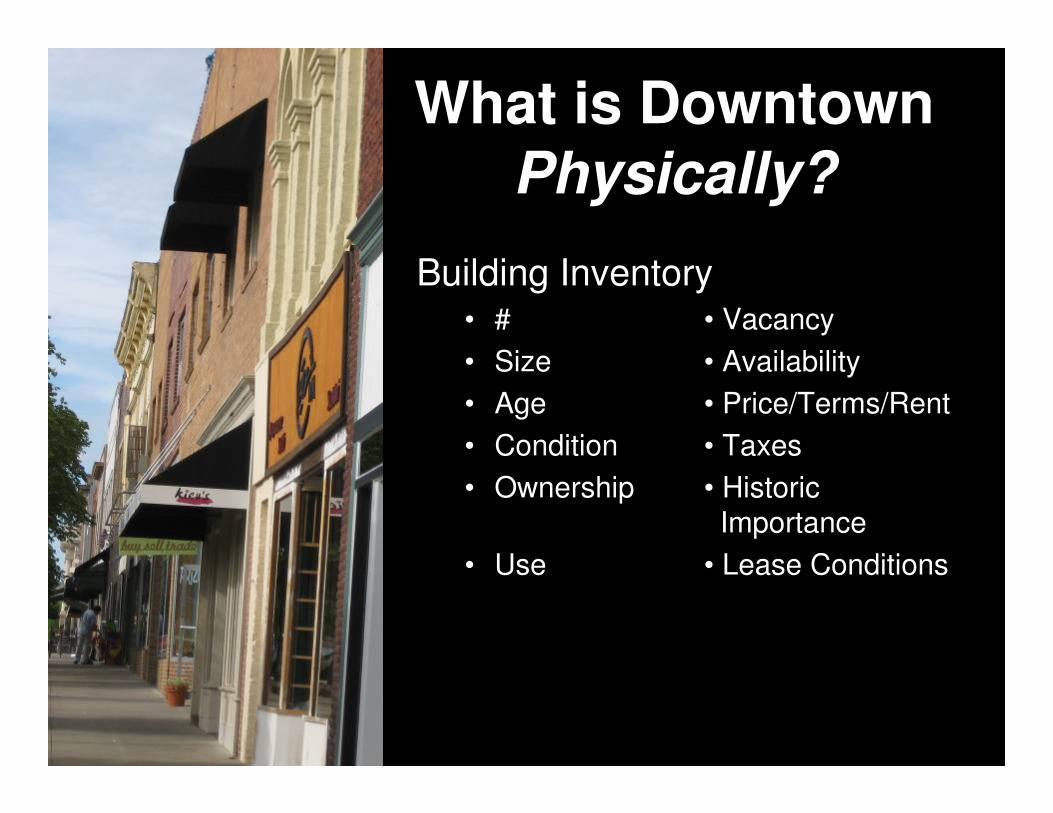
What is Downtown Physically?
Building Inventory• # • Vacancy• Size • Availability• Age • Price/Terms/Rent• Condition • Taxes• Ownership • Historic
Importance• Use • Lease Conditions
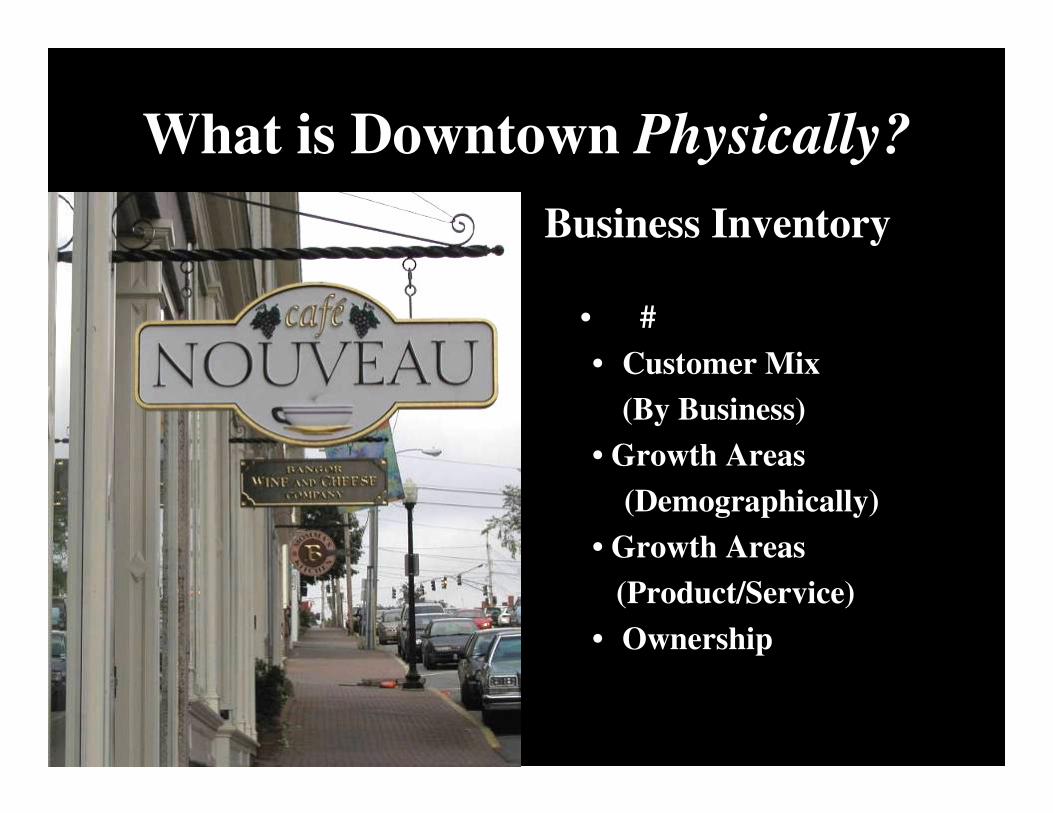
Business Inventory
• #• Customer Mix
(By Business)• Growth Areas
(Demographically)• Growth Areas
(Product/Service)• Ownership
What is Downtown Physically?

Business Inventory (con’t)
• Availability(If/When/How Much)
• Lease Conditions• Sales Patterns & Amounts • Overall Customer Base• Demographic Shifts• Product Shifts
What is Downtown Physically?
GOOD Downtown
••••••••••
�������������������������������������������� Downtown
••••••••••
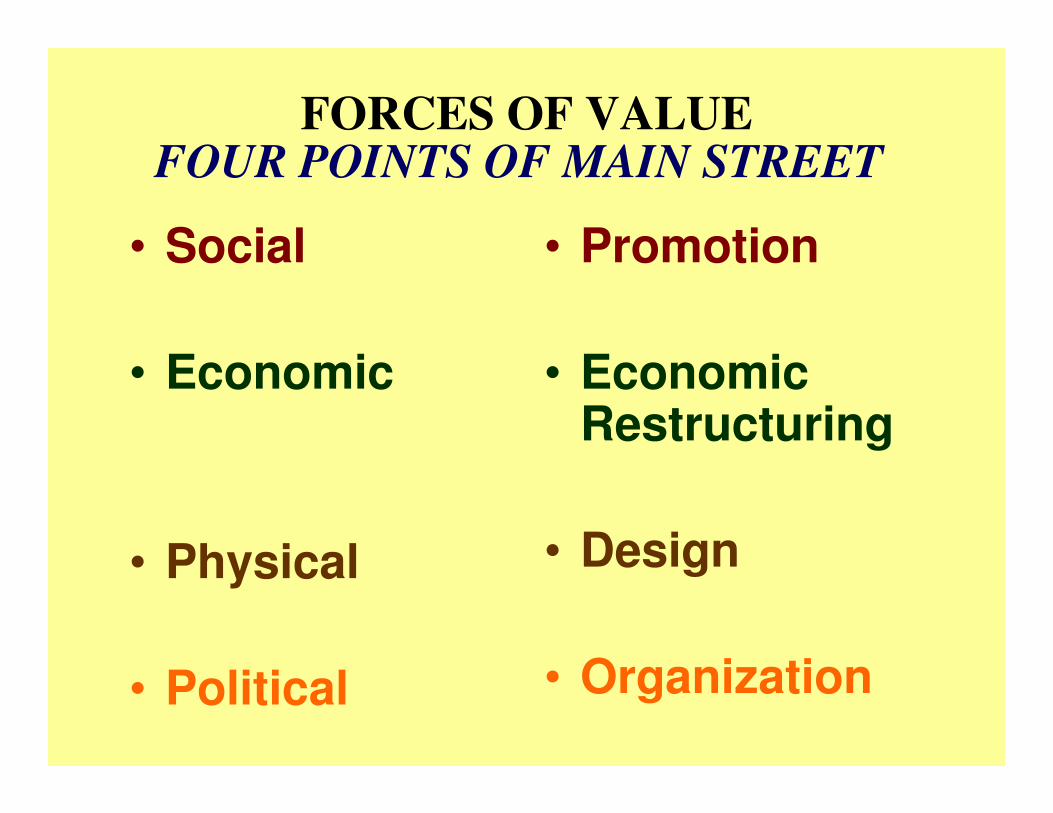
FORCES OF VALUE
• Social
• Economic
• Physical
• Political
• Promotion
• Economic Restructuring
• Design
• Organization
FOUR POINTS OF MAIN STREET
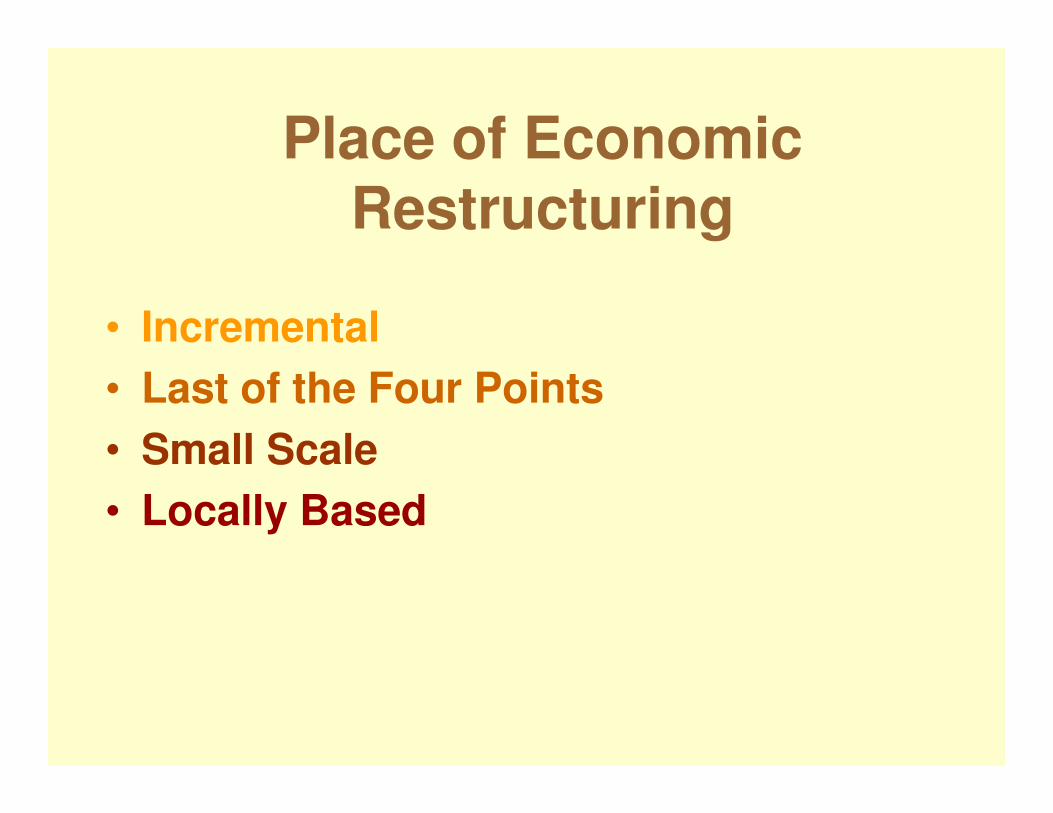
Place of Economic Restructuring
• Incremental• Last of the Four Points• Small Scale• Locally Based
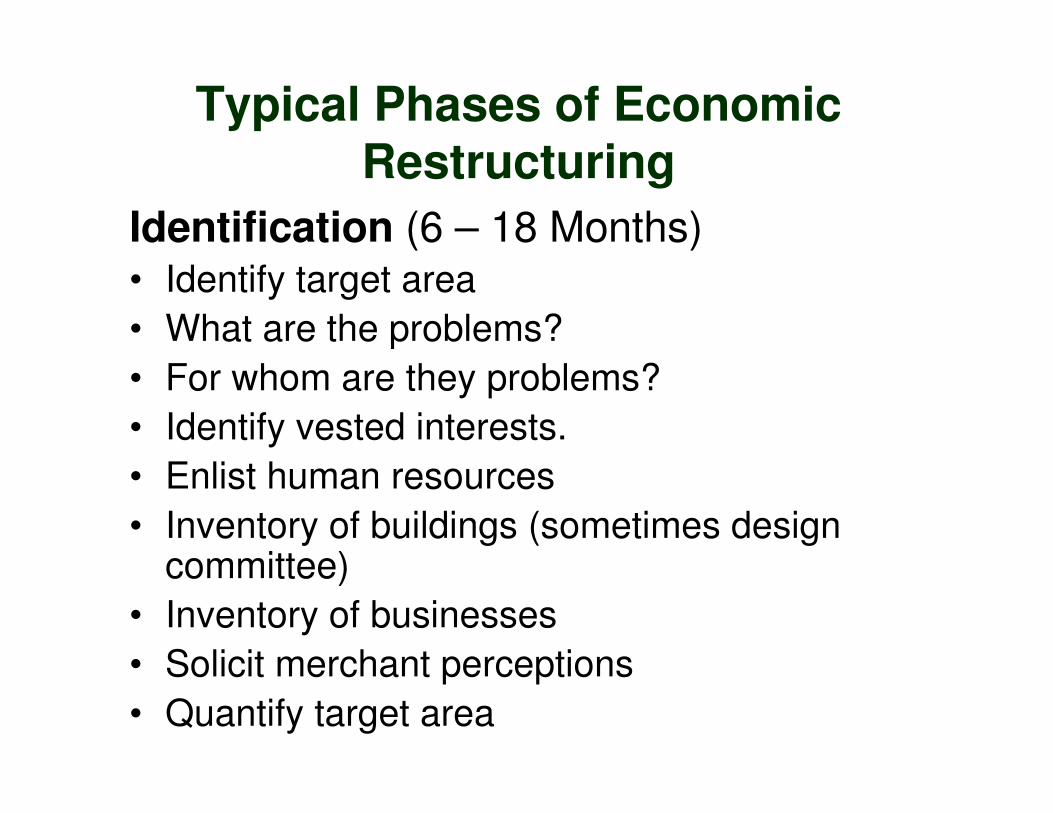
Typical Phases of Economic Restructuring
Identification (6 – 18 Months)• Identify target area• What are the problems?• For whom are they problems?• Identify vested interests.• Enlist human resources• Inventory of buildings (sometimes design
committee)• Inventory of businesses• Solicit merchant perceptions• Quantify target area
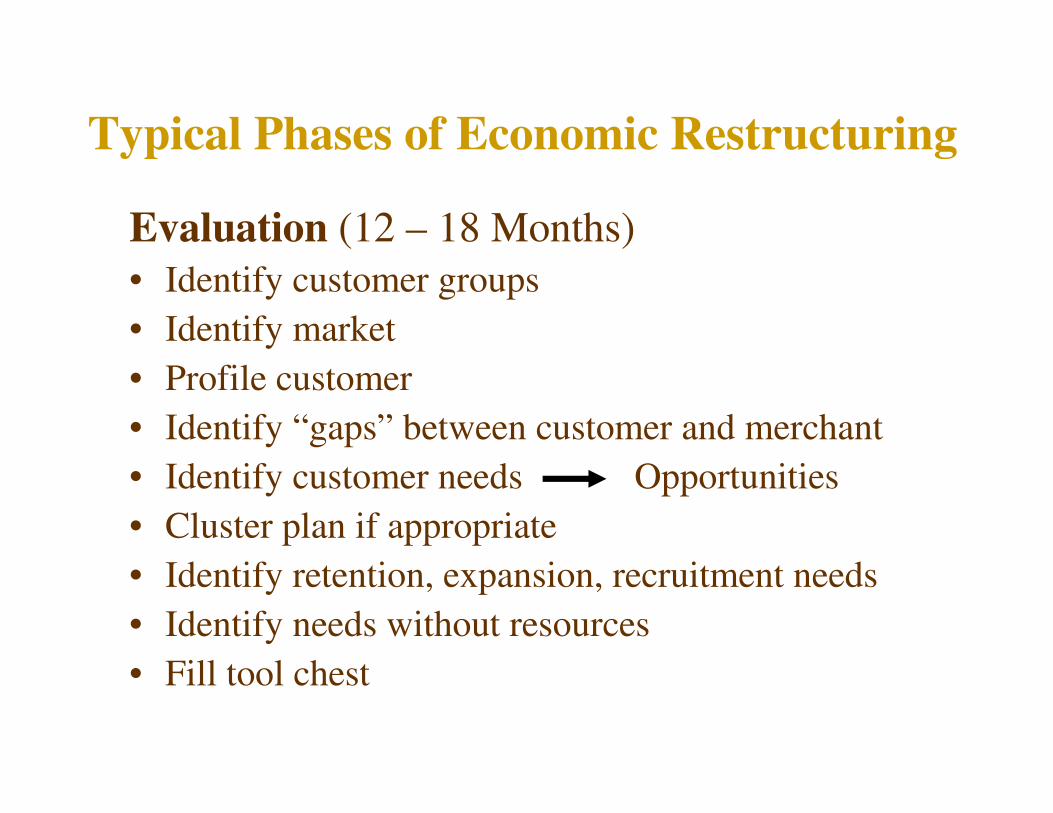
Typical Phases of Economic Restructuring
Evaluation (12 – 18 Months)• Identify customer groups• Identify market• Profile customer• Identify “gaps” between customer and merchant• Identify customer needs Opportunities• Cluster plan if appropriate• Identify retention, expansion, recruitment needs• Identify needs without resources• Fill tool chest
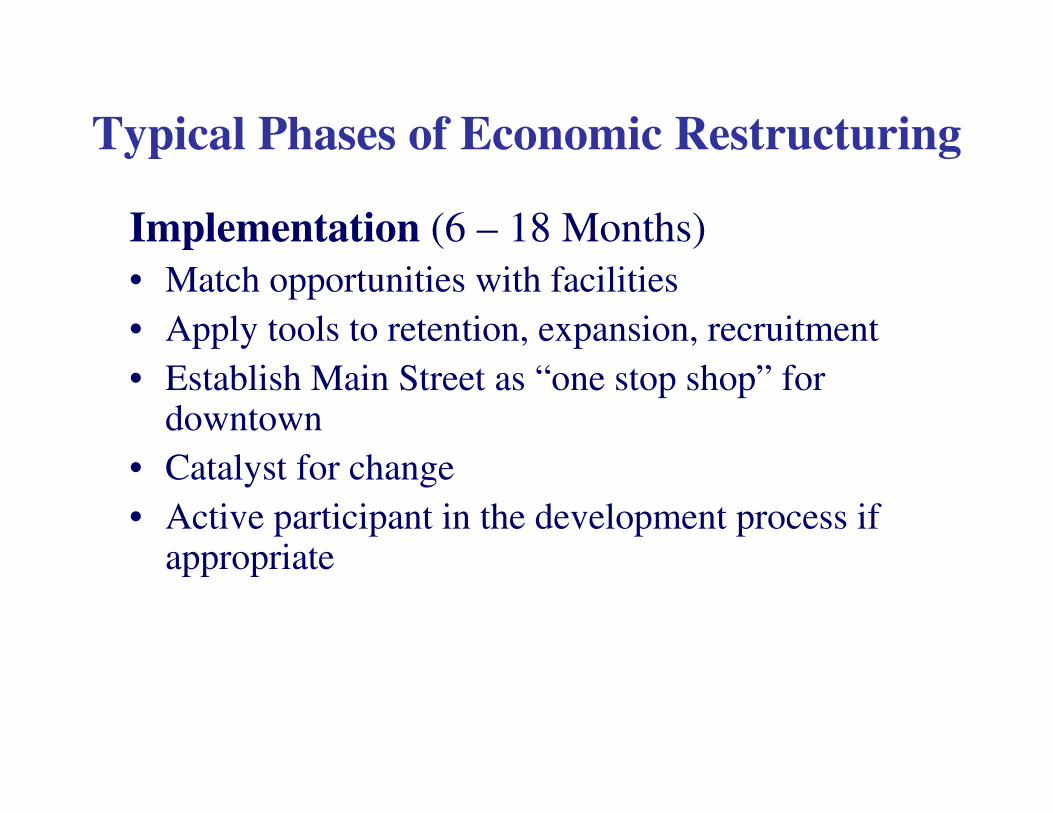
Implementation (6 – 18 Months)• Match opportunities with facilities• Apply tools to retention, expansion, recruitment• Establish Main Street as “one stop shop” for
downtown• Catalyst for change• Active participant in the development process if
appropriate
Typical Phases of Economic Restructuring
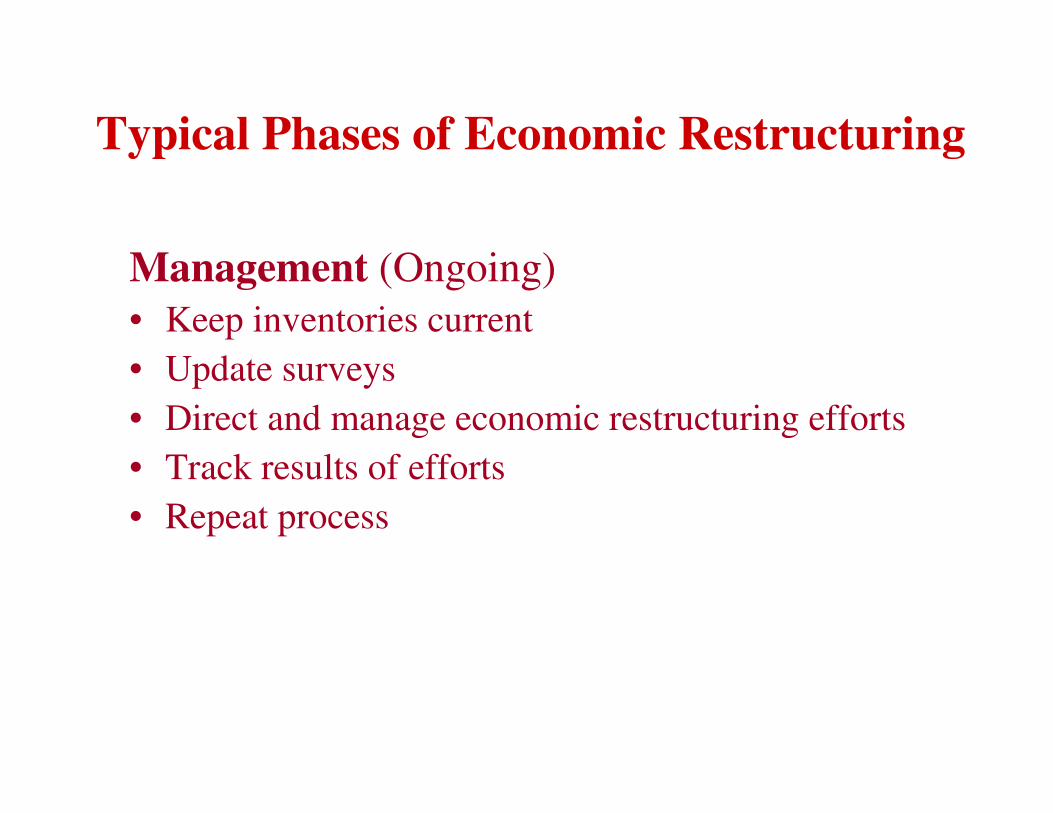
Typical Phases of Economic Restructuring
Management (Ongoing)• Keep inventories current• Update surveys• Direct and manage economic restructuring efforts• Track results of efforts• Repeat process
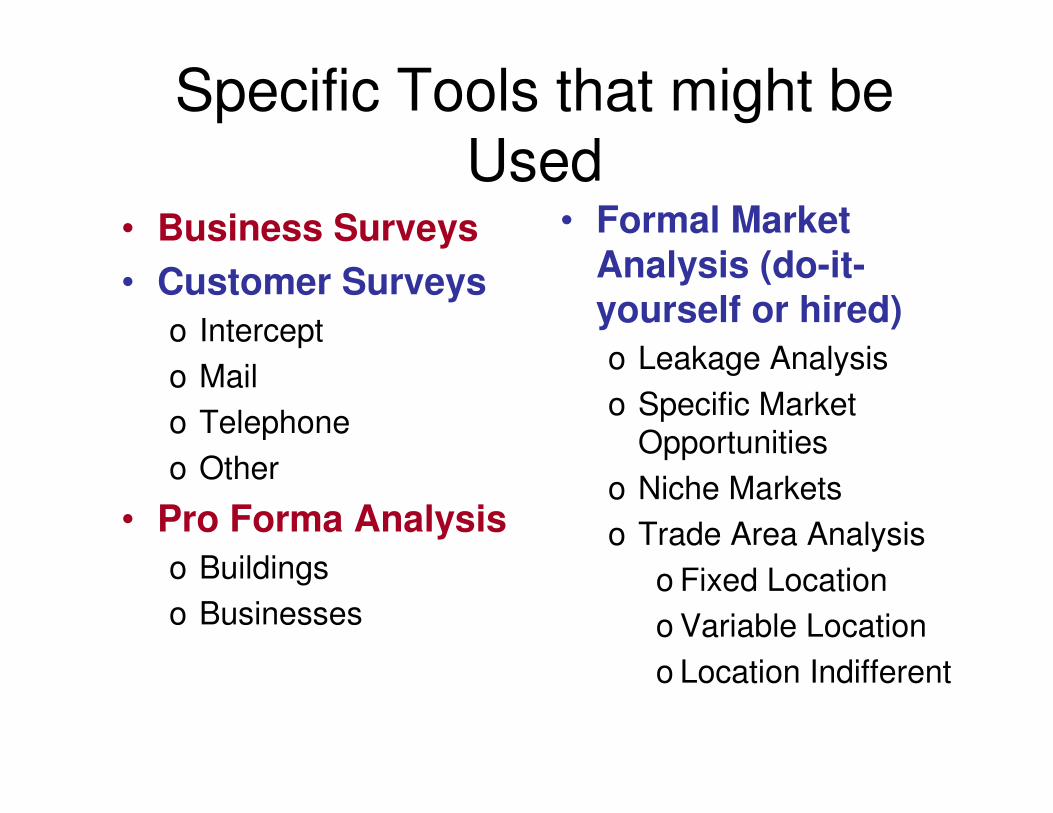
Specific Tools that might be Used
• Business Surveys• Customer Surveys
o Intercepto Mailo Telephoneo Other
• Pro Forma Analysiso Buildingso Businesses
• Formal Market Analysis (do-it-yourself or hired)o Leakage Analysiso Specific Market
Opportunitieso Niche Marketso Trade Area Analysis
o Fixed Locationo Variable Locationo Location Indifferent
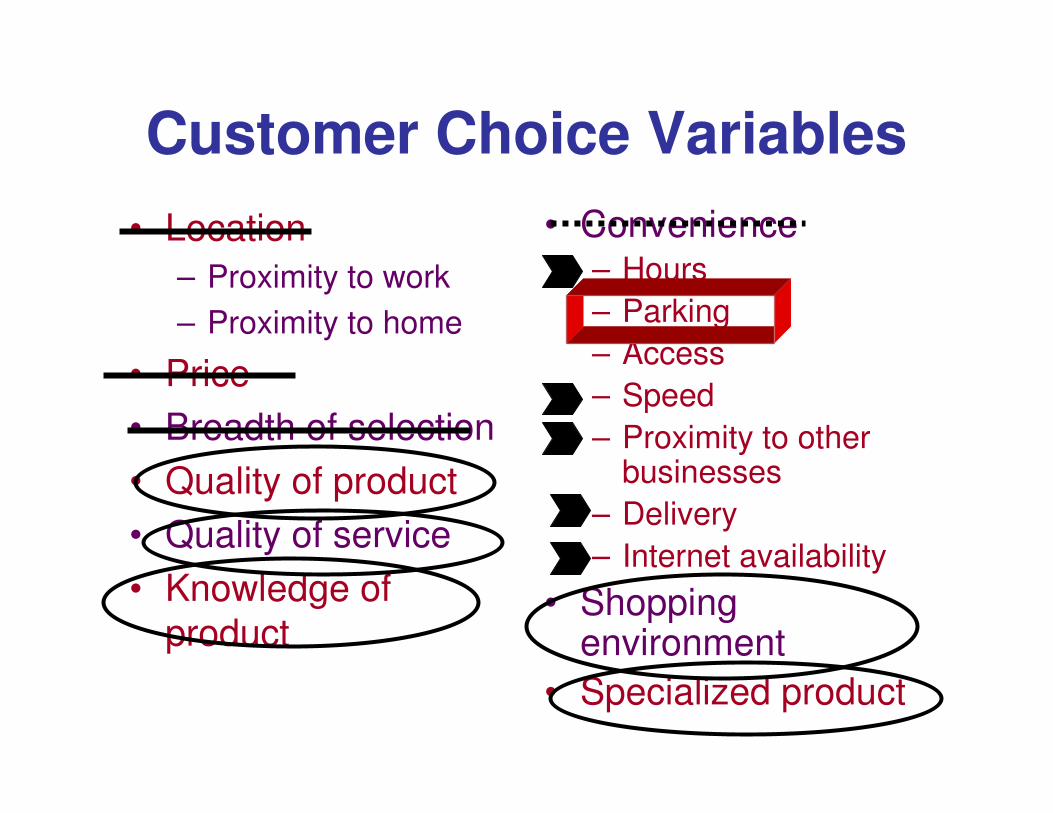
Customer Choice Variables• Location
– Proximity to work– Proximity to home
• Price• Breadth of selection• Quality of product• Quality of service• Knowledge of
product
• Convenience– Hours– Parking– Access– Speed– Proximity to other
businesses– Delivery– Internet availability
• Shopping environment
• Specialized product
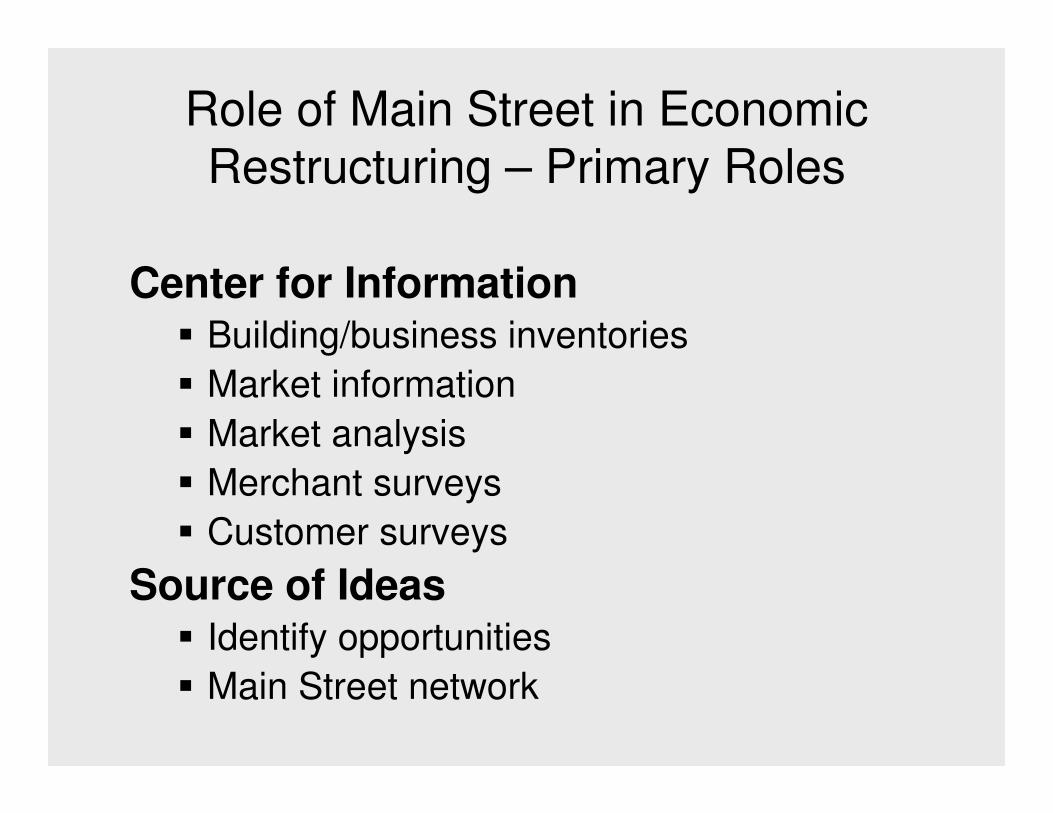
Role of Main Street in Economic Restructuring – Primary Roles
Center for Information� Building/business inventories� Market information� Market analysis� Merchant surveys� Customer surveys
Source of Ideas� Identify opportunities� Main Street network
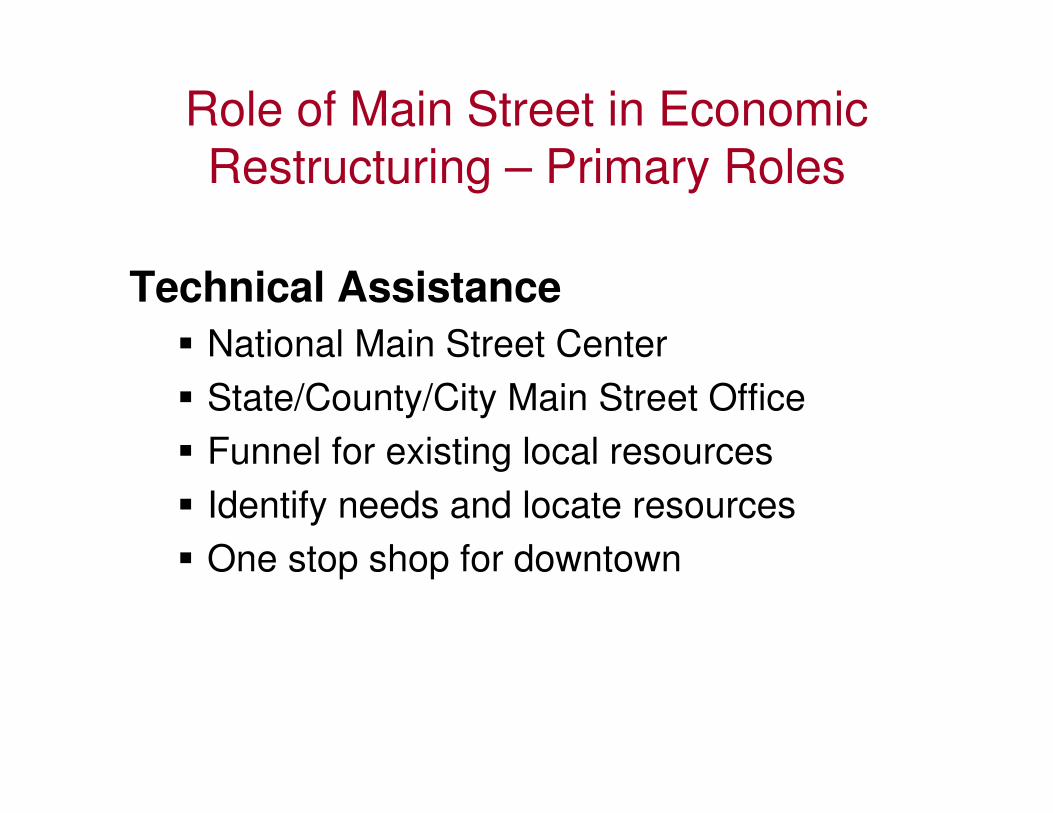
Role of Main Street in Economic Restructuring – Primary Roles
Technical Assistance� National Main Street Center� State/County/City Main Street Office� Funnel for existing local resources� Identify needs and locate resources� One stop shop for downtown
Role of Main Street in Economic Restructuring – Secondary Roles
Financial Assistance
Pro forma analysis and cost estimates
Direct participation in investment
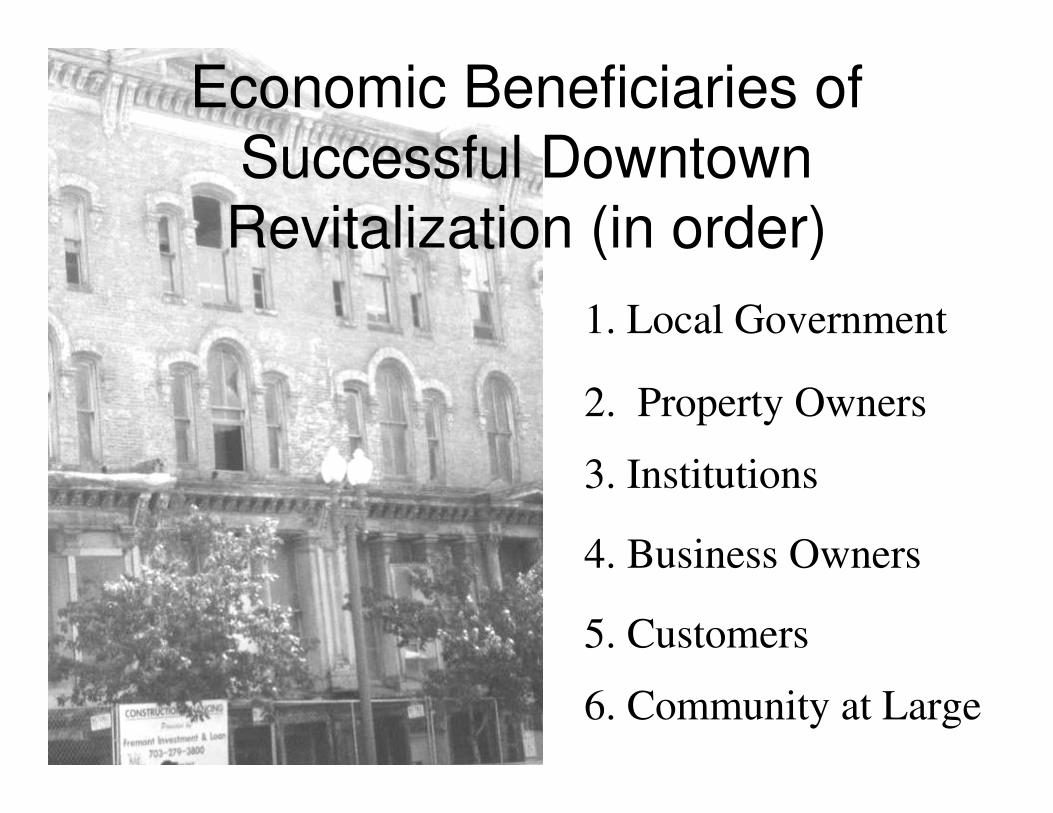
Economic Beneficiaries of Successful Downtown Revitalization (in order)
1. Local Government
2. Property Owners
3. Institutions
4. Business Owners
5. Customers
6. Community at Large


Whatever else might be true…1. Downtown buildings
are real estate2. Downtown buildings
are (often) investments3. In a market economy
every building must compete with thousands of alternative buildings
4. In a market economic every investment must compete with millions of alternatives
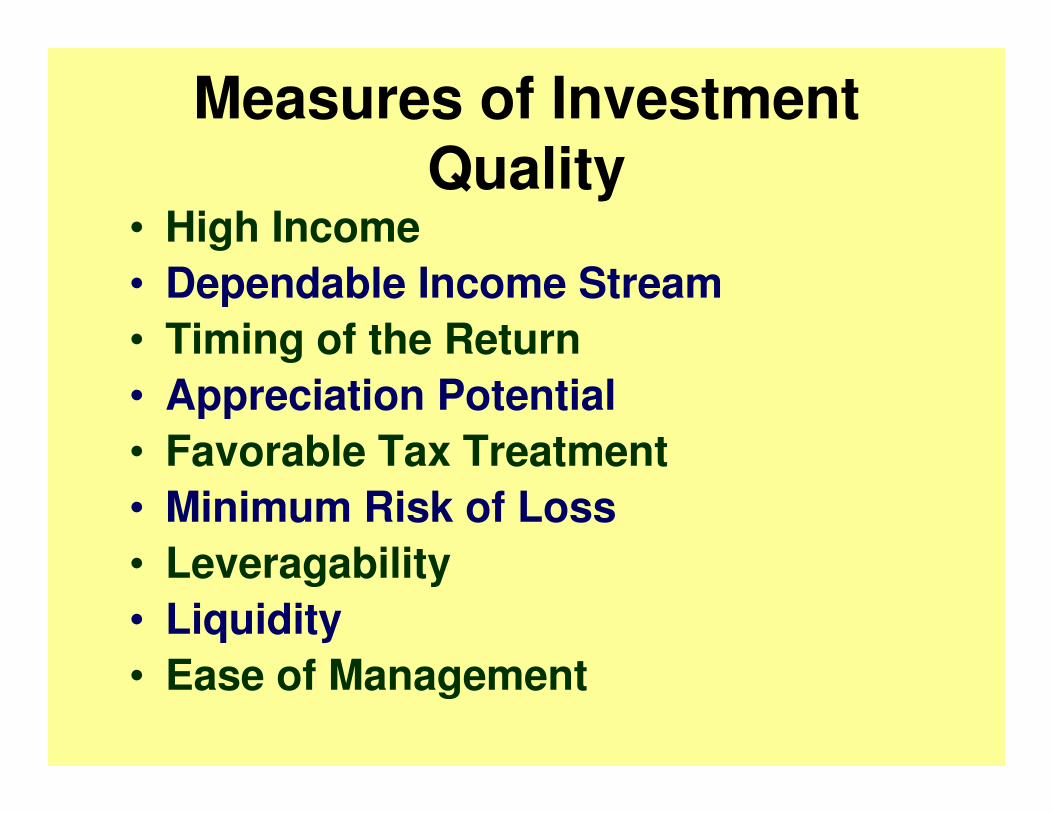
Measures of Investment Quality
• High Income• Dependable Income Stream• Timing of the Return• Appreciation Potential• Favorable Tax Treatment• Minimum Risk of Loss• Leveragability• Liquidity• Ease of Management
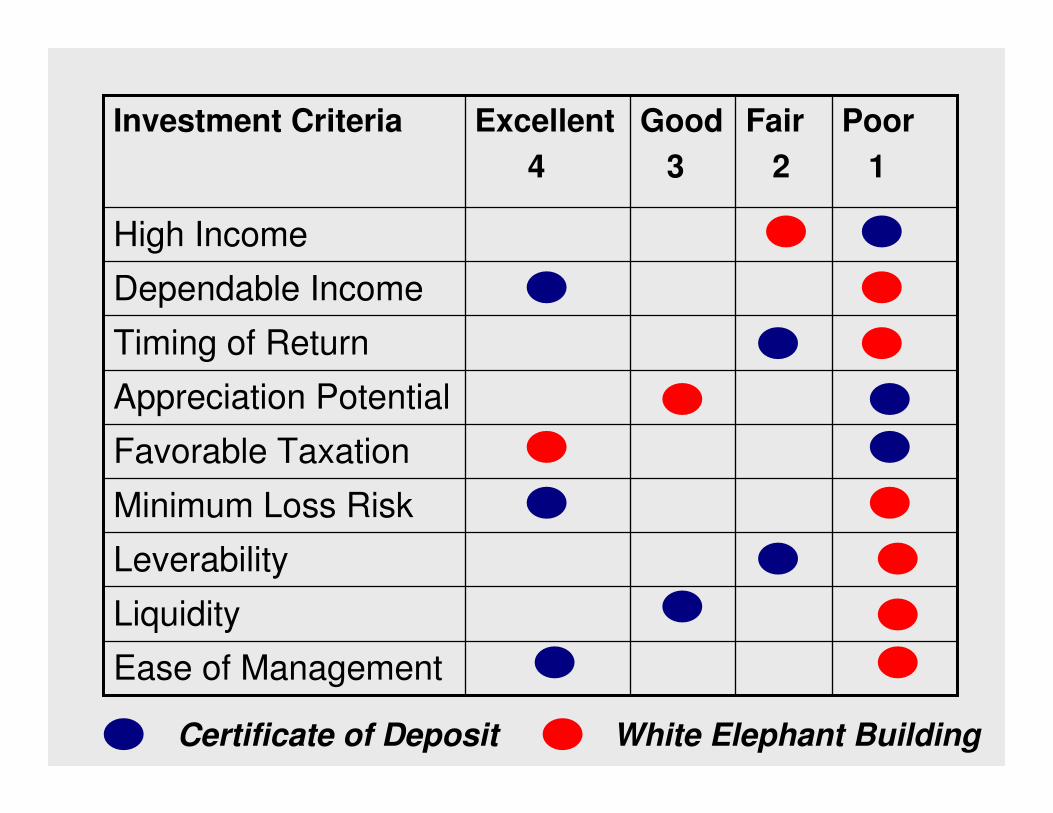
Dependable Income
Ease of Management
Liquidity
Leverability
Minimum Loss Risk
Favorable Taxation
Appreciation Potential
Timing of Return
High Income
Poor1
Fair2
Good3
Excellent4
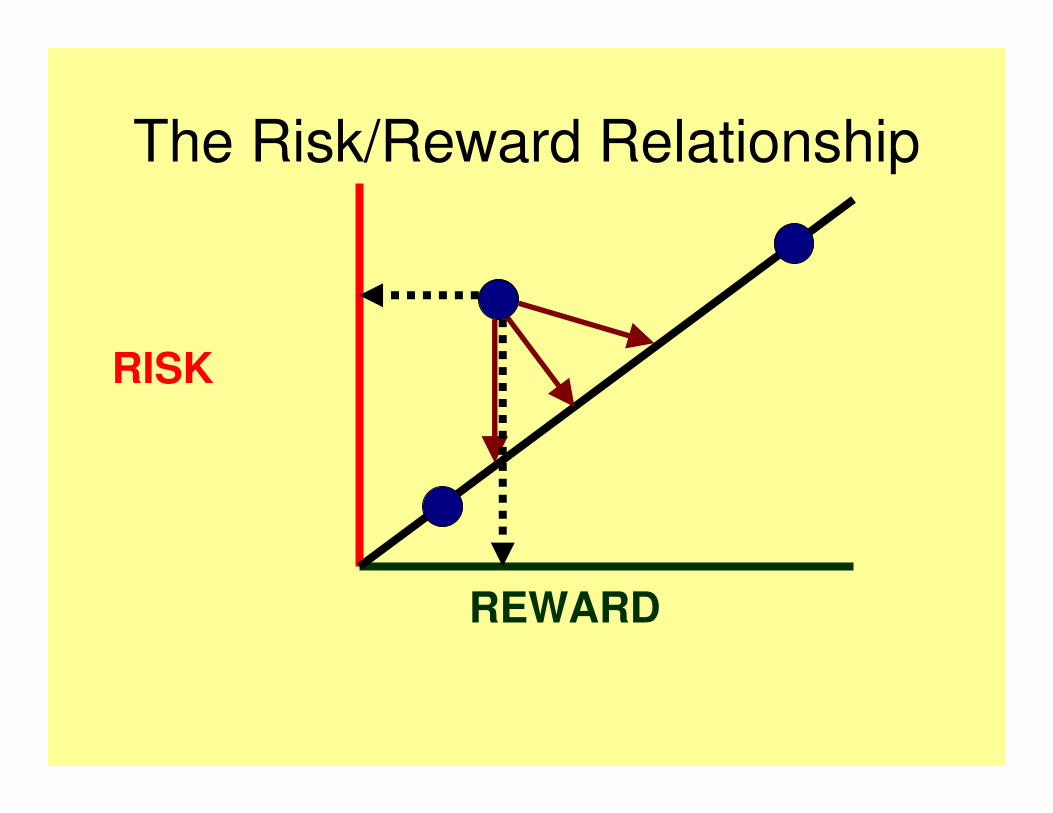
Investment Criteria
Certificate of Deposit White Elephant Building
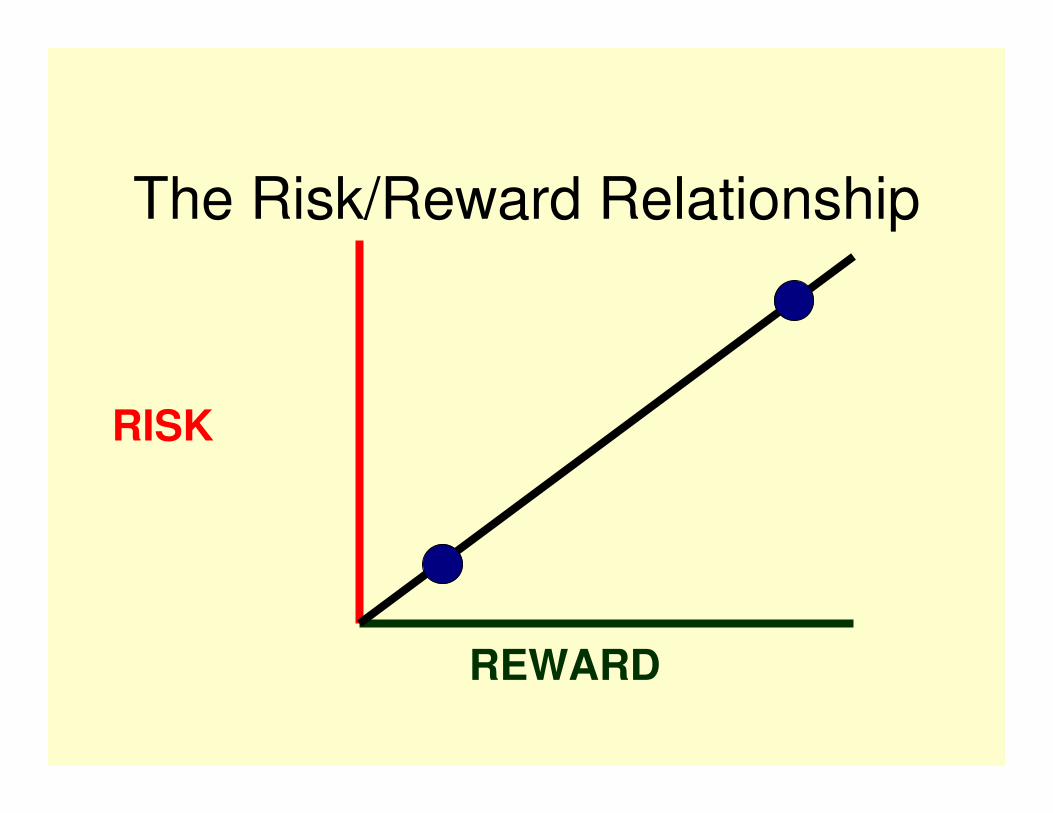
REWARD
RISK
The Risk/Reward Relationship
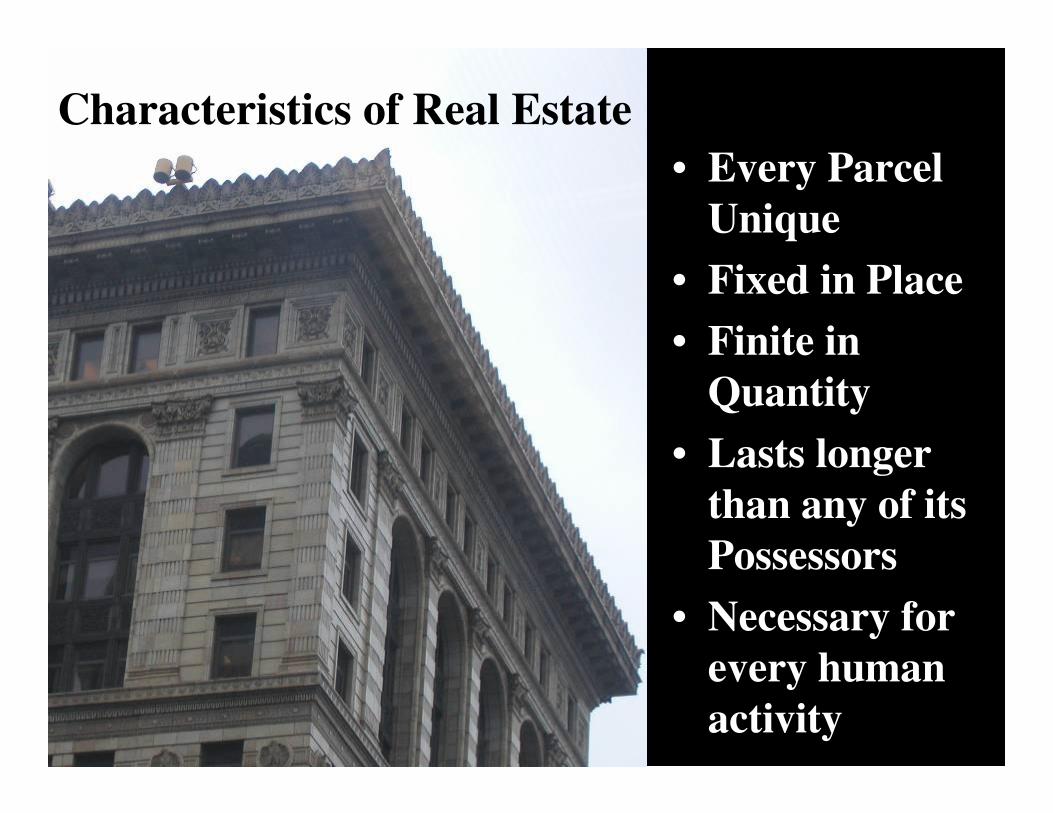
Characteristics of Real Estate• Every Parcel
Unique• Fixed in Place• Finite in
Quantity• Lasts longer
than any of its Possessors
• Necessary for every human activity
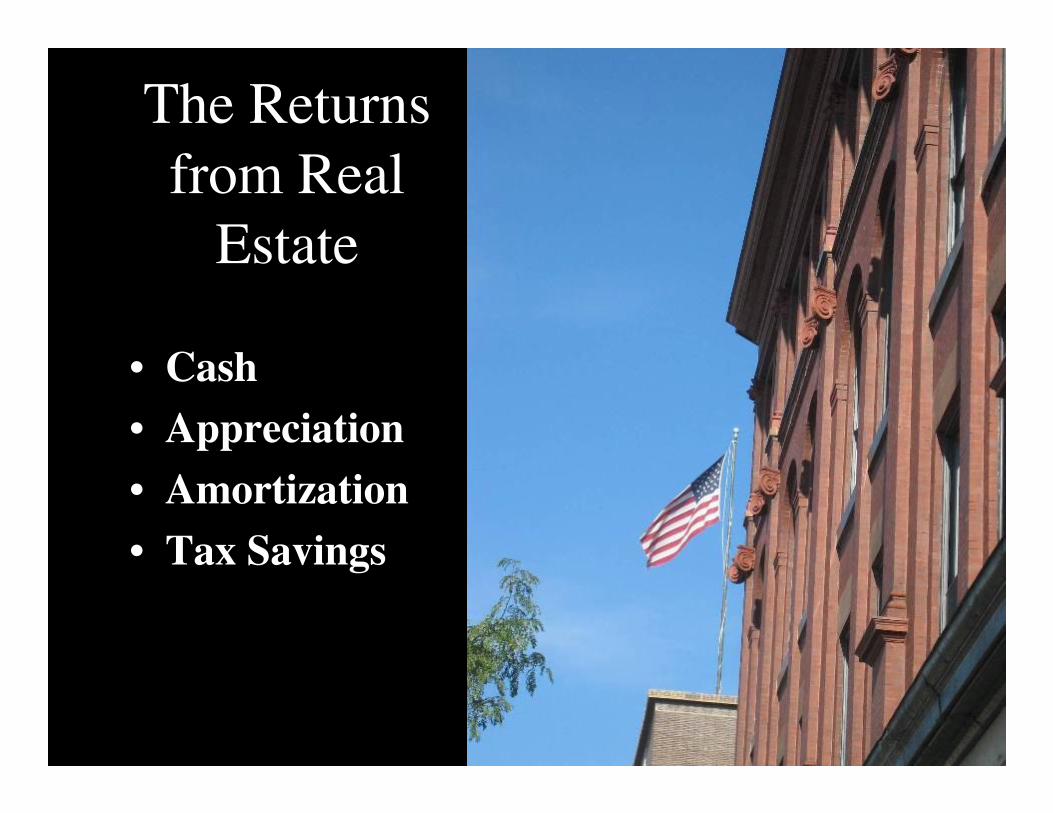
The Returns from Real
Estate
• Cash• Appreciation• Amortization• Tax Savings

COSTPRICE
VALUE
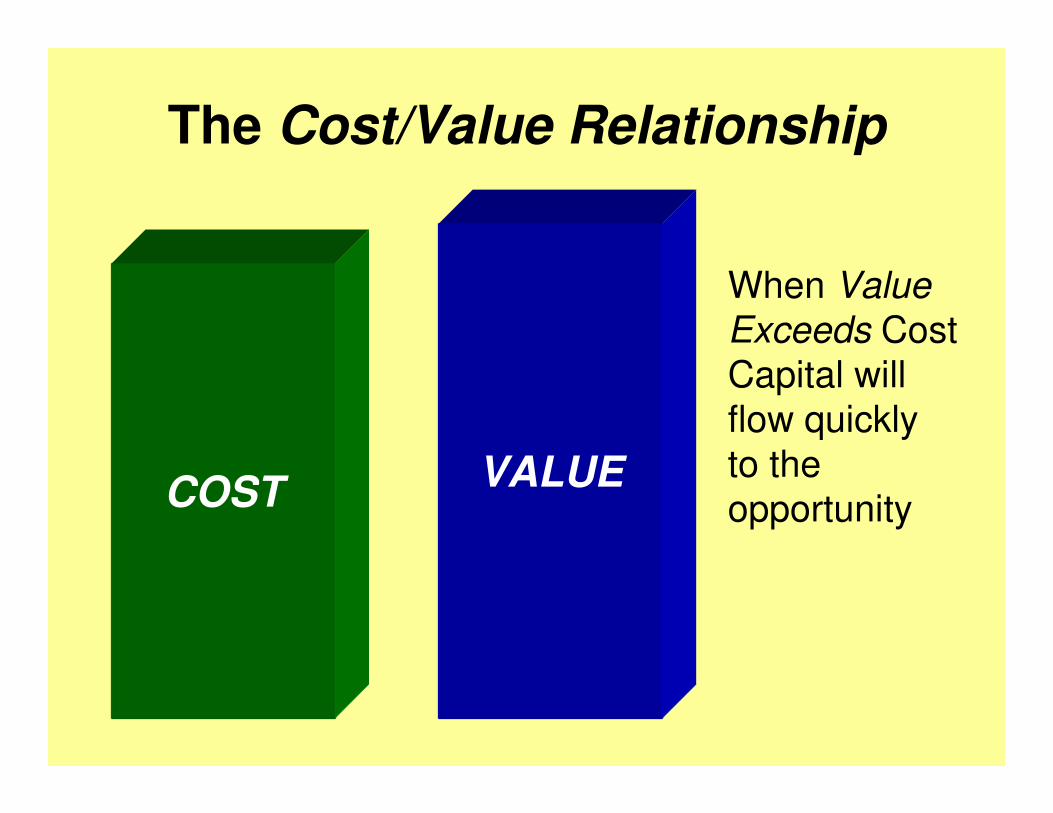
COST VALUE
When ValueExceeds CostCapital will flow quicklyto the opportunity
The Cost/Value Relationship
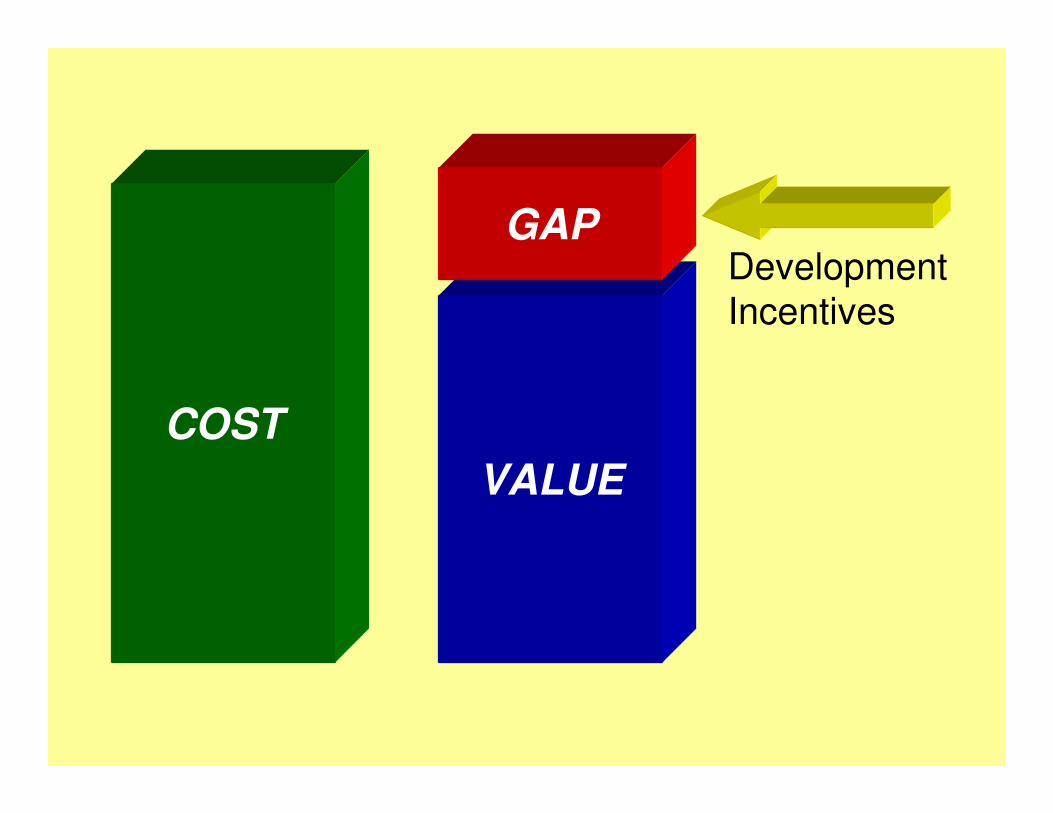
DevelopmentIncentives
COSTVALUE
GAP
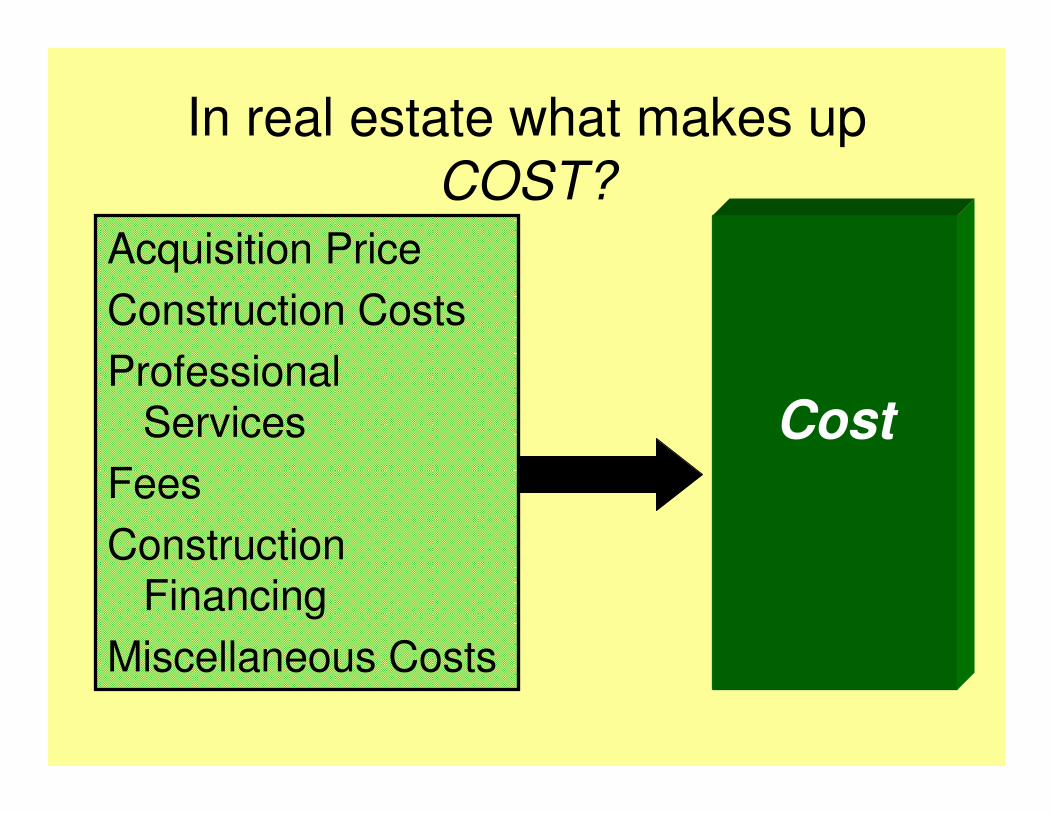
In real estate what makes up COST?
Cost
Acquisition PriceConstruction CostsProfessional
ServicesFeesConstruction
FinancingMiscellaneous Costs
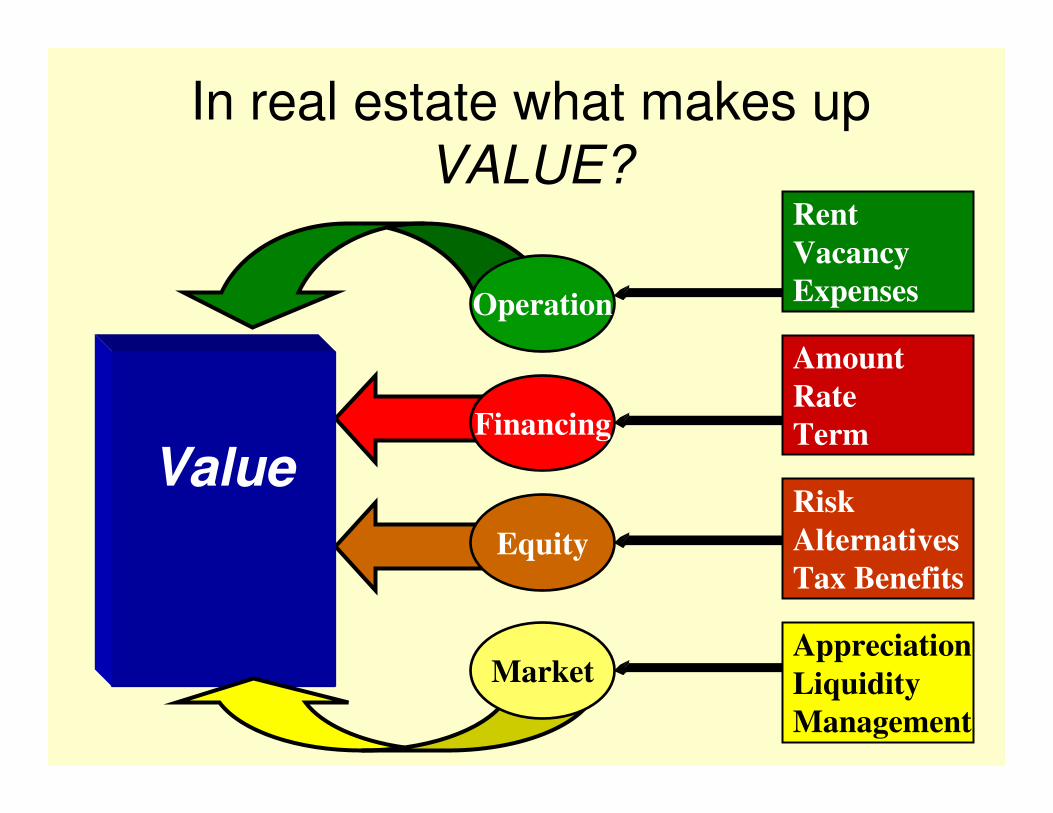
In real estate what makes up VALUE?
ValueFinancing
Operation
Equity
MarketAppreciationLiquidityManagement
RiskAlternativesTax Benefits
AmountRateTerm
RentVacancyExpenses
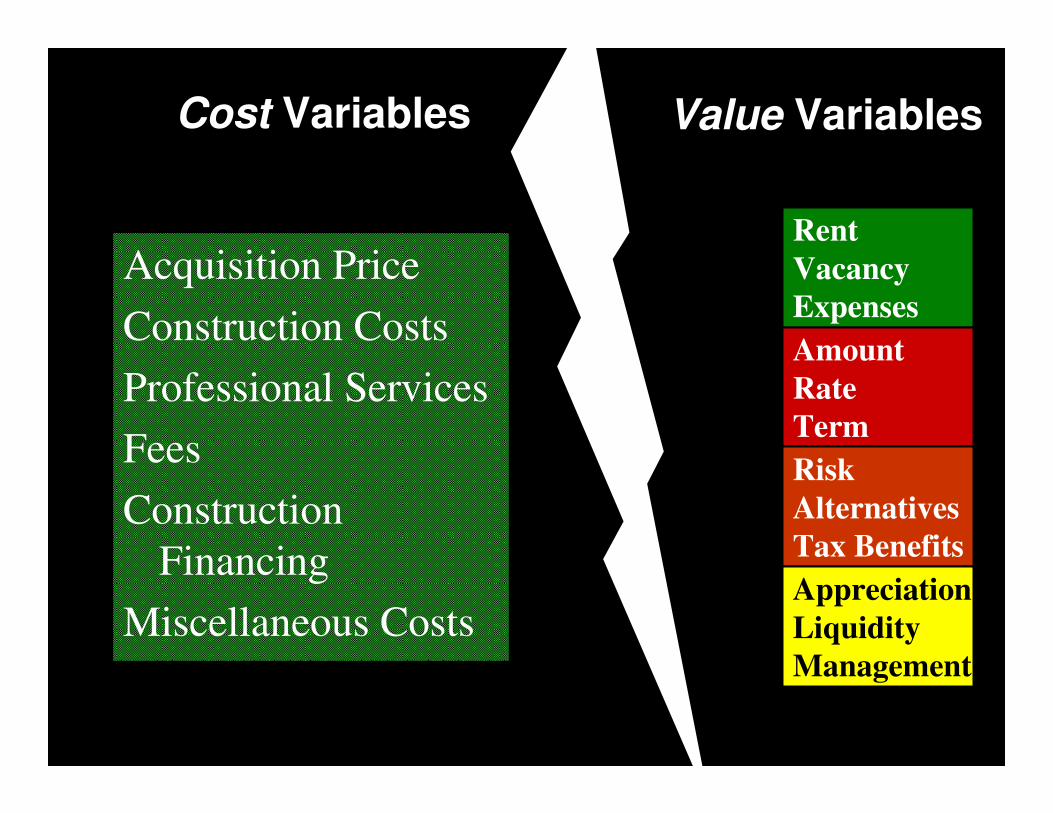
RentVacancyExpensesAmountRateTermRiskAlternativesTax BenefitsAppreciationLiquidityManagement
Acquisition PriceConstruction CostsProfessional ServicesFeesConstruction
FinancingMiscellaneous Costs
Cost Variables Value Variables
REWARD
RISK
The Risk/Reward Relationship
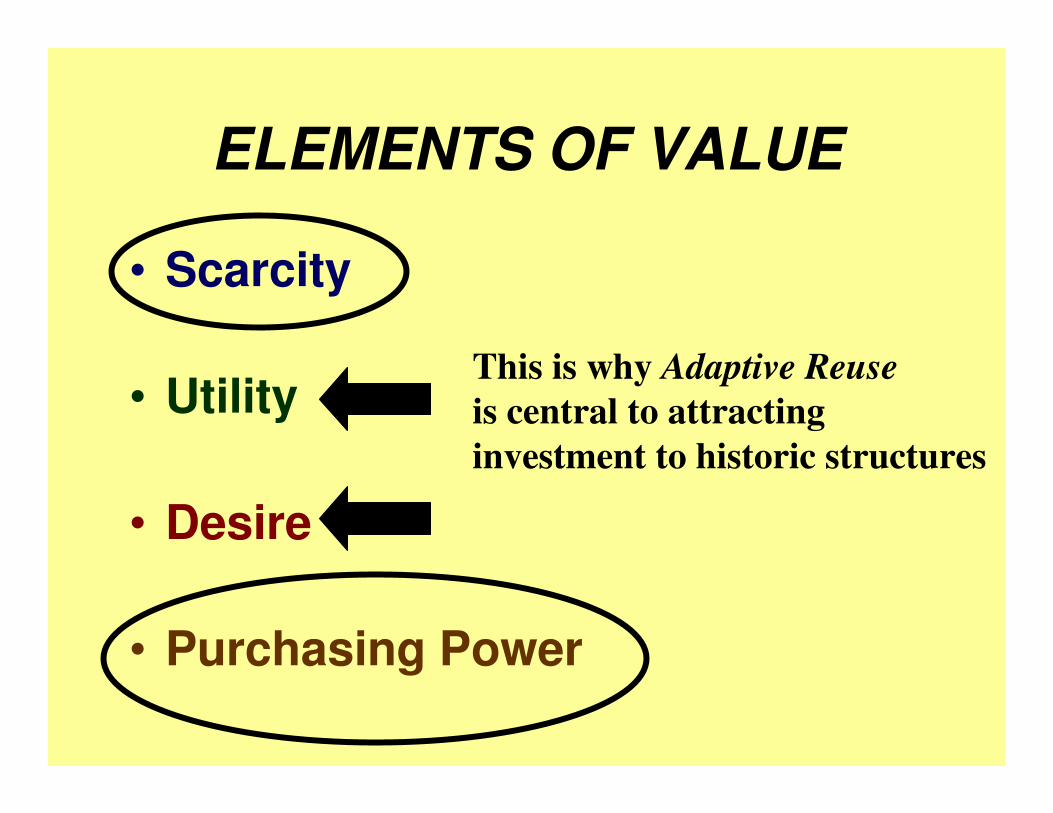
ELEMENTS OF VALUE
• Scarcity
• Utility
• Desire
• Purchasing Power
This is why Adaptive Reuseis central to attracting investment to historic structures
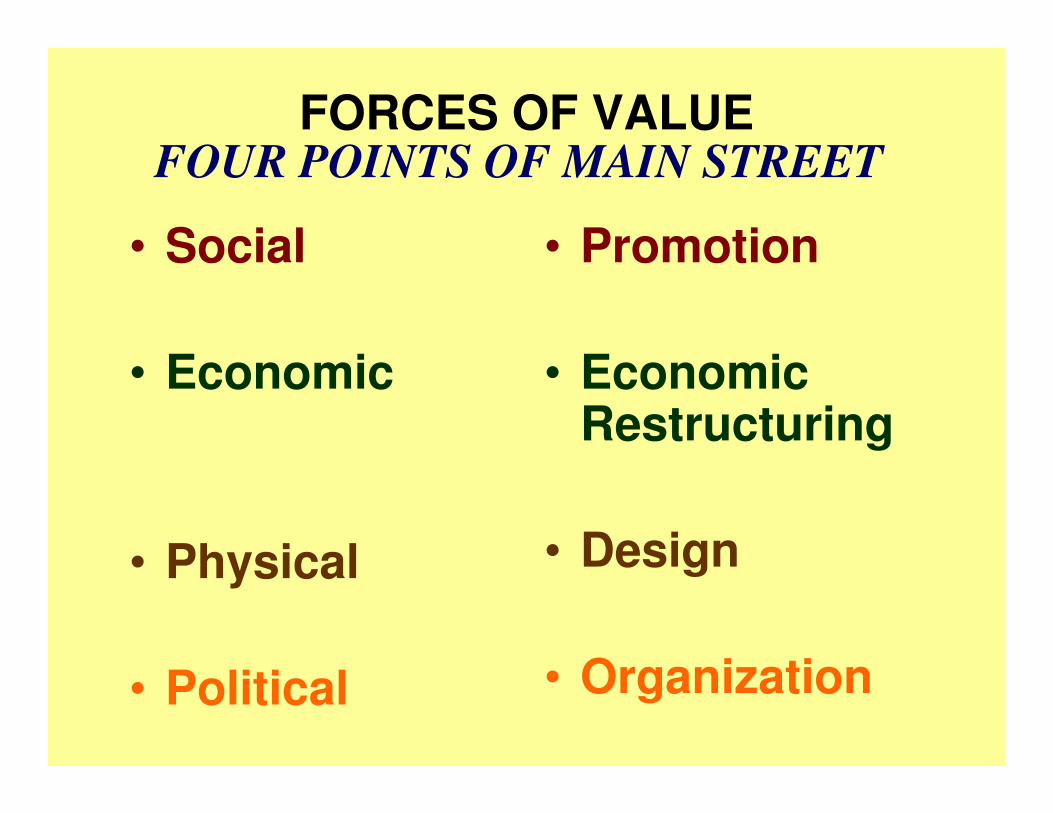
FORCES OF VALUE
• Social
• Economic
• Physical
• Political
• Promotion
• Economic Restructuring
• Design
• Organization
FOUR POINTS OF MAIN STREET

White Elephants
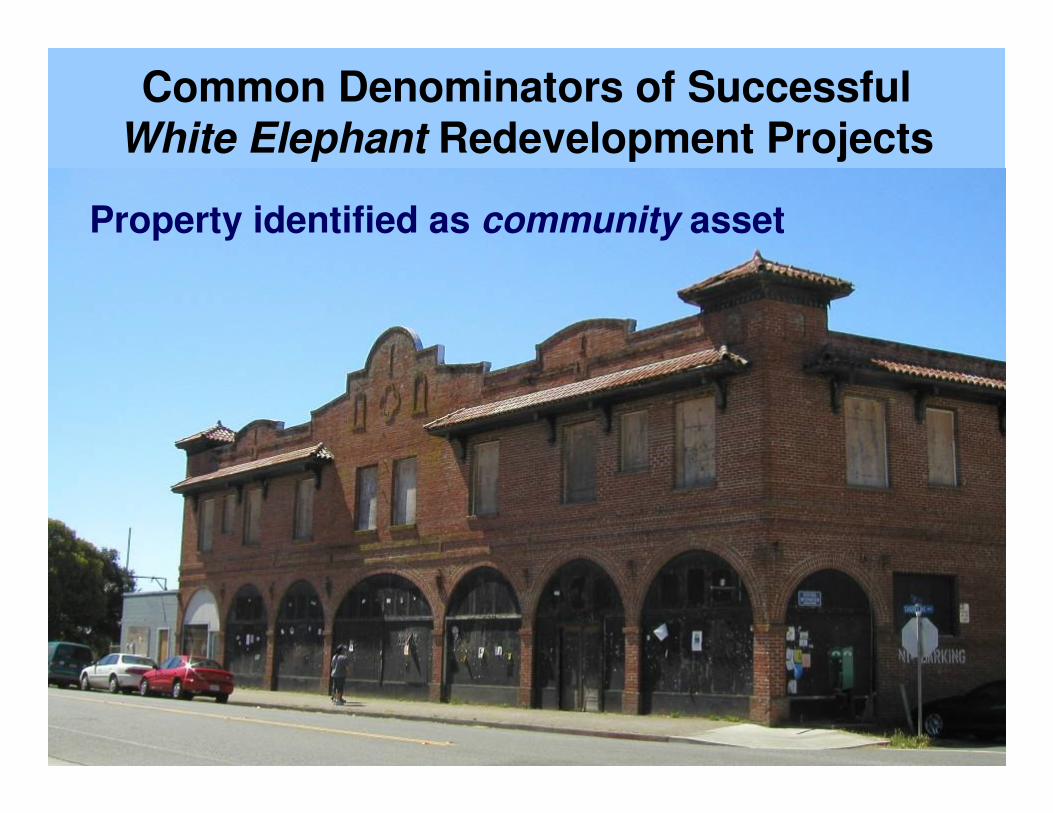
Common Denominators of Successful White Elephant Redevelopment Projects
Property identified as community asset
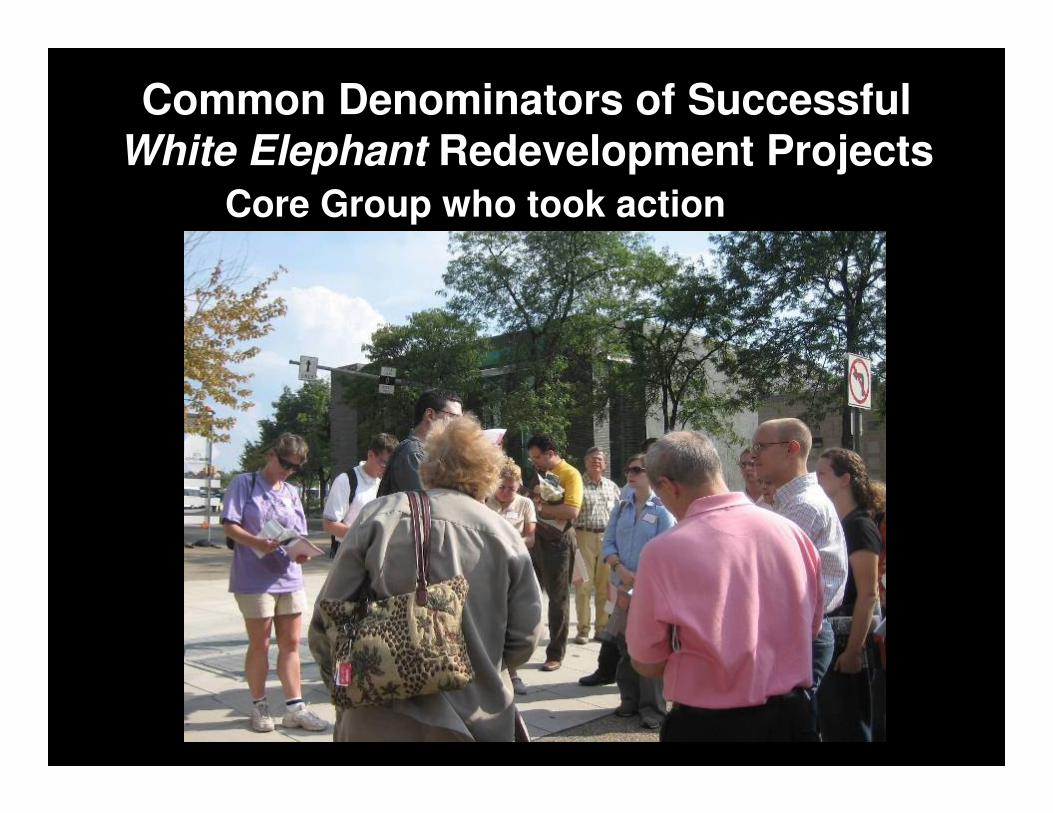
Common Denominators of Successful White Elephant Redevelopment Projects
Core Group who took action
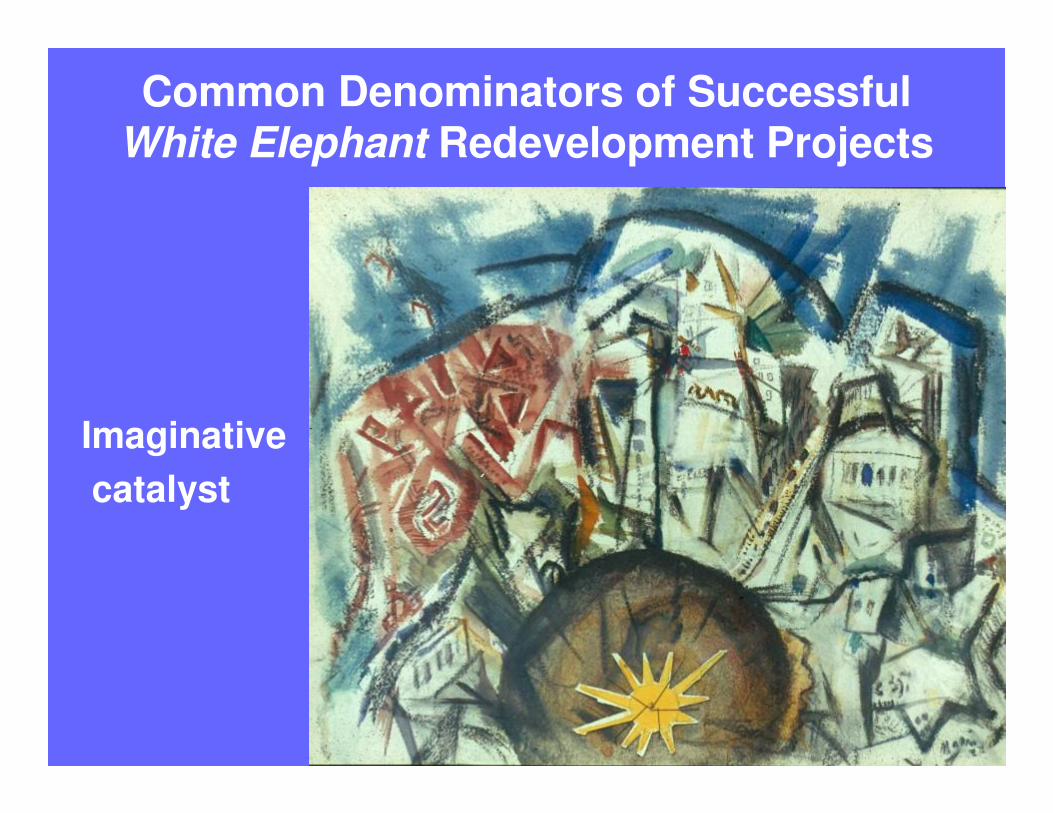
Common Denominators of Successful White Elephant Redevelopment Projects
Imaginativecatalyst
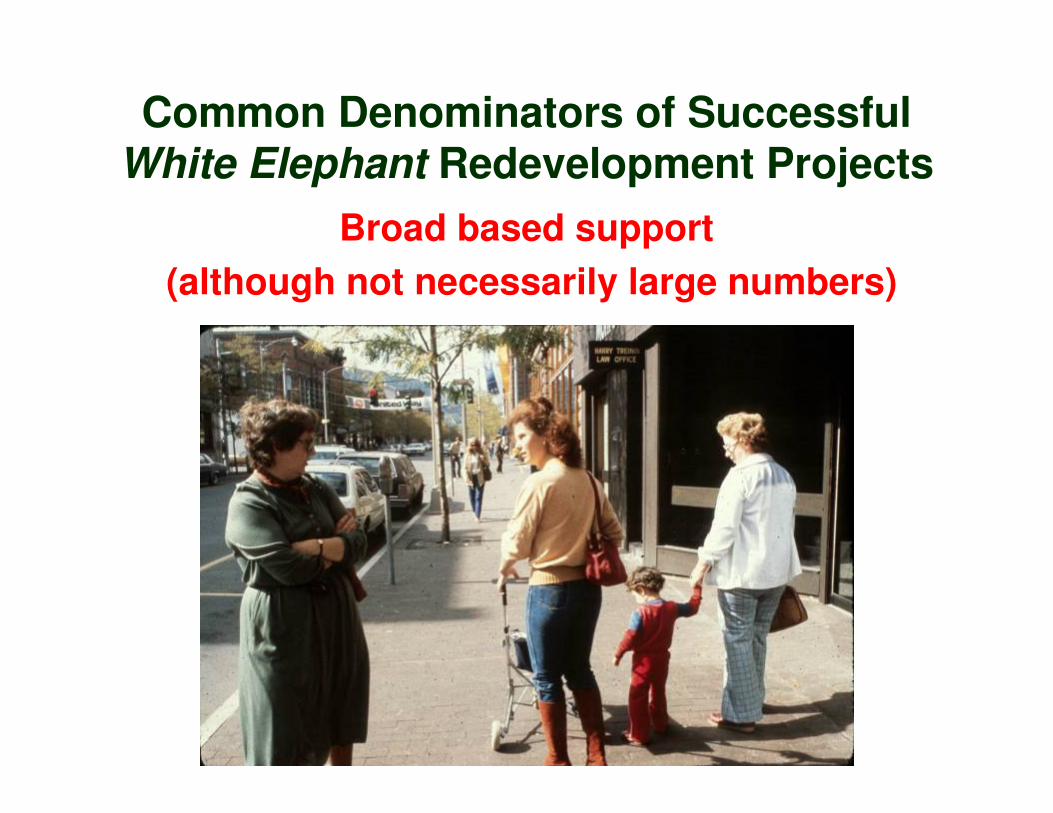
Common Denominators of Successful White Elephant Redevelopment Projects
Broad based support(although not necessarily large numbers)
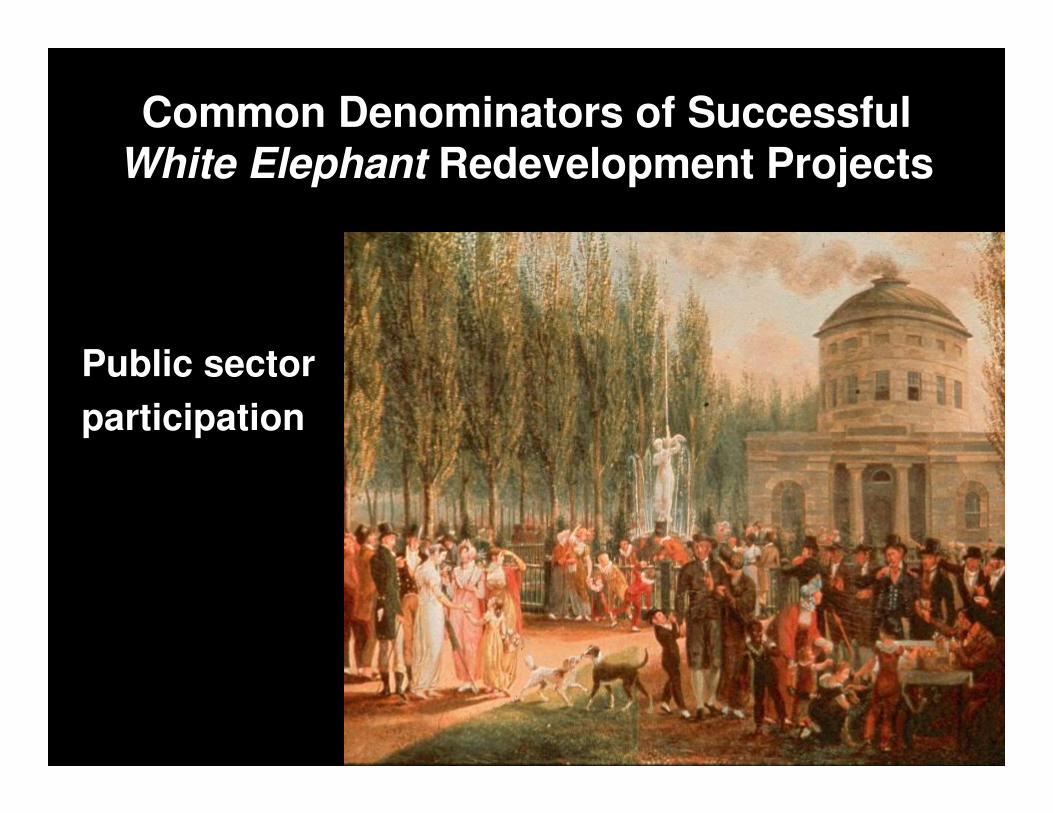
Common Denominators of Successful White Elephant Redevelopment Projects
Public sectorparticipation
Common Denominators of Successful White Elephant Redevelopment Projects
Multiple sources of financing
Common Denominators of Successful White Elephant Redevelopment Projects
Complexity
Common Denominators of Successful White Elephant Redevelopment Projects
Time consuming
More time consuming than anticipated

Manpower and Womanpower Intensive
Common Denominators of Successful White Elephant Redevelopment Projects
Common Denominators of Successful White Elephant Redevelopment Projects
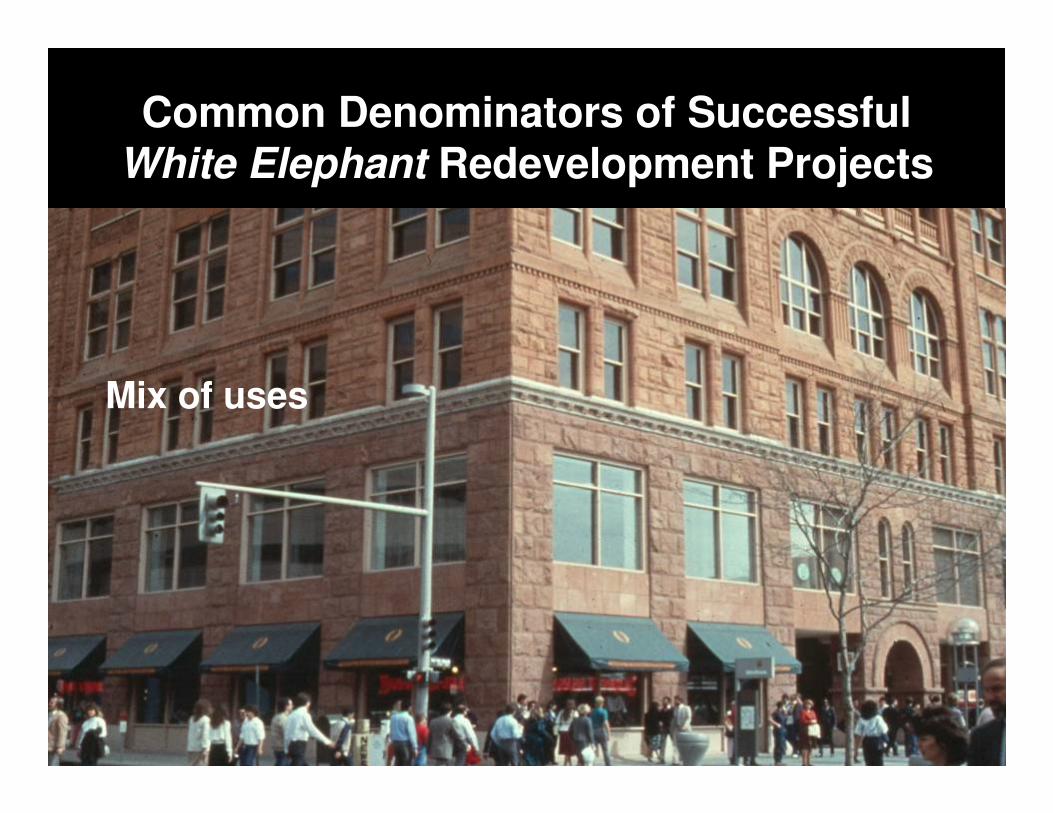
Mix of uses
Common Denominators of Successful White Elephant Redevelopment Projects
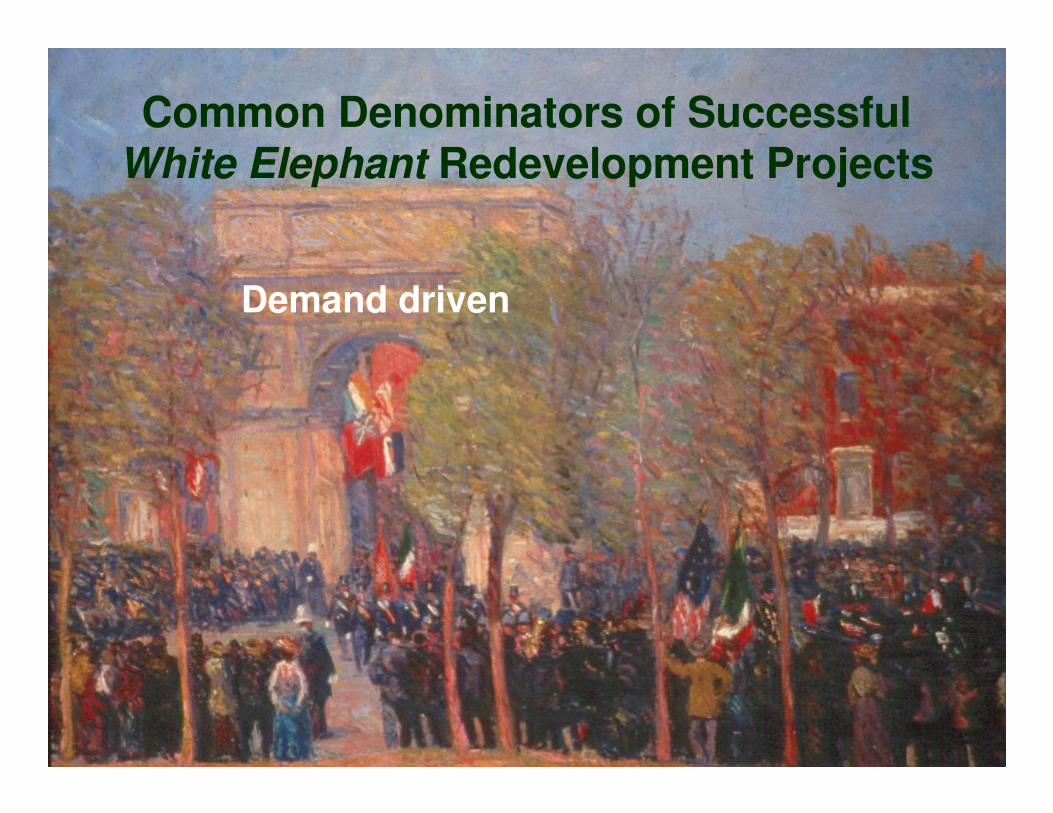
Demand driven
Common Denominators of Successful White Elephant Redevelopment Projects
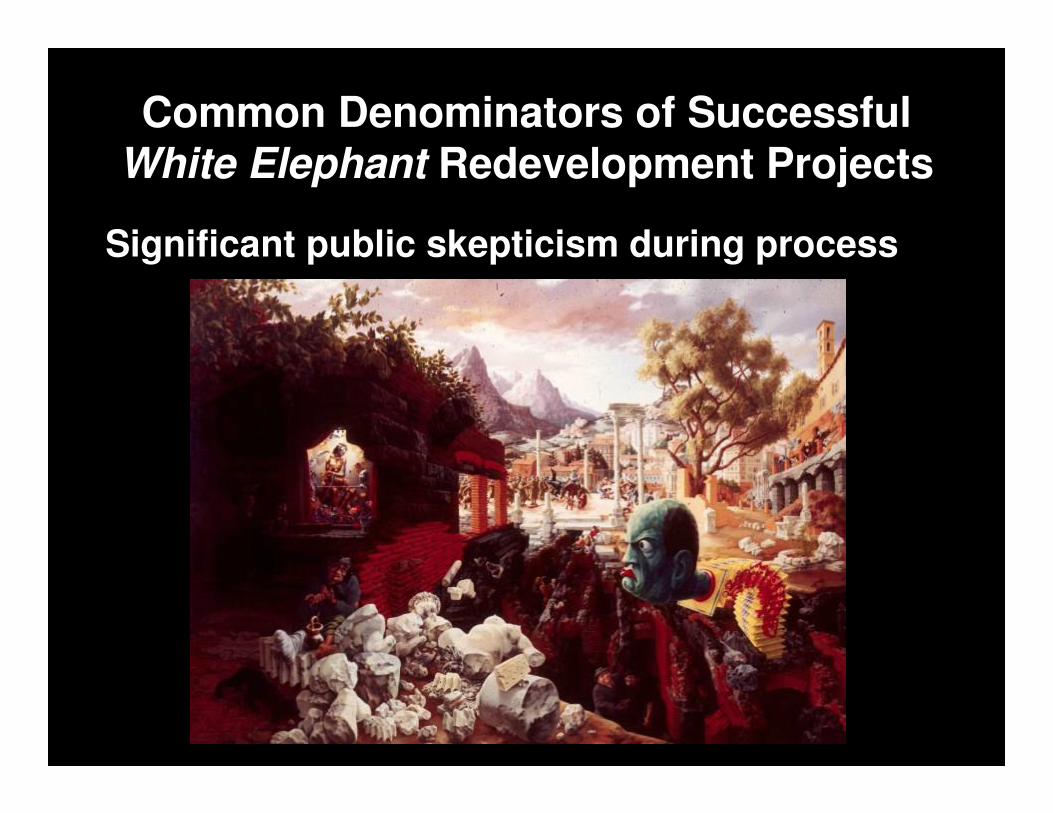
Significant public skepticism during process
Common Denominators of Successful White Elephant Redevelopment Projects
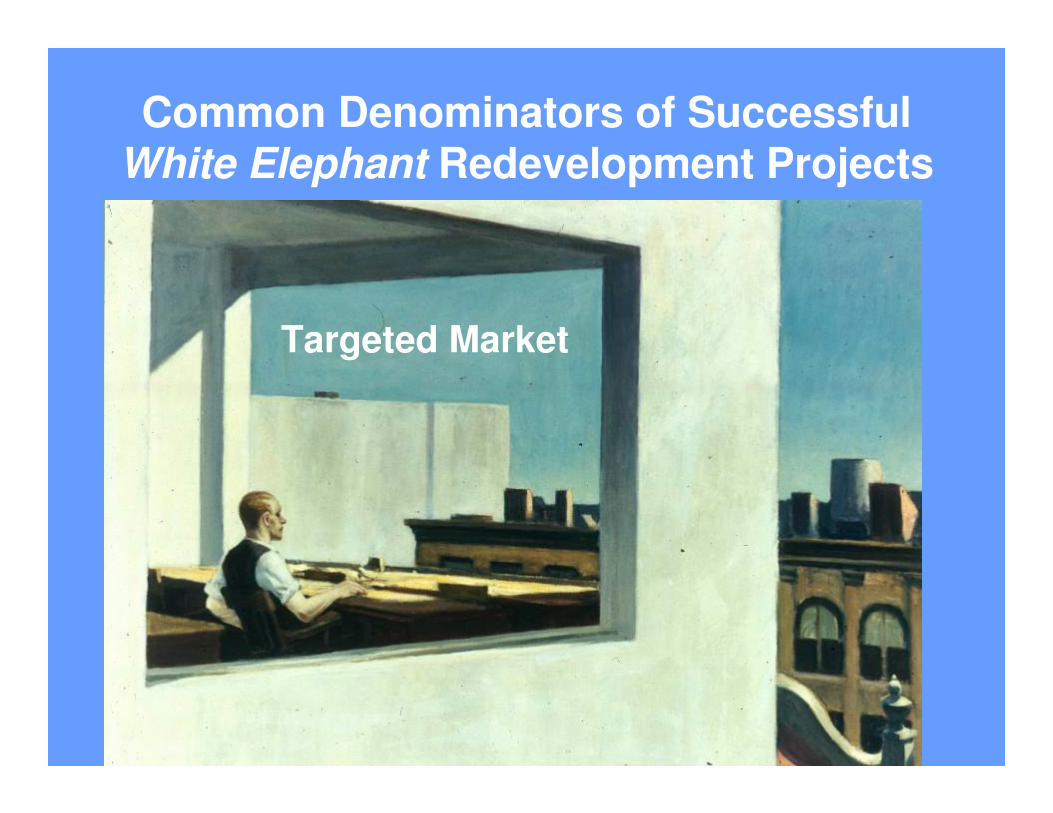
Targeted Market
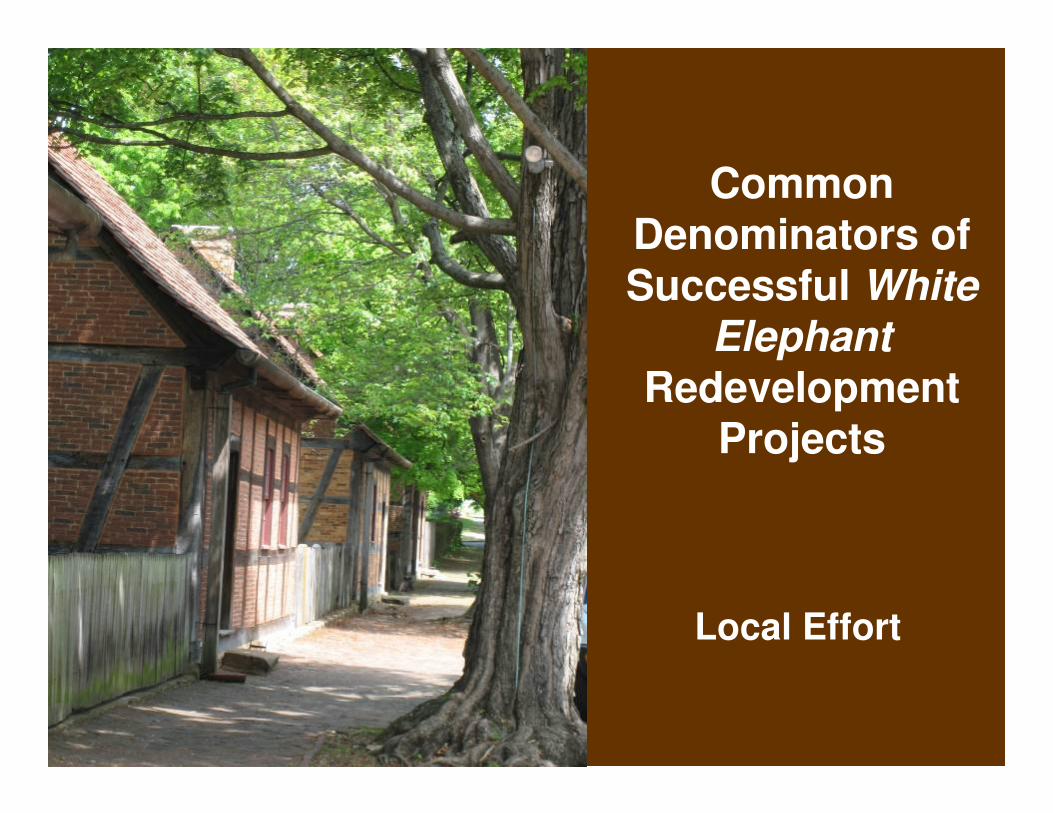
Common Denominators of Successful White
ElephantRedevelopment
Projects
Local Effort
Common Denominators of Successful White Elephant Redevelopment Projects
Flexibility in use, financing, timing, transaction
Common Denominators of Successful White Elephant Redevelopment Projects
Acquisition price approaching zero
Common Denominators of Successful
White ElephantRedevelopment
Projects
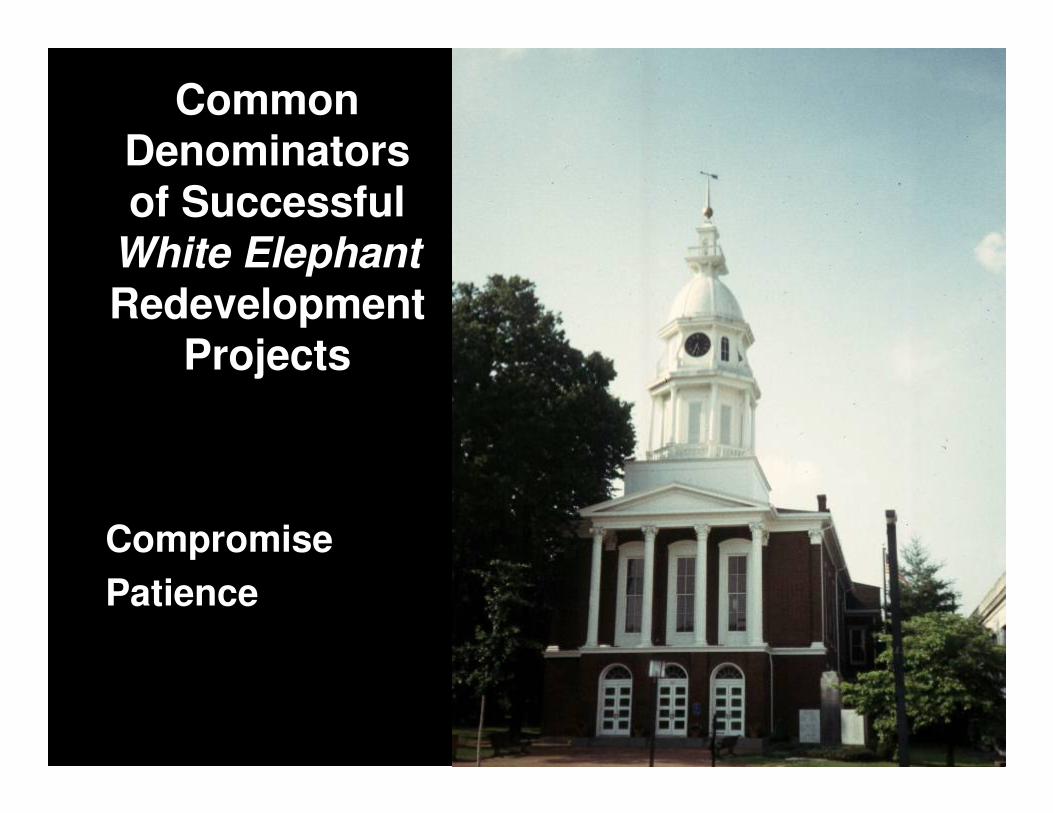
CompromisePatience
Common Denominators of Successful White Elephant Redevelopment Projects
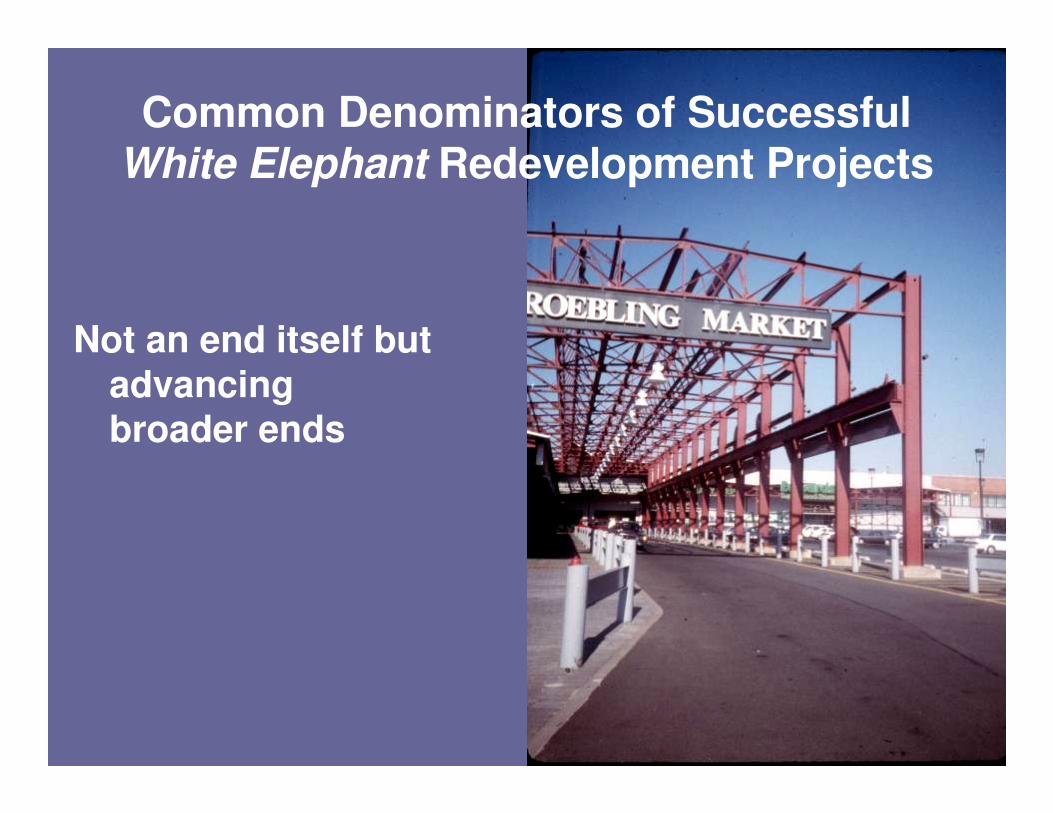
Not an end itself but advancing broader ends

Pro Forma Analysis
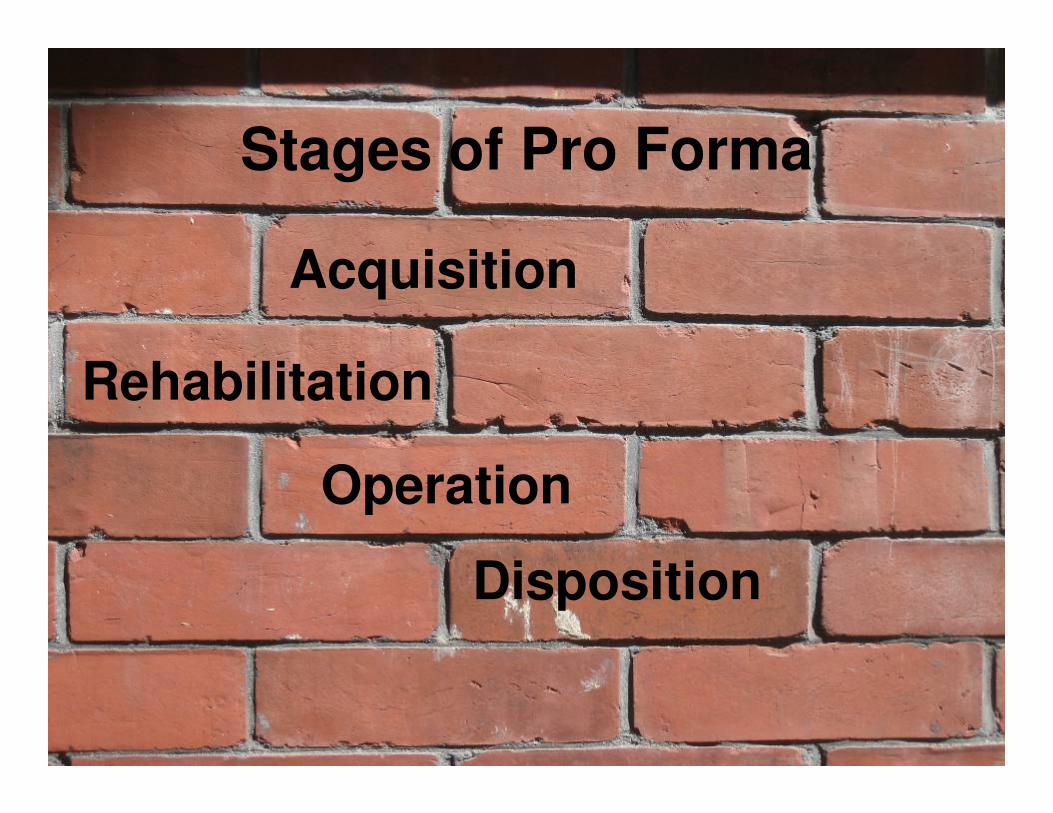
Stages of Pro Forma
Acquisition
Rehabilitation
Operation
Disposition
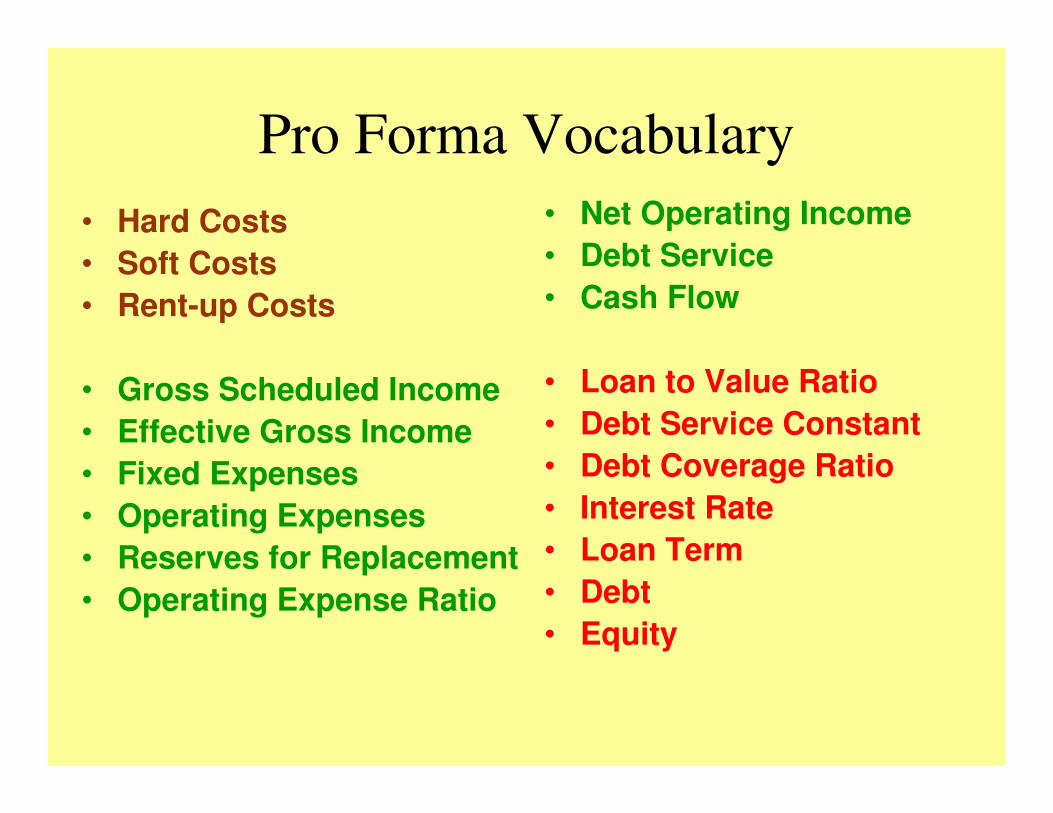
Pro Forma Vocabulary• Hard Costs• Soft Costs• Rent-up Costs
• Gross Scheduled Income• Effective Gross Income• Fixed Expenses• Operating Expenses• Reserves for Replacement• Operating Expense Ratio
• Net Operating Income• Debt Service• Cash Flow
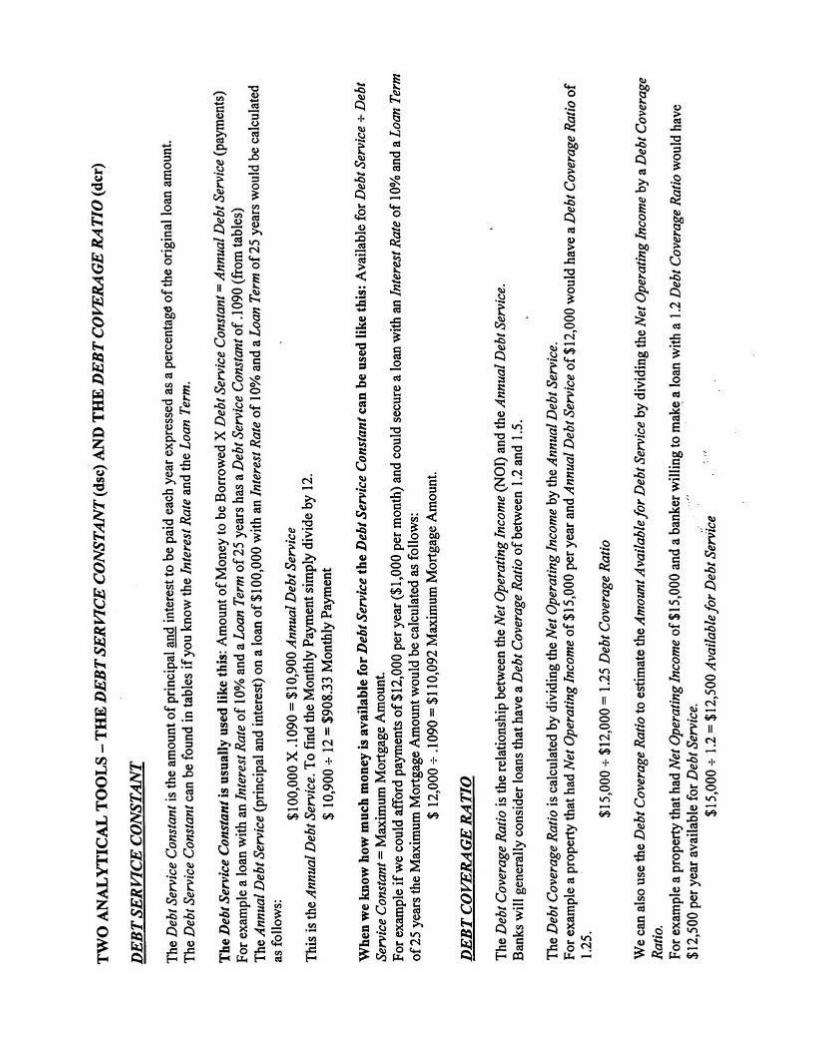
• Loan to Value Ratio• Debt Service Constant• Debt Coverage Ratio• Interest Rate• Loan Term• Debt• Equity
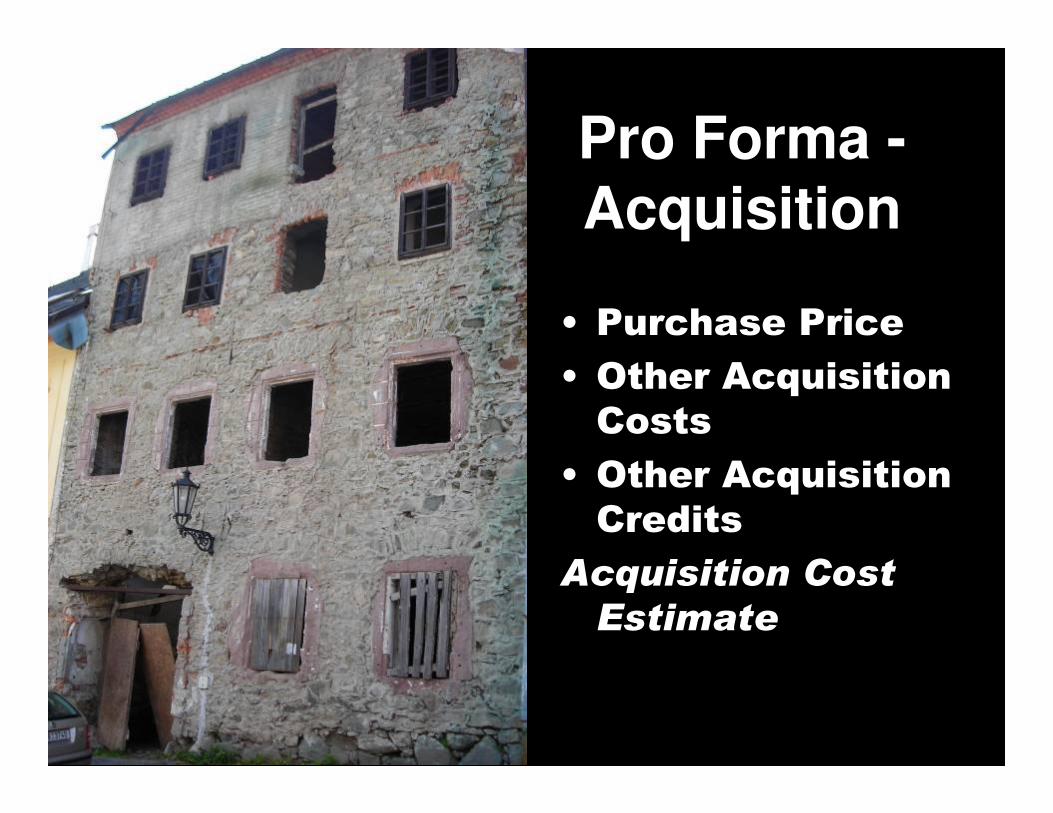
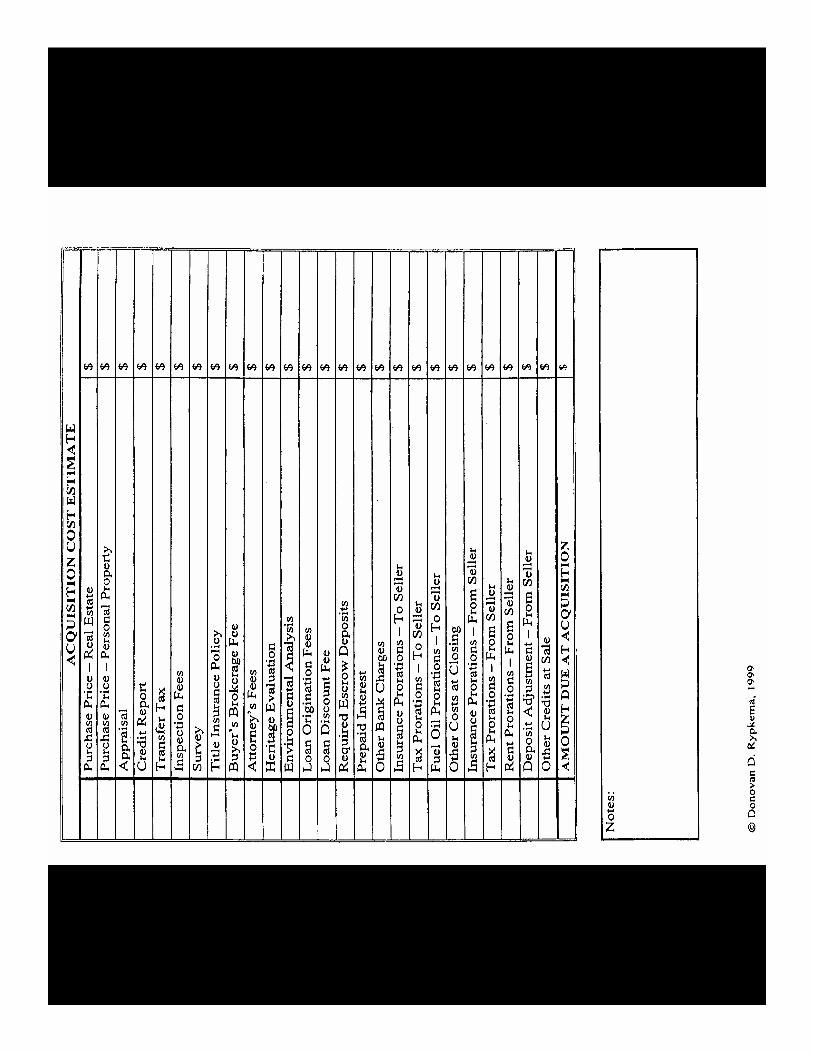
Pro Forma -Acquisition
� �����������
� � ��������� ���
��� �
� � ��������� ���
���� �
��������������
���� ���
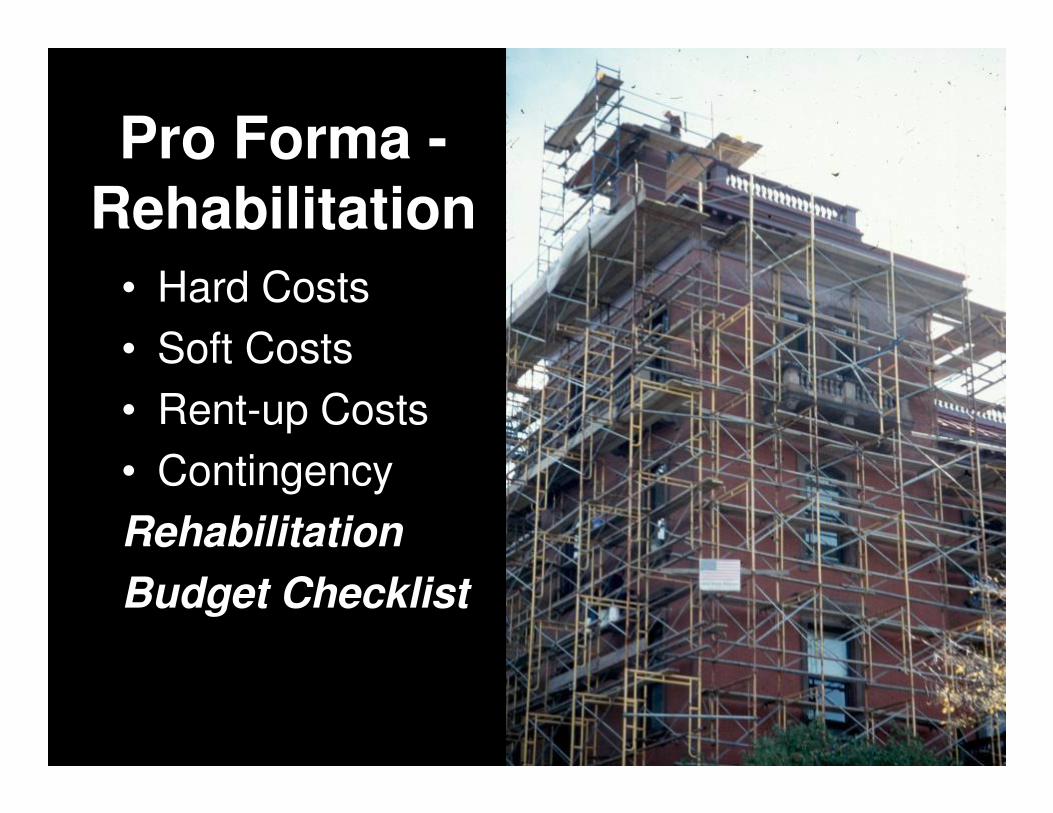
Pro Forma -Rehabilitation
• Hard Costs• Soft Costs• Rent-up Costs• ContingencyRehabilitation Budget Checklist
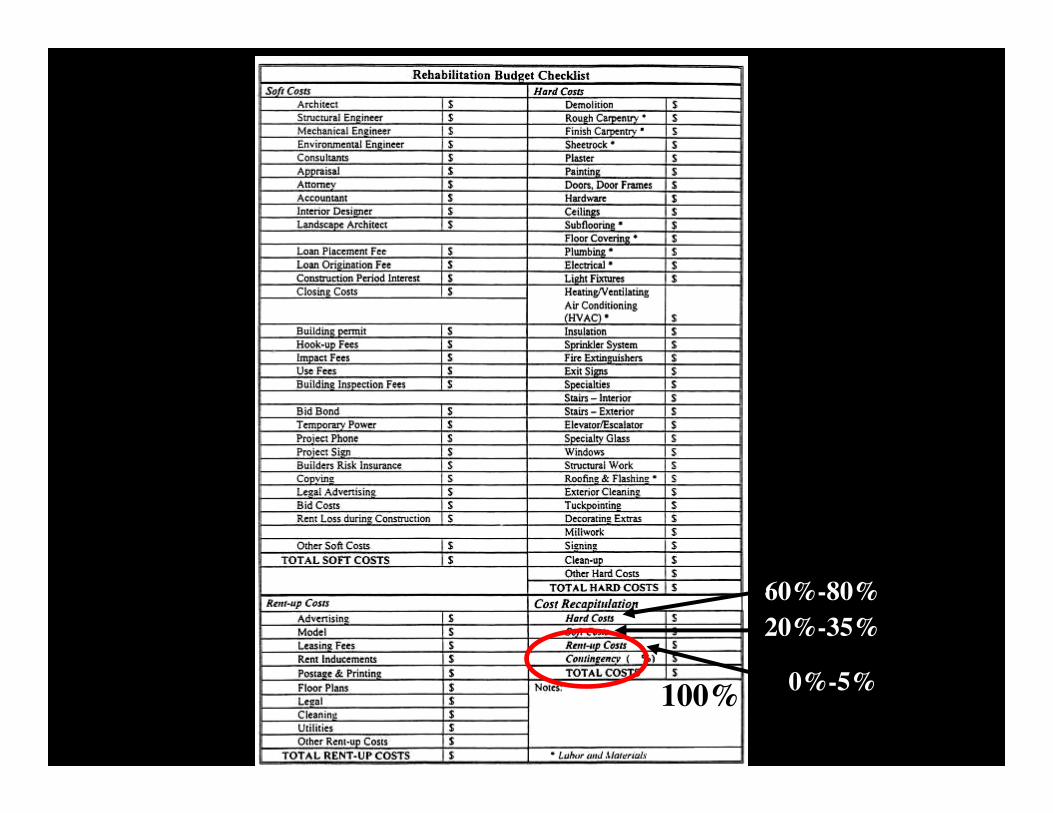
60%-80%20%-35%
0%-5%100%
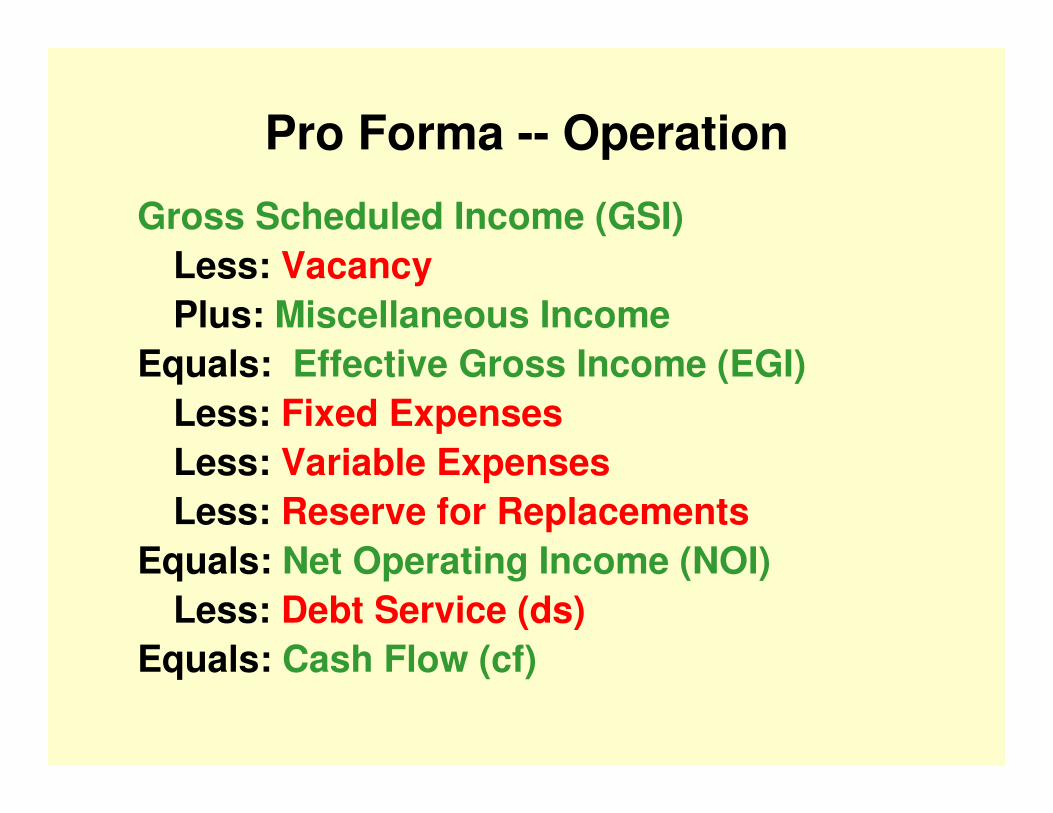
Pro Forma -- Operation
Gross Scheduled Income (GSI)Less: VacancyPlus: Miscellaneous Income
Equals: Effective Gross Income (EGI)Less: Fixed ExpensesLess: Variable ExpensesLess: Reserve for Replacements
Equals: Net Operating Income (NOI)Less: Debt Service (ds)
Equals: Cash Flow (cf)
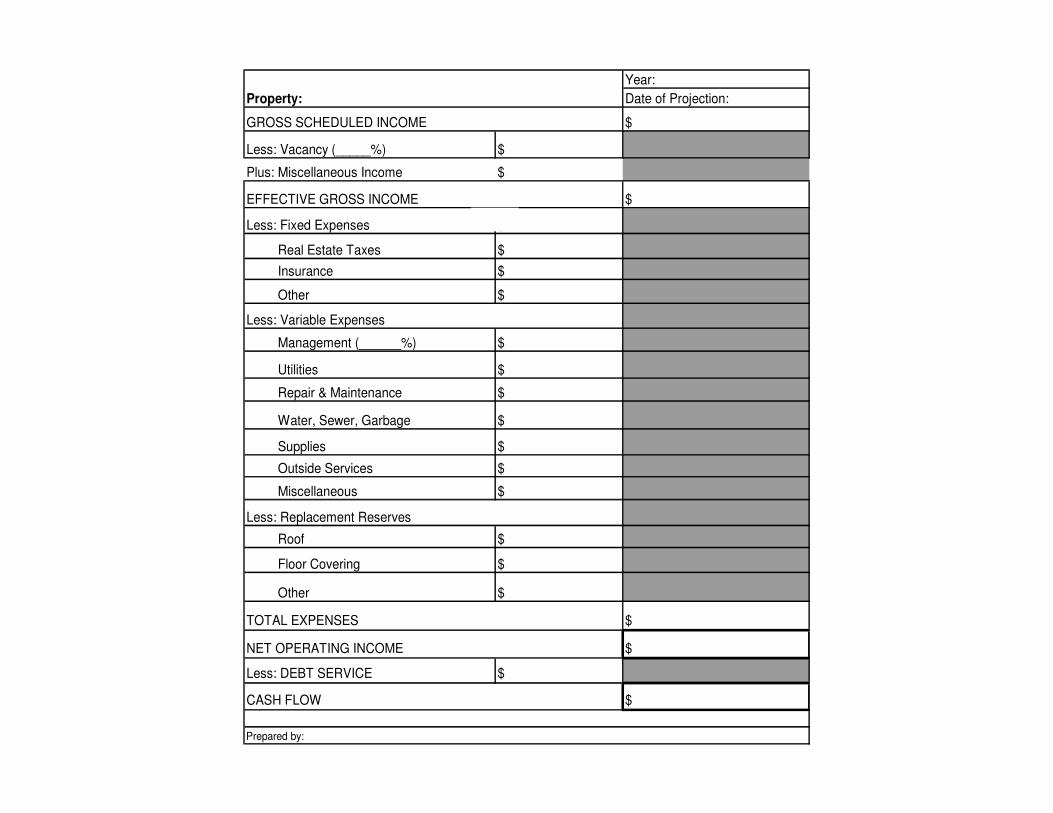
Year:Date of Projection:
$
Less: Vacancy (_____%) $
Plus: Miscellaneous Income $
$
Less: Fixed Expenses $
Real Estate Taxes $ Insurance $
Other $
Management (______%) $
Utilities $
Repair & Maintenance $
Water, Sewer, Garbage $
Supplies $
Outside Services $
Miscellaneous $
Roof $
Floor Covering $
Other $
$
$
Less: DEBT SERVICE $
$
Property:
GROSS SCHEDULED INCOME
Less: Replacement Reserves
Less: Variable Expenses
EFFECTIVE GROSS INCOME
Prepared by:
CASH FLOW
TOTAL EXPENSES
NET OPERATING INCOME
Year:Date of Projection:
$
Less: Vacancy (_____%) $
Plus: Miscellaneous Income $
$
Less: Fixed Expenses $
Real Estate Taxed $ Insurance $
Other $
Management (______%) $
Utilities $
Repair & Maintenance $
Water, Sewer, Garbage $
Supplies $
Outside Services $
Miscellaneous $
Roof $
Floor Covering $
Other $
$
$
Less: DEBT SERVICE $
$
Property:
GROSS SCHEDULED INCOME
Less: Replacement Reserves
Less: Variable Expenses
EFFECTIVE GROSS INCOME
Prepared by:
CASH FLOW
TOTAL EXPENSES
NET OPERATING INCOME
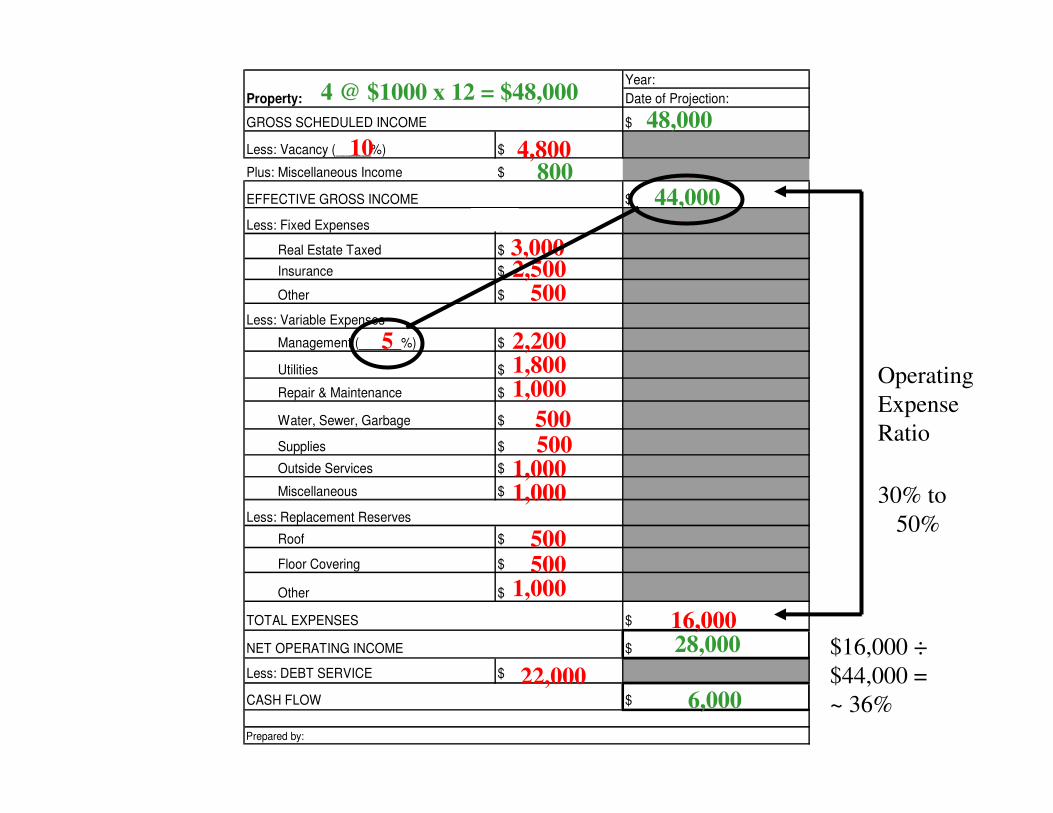
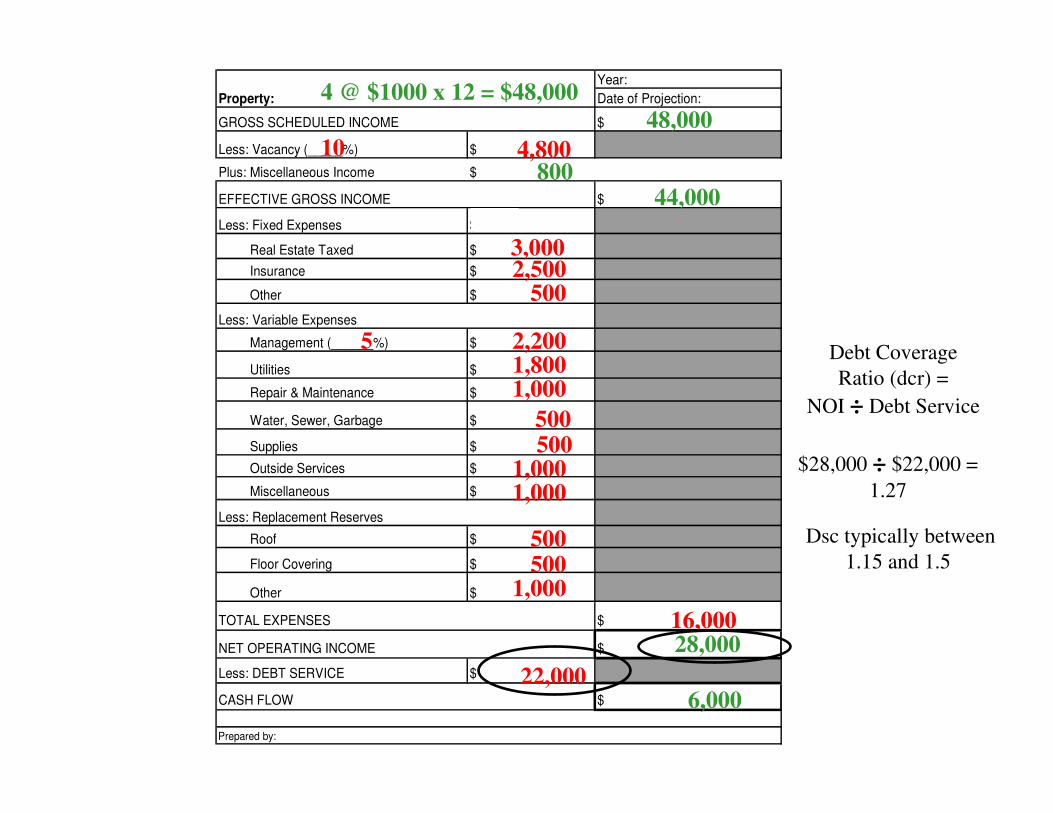
4 @ $1000 x 12 = $48,00048,000
10 4,800800
44,000
3,0002,500
500
5 2,2001,8001,000
1,000500
1,000
500
500500
1,00016,00028,000
22,0006,000
OperatingExpenseRatio
30% to 50%
$16,000 ÷$44,000 =~ 36%
����������������������������������������������������
�� ��������� �� �� ��������� �� �� ��������� �� �� ��������� ��
�� �������� ���� �������� ���� �������� ���� �������� ��
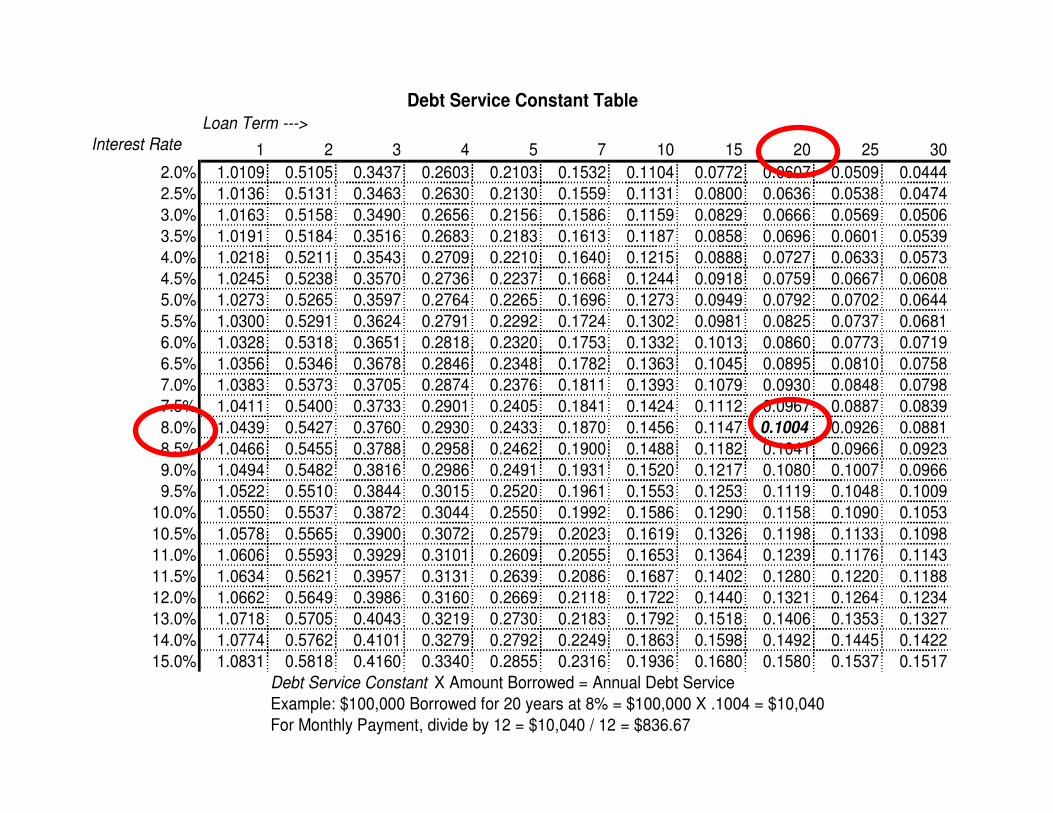
Debt Service Constant TableLoan Term --->
Interest Rate 1 2 3 4 5 7 10 15 20 25 302.0% 1.0109 0.5105 0.3437 0.2603 0.2103 0.1532 0.1104 0.0772 0.0607 0.0509 0.04442.5% 1.0136 0.5131 0.3463 0.2630 0.2130 0.1559 0.1131 0.0800 0.0636 0.0538 0.04743.0% 1.0163 0.5158 0.3490 0.2656 0.2156 0.1586 0.1159 0.0829 0.0666 0.0569 0.05063.5% 1.0191 0.5184 0.3516 0.2683 0.2183 0.1613 0.1187 0.0858 0.0696 0.0601 0.05394.0% 1.0218 0.5211 0.3543 0.2709 0.2210 0.1640 0.1215 0.0888 0.0727 0.0633 0.05734.5% 1.0245 0.5238 0.3570 0.2736 0.2237 0.1668 0.1244 0.0918 0.0759 0.0667 0.06085.0% 1.0273 0.5265 0.3597 0.2764 0.2265 0.1696 0.1273 0.0949 0.0792 0.0702 0.06445.5% 1.0300 0.5291 0.3624 0.2791 0.2292 0.1724 0.1302 0.0981 0.0825 0.0737 0.06816.0% 1.0328 0.5318 0.3651 0.2818 0.2320 0.1753 0.1332 0.1013 0.0860 0.0773 0.07196.5% 1.0356 0.5346 0.3678 0.2846 0.2348 0.1782 0.1363 0.1045 0.0895 0.0810 0.07587.0% 1.0383 0.5373 0.3705 0.2874 0.2376 0.1811 0.1393 0.1079 0.0930 0.0848 0.07987.5% 1.0411 0.5400 0.3733 0.2901 0.2405 0.1841 0.1424 0.1112 0.0967 0.0887 0.08398.0% 1.0439 0.5427 0.3760 0.2930 0.2433 0.1870 0.1456 0.1147 0.1004 0.0926 0.08818.5% 1.0466 0.5455 0.3788 0.2958 0.2462 0.1900 0.1488 0.1182 0.1041 0.0966 0.09239.0% 1.0494 0.5482 0.3816 0.2986 0.2491 0.1931 0.1520 0.1217 0.1080 0.1007 0.09669.5% 1.0522 0.5510 0.3844 0.3015 0.2520 0.1961 0.1553 0.1253 0.1119 0.1048 0.1009
10.0% 1.0550 0.5537 0.3872 0.3044 0.2550 0.1992 0.1586 0.1290 0.1158 0.1090 0.105310.5% 1.0578 0.5565 0.3900 0.3072 0.2579 0.2023 0.1619 0.1326 0.1198 0.1133 0.109811.0% 1.0606 0.5593 0.3929 0.3101 0.2609 0.2055 0.1653 0.1364 0.1239 0.1176 0.114311.5% 1.0634 0.5621 0.3957 0.3131 0.2639 0.2086 0.1687 0.1402 0.1280 0.1220 0.118812.0% 1.0662 0.5649 0.3986 0.3160 0.2669 0.2118 0.1722 0.1440 0.1321 0.1264 0.123413.0% 1.0718 0.5705 0.4043 0.3219 0.2730 0.2183 0.1792 0.1518 0.1406 0.1353 0.132714.0% 1.0774 0.5762 0.4101 0.3279 0.2792 0.2249 0.1863 0.1598 0.1492 0.1445 0.142215.0% 1.0831 0.5818 0.4160 0.3340 0.2855 0.2316 0.1936 0.1680 0.1580 0.1537 0.1517
Debt Service Constant X Amount Borrowed = Annual Debt ServiceExample: $100,000 Borrowed for 20 years at 8% = $100,000 X .1004 = $10,040For Monthly Payment, divide by 12 = $10,040 / 12 = $836.67
Year:Date of Projection:
$
Less: Vacancy (_____%) $
Plus: Miscellaneous Income $
$
Less: Fixed Expenses $
Real Estate Taxed $ Insurance $
Other $
Management (______%) $
Utilities $
Repair & Maintenance $
Water, Sewer, Garbage $
Supplies $
Outside Services $
Miscellaneous $
Roof $
Floor Covering $
Other $
$
$
Less: DEBT SERVICE $
$
Prepared by:
CASH FLOW
TOTAL EXPENSES
NET OPERATING INCOME
Property:
GROSS SCHEDULED INCOME
Less: Replacement Reserves
Less: Variable Expenses
EFFECTIVE GROSS INCOME
4 @ $1000 x 12 = $48,00048,000
10 4,800800
44,000
3,0002,500
500
5 2,2001,8001,000
1,000500
1,000
500
500500
1,00016,00028,000
22,0006,000
Debt CoverageRatio (dcr) =
NOI ÷ Debt Service
$28,000 ÷ $22,000 =1.27
Dsc typically between1.15 and 1.5
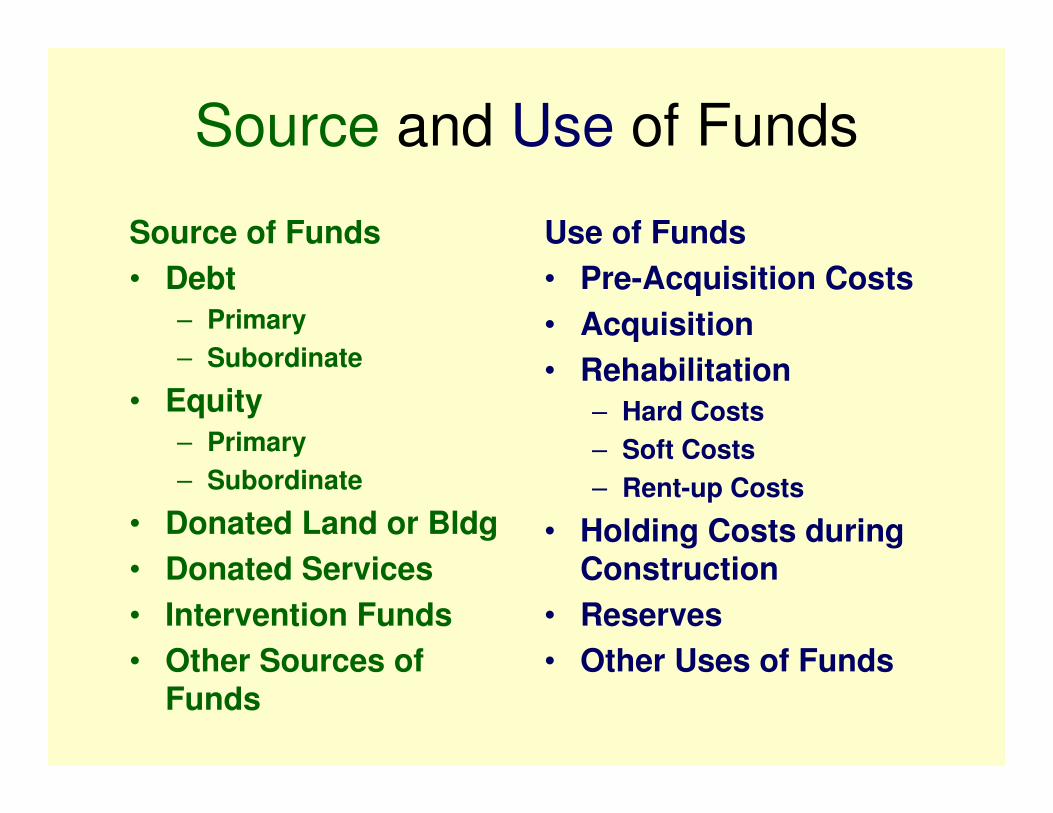
Source and Use of Funds
Source of Funds• Debt
– Primary– Subordinate
• Equity– Primary– Subordinate
• Donated Land or Bldg• Donated Services• Intervention Funds• Other Sources of
Funds
Use of Funds• Pre-Acquisition Costs• Acquisition• Rehabilitation
– Hard Costs– Soft Costs– Rent-up Costs
• Holding Costs during Construction
• Reserves• Other Uses of Funds
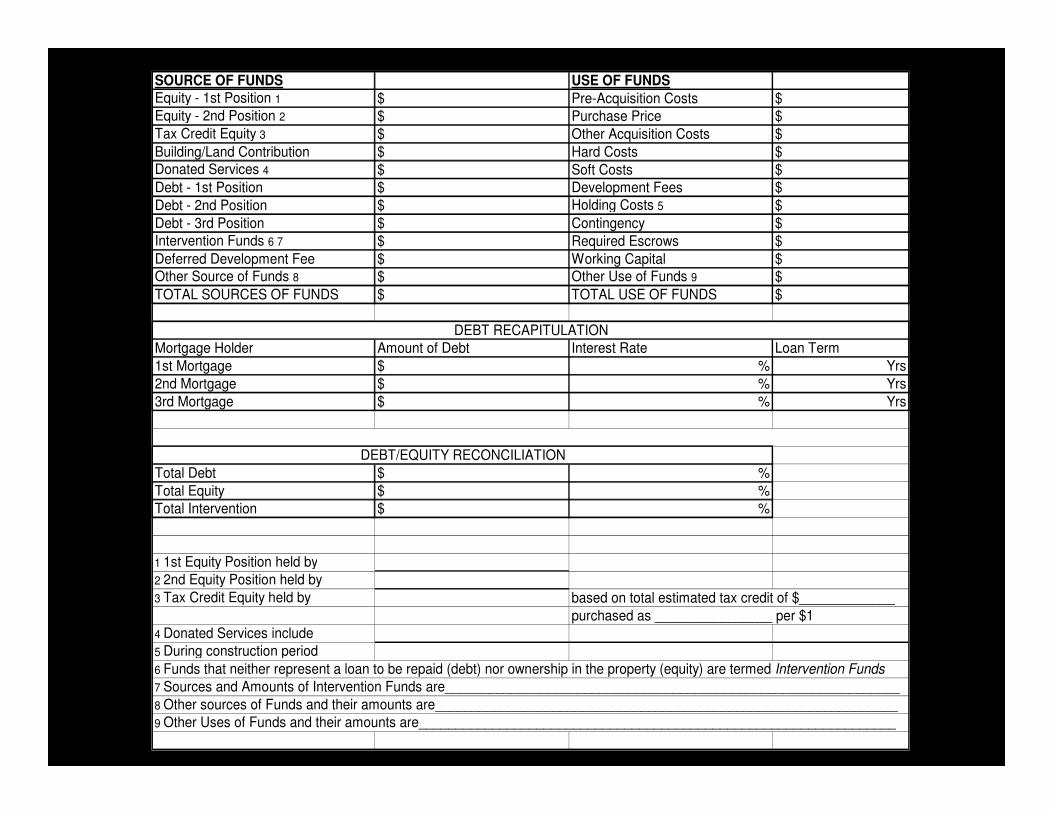
SOURCE OF FUNDS USE OF FUNDSEquity - 1st Position 1 $ Pre-Acquisition Costs $Equity - 2nd Position 2 $ Purchase Price $Tax Credit Equity 3 $ Other Acquisition Costs $Building/Land Contribution $ Hard Costs $Donated Services 4 $ Soft Costs $Debt - 1st Position $ Development Fees $Debt - 2nd Position $ Holding Costs 5 $Debt - 3rd Position $ Contingency $Intervention Funds 6 7 $ Required Escrows $Deferred Development Fee $ Working Capital $Other Source of Funds 8 $ Other Use of Funds 9 $TOTAL SOURCES OF FUNDS $ TOTAL USE OF FUNDS $
Mortgage Holder Amount of Debt Interest Rate Loan Term1st Mortgage $ % Yrs2nd Mortgage $ % Yrs3rd Mortgage $ % Yrs
Total Debt $ %Total Equity $ %Total Intervention $ %
1 1st Equity Position held by2 2nd Equity Position held by3 Tax Credit Equity held by based on total estimated tax credit of $_____________
purchased as ________________ per $14 Donated Services include5 During construction period6 Funds that neither represent a loan to be repaid (debt) nor ownership in the property (equity) are termed Intervention Funds7 Sources and Amounts of Intervention Funds are______________________________________________________________8 Other sources of Funds and their amounts are_______________________________________________________________9 Other Uses of Funds and their amounts are_________________________________________________________________
DEBT RECAPITULATION
DEBT/EQUITY RECONCILIATION

Calculating the GapHow Much Can I Spend?
I know what the rents will be – How much can I spend? How big will the GAP be?
+, -, x , ÷Gross Scheduled Rents $
- Vacancy $
+ Miscellaneous Income $
= Effective Gross Income $
- Fixed Expenses $
- Variable Expenses $
- Reserves for Replacement $
= Net Operating Income $
÷÷÷÷ Debt Coverage Ratio
= Available for Debt Service $
÷÷÷÷ Debt Service Constant
= Maximum Mortgage Amount $
- Existing Mortgage Pay-off $
+ Equity Dollars Available $
- Acquisition Cost $
= Maximum Rehabilitation Budget $
Estimated Total Rehabilitation Costs $
- Maximum Rehabilitation Budget $
= Amount of GAP $
48,000
80044,000
4,800
6,0008,0002,000
28,0001.27
~ 22,000.1004(8%, 20 yr)
~ 219,0000
40,00050,000
260,000~ 209,000
~ 209,000
~ 51,000
4 units @ $65,000
(8%, 25 yr)
.0926~ 237,500
~ 227,500
~ 227,500~ 32,500
GO HOME NOW!

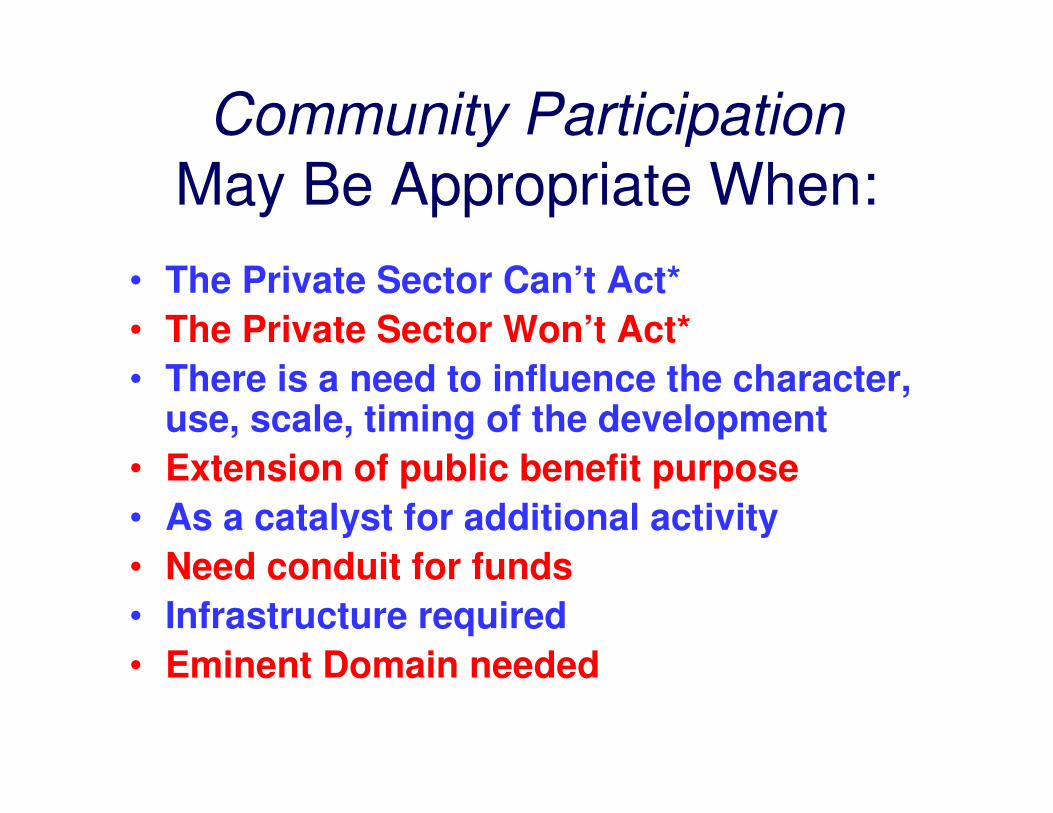
Community Participation May Be Appropriate When:
• The Private Sector Can’t Act*• The Private Sector Won’t Act*• There is a need to influence the character,
use, scale, timing of the development• Extension of public benefit purpose• As a catalyst for additional activity• Need conduit for funds• Infrastructure required• Eminent Domain needed
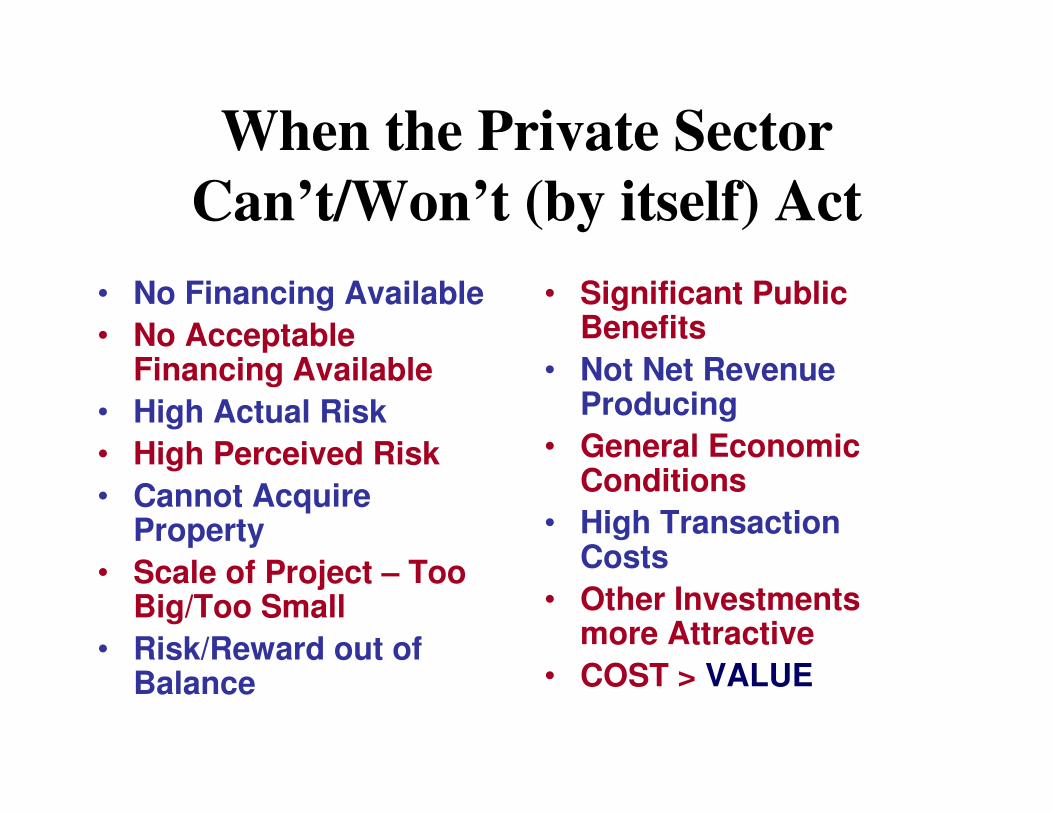
When the Private Sector Can’t/Won’t (by itself) Act
• No Financing Available• No Acceptable
Financing Available• High Actual Risk• High Perceived Risk• Cannot Acquire
Property• Scale of Project – Too
Big/Too Small• Risk/Reward out of
Balance
• Significant Public Benefits
• Not Net Revenue Producing
• General Economic Conditions
• High Transaction Costs
• Other Investments more Attractive
• COST > VALUE
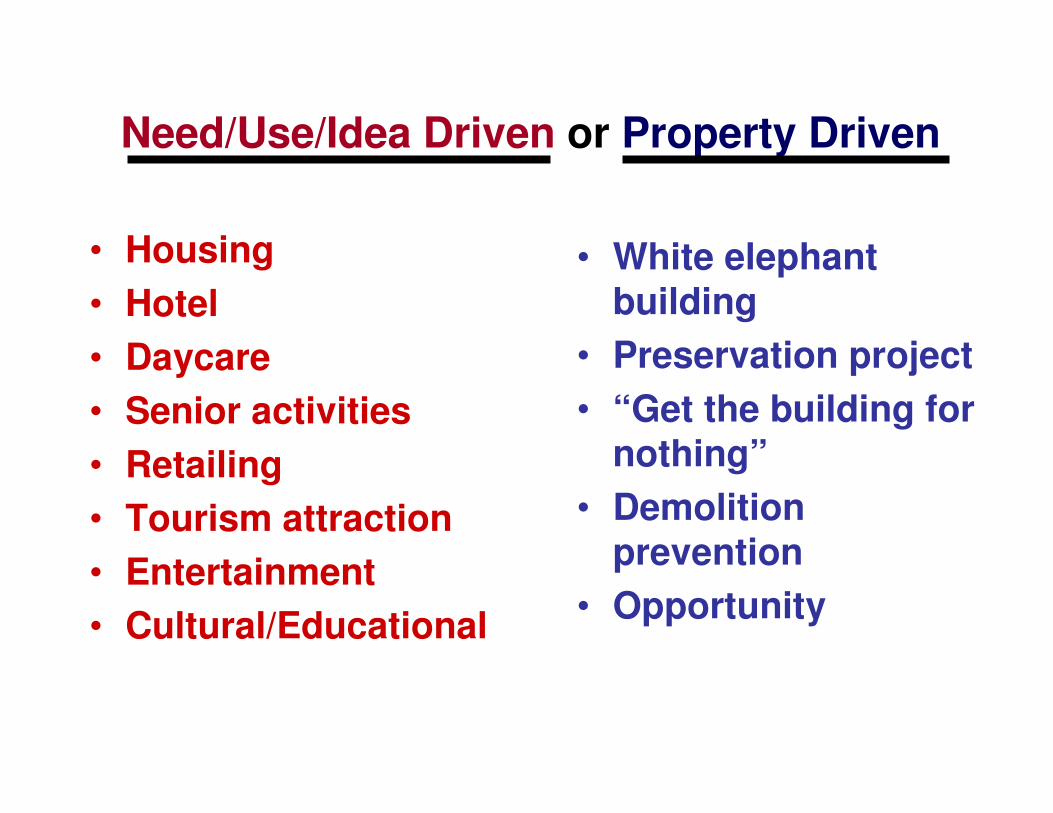
Need/Use/Idea Driven or Property Driven
• White elephant building
• Preservation project• “Get the building for
nothing”• Demolition
prevention• Opportunity
• Housing• Hotel• Daycare• Senior activities• Retailing• Tourism attraction• Entertainment• Cultural/Educational
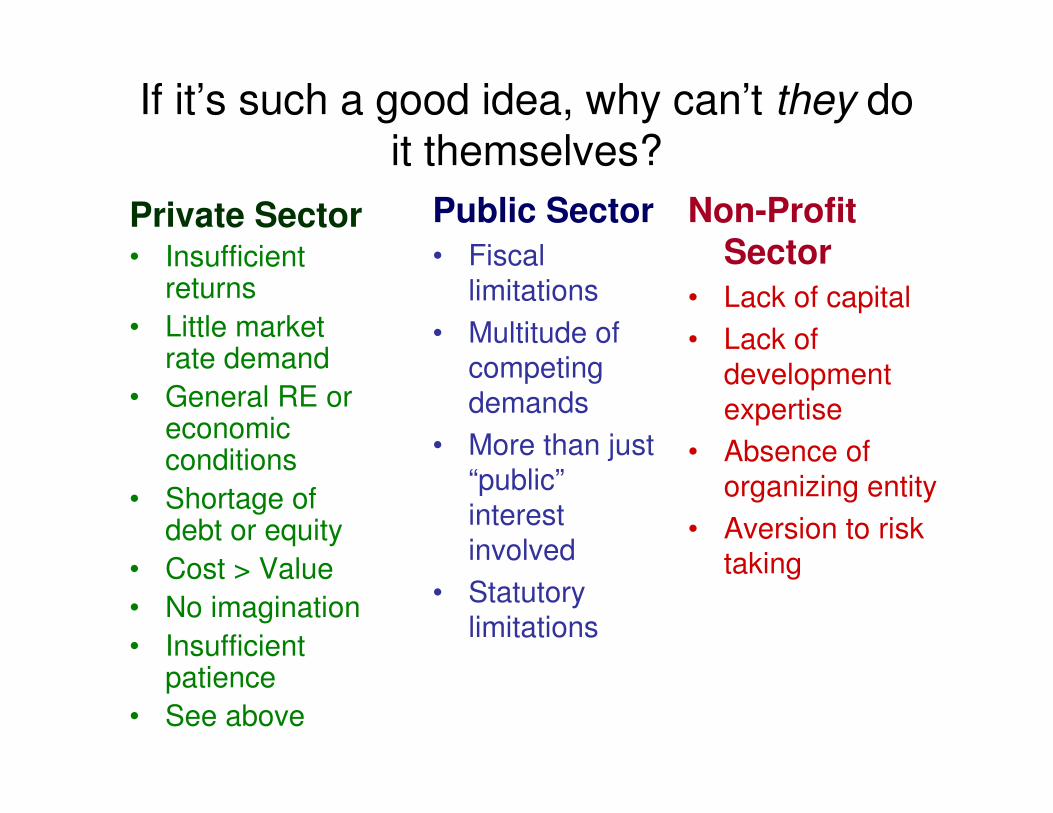
If it’s such a good idea, why can’t they do it themselves?
Private Sector• Insufficient
returns• Little market
rate demand• General RE or
economic conditions
• Shortage of debt or equity
• Cost > Value• No imagination• Insufficient
patience• See above
Non-Profit Sector
• Lack of capital• Lack of
development expertise
• Absence of organizing entity
• Aversion to risk taking
Public Sector• Fiscal
limitations• Multitude of
competing demands
• More than just “public”interest involved
• Statutory limitations
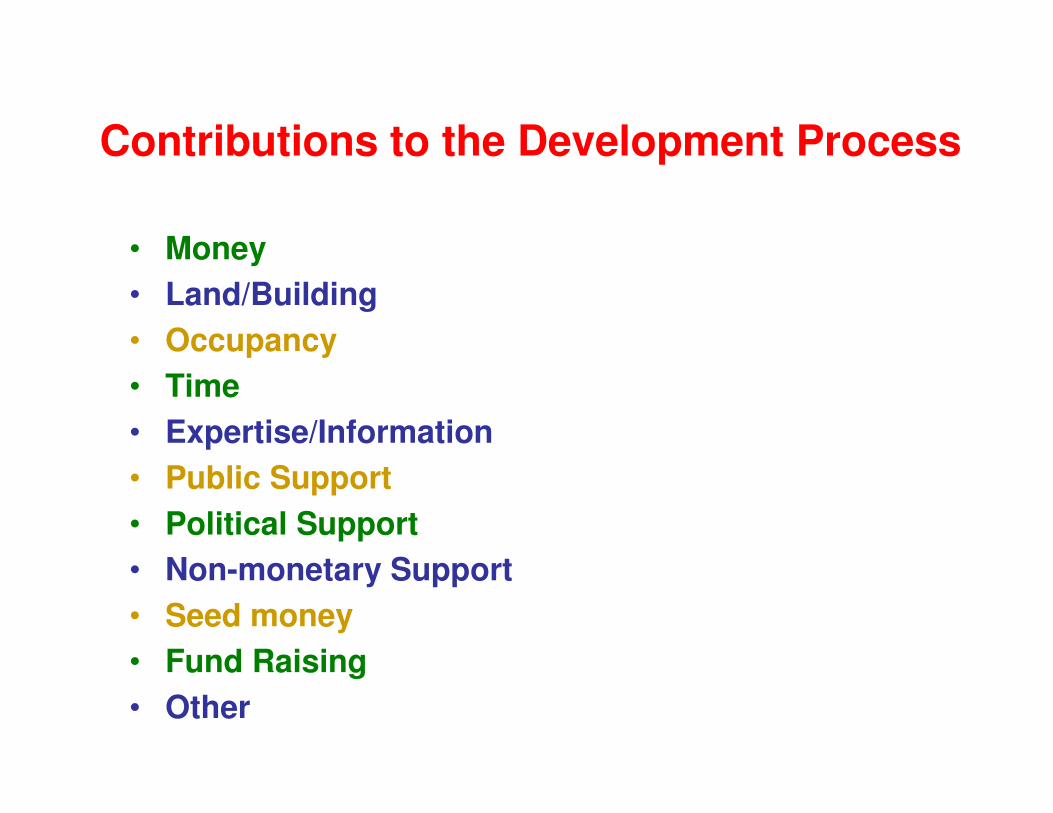
Contributions to the Development Process
• Money• Land/Building• Occupancy• Time• Expertise/Information• Public Support• Political Support• Non-monetary Support• Seed money• Fund Raising• Other
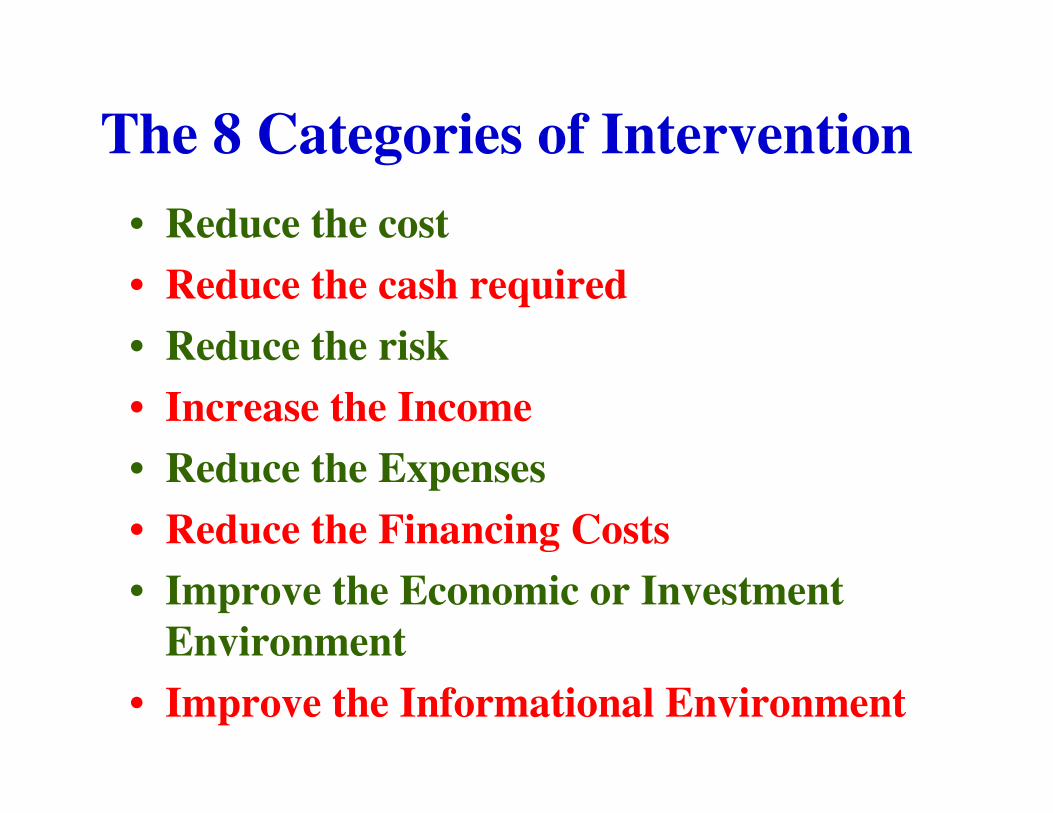
The 8 Categories of Intervention• Reduce the cost• Reduce the cash required• Reduce the risk• Increase the Income• Reduce the Expenses• Reduce the Financing Costs• Improve the Economic or Investment
Environment• Improve the Informational Environment

DevelopmentIncentives
Now the tax credit stuff
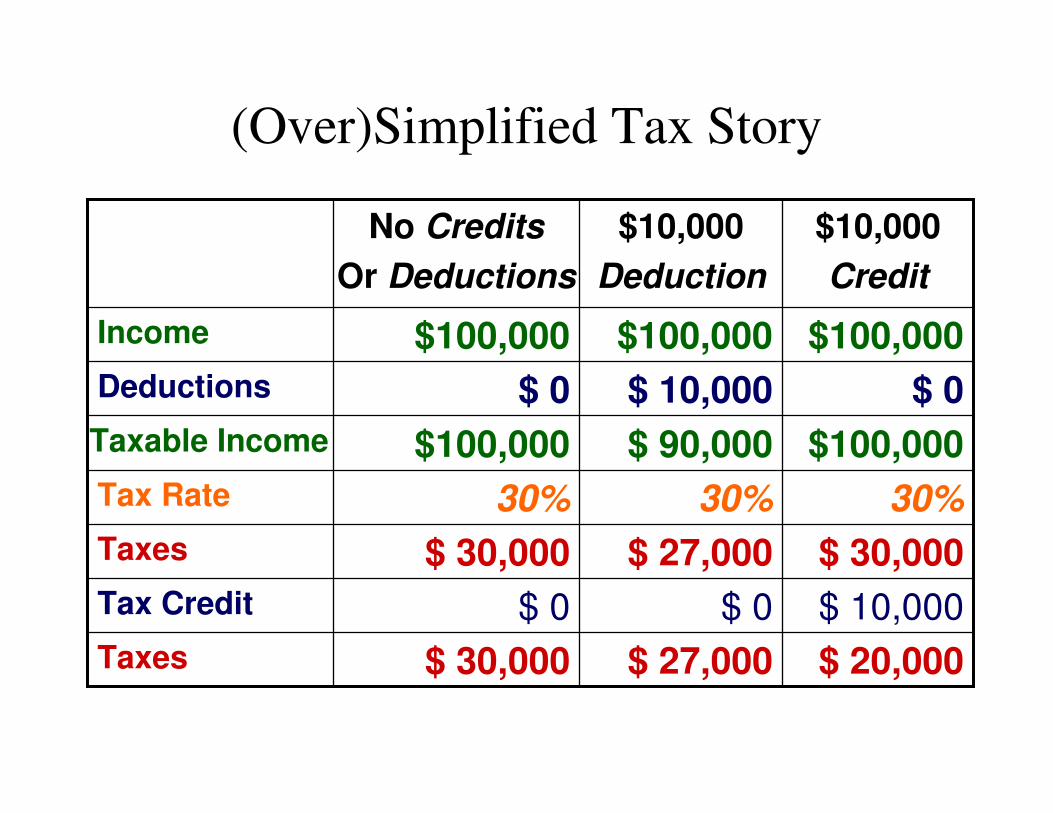
(Over)Simplified Tax Story
$ 20,000$ 27,000$ 30,000Taxes$ 10,000$ 0$ 0Tax Credit$ 30,000$ 27,000$ 30,000Taxes
30%30%30%Tax Rate$100,000$ 90,000$100,000Taxable Income
$ 0$ 10,000$ 0Deductions$100,000$100,000$100,000Income
$10,000Credit
$10,000Deduction
No CreditsOr Deductions
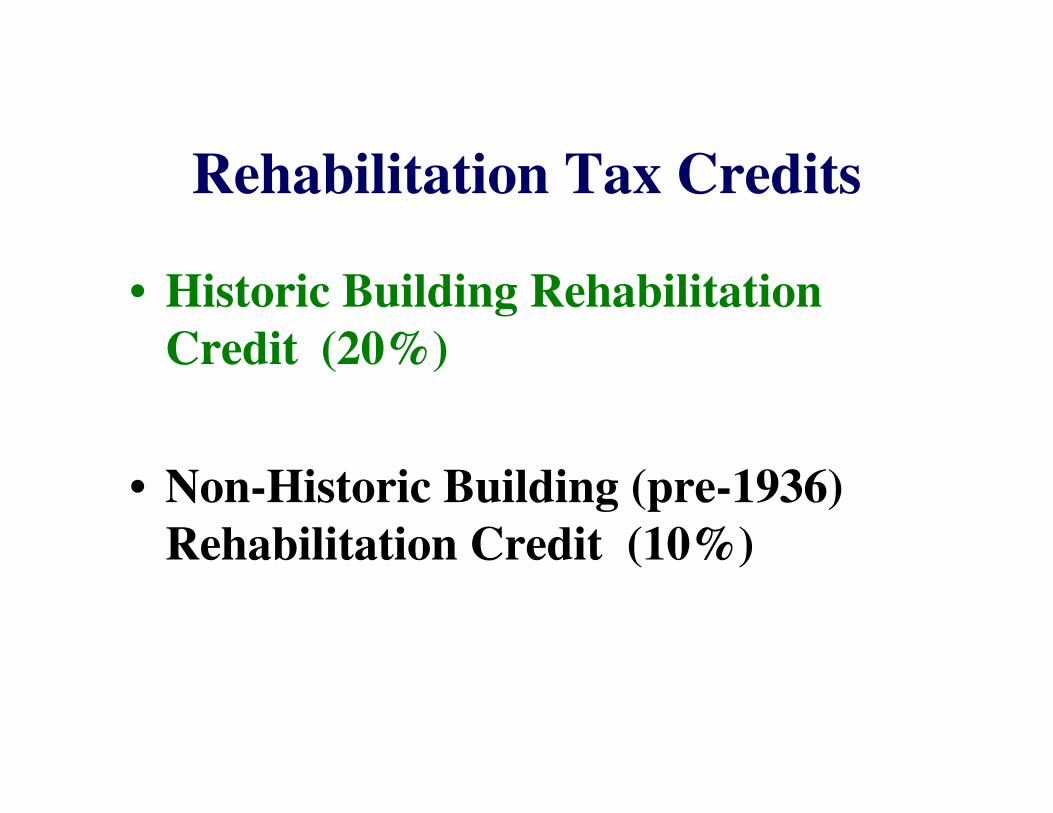
Rehabilitation Tax Credits
• Historic Building Rehabilitation Credit (20%)
• Non-Historic Building (pre-1936) Rehabilitation Credit (10%)
Historic Rehabilitation Tax Credit – 4 Tests
• Historic Building
• Qualifying Property Category
• Substantial Rehabilitation
• Secretary’s Standards for Rehabilitation
Historic Building
• Individually Listed on the National Register of Historic Places
• Contributing Building within a National Register District
• Eligible for Listing on the National Register
• Substantially Equivalent Local District
Qualifying Property Category
Qualify– Investment Property (including residential
rental)– Property held for use in Trade or Business
Don’t Qualify– Personal Residence– Inventory Property
Substantial Rehabilitation
The Greater of:
• $5,000 or
• The Basis of the Building
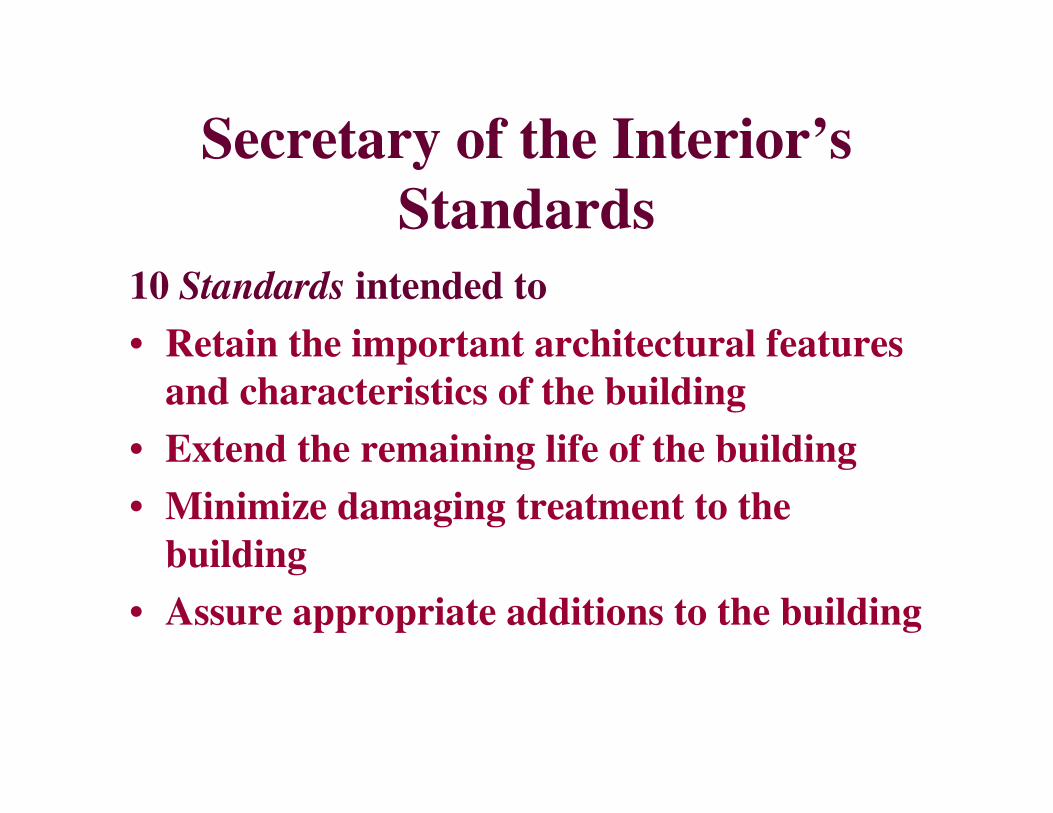
Secretary of the Interior’s Standards
10 Standards intended to• Retain the important architectural features
and characteristics of the building• Extend the remaining life of the building• Minimize damaging treatment to the
building• Assure appropriate additions to the building
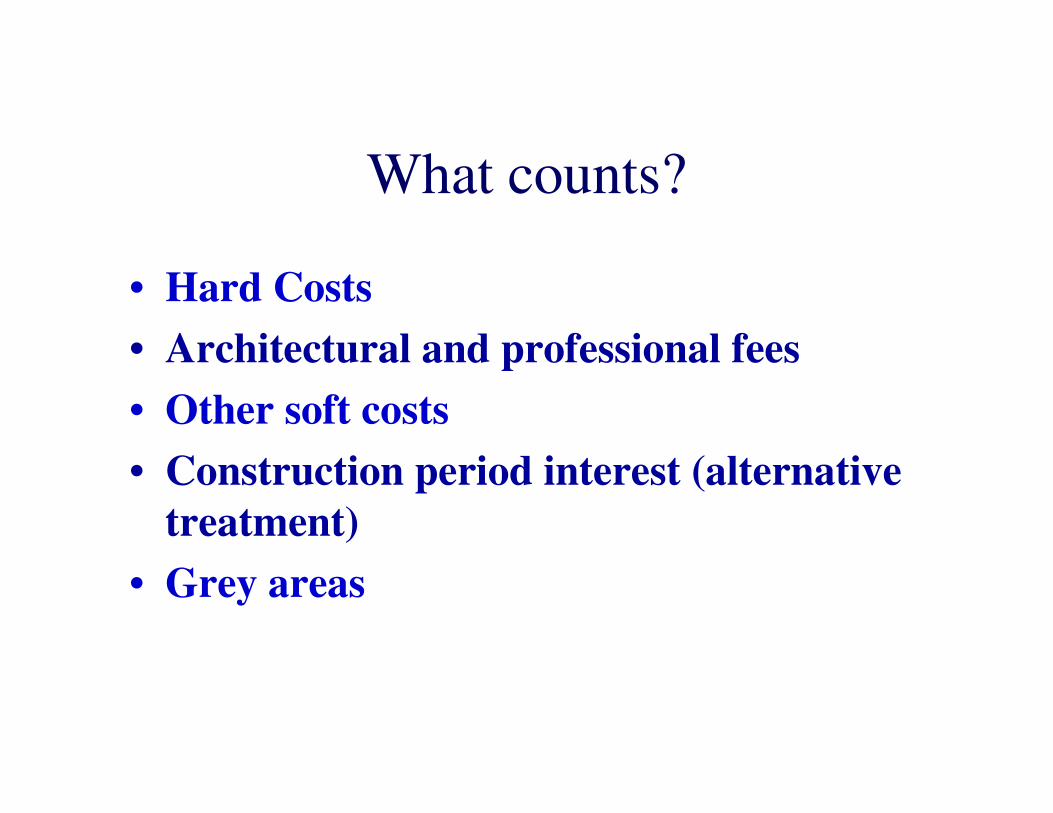
What counts?
• Hard Costs• Architectural and professional fees• Other soft costs• Construction period interest (alternative
treatment)• Grey areas
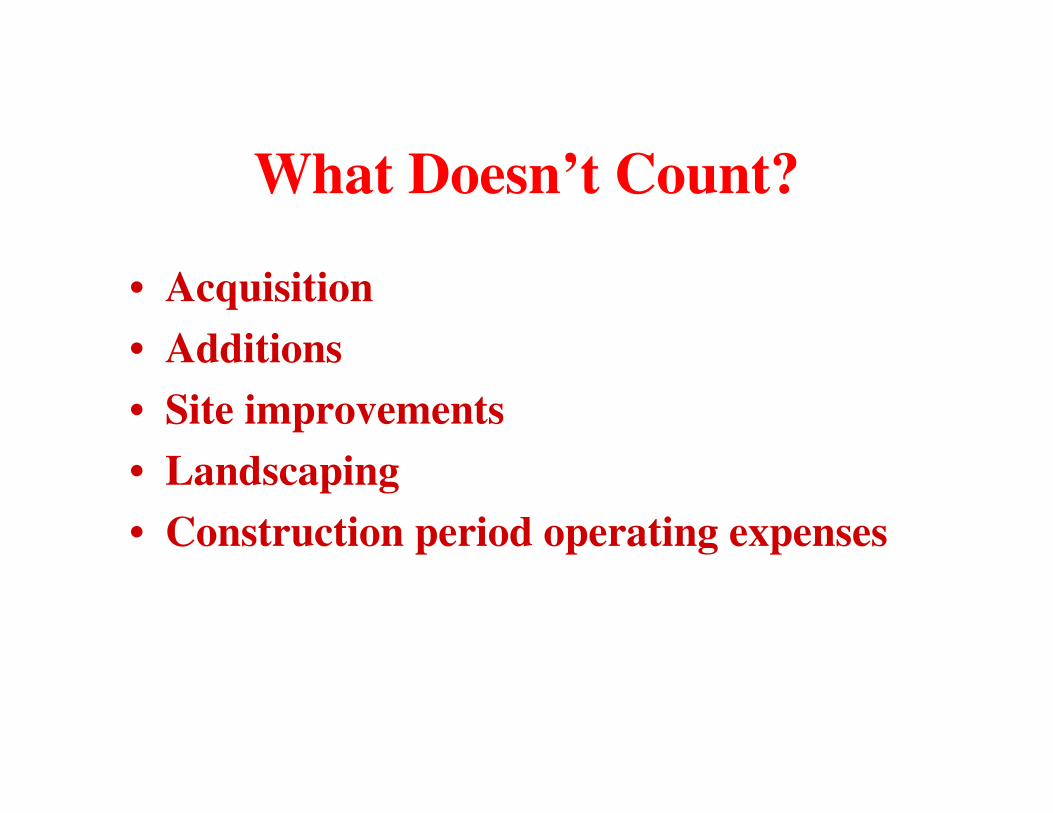
What Doesn’t Count?
• Acquisition• Additions• Site improvements• Landscaping• Construction period operating expenses
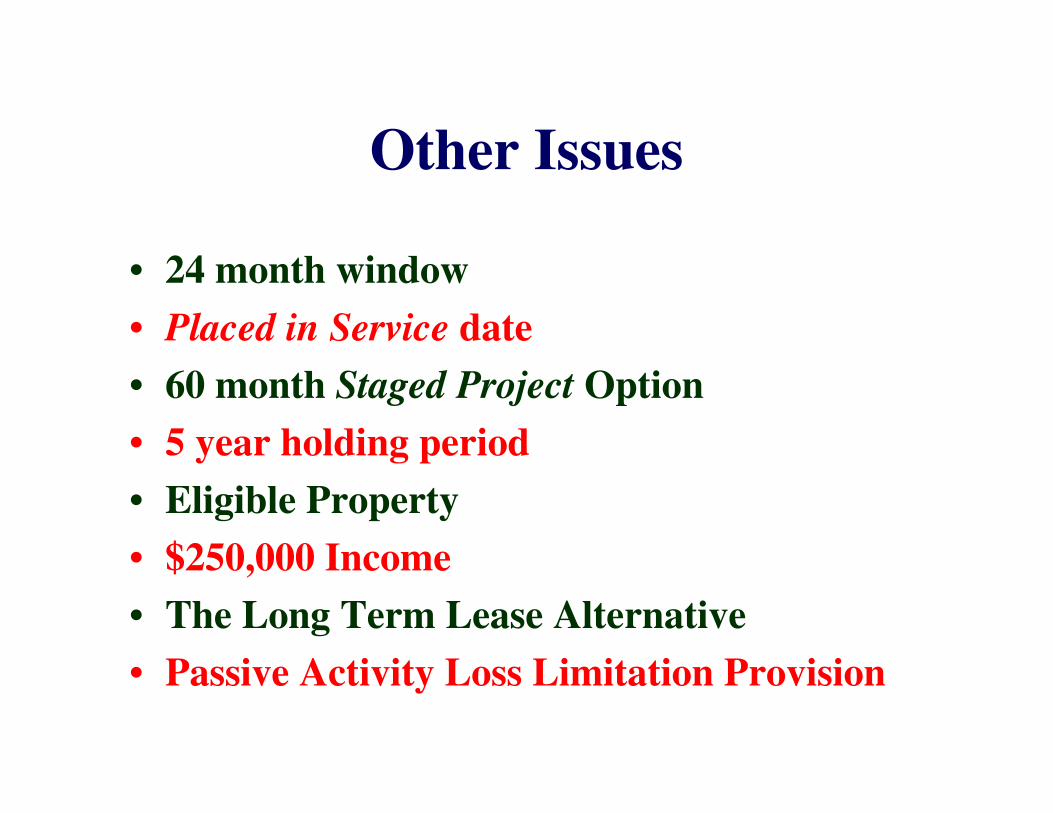
Other Issues
• 24 month window• Placed in Service date• 60 month Staged Project Option• 5 year holding period• Eligible Property• $250,000 Income• The Long Term Lease Alternative• Passive Activity Loss Limitation Provision
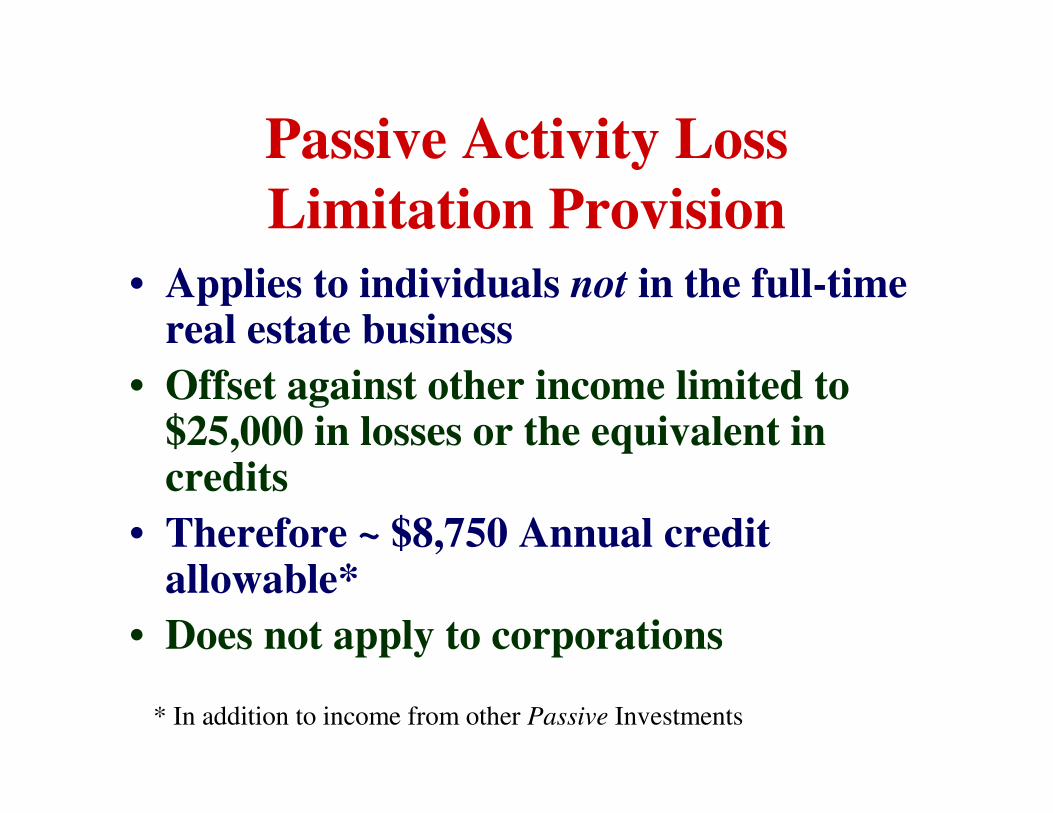
Passive Activity Loss Limitation Provision
• Applies to individuals not in the full-time real estate business
• Offset against other income limited to $25,000 in losses or the equivalent in credits
• Therefore ~ $8,750 Annual credit allowable*
• Does not apply to corporations
* In addition to income from other Passive Investments
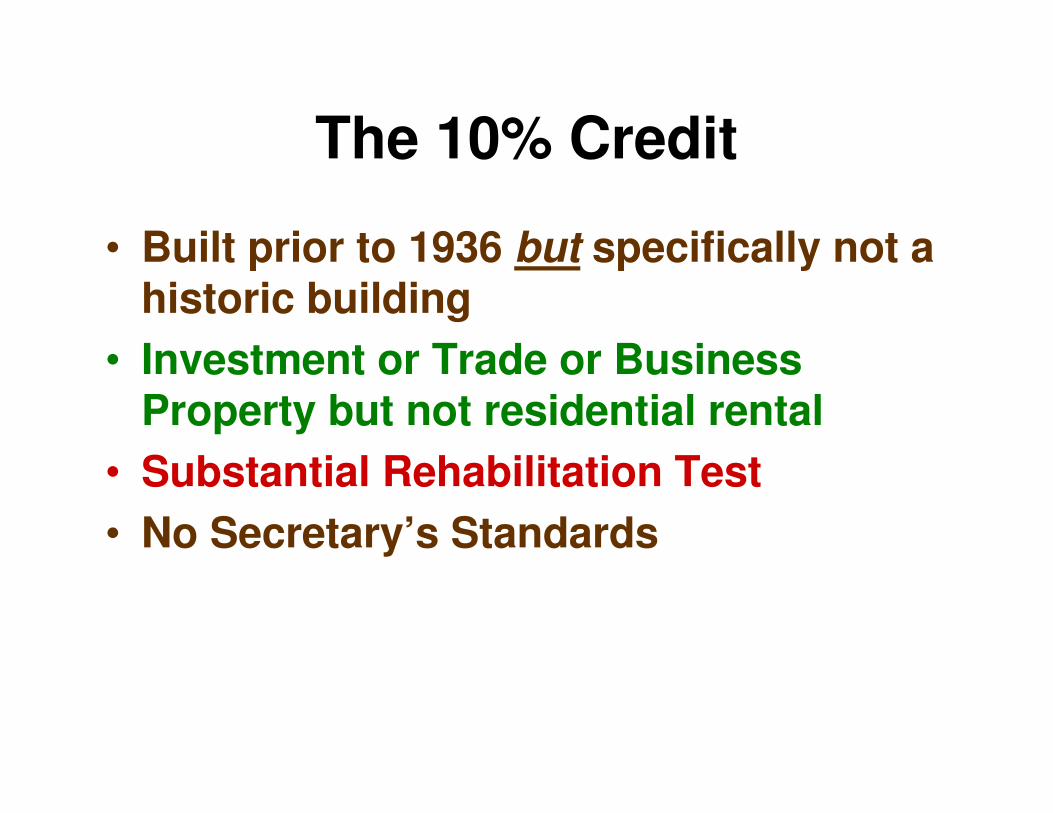
The 10% Credit
• Built prior to 1936 but specifically not a historic building
• Investment or Trade or Business Property but not residential rental
• Substantial Rehabilitation Test• No Secretary’s Standards
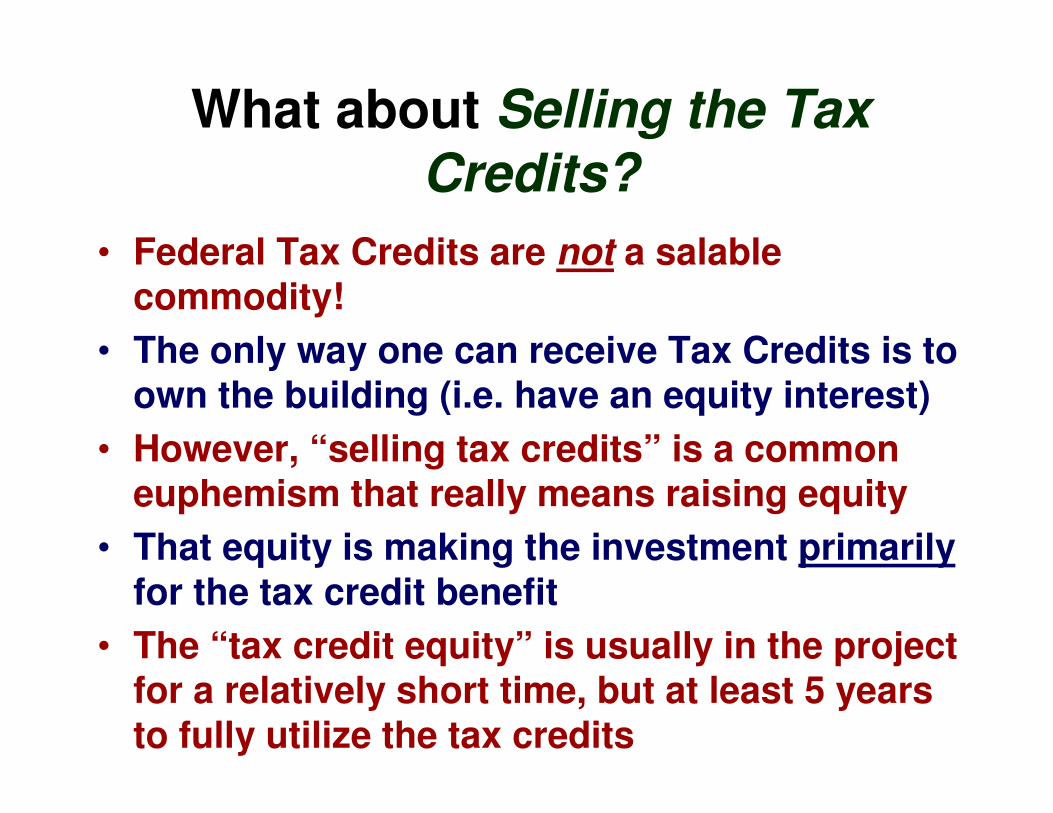
What about Selling the Tax Credits?
• Federal Tax Credits are not a salable commodity!
• The only way one can receive Tax Credits is to own the building (i.e. have an equity interest)
• However, “selling tax credits” is a common euphemism that really means raising equity
• That equity is making the investment primarilyfor the tax credit benefit
• The “tax credit equity” is usually in the project for a relatively short time, but at least 5 years to fully utilize the tax credits

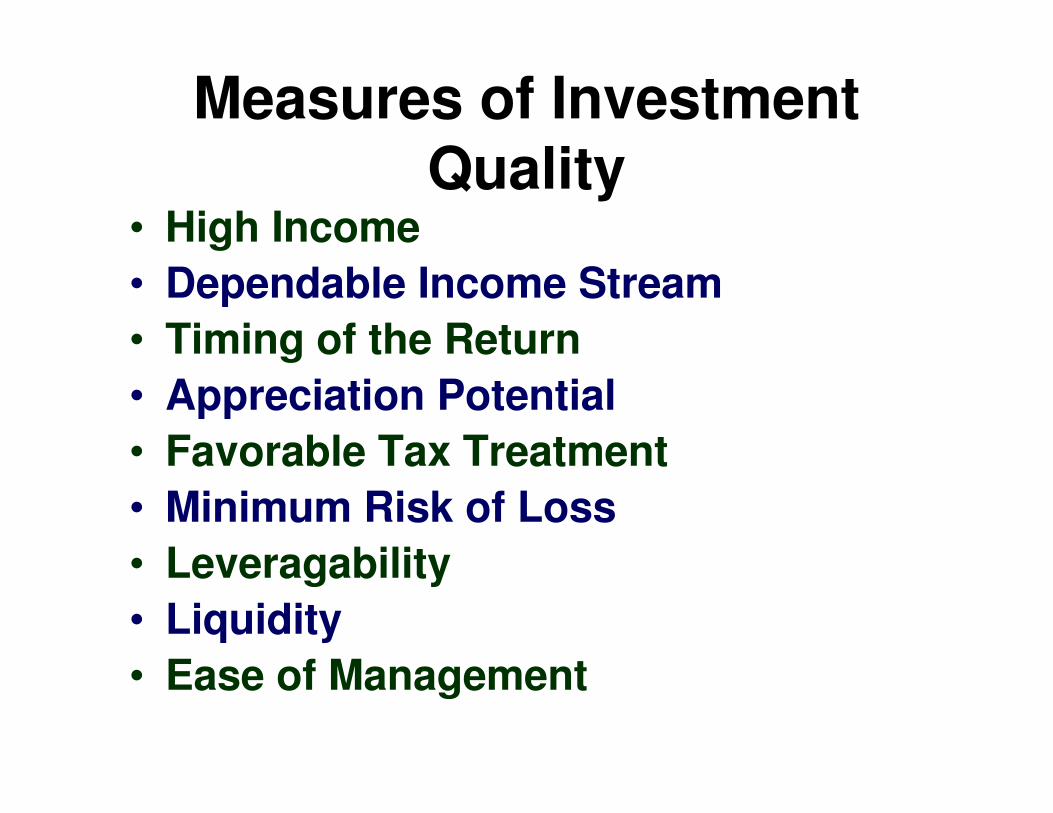
Measures of Investment Quality
• High Income• Dependable Income Stream• Timing of the Return• Appreciation Potential• Favorable Tax Treatment• Minimum Risk of Loss• Leveragability• Liquidity• Ease of Management
Recommended