S4869 - Configuring Workstation Performance to the Max!
Don Maynard Sr. Product Manager - Dell
Scott Hamilton Vertical Market Strategist – Dell
2 Precision Product Group
Requirements - The Professional User Making the right system configuration choices
• Project demands and schedules are not getting any simpler
• Applications need to help users keep up with that demand
• But equally important is the hardware they run on
• Quality and stability are key to eliminate downtime
• World class performance to meet today’s challenges
• Many products are developed for workstation hardware
3 Precision Product Group
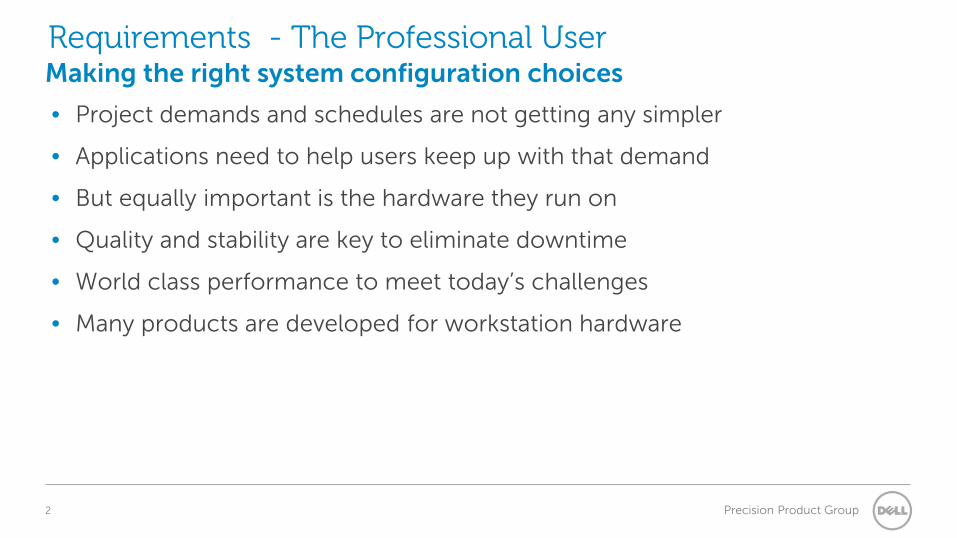
Requirements - Return on Investment
• Average Salary = $81,600
• Full loaded cost approximately $120,000
• 10 % gain in productivity = $12,000 / year savings
Salary Survey: Fighting Flat Salaries with Effective Training
4 Precision Product Group
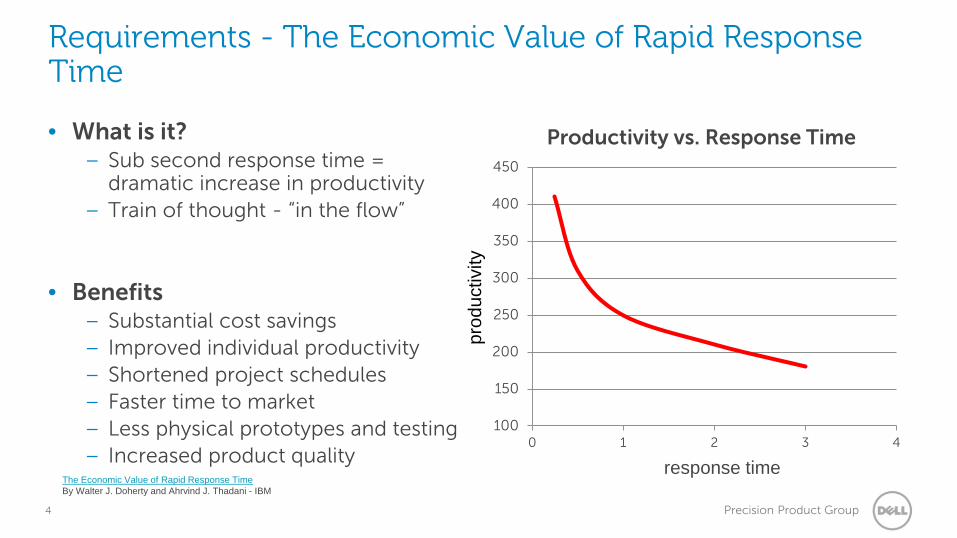
Requirements - The Economic Value of Rapid Response Time
• What is it? – Sub second response time =
dramatic increase in productivity – Train of thought - “in the flow”
• Benefits – Substantial cost savings – Improved individual productivity – Shortened project schedules – Faster time to market – Less physical prototypes and testing – Increased product quality
100
150
200
250
300
350
400
450
0 1 2 3 4
Productivity vs. Response Time
prod
uctiv
ity
response time The Economic Value of Rapid Response Time By Walter J. Doherty and Ahrvind J. Thadani - IBM
5 Precision Product Group
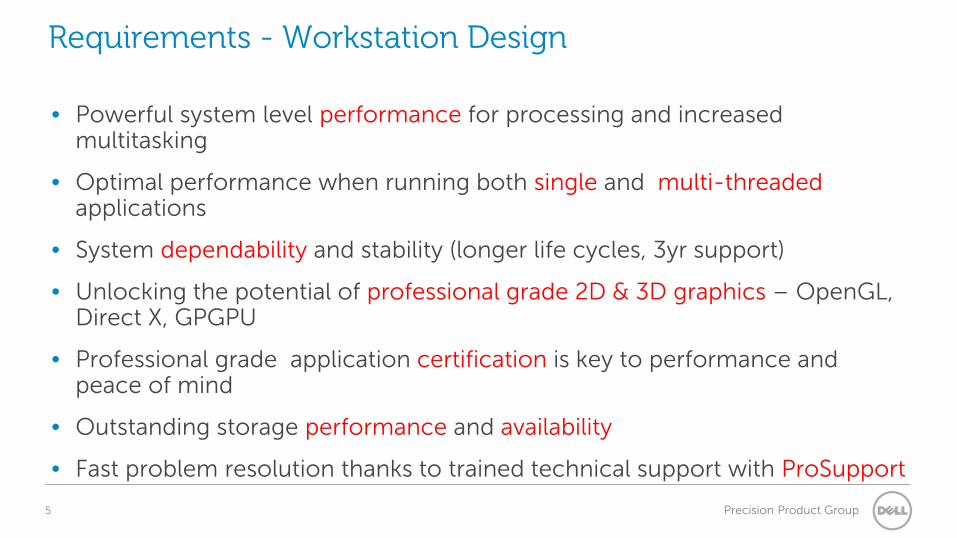
Requirements - Workstation Design
• Powerful system level performance for processing and increased multitasking
• Optimal performance when running both single and multi-threaded applications
• System dependability and stability (longer life cycles, 3yr support)
• Unlocking the potential of professional grade 2D & 3D graphics – OpenGL, Direct X, GPGPU
• Professional grade application certification is key to performance and peace of mind
• Outstanding storage performance and availability
• Fast problem resolution thanks to trained technical support with ProSupport
6 Precision Product Group
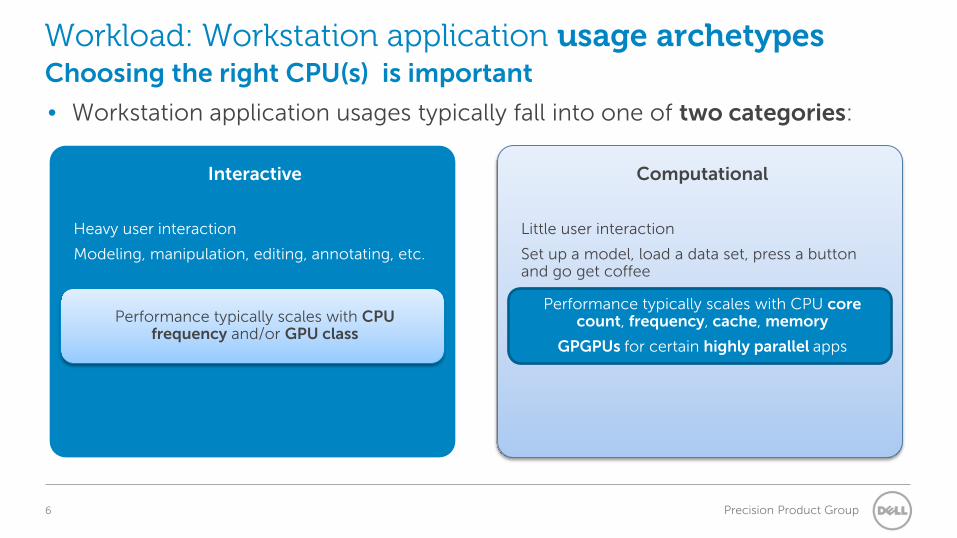
Workload: Workstation application usage archetypes Choosing the right CPU(s) is important
• Workstation application usages typically fall into one of two categories:
Interactive
Heavy user interaction
Modeling, manipulation, editing, annotating, etc.
Performance typically scales with CPU frequency and/or GPU class
Computational
Little user interaction
Set up a model, load a data set, press a button and go get coffee
Performance typically scales with CPU core count, frequency, cache, memory
GPGPUs for certain highly parallel apps
7 Precision Product Group
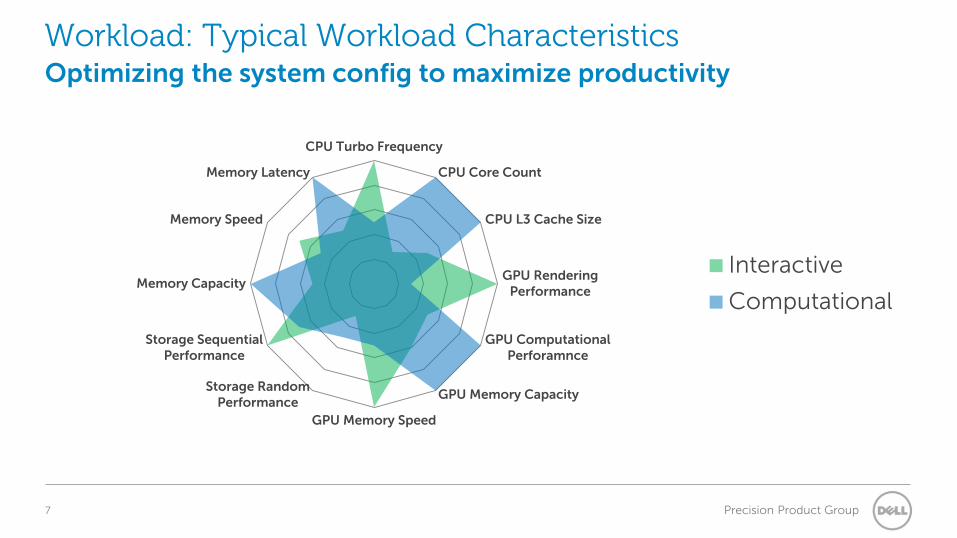
Workload: Typical Workload Characteristics Optimizing the system config to maximize productivity
CPU Turbo Frequency
CPU Core Count
CPU L3 Cache Size
GPU RenderingPerformance
GPU ComputationalPerforamnce
GPU Memory Capacity
GPU Memory Speed
Storage RandomPerformance
Storage SequentialPerformance
Memory Capacity
Memory Speed
Memory Latency
Interactive
Computational
8 Precision Product Group
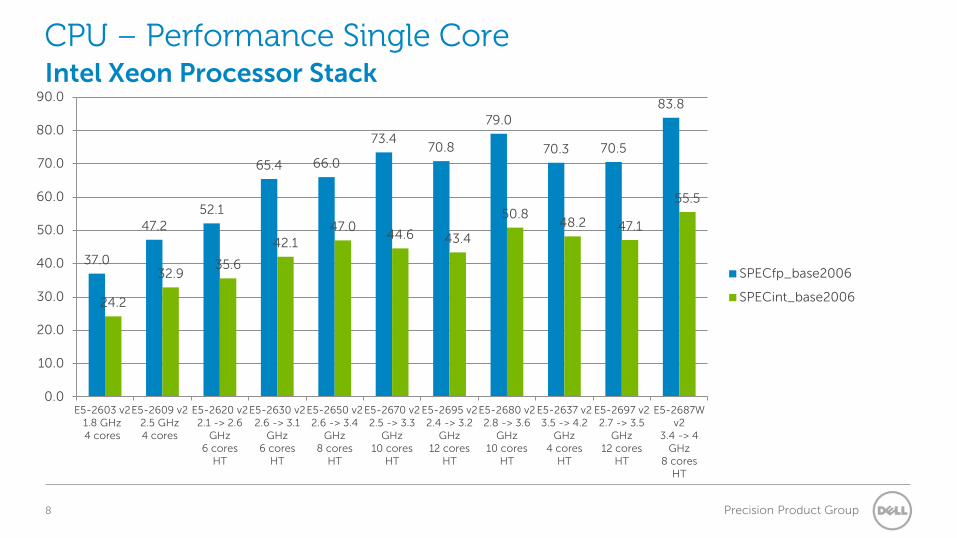
CPU – Performance Single Core Intel Xeon Processor Stack
37.0
47.2 52.1
65.4 66.0
73.4 70.8
79.0
70.3 70.5
83.8
24.2
32.9 35.6
42.1 47.0
44.6 43.4
50.8 48.2 47.1
55.5
0.0
10.0
20.0
30.0
40.0
50.0
60.0
70.0
80.0
90.0
E5-2603 v21.8 GHz4 cores
E5-2609 v22.5 GHz4 cores
E5-2620 v22.1 -> 2.6
GHz6 cores
HT
E5-2630 v22.6 -> 3.1
GHz6 cores
HT
E5-2650 v22.6 -> 3.4
GHz8 cores
HT
E5-2670 v22.5 -> 3.3
GHz10 cores
HT
E5-2695 v22.4 -> 3.2
GHz12 cores
HT
E5-2680 v22.8 -> 3.6
GHz10 cores
HT
E5-2637 v23.5 -> 4.2
GHz4 cores
HT
E5-2697 v22.7 -> 3.5
GHz12 cores
HT
E5-2687Wv2
3.4 -> 4GHz
8 coresHT
SPECfp_base2006
SPECint_base2006
9 Precision Product Group
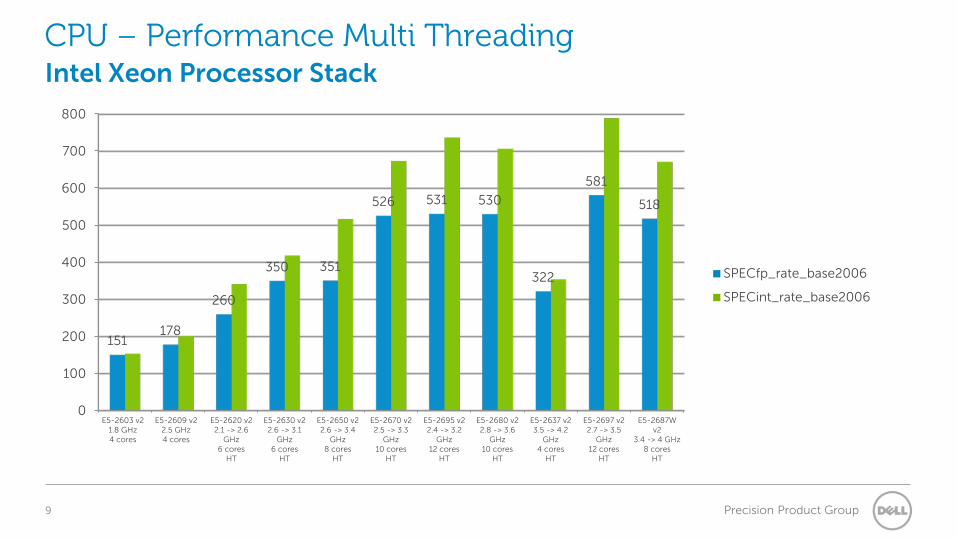
CPU – Performance Multi Threading Intel Xeon Processor Stack
0
100
200
300
400
500
600
700
800
E5-2603 v21.8 GHz4 cores
E5-2609 v22.5 GHz4 cores
E5-2620 v22.1 -> 2.6
GHz6 cores
HT
E5-2630 v22.6 -> 3.1
GHz6 cores
HT
E5-2650 v22.6 -> 3.4
GHz8 cores
HT
E5-2670 v22.5 -> 3.3
GHz10 cores
HT
E5-2695 v22.4 -> 3.2
GHz12 cores
HT
E5-2680 v22.8 -> 3.6
GHz10 cores
HT
E5-2637 v23.5 -> 4.2
GHz4 cores
HT
E5-2697 v22.7 -> 3.5
GHz12 cores
HT
E5-2687Wv2
3.4 -> 4 GHz8 cores
HT
151 178
260
350 351
526 531 530
322
581
518
SPECfp_rate_base2006
SPECint_rate_base2006
10 Precision Product Group
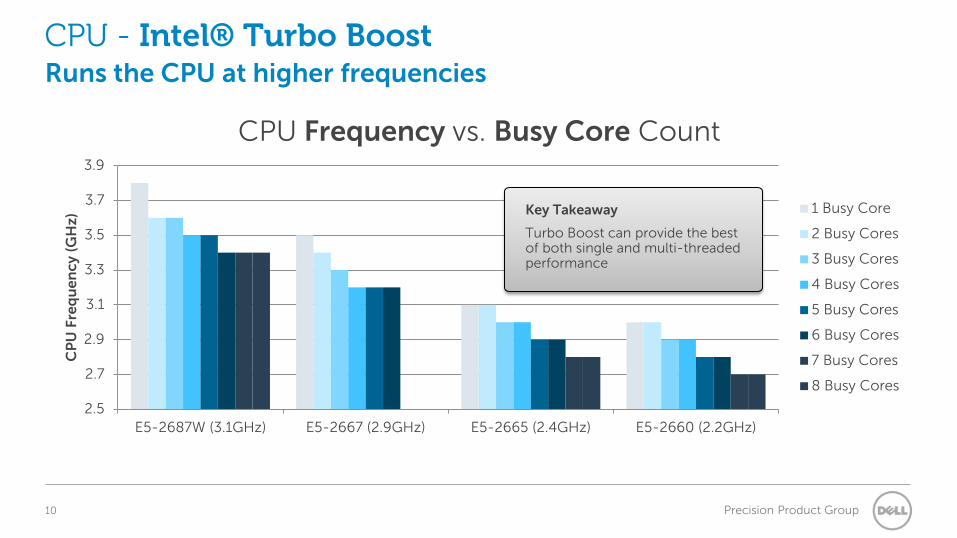
CPU - Intel® Turbo Boost Runs the CPU at higher frequencies
2.5
2.7
2.9
3.1
3.3
3.5
3.7
3.9
E5-2687W (3.1GHz) E5-2667 (2.9GHz) E5-2665 (2.4GHz) E5-2660 (2.2GHz)
CP
U F
req
uen
cy (
GH
z)
CPU Frequency vs. Busy Core Count
1 Busy Core
2 Busy Cores
3 Busy Cores
4 Busy Cores
5 Busy Cores
6 Busy Cores
7 Busy Cores
8 Busy Cores
Key Takeaway
Turbo Boost can provide the best of both single and multi-threaded performance
11 Precision Product Group
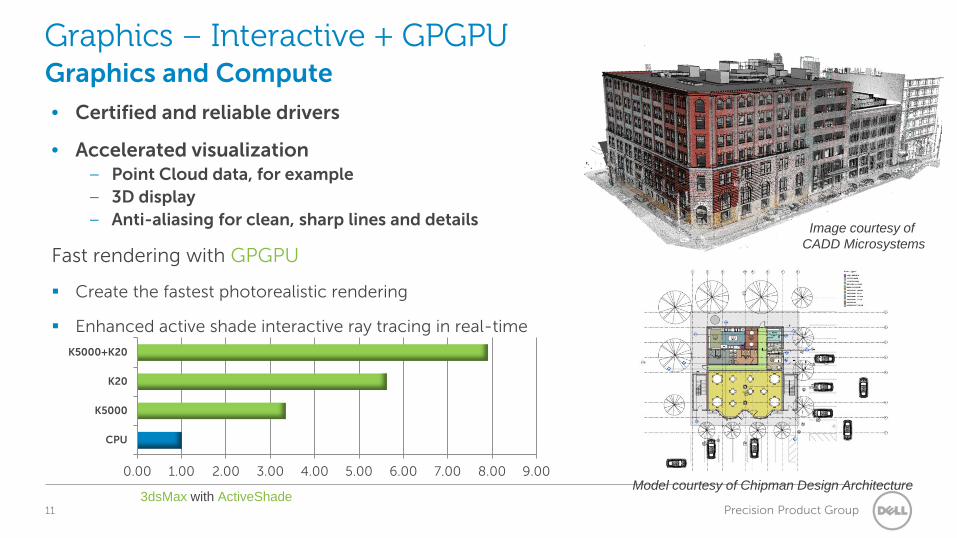
Graphics – Interactive + GPGPU Graphics and Compute
• Certified and reliable drivers
• Accelerated visualization – Point Cloud data, for example – 3D display – Anti-aliasing for clean, sharp lines and details
Fast rendering with GPGPU
Create the fastest photorealistic rendering
Enhanced active shade interactive ray tracing in real-time
Image courtesy of CADD Microsystems
Model courtesy of Chipman Design Architecture 0.00 1.00 2.00 3.00 4.00 5.00 6.00 7.00 8.00 9.00
CPU
K5000
K20
K5000+K20
3dsMax with ActiveShade
12 Precision Product Group
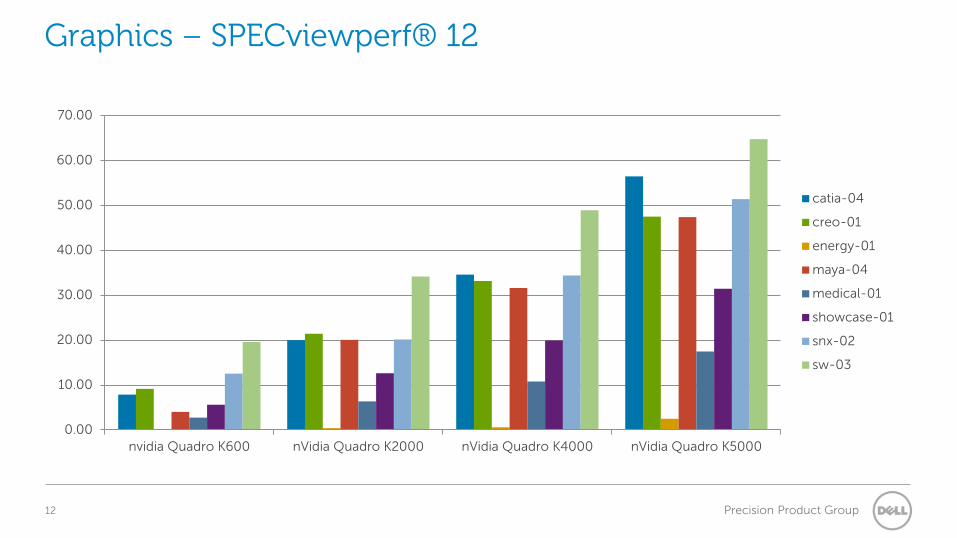
Graphics – SPECviewperf® 12
0.00
10.00
20.00
30.00
40.00
50.00
60.00
70.00
nvidia Quadro K600 nVidia Quadro K2000 nVidia Quadro K4000 nVidia Quadro K5000
catia-04
creo-01
energy-01
maya-04
medical-01
showcase-01
snx-02
sw-03
13 Precision Product Group
Storage - Getting the most out of the storage subsystem
• Simplistic view of desirable storage improvements:
– Higher sequential read throughput shorter load times higher productivity
– Higher sequential write throughput shorter save times higher productivity
– Higher random IOPs faster incremental updates higher interactivity
14 Precision Product Group
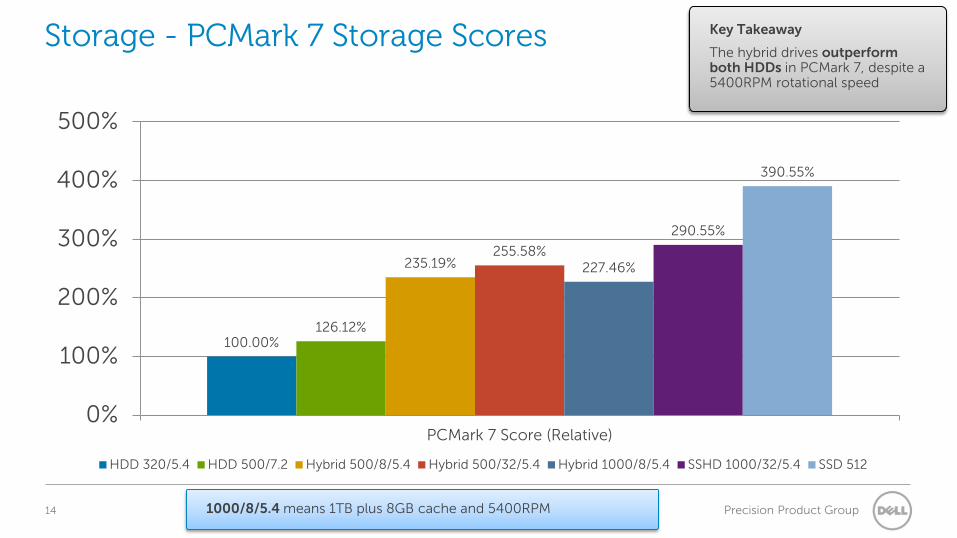
Storage - PCMark 7 Storage Scores
100.00% 126.12%
235.19% 255.58%
227.46%
290.55%
390.55%
0%
100%
200%
300%
400%
500%
PCMark 7 Score (Relative)
HDD 320/5.4 HDD 500/7.2 Hybrid 500/8/5.4 Hybrid 500/32/5.4 Hybrid 1000/8/5.4 SSHD 1000/32/5.4 SSD 512
Key Takeaway
The hybrid drives outperform both HDDs in PCMark 7, despite a 5400RPM rotational speed
1000/8/5.4 means 1TB plus 8GB cache and 5400RPM
15 Precision Product Group
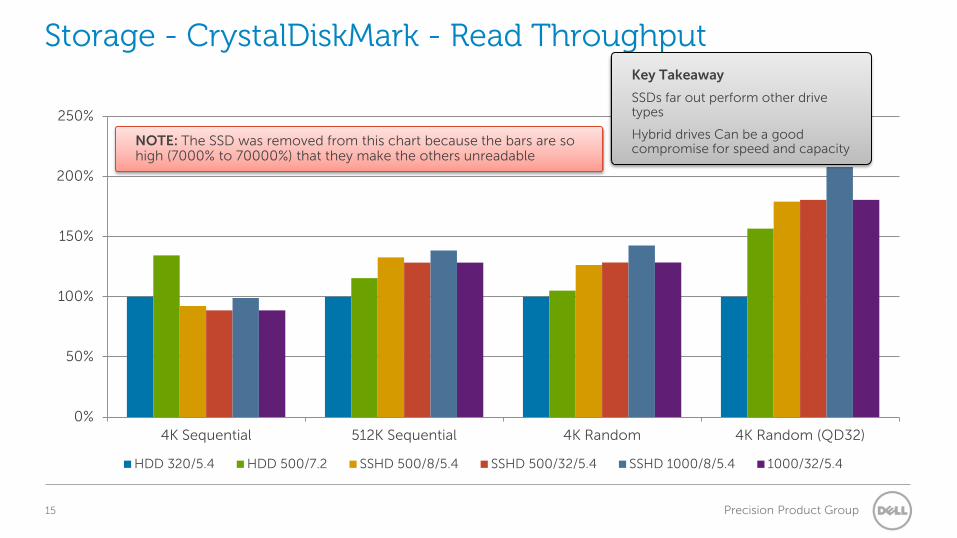
Storage - CrystalDiskMark - Read Throughput
0%
50%
100%
150%
200%
250%
4K Sequential 512K Sequential 4K Random 4K Random (QD32)
HDD 320/5.4 HDD 500/7.2 SSHD 500/8/5.4 SSHD 500/32/5.4 SSHD 1000/8/5.4 1000/32/5.4
Key Takeaway
SSDs far out perform other drive types
Hybrid drives Can be a good compromise for speed and capacity
NOTE: The SSD was removed from this chart because the bars are so high (7000% to 70000%) that they make the others unreadable
16 Precision Product Group
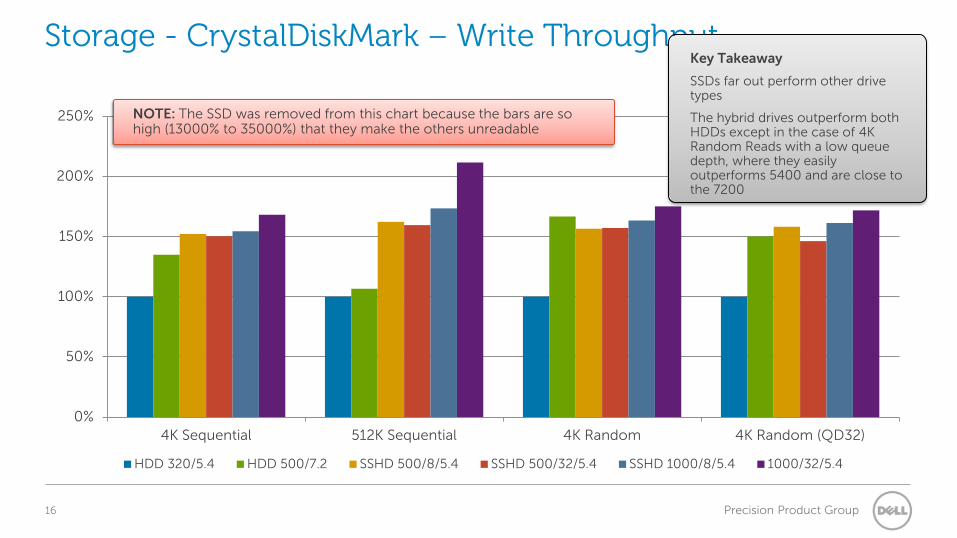
Storage - CrystalDiskMark – Write Throughput
0%
50%
100%
150%
200%
250%
4K Sequential 512K Sequential 4K Random 4K Random (QD32)
HDD 320/5.4 HDD 500/7.2 SSHD 500/8/5.4 SSHD 500/32/5.4 SSHD 1000/8/5.4 1000/32/5.4
Key Takeaway
SSDs far out perform other drive types
The hybrid drives outperform both HDDs except in the case of 4K Random Reads with a low queue depth, where they easily outperforms 5400 and are close to the 7200
NOTE: The SSD was removed from this chart because the bars are so high (13000% to 35000%) that they make the others unreadable
17 Precision Product Group
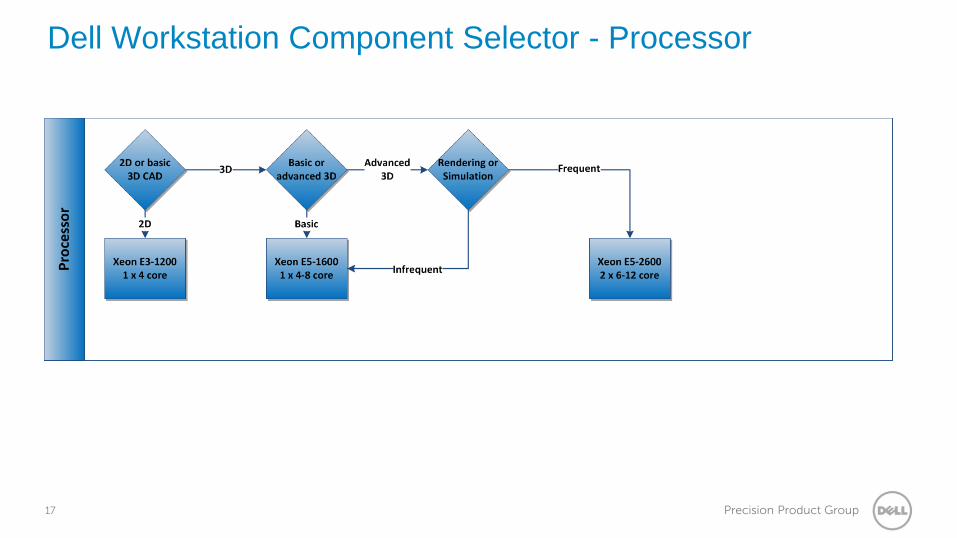
Dell Workstation Component Selector - Processor
18 Precision Product Group
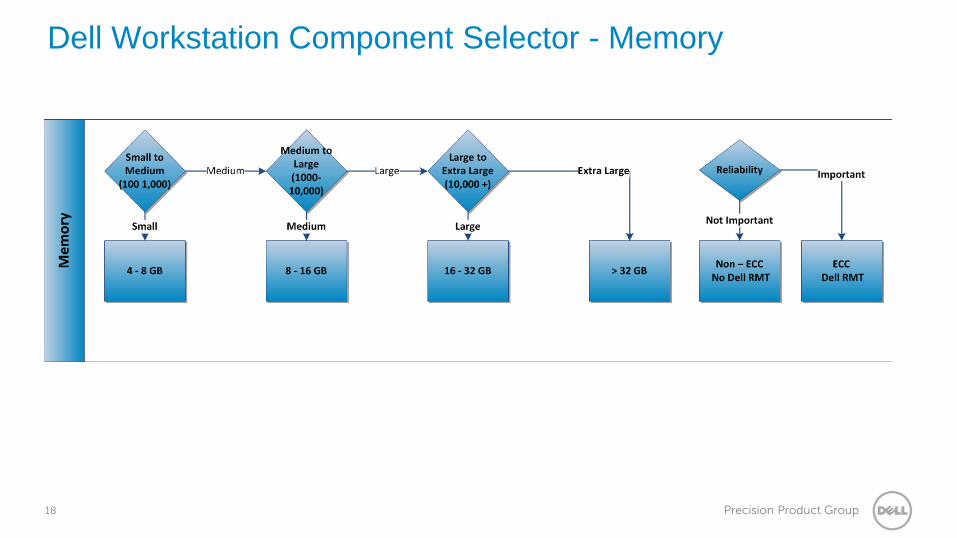
Dell Workstation Component Selector - Memory
19 Precision Product Group
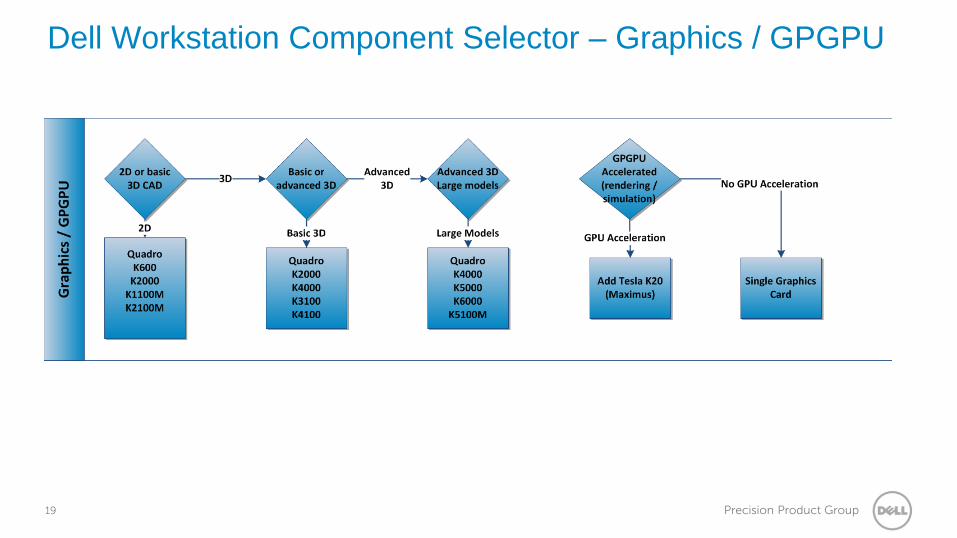
Dell Workstation Component Selector – Graphics / GPGPU
20 Precision Product Group
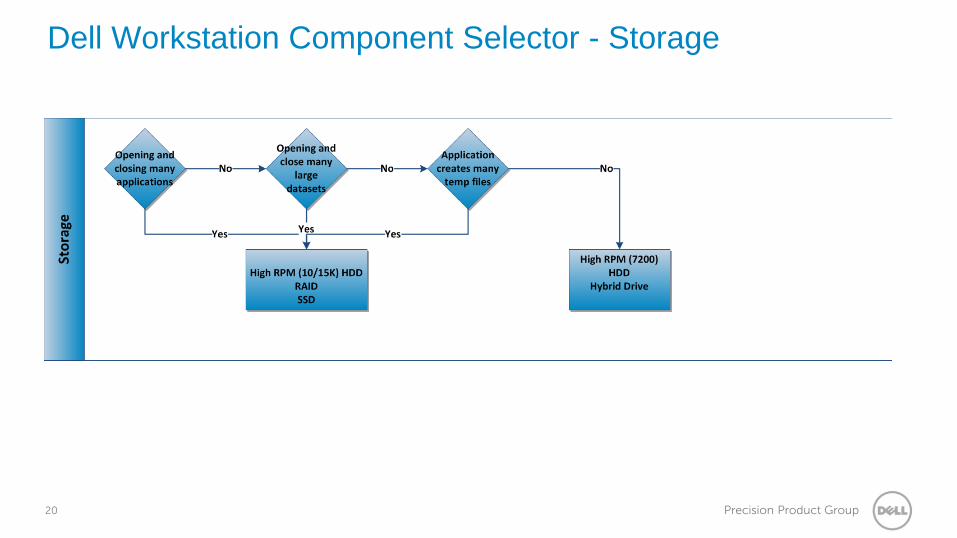
Dell Workstation Component Selector - Storage
21 Precision Product Group
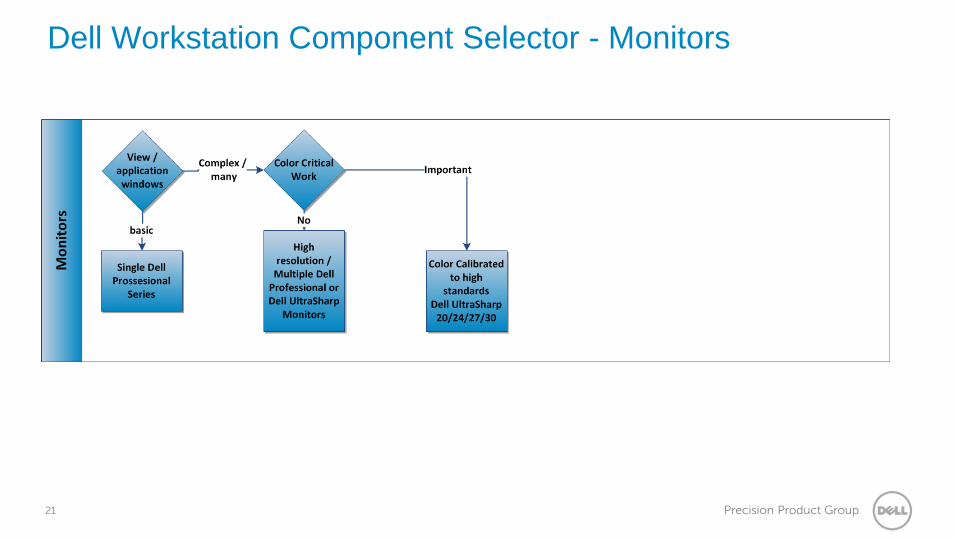
Dell Workstation Component Selector - Monitors
22 Precision Product Group
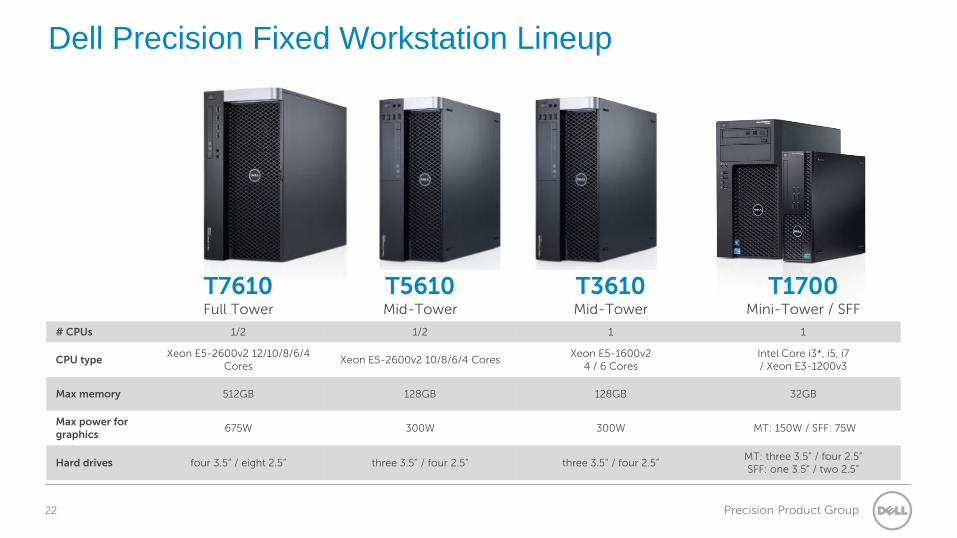
Dell Precision Fixed Workstation Lineup
T7610 Full Tower
T5610 Mid-Tower
T3610 Mid-Tower
T1700 Mini-Tower / SFF
# CPUs 1/2 1/2 1 1
CPU type Xeon E5-2600v2 12/10/8/6/4
Cores Xeon E5-2600v2 10/8/6/4 Cores
Xeon E5-1600v2 4 / 6 Cores
Intel Core i3*, i5, i7 / Xeon E3-1200v3
Max memory 512GB 128GB 128GB 32GB
Max power for graphics
675W 300W 300W MT: 150W / SFF: 75W
Hard drives four 3.5” / eight 2.5” three 3.5” / four 2.5” three 3.5” / four 2.5” MT: three 3.5” / four 2.5” SFF: one 3.5” / two 2.5”
23 Precision Product Group
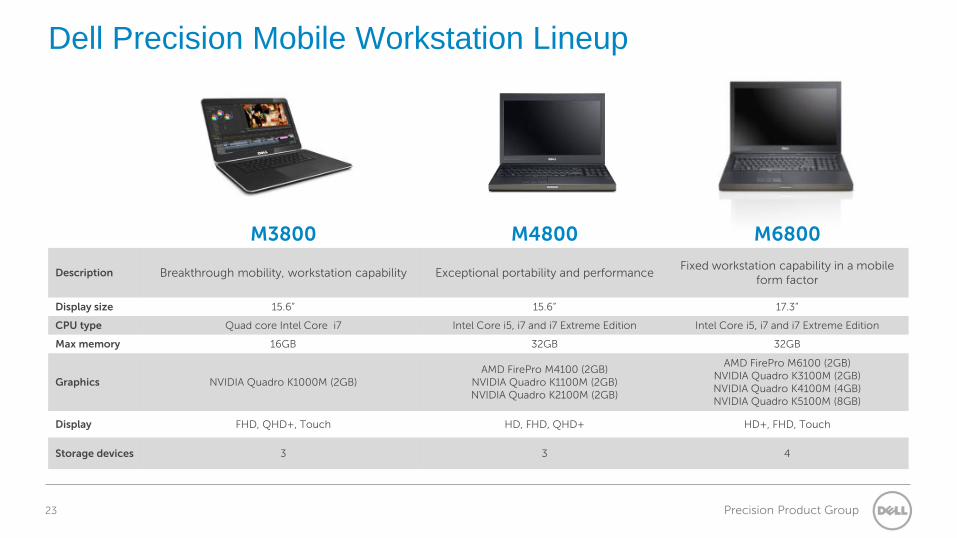
Dell Precision Mobile Workstation Lineup
M3800 M4800 M6800
Description Breakthrough mobility, workstation capability Exceptional portability and performance Fixed workstation capability in a mobile
form factor
Display size 15.6” 15.6” 17.3”
CPU type Quad core Intel Core i7 Intel Core i5, i7 and i7 Extreme Edition Intel Core i5, i7 and i7 Extreme Edition
Max memory 16GB 32GB 32GB
Graphics NVIDIA Quadro K1000M (2GB) AMD FirePro M4100 (2GB)
NVIDIA Quadro K1100M (2GB) NVIDIA Quadro K2100M (2GB)
AMD FirePro M6100 (2GB) NVIDIA Quadro K3100M (2GB) NVIDIA Quadro K4100M (4GB) NVIDIA Quadro K5100M (8GB)
Display FHD, QHD+, Touch HD, FHD, QHD+ HD+, FHD, Touch
Storage devices 3 3 4
24 Precision Product Group
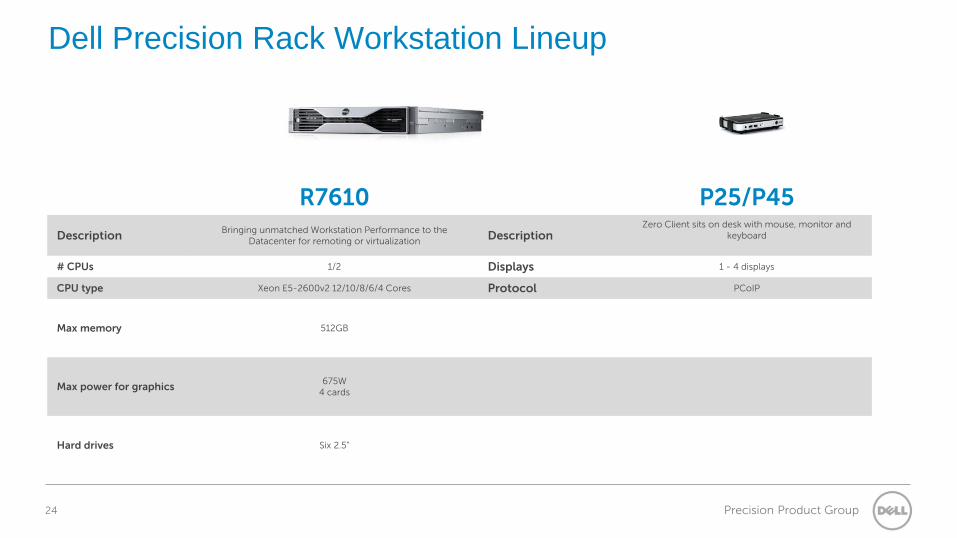
R7610 P25/P45
Description Bringing unmatched Workstation Performance to the Datacenter for remoting or virtualization Description
Zero Client sits on desk with mouse, monitor and keyboard
# CPUs 1/2 Displays 1 - 4 displays
CPU type Xeon E5-2600v2 12/10/8/6/4 Cores Protocol PCoIP
Max memory 512GB
Max power for graphics 675W
4 cards
Hard drives Six 2.5”
Dell Precision Rack Workstation Lineup
25 Precision Product Group
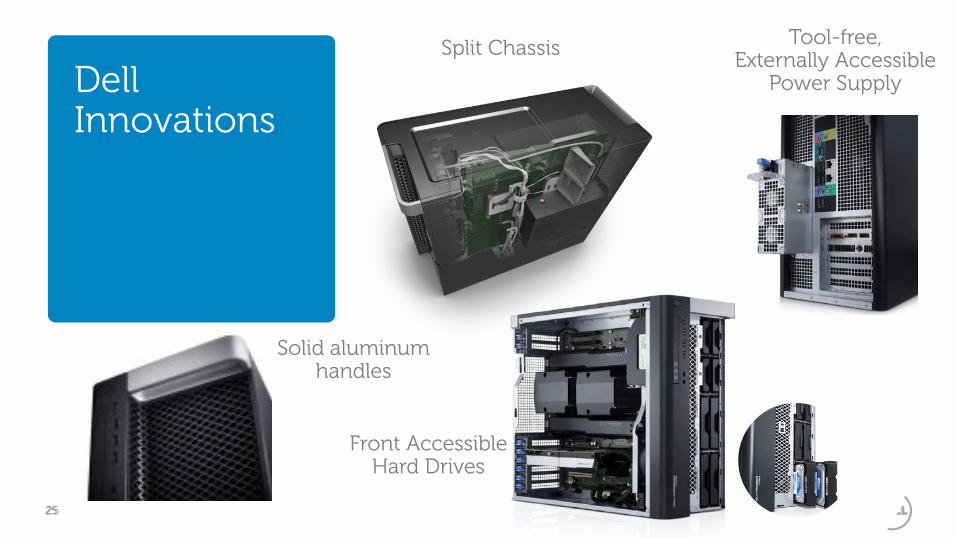
Split Chassis
Front Accessible Hard Drives
Tool-free, Externally Accessible
Power Supply
Solid aluminum handles
25
Dell Innovations
26 Precision Product Group
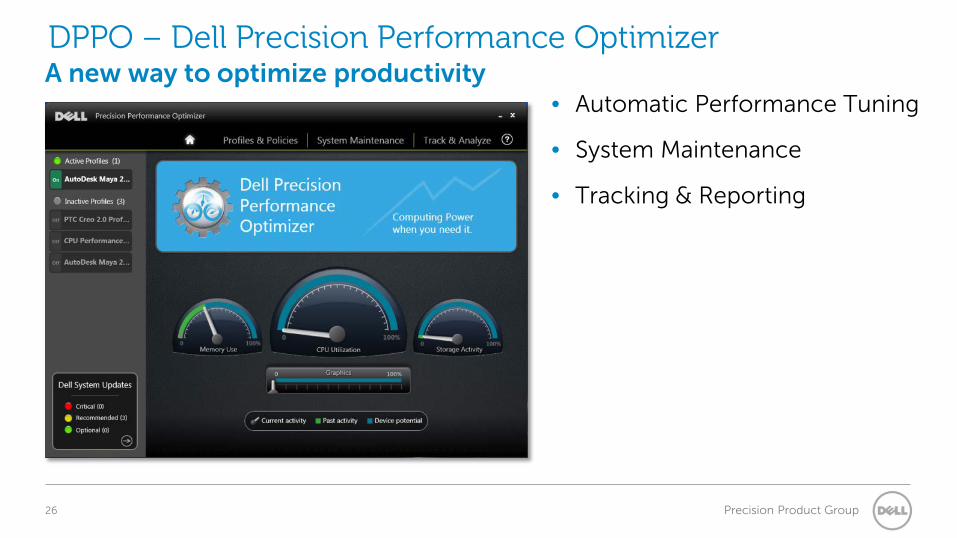
DPPO – Dell Precision Performance Optimizer A new way to optimize productivity
• Automatic Performance Tuning
• System Maintenance
• Tracking & Reporting
27 Precision Product Group
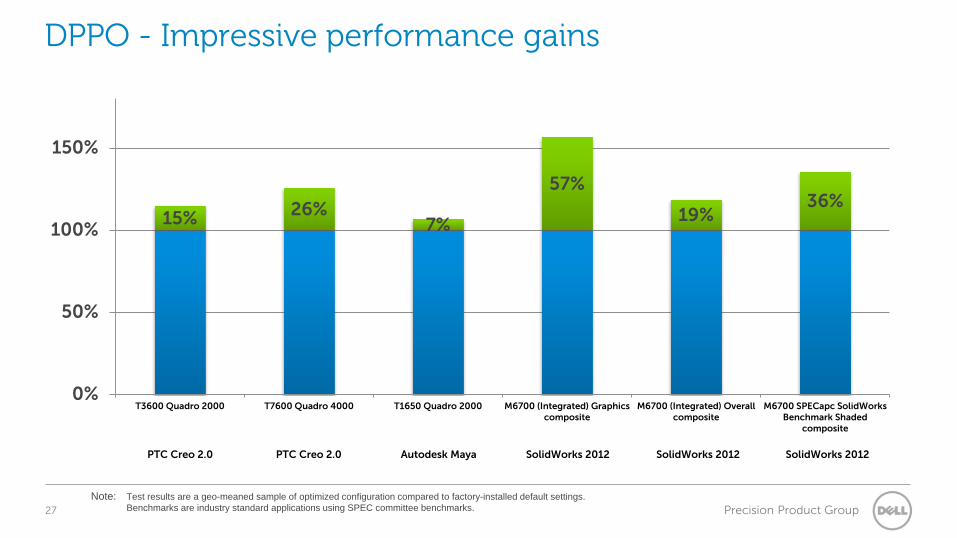
DPPO - Impressive performance gains
15% 26% 7%
57%
19% 36%
0%
50%
100%
150%
T3600 Quadro 2000 T7600 Quadro 4000 T1650 Quadro 2000 M6700 (Integrated) Graphicscomposite
M6700 (Integrated) Overallcomposite
M6700 SPECapc SolidWorksBenchmark Shaded
composite
PTC Creo 2.0 Autodesk Maya SolidWorks 2012
Note: Test results are a geo-meaned sample of optimized configuration compared to factory-installed default settings. Benchmarks are industry standard applications using SPEC committee benchmarks.
PTC Creo 2.0 SolidWorks 2012 SolidWorks 2012
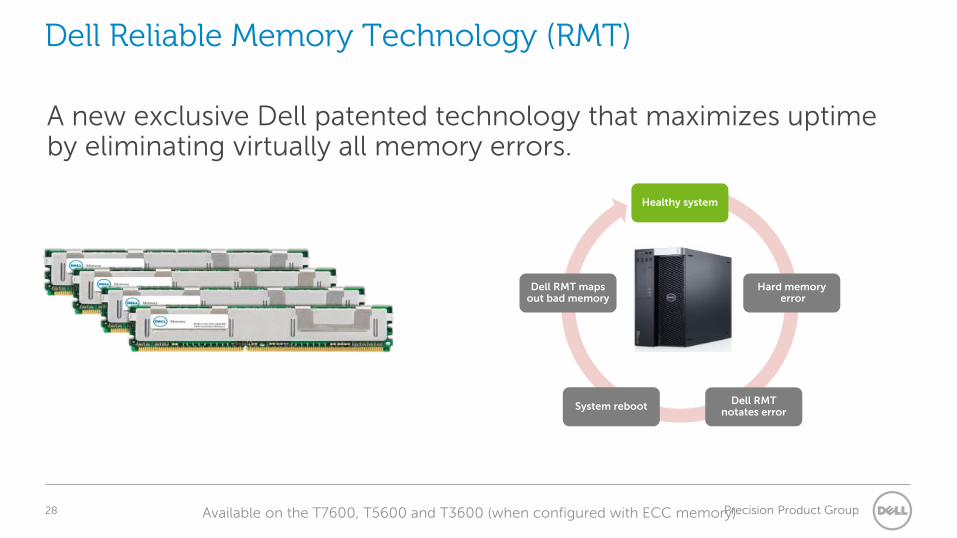
28 Precision Product Group
Dell Reliable Memory Technology (RMT) A new exclusive Dell patented technology that maximizes uptime by eliminating virtually all memory errors.
Available on the T7600, T5600 and T3600 (when configured with ECC memory)
Healthy system
Hard memory error
Dell RMT notates error System reboot
Dell RMT maps out bad memory
29 Precision Product Group
Summary
• Professionals demand real-time performance that only professional workstations and graphics can provide
• Good choices = great ROI
• Use tools available for selecting the right workstation – Dell Workstation Advisor – Dell Precision Workstations – Dell Solution Centers

30 Precision Product Group
Workstation Virtualization Class
• Thursday - 16:00
• Explore Dell Wyse Datacenter's Graphics Options for Virtual Desktop Computing (Presented by Dell)
• Room 210F
31 Precision Product Group
Next Steps
• Come see us at booth #721
32 Precision Product Group
How to justify the right system

33 Precision Product Group
Return on Investment – do the Math
• Assumptions – Additional investment = $1,675 – Labor Cost (L) = $7,583 / month
($70K annual salary + 30% overhead )
– Productivity Gain (g) = 10%
• Benefits – Break even ~ 5 months – ROI 236% for first year – $8,273 labor savings in first year
• Savings = L (1 − 11+𝑔
)
– = $7,583 (1- 1
1+0.1)
– = $689 / month
34 Precision Product Group
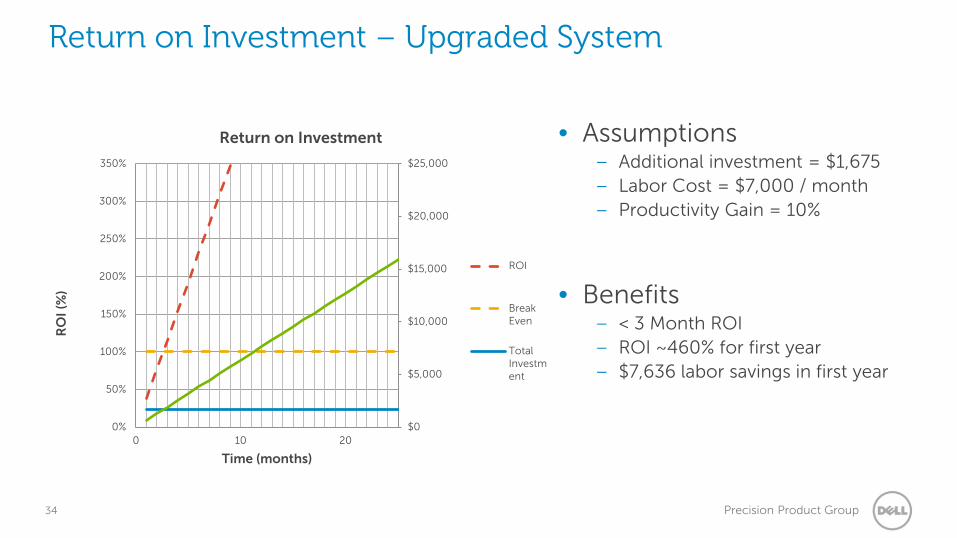
Return on Investment – Upgraded System
$0
$5,000
$10,000
$15,000
$20,000
$25,000
0%
50%
100%
150%
200%
250%
300%
350%
0 10 20
RO
I (%
)
Time (months)
Return on Investment
ROI
BreakEven
TotalInvestment
• Assumptions – Additional investment = $1,675 – Labor Cost = $7,000 / month – Productivity Gain = 10%
• Benefits – < 3 Month ROI – ROI ~460% for first year – $7,636 labor savings in first year
35 Precision Product Group
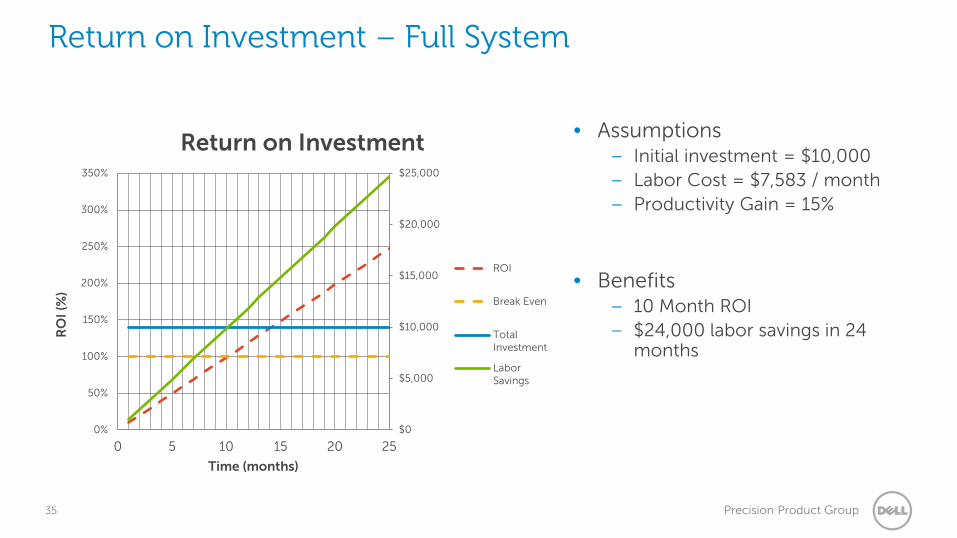
Return on Investment – Full System
$0
$5,000
$10,000
$15,000
$20,000
$25,000
0%
50%
100%
150%
200%
250%
300%
350%
0 5 10 15 20 25
RO
I (%
)
Time (months)
Return on Investment
ROI
Break Even
TotalInvestment
LaborSavings
• Assumptions – Initial investment = $10,000 – Labor Cost = $7,583 / month – Productivity Gain = 15%
• Benefits – 10 Month ROI – $24,000 labor savings in 24
months
Recommended