Journal of Solar Energy Research Vol 4 No 2 Spring (2019) 107-127
107
Comparative Study and Optimization of a Solar Combined Power and
Natural Gas Liquefaction Cycle Equipped with Various Ejector
Refrigeration Loops
Arezoo Sohbatlooa, Fateme Ahmadi Boyaghchia,*
aDepartment of Mechanical Engineering, Faculty of Engineering and Technology, Alzahra University, Tehran, Iran
*E-mail: [email protected]
ARTICLE INFO
A B S T R A C T
Received in revised
from: 2019/6/30
Accepted: 2019/7/26
This research develops and analyses three combinations of a solar driven cascade organic
Rankine cycle (CORC) with ejector refrigeration loop (ERL) to produce power and liquefied
natural gas (LNG) using exergy, exergoeconomic and exergoenvironmental concepts. In Case
I, the extracted streams from turbines are used as ejectors primary fluids, in Case II, the ejector
in high temperature (HT) loop is inserted after turbine and in Case III both ejectors are installed
before the turbines. A comparative study is conducted to evaluate the performances of the
proposed layouts. The simulation results demonstrate that Case III gives the lowest total product
cost rate of 78.372 $/h and Case II causes the maximum energy and exergy efficiencies of 14.3%
and 7.101%, respectively. Moreover, in this layout, the cost and environmental impact (EI) per
exergy unit of LNG are improved by about 0.003 $/GJ and 17 mPts/GJ, respectively in relation
to Case I. Finally, the ultimate solution of Case II as the best layout is ascertained and compared
with Case I by applying Non-dominated Sorting Genetic Algorithm II (NSGA-II) and three
decision makers, namely LINMAP, TOPSIS and Shannon Entropy. According to the
optimization results, the maximum improvements in product cost rates are achieved within
1.2% and 2.2% for cases I and II, respectively and the maximum reduction in EI rate for Case I
is obtained within 1.05% through LINMAP method. © 2019 Published by University of Tehran Press. All rights reserved.
Keywords: Perturbation, solar
irradiance, semiconductor
temperature, photovoltaic
parameters, output current
and voltage, thermal
conductance and
resistance.
1. Introduction
ORC is a technology converting low-grade heat
sources such as industrial waste heat, solar energy,
biomass and geothermal energy into high-grade power
energy by applying a low-boiling temperature organic
material as the working fluid [1]. To enhance the
performance of the traditional ORC, a new ORC
configuration called cascade ORC (CORC) was
developed in which the coolant waste heat in HT ORC
loop was utilized to drive low temperature (LT) ORC
loop in order to produce additional power [2-6]. To
achieve a better thermodynamic performance of
CORC, a regenerator was applied in the HT ORC loop
[7].
In recent years, many researches have been devoted to
study ORC-based combined cycles in order to satisfy both
cooling and power needs. Regarding to the traditional ORC
combined cooling and power (CCP) cycle, cooling effect
can be produced using an absorption refrigeration cycle [8-
11] or ejector refrigeration loop (ERL). An ERL is a
promising way of producing cooling effect because an
ejector with simple and no moving parts has several
advantages such as: improving the coefficient of
performance, low operational and maintenance costs and
ability to operate with various refrigerants [12-16]. Several studies on ORC CCP with special place for insulation of the ejector have been reported in the literature. For instance, Wang et al. [17] proposed and analyzed

Journal of Solar Energy Research Vol 4 No 2 Spring (2019) 107-127
108
thermodynamically an ORC CCP with R123 as working fluid.
In this design, the extracted vapor from the turbine acted as the
primary fluid of the ejector and the room space got cooled by
cooling effect produced in evaporator. Similar configuration for
the ejector location was constructed by Habibzadeh et al. [18].
In this research, the effects of various organic working fluids
were evaluated on the performance of the system. Zheng and
Weng [19] designed an ORC CCP at which the expanded fluid
exiting turbine entered the ejector as primary fluid and water got
cooled in the evaporator. The thermodynamic performances of
the proposed system were studied by applying different organic
fluids.
Ahmadzadeh et al. [20] investigated an ORC CCP integrated
with evacuated tube solar collectors. Partially expanded working fluid
exiting the turbine was applied as the ejector primary fluid.
Thermodynamic performance of the proposed system was evaluated
and a thermo-economic analysis was conducted using the SPECO
(specific exergy costing) method. Rostamzadeh et al. [21] proposed
and compared the performances of four appropriate combination of
ORCs with a distinct ERL at which the energy of ejector primary fluid
was provided from the stream leaving turbine via a heat exchanger.
Rostamzadeh et al. [22] designed two ORC CCPs in which ERL was
used to produce cooling load at three and two[23] temperature levels
for freezing, refrigeration and air-conditioning usages and power was
produced using an ORC and recuperative ORC with turbine bleeding.
In all layouts, ERL was cascaded with the condenser of ORC. The
proposed cycles were analyzed and optimized by applying
thermodynamic and exergoeconomic concepts. All configurations
provided the space cooling for domestic applications.
For industrial application, a combination of CORC instead
of traditional ORC with ERLs was proposed to liquefy the NG.
In this research, solar energy was employed using linear Fresnel
collector (LFC) and two ERLs were installed in HT and LT
ORC loops. The primary fluids of EJCs were provided by
streams extracted from turbines [24].
To the best of our knowledge and surveying the mentioned
literature review, the combination of ORC or CORC CCP with
various ERLs has not been performed so far. The novelty of
this work is to design new locations for ERLs by combining all
possible cases for driving ERLs, i.e. using stream before
turbines, extracted stream of turbines or stream exiting turbines,
in an existing solar driven CORC CCP based LNG cycle [24]
(Case I) for an industrial application. The main objectives of
this study are pinpointed as follows:
a) To conduct the energy, exergy, exergoeconomic and
exergoenvironmental concepts for all cases.
b) To determine and compare the thermodynamic, economic
and EI performances of the desired cases during a year.
c) To identify the superiority of each case from the energy,
exergy, exergoeconomic and exergoenvironmental
perspectives.
d) To select the best layout by considering the aforementioned
perspectives.To assess and compare the performances of the
selected case in comparison with Case I by conducting a
parametric study.
e) To optimize and compare the performances of the selected cases
by applying LINMAP, TOPSIS and Shannon entropy decision
makers from the Pareto frontier obtained by NSGA-II.
2. Cycle description
Figure 1 illustrates the schematic diagram of a solar
power/LNG production system with various ERL
configurations and with various cases and their T-s
diagrams. The desired systems consist of an LFC field as
more cost effective concentrating collector [25-30], three
TSTs, a CORC, two ERLs placed in LT and HT cycles and
NG process line. In the basic configuration denoted as Case
I, the primary flow of the ejectors are provided from the
streams extracted from TURs [24] while in Case II, EJC-1
is installed at the exit of TUR-1 and in Case III, both ejector
are placed before TURs and the primary flow is the fraction
of TURs entrance flows. In this study, R227ea and R32
with zero ozone depletion potential (ODP) and non-toxin
organic fluids are selected for HT and LT loops [31],
respectively.
The detailed operations of the systems are described as
follows: The R227ea saturated liquid in HT ORC cycle is
pressurized through P-1 (states 1 and 2) and then enters
PRC-1 to cool the high pressure NG (states G1 and G2).
The warm working fluid passes through HHE-2 and HHE-
1 where it gets super-heated (states 3-5) by absorbing the
thermal energy of hot Therminol-PV1 flowing inside the
solar subsystem (states E1-E3). The high pressure and
superheated R227ea flows into TUR-1 to produce power.
The two-phase flow thermal energy leaving TUR-1 (state
7) is used to preheat the working fluid inside the LT ORC
loop via CHE and R227ea gets liquid saturated via CON-1
by rejecting heat to NG (states G9 and G10). Then stream
reenters P-1 to complete the HT ORC loop. In LT ORC
loop, the pressure of R32 saturated liquid increases by P-2
(states 15 and 16) and it is preheated by cooling NG via
PRC-2 and by absorbing the heat of two-phase flow exiting
TURs via REG and CHE and then it is superheated by
receiving thermal energy from Therminol-PV1 (states E3
and E4) inside LHE-1 (states 15-20). The superheated R32
produces power when passing through TUR-2 and gets
liquid saturated (states 22-24) by losing heat inside REG
and CON-2 by rejecting heat to LNG (states G8 and G9).
On the other hand, to liquefy the precooled NG, each ORC
cycle is equipped by ERL. In Case I, a part of stream
passing through TURs is extracted and enters the drive
nozzle of EJCs as primary fluid (states 14 and 29). The
primary stream jetting from ejector nozzle (state a) sucks
the low temperature and pressure vapor fluid leaving EVAs
(states 12 and 27) with a pressure reduction (state b). The
two stream are mixed in the ejector at constant pressure
(state c) as shown in Figure 2. Then, the mixed flow leaves
the ejector diffuser with a pressure rise (states 13 and 28).
The precooled NG is discharged into EVA-1, PRC-2 and
EVA-2 and gets liquid completely (states G2- G6). A
portion of LNG is extracted to produce cooling medium for
CONs (states G8-G10) and then returned to EVP-2. In Case
II, EJC-1 is placed after TUR-1. In this way, the leaving
two-phase fluid is sent to EJC-1 as primary fluid and in
Case II both EJCs are installed before TURs and a portion
of stream entering TURs flows into EJCs as primary fluid.

Journal of Solar Energy Research Vol 4 No 2 Spring (2019) 107-127
109
2. Energy methods
Energy analysis is performed by considering several
assumptions:
• All components operate under the steady state condition.
• The kinetic energy is negligible for all components except
ejectors.
• The potential energy is neglected for all components.
• The pressure drops inside pipelines and all components
except LFC are negligible.
• No heat transfer with environment occurs for the pipelines
and all components except LFC and TST.
• The process through the TV is isenthalpic.
• The environmental temperature and pressure are taken to be
298.15 K and 101.325 kPa, respectively.
• The isentropic efficiencies for TURs and Ps are taken to be
0.85 and 0.95, respectively.
• P-1 and P-2 entrance streams are considered as saturated
liquid and EVAs outlet streams are saturated vapor.
For steady flow components, the mass rate balance can be
written as:
= in outm m (1)
and the energy rate balance can be written as:
+ + = + + in in in in out out out outQ W m h Q W m h (2)
In Eqs. (1) and (2), m is mass flow rate, Q is heat transfer
rate, W is power and h is enthalpy. The indexes “in” and “out”
indicate the input and output streams.
The energy rate balance for LFC, EJCs and TST can be written
in different ways as follows:
1.1. Ejector simulation
The ejectors can be classified into constant-pressure and
constant-area types. According to the studies reported in the
literature, the performance of the constant-pressure mixing
ejector is better than that of the constant-area one [12, 32, 33].
Figure 2 indicates the constant-pressure mixing ejector
containing the motive nozzle, suction chamber, constant area
section and diffuser section. By neglecting the velocities of inlet
and outlet streams of the ejector and considering the friction
losses inside nozzle, mixing and diffuser sections in terms of
efficiencies, the mathematical model is established for the one-
dimensional constant-pressure ejector by Eqs. (3) to (16):
1.1.1. At the motive nozzle outlet
( )1=a,is ah h P ,s (3)
( )1 1= − −a mn a,ish h h h (4)
Here, mn is the isentropic efficiency of the motive nozzle, set
to be 0.85.
( )12= −a aV h h (5)
where V indicates the stream velocity.
( )1
1
1=
+b
a a
AV
(6)
In Eq. (6), is the entrainment ratio defined as the
ejector suction mass flow rate to motive mass flow and refers to the fluid density.
1.1.1. At the suction nozzle outlet
( )2=b,is bh h P ,s (7)
( )2 2= − −b sn b,ish h h h (8)
Here, sn is the isentropic efficiency of the suction nozzle,
given to be 0.85.
( )1
1=
+b
b b
AV
(9)
1.1.2. In the mixing section
1
1 1
= +
+ + c ms a bV V V
(10)
Here, ms is the isentropic efficiency of the mixing section,
given to be 0.95.
2 2 2
1
1 2 1 2 2
= + + + −
+ +
a b cc a b
V V Vh h h
(11)
( )=c c cs s P ,h (12)
1.1.3. At the diffuser outlet 2
32
= + cc
Vh h (13)
( )3 3= − −,is c d ch h h h (14)
where d is the isentropic efficiency of the diffuser outlet
with value of 0.85.
( )3 = c,is cP P h ,s (15)
The entrainment ratio of the ejector can be calculated by
iteration with known values of P1, P2, P and efficiencies
until the quality of fluid (x) at the exit of ejector is valid.
3
1
1=
+x
(16)
1.2.LFC simulation
An LFC mainly contains long, thin and flat segments
of mirror as the first flat reflectors, a fixed tubular receiver
enveloped by the vacuumed glass cover and a parabolic
cavity as the second reflector. The mirrors sloped with tilt

Journal of Solar Energy Research Vol 4 No 2 Spring (2019) 107-127
110
a) Case I
Case II
b) Case III
Figure 1. Schematic assembly of solar driven NG
liquefaction plant with various configurations of ERL[24]
and their T-s diagrams a) Case I, b) Case II and c) Case III
angle of can track the position of the sun in the sky from East to
West to concentrate the solar energy onto the fixed receiver located
at the focal point of the reflectors [34].
The useful heat energy gain uQ by Therminol-PV1 can be
determined using Eqs. (17) to (19) [34]:
( ) ( )
= − = − −
Lu oil P out in ap r air
UQ m C T T A S T T
C (17)
Here, m is mass flow rate, PC is specific heat, T is temperature, Aap
represents the aperture area, the subscript oil indicates Therminol-
PV1. LU refers to the overall heat
loss coefficient from the receiver to the environment which can
be calculated using the correlations expressed in [34]. In Eq.
(17), the subscripts, r and air are the receiver and air,
respectively. S and C indicate the absorbed solar heat and the
concentration ratio expressed by Eqs. (18) and (19),
respectively.
1 2= b g rS G r (18)
Where bG is beam radiation falling on a horizontal surface,
1 is the reflectivity of the first flat reflector, 2 is the
reflectivity of the second parabolic reflector (given to be 0.93),
g refers to the transitivity of the glass envelope (set to be
0.95), is the absorptivity of the receiver (set to be 0.95)
and r is shading factor.
1
2=
=
= = n m
ap n
nr i
A wcosC
A D
(19)
In Eq. (19), rA is the receiver area. w refers to the width of the
constituent mirror elements, n is the tilt angle of mirrors,
iD
is the inner diameter of receiver and n indicates the mirror
number.
A TST is mounted in solar subsystem to operate as a buffer
between LFC field and CORC subsystem. The temperature of
Therminol-PV1 at the exit of TST can be calculated by
assuming the well-mixed model and correlations expressed by
Wang et al. [35].
3. Exergy-based methods
An exergy analysis is a convenient tool to identify the
location, magnitude and causes of thermodynamic
rreversibilities within the kth component of energy conversion
system and the exergy loss due to the exergy
transfer to the environment. The exergy associated with each
stream of the overall system can be calculated using the exergy
balance with concepts of fuel and product for the kth
component as follows [36]:
= + +F ,k P,k D,k L,kEx Ex Ex Ex (20)
Here, ( )=Ex mex indicates the physical and chemical
exergy streams divided into the thermal component (Tex ) and
mechanical component (Mex ) for stream that its temperature
is lower than dead state [36]. The indexes F, P, D and L denote
the fuel, product, destruction and losses, respectively.
The exergy destruction ratio of the each component, D,ky , can
be calculated using Eq. (21):
=D,k
D,k totF
Exy
Ex (21)
Exergoeconomic analysis is the combination of exergy and
cost concepts providing the designer or operator of a system
with information crucial to the design or operation of a cost
effective system [36, 37]. A cost balance applied to the kth
system components shows that the sum of cost

Journal of Solar Energy Research Vol 4 No 2 Spring (2019) 107-127
111

Journal of Solar Energy Research Vol 4 No 2 Spring (2019) 107-127
112
rates associated with all existing exergy stream equals the
sum of cost rates of all entering exergy streams plus the
appropriate charges due to capital investment and operating
and maintenance expenses[38]. The cost balance of the kth
component can be written based on the specific exergy
costing approach as follows:
+ = + + out ,k w q,k in,k k
out in
C C C C Z (22)
=in in inC c Ex (23)
=out out outC c Ex (24)
=w wC c W (25)
=q q qC c Ex (26)
where c is the average cost per unit of exergy. Cdenotes the cost stream associated with the corresponding
exergy stream. The indexes in and out refer to the entering
and exiting streams of matter. The indexes w and q refer to
the power and heat transfer rates.
The Z appeared in Eq. (22) is the cost rate associated
with the capital investment and operating and maintenance
expenses, which can be written as:
= k
k
Z CRFZ
N
(27)
Here, is the maintenance factor and CRF refers to the
capital recovery factor being expressed by [36]:
( )
( )
1
1 1
+=
+ −
N
N
IR IRCRF
IR (28)
In Eq. (28), IR and N are respectively the interest rate and the
system life. Table 1 indicates the values of economic
parameters and the purchased equipment costs of components
are presented in Appendix A.
In exergoeconomic analysis, it is assumed that the average cost
per unit of entering exergy streams are known for all entering
streams. Consequently, the unknown variables to be calculated
from a cost balance for the kth component are the costs per
exergy unit of the exiting material streams. Therefore, n-1
auxiliary relations are required for components with n exiting
exergy streams. These relations
can be written using Fuel and Product rules detailed in[36].
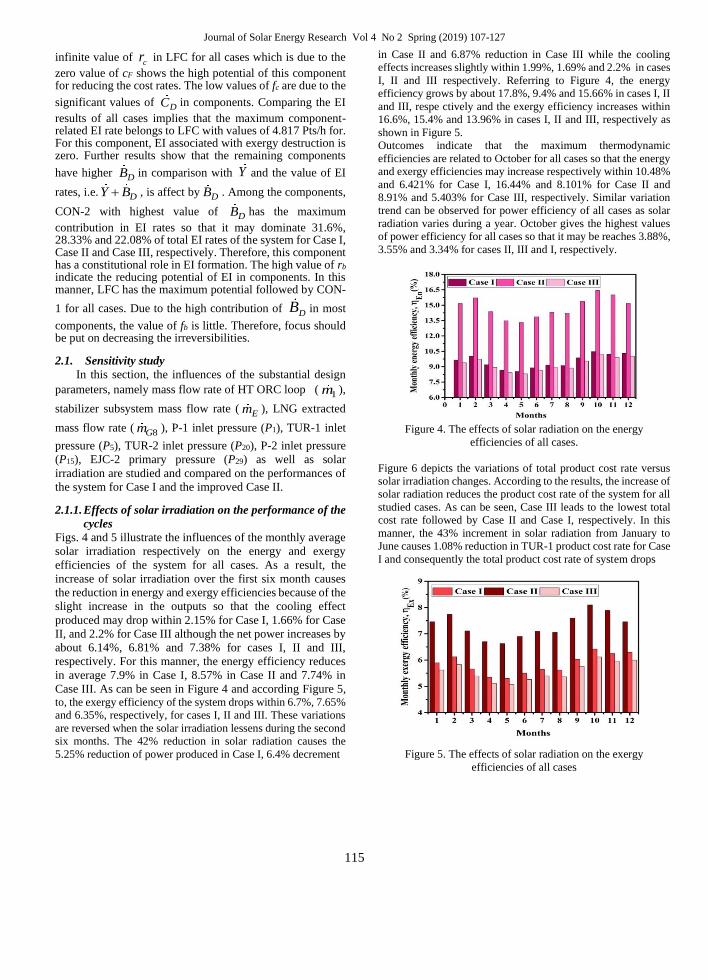
Table 2 indicates the cost balance with corresponding auxiliary
equations of each component. By solving the cost balances and
auxiliary equations, simultaneously, all average cost per unit
of exergy streams of a system can be calculated.
The evaluation of each component from the
exergoeconomic viewpoint can be carried out by applying Eqs.
(29), (31) and (32).
D,k F ,k D,kC c Ex= (29)
In Eq. (29), DC indicates the cost associated with the exergy
destruction in a component or process and cF is the cost per
exergy of fuel which can be calculated by:
=F ,k
F ,k
F ,k
Cc
Ex (30)
Here, F ,kC is the cost rate associated with the fuel which is
obtained by replacing the exergy ( Ex ) by cost rate C in the
fuel exergy of the each component.
=+
k
c,k
k D,k
Zf
Z C (31)
=D,k F ,k D,kB b Ex (35)
Journal of Solar Energy Research Vol 4 No 2 Spring (2019) 107-127
113
Here, fc,k is the exergoeconomic factor indicating the contribution
of the component-related investment cost rate, kZ , to the total
cost of the component, +k D,kZ C A low value of the
exergoeconomic factor calculated for a major component
suggests that cost saving in the entire system might be achieved
by improving the component efficiency. A high value of this
factor suggests a decrease in the investment costs of this
component at the expense of its exergetic efficiency [36].
−=
P ,k F ,k
c ,k
F ,k
c cr
c (32)
where, rc,k is the relative cost difference. This variable express
the relative increase in the average cost per exergy unit between
fuel and product of the component (P,kc ). The relative cost
difference represents the cost reduction potential within the kth
component. The value of P,kc can be estimated by following
relation:
=P,k
P,k
P,k
Cc
Ex (33)
In Eq. (33), P,kC is the cost rate associated with the product
which is obtained by replacing the exergy ( Ex ) by cost rate
C in the product exergy of the each component.
An exergoenvironmental analysis
combines the exergy analysis and life cycle assessment (LCA) to
identify the EI of exergy streams. The EI balances for the kth
component can be written as [40]:
+ = in,k k out ,k
in out
B Y B (34)
Here, ( )=B bEx is the EI rate associated with the exergy
stream, b is the average EI per unit of exergy.
The kY appeared in Eq. (34), indicates the component-related EI
of the kth component comprising the construction, operation and
maintenance and the disposal of the component identified by
LCA based on based on Eco-indicator 99. Table 2 indicates the
EI balance with corresponding auxiliary equations of each
component.
To assess the system components EI, three criteria are defined as
follows:
Table 1. Economic parameters [39].
Parameter Value
1.06
IR 10%
N 20 year
where, DB is the EI of exergy destruction rate within the kth
component and bF indicates the EI per exergy of fuel.
=+
k
b,k
k D,k
Yf
Y B (36)
Here, fb,k is the exergoenvironmental factor within the kth
component expressing the contribution of the component-related
EI, kY , to the total EI of the component, k D,kY B+ .
−=
P ,k F ,k
b ,k
F ,k
b br
b (37)
In Eq. (37), rb,k is the relative EI difference, indicating the EI
reduction potential within the kth component and bP is the EI per
exergy of product.
4. Performances
The average annual energy efficiency of the system is
defined as:
+= net LNG
Enap b
W Q
A G (38)
The average annual power efficiency of the system is defined as:
= netEn
ap b
W
A G (39)
The average annual exergy efficiency of the system can be
calculated by:
7 1
1 7
− −
− −
+ − =
+ −
T T
net LNG G G
Ex M M
F ,LFC LNG G G
W m ex ex
Ex m ex ex (40)
The total product cost rate associated with power and LNG
production can be calculated by:
1 2− −= + +tot
P P,LNG P,TUR P,TURC C C C (41)
The EI rates of system can be written as:
1 2− −= + +tot
P P,LNG P,TUR P,TURB B B B (42)
5. Multi-objective Optimization procedure
In this investigation, NSGA-II evolutionary algorithm
proposed by Deb [41] is employed to find the optimum annual
performances and design parameters of the proposed systems.

Journal of Solar Energy Research Vol 4 No 2 Spring (2019) 107-127
114
The flow chart of NSGA-II algorithm is illustrated in Figure 3.
The energy efficiency and exergy efficiency, cost and EI
rates of the systems which are assessed by Eqs. (38) to (40) are
considered as four objective functions. In this regard, ten and
nine major design parameters respectively for Case I and Case II
listed in Table 3 with corresponding boundaries are selected as
decision variables. Meanwhile, tuning parameters of genetic
algorithm used for convergence of the results are listed in Table
4.
To find the optimum solution from the Pareto frontier, the
most recognized decision makings including Shannon Entropy,
LINMAP and TOPSIS procedures are employed in parallel.
Detail descriptions of the Shannon Entropy, LINMAP and
TOPSIS decision makers can be found in Refs. [42-45].
2. Results and discussion
According to the assumptions made in section 2 and input
parameters listed in Table 5, simulations of the proposed systems
are performed by developing codes in Engineering Equation
Solver (EES) software to solve the governing equations and
R227ea and R32 properties. A parametric study is also carried
out to determine the positive effects of varying several important
parameters on the thermodynamic, economic and environmental
performances of all cases.
The results of various ERLs on the performances of the
system are tabulated accordingly in Table 6. The outcomes show
that mounting the ejector at the exit of TUR-1, i.e. Case II,
improves the produced cooling load of liquefaction within 1.9
times in relation to Case I due to increase of LNG capacity.
Moreover, the produced LNG exergy gets 1.82 times while
these values are lower in other cases. In this manner, the mass
flow rate of produced LNG gets within 4 kg/s and energy and
exergy efficiencies increase by about 43.3% and 9.5%,
respectively.
Obviously, Case I gives the maximum power efficiency of
4.11% followed by cases III and II, respectively. The amount of
total product cost rate of Case III is lower than that of other cases.
Indeed, when the primary streams for EJCs are provided from
the streams before TURs, the cost per exergy of TURs drops. The
highest value of totPB belongs to Case II because the LNG exergy
rate is higher than that of other cases. On the other hand, when
EJC is installed at the exit of TUR, an effective cooling load is
produced consequently the required heat exchangers area reduce
leading to the lower cost and EI per exergy unit of LNG. This
valuable result makes Case II as a convenient configuration for
LNG production as compared with Case III. In order to show the
advantages of the proposed system, the amounts of produced
power and cooling load in the present
layouts are compared with those reported in the
literature and listed in Table 7. As can be seen,
designing the proper configuration for ORC and
selecting of suitable refrigerants can improve the
amounts of outputs. The cooling load produced in cases
I, II and III are 743.1 kJ/s, 1419 kJ/s and 721.3 kJ/s,
respectively which are 639.06 kJ/s, 1314.96 kJ/s and
617.26 kJ/s higher than the maximum value reported in
[23]. Moreover, the produced power in cases I, II and
III are 406.1 kW, 276.5 kW and 293.6 kW higher than
the maximum produced power reported by Wang et
al.[17]. Tables 8 to 10 present the exergy based results
obtained for Case I, Case II and Case III respectively.
According to the results, the highest exergy destruction
rate belongs to LFC destroying 74.27%, 75.22% and
74.28% of the input exergy in Case I, Case II and Case
III, respectively while P-2 has the lowest contribution
for destroying the exergy in all cases. The total exergy
destruction rate of the system in Case I is 13,588.7 kW
while it is about 14,169.6 kW and 13,805 kW in Cases
II and III, respectively.
Figure 3. Flow chart of NSGA-II algorithm employed in this
research.
to, the exergy efficiency of the system drops within 6.7%, 7.65%
and 6.35%, respectively, for cases I, II and III. These variations
are reversed when the solar irradiation lessens during the second
six months. The 42% reduction in solar radiation causes the
5.25% reduction of power produced in Case I , 6.4% decrement
in Case II and 6.87% reduction in Case III while the cooling
effects increases slightly within 1.99%, 1.69% and 2.2% in cases
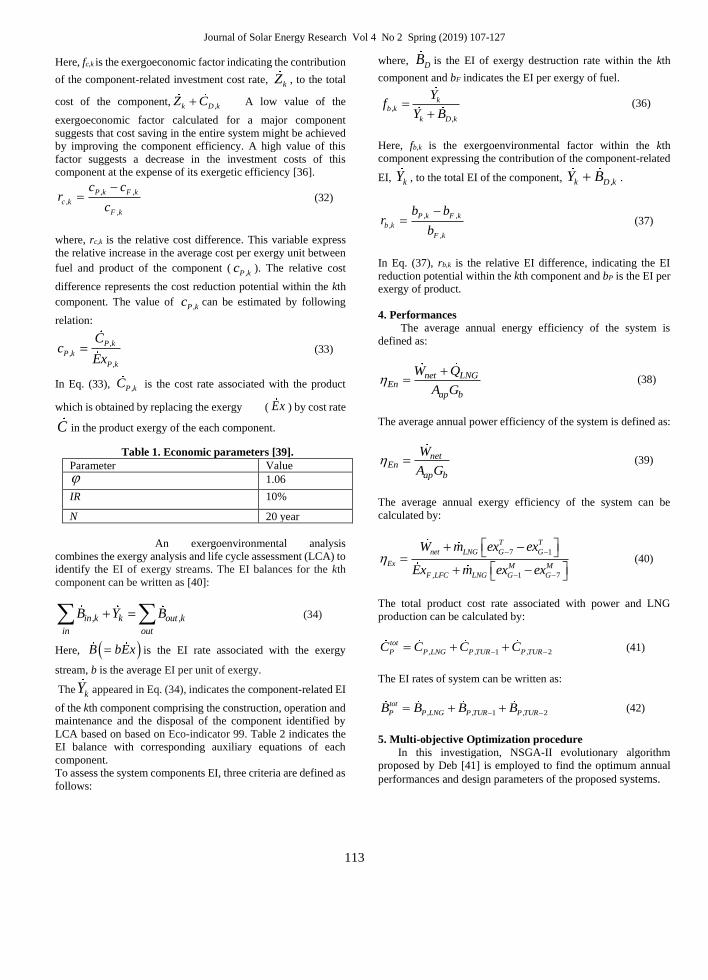
I, II and III respectively. Referring to Figure 4, the energy
efficiency grows by about 17.8%, 9.4% and 15.66% in cases I, II
and III, respe ctively and the exergy efficiency increases within
Exergoeconomic analysis indicates that 71.0%, 73.5% and
74.21% of the total Z are related to LFC in Case I, Case II and Case III, respectively followed by TUR-2 with value of 5.713 $/h, 5.357 $/h and 4.831 $/h in cases I and II and 3.57%
in Case III. In most components, the value of DC is
dominant. Therefore, the large portion of the cost rates, i.e.
+DC Z , is due to the exergy destruction cost rate of the
system. According to the results, the maximum DC and
consequently cost rates belong to TST involving 36.45%, 30.59% and 28.76% of total cost rates of the system for Case I, Case II and Case III, respectively. As can be seen, the
Journal of Solar Energy Research Vol 4 No 2 Spring (2019) 107-127
115
infinite value of cr in LFC for all cases which is due to the
zero value of cF shows the high potential of this component for reducing the cost rates. The low values of fc are due to the
significant values of DC in components. Comparing the EI
results of all cases implies that the maximum component-related EI rate belongs to LFC with values of 4.817 Pts/h for. For this component, EI associated with exergy destruction is zero. Further results show that the remaining components
have higher DB in comparison with Y and the value of EI
rates, i.e. + DY B , is affect by DB . Among the components,
CON-2 with highest value of DB has the maximum
contribution in EI rates so that it may dominate 31.6%, 28.33% and 22.08% of total EI rates of the system for Case I, Case II and Case III, respectively. Therefore, this component has a constitutional role in EI formation. The high value of rb indicate the reducing potential of EI in components. In this manner, LFC has the maximum potential followed by CON-
1 for all cases. Due to the high contribution of DB in most
components, the value of fb is little. Therefore, focus should be put on decreasing the irreversibilities.
2.1. Sensitivity study
In this section, the influences of the substantial design
parameters, namely mass flow rate of HT ORC loop ( 1m ),
stabilizer subsystem mass flow rate ( Em ), LNG extracted
mass flow rate ( 8Gm ), P-1 inlet pressure (P1), TUR-1 inlet
pressure (P5), TUR-2 inlet pressure (P20), P-2 inlet pressure
(P15), EJC-2 primary pressure (P29) as well as solar
irradiation are studied and compared on the performances of
the system for Case I and the improved Case II.
2.1.1. Effects of solar irradiation on the performance of the
cycles
Figs. 4 and 5 illustrate the influences of the monthly average
solar irradiation respectively on the energy and exergy
efficiencies of the system for all cases. As a result, the
increase of solar irradiation over the first six month causes
the reduction in energy and exergy efficiencies because of the
slight increase in the outputs so that the cooling effect
produced may drop within 2.15% for Case I, 1.66% for Case
II, and 2.2% for Case III although the net power increases by
about 6.14%, 6.81% and 7.38% for cases I, II and III,
respectively. For this manner, the energy efficiency reduces
in average 7.9% in Case I, 8.57% in Case II and 7.74% in
Case III. As can be seen in Figure 4 and according Figure 5, to, the exergy efficiency of the system drops within 6.7%, 7.65%
and 6.35%, respectively, for cases I, II and III. These variations
are reversed when the solar irradiation lessens during the second six months. The 42% reduction in solar radiation causes the
5.25% reduction of power produced in Case I, 6.4% decrement
in Case II and 6.87% reduction in Case III while the cooling
effects increases slightly within 1.99%, 1.69% and 2.2% in cases
I, II and III respectively. Referring to Figure 4, the energy
efficiency grows by about 17.8%, 9.4% and 15.66% in cases I, II
and III, respe ctively and the exergy efficiency increases within
16.6%, 15.4% and 13.96% in cases I, II and III, respectively as
shown in Figure 5.
Outcomes indicate that the maximum thermodynamic
efficiencies are related to October for all cases so that the energy
and exergy efficiencies may increase respectively within 10.48%
and 6.421% for Case I, 16.44% and 8.101% for Case II and
8.91% and 5.403% for Case III, respectively. Similar variation
trend can be observed for power efficiency of all cases as solar
radiation varies during a year. October gives the highest values
of power efficiency for all cases so that it may be reaches 3.88%,
3.55% and 3.34% for cases II, III and I, respectively.
Figure 4. The effects of solar radiation on the energy
efficiencies of all cases.
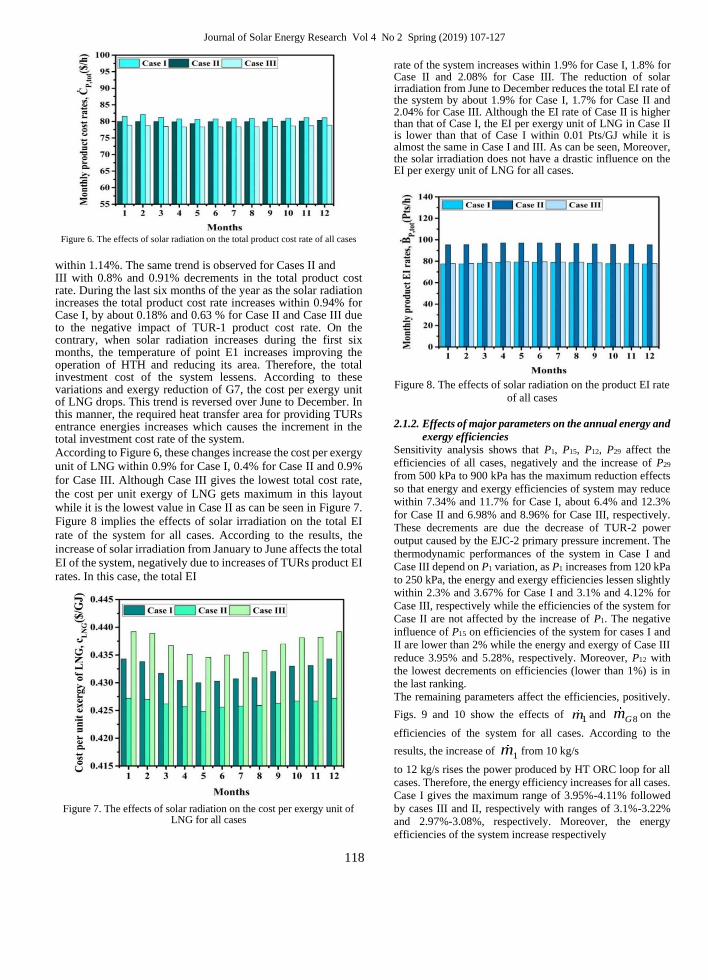
Figure 6 depicts the variations of total product cost rate versus
solar irradiation changes. According to the results, the increase of
solar radiation reduces the product cost rate of the system for all
studied cases. As can be seen, Case III leads to the lowest total
cost rate followed by Case II and Case I, respectively. In this
manner, the 43% increment in solar radiation from January to
June causes 1.08% reduction in TUR-1 product cost rate for Case
I and consequently the total product cost rate of system drops
Figure 5. The effects of solar radiation on the exergy
efficiencies of all cases
Journal of Solar Energy Research Vol 4 No 2 Spring (2019) 107-127
116

Journal of Solar Energy Research Vol 4 No 2 Spring (2019) 107-127
117
Table 4. Genetic algorithm parameters.
Parameter Value Population size 200
Generation size 100
Crossover fraction 0.8
Mutation rate 0.01
Selection process Tournament
Table 5. Input data for all cases.
Term
Value
Case
I
Case
II
Case
III
Annual solar irradiation, H (kWh/m2.day) 7.35 7.35 7.35
TUR-1 inlet pressure, 5P (kPa) 2400 2400 2400
TUR-2 inlet pressure, 20P (kPa) 800 800 800
TUR-1 outlet pressure, 6P (kPa) 150 150 150
TUR-2 outlet pressure, 21P (kPa) 120 120 120
Solar subsystem pressure, EP (kPa) 105 105 105
Inlet temperature of solar subsystem, TE4 (K) 325 325 325
ST mass flow rate, Em (kg/s) 30 32.8 30
EJC-2 outlet pressure, 28P (kPa) 100 100 100
EJC-1 primary pressure, 12P (kPa) 16 16 16
EJC-2 primary pressure, 27P (kPa) 8 8 8
NG pressure, 1GP (kPa) 3500 3500 3500
NG inlet temperature , 1GT (K) 300 300 300
Mass flow rate of NG, 1Gm (kg/s) 2 4 2
HT loop mass flow rate, 1m (kg/s) 12 12 12
P-3 outlet pressure, 3SP (kPa) 500 500 500
Mass flow rate of bottom cycle, 16m (kg/s) 7.3 9 7.3
Table 6. The results obtained at the design point for
all studied cases Performance Case I Case II Case III
Net power output, netW (kW) 520.2 390.6 407.7
Power efficiency, Power (kW) 4.11% 3.09% 3.22%
Annual energy efficiency, En (%) 9.984 14.3 8.922
Annual exergy efficiency, Ex (%) 6.482 7.101 5.411
Total product cost rate, tot
PC ($/h) 80.82 79.92 78.372
Total EI rate, tot
PB (Pts/h) 78.228 96.912 79.272
Mass flow rate of LNG, LNGm
(kg/s)
2 4 2
Cost per exergy unit of LNG,
LNGc ($/GJ) 0.429 0.426 0.435
EI per exergy unit of LNG, LNGb(Pts/GJ)
7.367 7.35 7.373
Table 7. Comparison of present configurations with those reported in the literature.
Cycle proposed
ORC type Cooling load
(kJ/s)
Produced power
(kW) Single/refrigerant Cascade/refrigerant
In present work Case I - R227ea, R32 743.1 520.2
Case II - R227ea, R32 1419 390.6
Case III - R227ea, R32 721.3 407.7
by Wang et al.[17] R123 - 21.01 114.1
by Zheng and Weng [46] R245fa - 19.39 27.9
by Ahmadzadeh et al.[20] R141b - 9.35 49.9
by Ahmadzadeh et al. [20] R123 - 15.74 21.43
by Rostamzadeh et al.[22] Butene - 98.49 53.44
by Ebadollaet al.[23] R113 - 104.04 49.82
Journal of Solar Energy Research Vol 4 No 2 Spring (2019) 107-127
118
Figure 6. The effects of solar radiation on the total product cost rate of all cases
within 1.14%. The same trend is observed for Cases II and III with 0.8% and 0.91% decrements in the total product cost rate. During the last six months of the year as the solar radiation increases the total product cost rate increases within 0.94% for Case I, by about 0.18% and 0.63 % for Case II and Case III due to the negative impact of TUR-1 product cost rate. On the contrary, when solar radiation increases during the first six months, the temperature of point E1 increases improving the operation of HTH and reducing its area. Therefore, the total investment cost of the system lessens. According to these variations and exergy reduction of G7, the cost per exergy unit of LNG drops. This trend is reversed over June to December. In this manner, the required heat transfer area for providing TURs entrance energies increases which causes the increment in the total investment cost rate of the system. According to Figure 6, these changes increase the cost per exergy
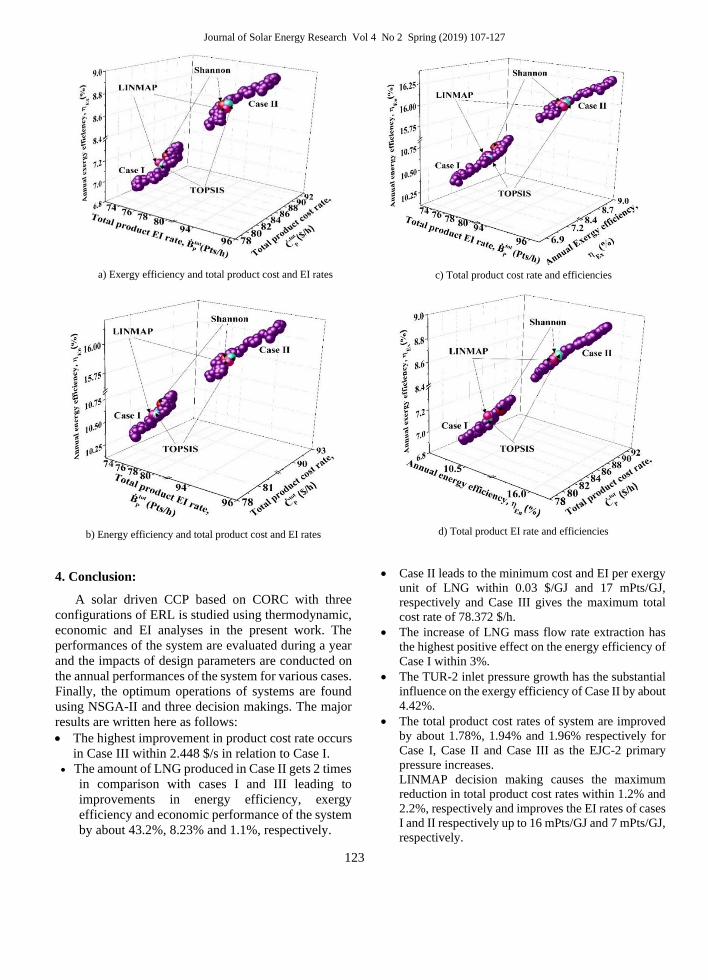
unit of LNG within 0.9% for Case I, 0.4% for Case II and 0.9%
for Case III. Although Case III gives the lowest total cost rate,
the cost per unit exergy of LNG gets maximum in this layout
while it is the lowest value in Case II as can be seen in Figure 7.
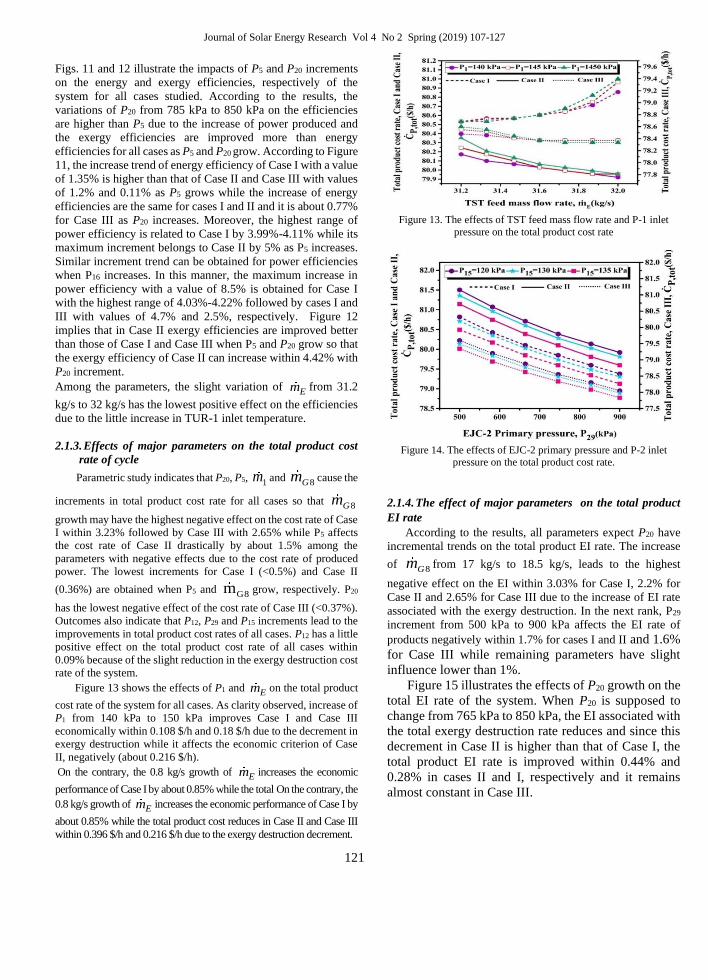
Figure 8 implies the effects of solar irradiation on the total EI
rate of the system for all cases. According to the results, the
increase of solar irradiation from January to June affects the total
EI of the system, negatively due to increases of TURs product EI
rates. In this case, the total EI
Figure 7. The effects of solar radiation on the cost per exergy unit of LNG for all cases
rate of the system increases within 1.9% for Case I, 1.8% for Case II and 2.08% for Case III. The reduction of solar irradiation from June to December reduces the total EI rate of the system by about 1.9% for Case I, 1.7% for Case II and 2.04% for Case III. Although the EI rate of Case II is higher than that of Case I, the EI per exergy unit of LNG in Case II is lower than that of Case I within 0.01 Pts/GJ while it is almost the same in Case I and III. As can be seen, Moreover, the solar irradiation does not have a drastic influence on the EI per exergy unit of LNG for all cases.
Figure 8. The effects of solar radiation on the product EI rate
of all cases
2.1.2. Effects of major parameters on the annual energy and
exergy efficiencies
Sensitivity analysis shows that P1, P15, P12, P29 affect the
efficiencies of all cases, negatively and the increase of P29
from 500 kPa to 900 kPa has the maximum reduction effects
so that energy and exergy efficiencies of system may reduce
within 7.34% and 11.7% for Case I, about 6.4% and 12.3%
for Case II and 6.98% and 8.96% for Case III, respectively.
These decrements are due the decrease of TUR-2 power
output caused by the EJC-2 primary pressure increment. The
thermodynamic performances of the system in Case I and
Case III depend on P1 variation, as P1 increases from 120 kPa
to 250 kPa, the energy and exergy efficiencies lessen slightly
within 2.3% and 3.67% for Case I and 3.1% and 4.12% for
Case III, respectively while the efficiencies of the system for
Case II are not affected by the increase of P1. The negative
influence of P15 on efficiencies of the system for cases I and
II are lower than 2% while the energy and exergy of Case III
reduce 3.95% and 5.28%, respectively. Moreover, P12 with
the lowest decrements on efficiencies (lower than 1%) is in
the last ranking.
The remaining parameters affect the efficiencies, positively.
Figs. 9 and 10 show the effects of 1m and 8Gm on the
efficiencies of the system for all cases. According to the
results, the increase of 1m from 10 kg/s
to 12 kg/s rises the power produced by HT ORC loop for all
cases. Therefore, the energy efficiency increases for all cases.
Case I gives the maximum range of 3.95%-4.11% followed
by cases III and II, respectively with ranges of 3.1%-3.22%
and 2.97%-3.08%, respectively. Moreover, the energy
efficiencies of the system increase respectively

Journal of Solar Energy Research Vol 4 No 2 Spring (2019) 107-127
119

Journal of Solar Energy Research Vol 4 No 2 Spring (2019) 107-127
120
about 1.76%, 1% and 1.66% for Cases I, II and III, respectively as
shown in Figure 9 and according to Figure 10, their exergy
efficiencies increase within 2.86%, 1.94% and 2.88%, respectively.
A 1.5 kg/s increment of 8Gm affects the efficiencies positively due
to the exergy destruction reduction. The highest increment of energy
efficiency is related to Case I with value of 3% while the
maximum exergy efficiency belongs to Case III by 2.17%. The
power efficiency of the cases does not affected by variation of this
parameter.
Figure 9. The effects of HT ORC mass flow rate on the annual energy
efficiencies
Figure 11. The effects of TURs-1 and 2 inlet pressures on the annual
energy efficiencies
Figure 12. The effects of TURs-1 and 2 inlet pressures on the annual
exergy efficiencies Figure 10. The effects of HT ORC and LNG extraction mass
flow rates on the annual exergy efficiencies
Journal of Solar Energy Research Vol 4 No 2 Spring (2019) 107-127
121
Figs. 11 and 12 illustrate the impacts of P5 and P20 increments
on the energy and exergy efficiencies, respectively of the
system for all cases studied. According to the results, the
variations of P20 from 785 kPa to 850 kPa on the efficiencies
are higher than P5 due to the increase of power produced and
the exergy efficiencies are improved more than energy
efficiencies for all cases as P5 and P20 grow. According to Figure
11, the increase trend of energy efficiency of Case I with a value
of 1.35% is higher than that of Case II and Case III with values
of 1.2% and 0.11% as P5 grows while the increase of energy
efficiencies are the same for cases I and II and it is about 0.77%
for Case III as P20 increases. Moreover, the highest range of
power efficiency is related to Case I by 3.99%-4.11% while its
maximum increment belongs to Case II by 5% as P5 increases.
Similar increment trend can be obtained for power efficiencies
when P16 increases. In this manner, the maximum increase in
power efficiency with a value of 8.5% is obtained for Case I
with the highest range of 4.03%-4.22% followed by cases I and
III with values of 4.7% and 2.5%, respectively. Figure 12
implies that in Case II exergy efficiencies are improved better
than those of Case I and Case III when P5 and P20 grow so that
the exergy efficiency of Case II can increase within 4.42% with
P20 increment.
Among the parameters, the slight variation of Em from 31.2
kg/s to 32 kg/s has the lowest positive effect on the efficiencies
due to the little increase in TUR-1 inlet temperature.
2.1.3. Effects of major parameters on the total product cost
rate of cycle
Parametric study indicates that P20, P5, 1m and 8Gm cause the
increments in total product cost rate for all cases so that 8Gm
growth may have the highest negative effect on the cost rate of Case
I within 3.23% followed by Case III with 2.65% while P5 affects
the cost rate of Case II drastically by about 1.5% among the
parameters with negative effects due to the cost rate of produced
power. The lowest increments for Case I (<0.5%) and Case II
(0.36%) are obtained when P5 and G8m grow, respectively. P20
has the lowest negative effect of the cost rate of Case III (<0.37%).
Outcomes also indicate that P12, P29 and P15 increments lead to the
improvements in total product cost rates of all cases. P12 has a little
positive effect on the total product cost rate of all cases within
0.09% because of the slight reduction in the exergy destruction cost
rate of the system.
Figure 13 shows the effects of P1 and Em on the total product
cost rate of the system for all cases. As clarity observed, increase of
P1 from 140 kPa to 150 kPa improves Case I and Case III
economically within 0.108 $/h and 0.18 $/h due to the decrement in
exergy destruction while it affects the economic criterion of Case
II, negatively (about 0.216 $/h).
On the contrary, the 0.8 kg/s growth of Em increases the economic
performance of Case I by about 0.85% while the total On the contrary, the
0.8 kg/s growth of Em increases the economic performance of Case I by
about 0.85% while the total product cost reduces in Case II and Case III
within 0.396 $/h and 0.216 $/h due to the exergy destruction decrement.
Figure 13. The effects of TST feed mass flow rate and P-1 inlet
pressure on the total product cost rate
Figure 14. The effects of EJC-2 primary pressure and P-2 inlet
pressure on the total product cost rate.
2.1.4. The effect of major parameters on the total product
EI rate
According to the results, all parameters expect P20 have
incremental trends on the total product EI rate. The increase
of 8Gm from 17 kg/s to 18.5 kg/s, leads to the highest
negative effect on the EI within 3.03% for Case I, 2.2% for
Case II and 2.65% for Case III due to the increase of EI rate
associated with the exergy destruction. In the next rank, P29
increment from 500 kPa to 900 kPa affects the EI rate of
products negatively within 1.7% for cases I and II and 1.6%
for Case III while remaining parameters have slight
influence lower than 1%.
Figure 15 illustrates the effects of P20 growth on the
total EI rate of the system. When P20 is supposed to
change from 765 kPa to 850 kPa, the EI associated with
the total exergy destruction rate reduces and since this
decrement in Case II is higher than that of Case I, the
total product EI rate is improved within 0.44% and
0.28% in cases II and I, respectively and it remains
almost constant in Case III.

Journal of Solar Energy Research Vol 4 No 2 Spring (2019) 107-127
122
Figure 15. The effects of TUR-2 inlet pressure on the total product
EI rate
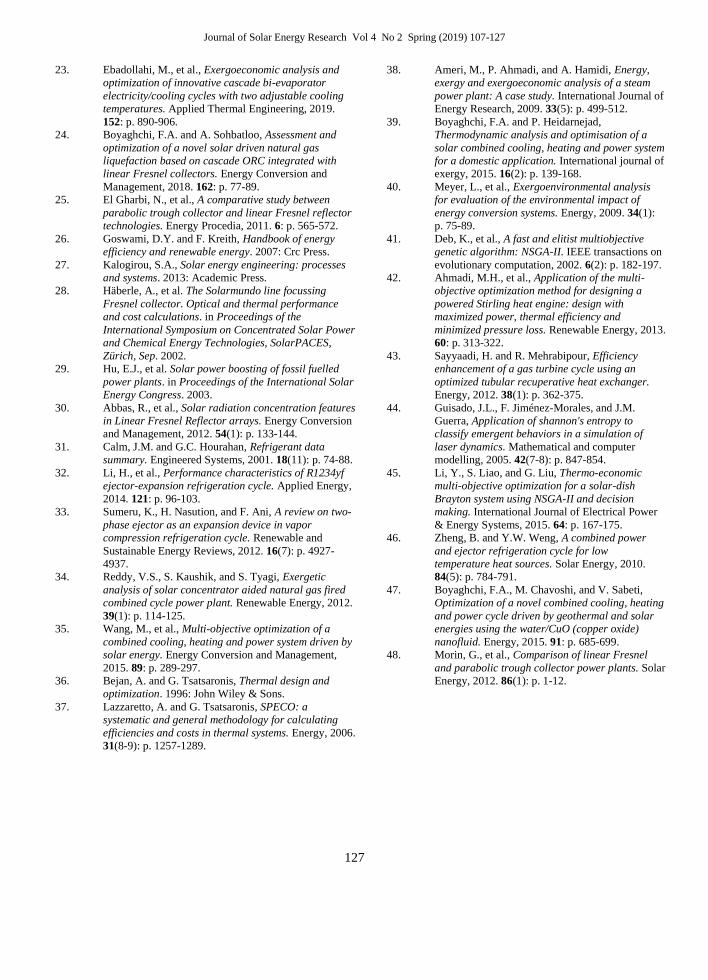
Optimization results
Figure 16 indicates the 3D Pareto frontier obtained
from NSGA-II algorithm and the final optimum
solutions identified by LINMAP, TOPSIS and Shannon
Entropy decision makers for objectives of cases I and II.
The corresponding specified options of Figure 16 are
tabulated in Tables 10 and 11.
To identify the reasonable status of different answers
obtained through the decision makers, the deviation
index (DI) of each answer from the ideal one is
calculated using Eq. (43) [45].
( )
( ) ( )
24
1
2 24 4
1 1
=
= =
−=
− + −
ideali ii
ideal nadiri i i ii i
F FDI
F F F F
(43)
Here, iF is the ith objective function. The superscripts
“ideal” and “nadir” refer to the single objective
optimization for ideal and non-ideal cases, respectively.
According to Tables 11 and 12, the lowest DI with
values of 0.1318 and 0.2032 for Case I and Case II,
respectively, are related to the LINMAP procedure
indicating the highest reliability for the final optimum
solutions. In this manner, the maximum improvements
in total product cost and EI rates for Case I are calculated
within 1.2% and 1.05%, respectively as compared with the
base point. For this configuration, the maximum improvements for energy and exergy efficiencies are obtained
within 7.37% and 12.63, respectively through Shannon
Entropy solution which leads to the lowest reliability.
Based upon this, P12 and Em with values of 120.1 kPa,
408.5 kPa, 17.56 kPa and 31.53 kg/s, respectively in
comparison with other methods are required.
In Case II, although the reliable solution belongs to
the LINMAP decision making, the highest
improvements of objective functions is only related to
the total product cost rate with a value of 2.2%. In this
regard, lower P20, P15, P5 and P1 with values of 488.6
kPa, 70 kPa, 2031 kPa and 120 kPa, respectively are
needed.
For this configuration, the lowest total product EI rate
with value of 94.068 (Pts/h) is achieved using Shannon
Entropy procedure and the best energy and exergy
efficiencies with the maximum increments of 11.67%
and 24.02%, respectively are obtained through TOPSIS
decision maker.
Table 13 shows the specified options of the system for
both configurations. Comparing the results at optimum
solutions shows that the power produced in Case I
increases within 20.45% leading to the maximum power
efficiency of 4.95% through LINMAP procedure while
it increases by about 47.31% though TOPSIS for Case
II. Although the produced power in Case II is lower than
that of Case I about 129.6 kW, the twice mass flow rate
of LNG makes it more effective. Moreover, at optimum
conditions, the total product cost rate of Case II is
worsened so that the maximum increment may be
obtained within 2.5% through TOPSIS decision making.
As is clear, the values of cost and EI per exergy
unit of LNG at the base point for Case II are improved
within 0.7% and 0.23%, respectively. According to
the results, the highest decrements in the cost and EI
per exergy unit of LNG for Case II are obtained using
Shannon Entropy and LINMAP methods by about
0.014 $/GJ and 0.033 Pts/GJ in relation to the base
case.
Journal of Solar Energy Research Vol 4 No 2 Spring (2019) 107-127
123
a) Exergy efficiency and total product cost and EI rates
c) Total product cost rate and efficiencies
b) Energy efficiency and total product cost and EI rates
d) Total product EI rate and efficiencies
4. Conclusion:
A solar driven CCP based on CORC with three
configurations of ERL is studied using thermodynamic,
economic and EI analyses in the present work. The
performances of the system are evaluated during a year
and the impacts of design parameters are conducted on
the annual performances of the system for various cases.
Finally, the optimum operations of systems are found
using NSGA-II and three decision makings. The major
results are written here as follows:
• The highest improvement in product cost rate occurs
in Case III within 2.448 $/s in relation to Case I.
• The amount of LNG produced in Case II gets 2 times
in comparison with cases I and III leading to
improvements in energy efficiency, exergy
efficiency and economic performance of the system
by about 43.2%, 8.23% and 1.1%, respectively.
• Case II leads to the minimum cost and EI per exergy
unit of LNG within 0.03 $/GJ and 17 mPts/GJ,
respectively and Case III gives the maximum total
cost rate of 78.372 $/h.
• The increase of LNG mass flow rate extraction has
the highest positive effect on the energy efficiency of
Case I within 3%.
• The TUR-2 inlet pressure growth has the substantial
influence on the exergy efficiency of Case II by about
4.42%.
• The total product cost rates of system are improved
by about 1.78%, 1.94% and 1.96% respectively for
Case I, Case II and Case III as the EJC-2 primary
pressure increases.
LINMAP decision making causes the maximum
reduction in total product cost rates within 1.2% and
2.2%, respectively and improves the EI rates of cases
I and II respectively up to 16 mPts/GJ and 7 mPts/GJ,
respectively.

Journal of Solar Energy Research Vol 4 No 2 Spring (2019) 107-127
124

Journal of Solar Energy Research Vol 4 No 2 Spring (2019) 107-127
125
Appendix A. The cost functions of main components
of the system components are as follows:
Table A1. Equipment cost functions
Component Cost function Reference
TURs ( ) ( )0 75 0 95
4750 60= +. .
TUR TUR TURZ W W [47]
TST ( )0 4 1380= TST TSTZ . V [47]
Ps ( )0 41
3500=.
P PZ W [47]
CONs ( )0 8
150=.
CON CONZ A [47]
HEx ( )0 78
130 0 093=.
HE HEZ A . [47]
EVPs ( )0 88
276=.
EVA EVAZ A [47]
LFC 200= LFC apZ A [48]
Nomenclature:
A area, m2
B environmental impact rate associated with an exergy
stream, Pt/s
b specific environmental impact per unit of exergy,
Pts/J
C concentration ratio
C cost rate of exergy stream, $/s
c cost per unit of exergy, $/J
Cp specific heat of fluid, kJ/kg.K
D diameter, m
Ex total exergy rate, kW
ex specific exergy, kJ/kg
fb exergoenvironmental factor
fc exergoeconomic factor
Gb beam radiation falling on the horizontal surface,
W/m2
h specific enthalpy, kJ/kg
IR interest rate, %
m mass of fluid flow rate, kg/s
N system life, year
P pressure, kPa
Q heat transfer rate, kW
r shading factor
rb relative environmental impact difference
rc relative cost difference
s specific entropy, kJ/kg .K
S absorbed solar heat, W/m2
t time, s
T temperature, K
U overall heat transfer coefficient, W/m2.K
V velocity, m/s
w mirror width, m
W power rate, W
x quality
The capital investment cost functions
Z cost rate associated with investment expenditures,
$/s
Abbreviation
CHE cascade heat exchanger
CON condenser
CORC cascade organic Rankine cycle
CRF capital recovery factor
EI environmental impact
EJC ejector
ERL ejector refrigeration loop
EVP evaporator
HHE high temperature heat exchanger
LFC linear Fresnel solar collector
LHE low temperature heat exchanger
LNG liquefied natural gas
NG natural gas
ORC organic Rankine cycle
P pump
PRC precooler
REG regenerator
TST thermal storage tank
TUR turbine
TV throttling valve
Subscript
0 dead state
air air
ap aperture
D destruction
d diffuser
En energy
Ex exergy
F fuel
g glass cover
i inner
in input
inlet inlet
is isentropic
k kth component
L loss
load load
mn motive nozzle
ms mixing section
net net
oil Therminol-PV1
outlet outlet
P product
q heat transfer
r receiver
sn suction nozzle
u useful
w power
Superscript
ch chemical
M mechanical

Journal of Solar Energy Research Vol 4 No 2 Spring (2019) 107-127
126
Y component-related environmental impact rate, Pt/s
Z cost associated with investment expenditures, $
ph physical
T thermal
tot total
Greek letter
α absorptivity
γ refelectivity
ε emissivity of the surface
ρ density, kg/m3
σ Stefan–Boltzman constant, W/m2.K4
τ transitivity
η efficiency, %
tilt angle, o
maintenance factor
entrainment ratio
References: 1. Al-Sulaiman, F.A., I. Dincer, and F. Hamdullahpur,
Exergy modeling of a new solar driven trigeneration
system. Solar Energy, 2011. 85(9): p. 2228-2243.
2. Wang, E., et al., Performance analysis of a novel system
combining a dual loop organic Rankine cycle (ORC)
with a gasoline engine. Energy, 2012. 43(1): p. 385-
395.
3. Choi, B.C. and Y.M. Kim, Thermodynamic analysis of
a dual loop heat recovery system with trilateral cycle
applied to exhaust gases of internal combustion engine
for propulsion of the 6800 TEU container ship. Energy,
2013. 58: p. 404-416.
4. Shu, G., et al., Performance comparison and working
fluid analysis of subcritical and transcritical dual-loop
organic Rankine cycle (DORC) used in engine waste
heat recovery. Energy conversion and management,
2013. 74: p. 35-43.
5. Zhang, H., E. Wang, and B. Fan, A performance
analysis of a novel system of a dual loop bottoming
organic Rankine cycle (ORC) with a light-duty diesel
engine. Applied energy, 2013. 102: p. 1504-1513.
6. Wang, E., et al., Parametric analysis of a dual-loop
ORC system for waste heat recovery of a diesel engine.
Applied Thermal Engineering, 2014. 67(1): p. 168-178.
7. Yang, F., et al., Performance analysis of waste heat
recovery with a dual loop organic Rankine cycle (ORC)
system for diesel engine under various operating
conditions. Energy Conversion and Management, 2014.
80: p. 243-255.
8. Pouraghaie, M., et al., Thermodynamic performance
optimization of a combined power/cooling cycle. Energy
Conversion and Management, 2010. 51(1): p. 204-211.
9. Jiang, L., et al., Investigation on cascading
cogeneration system of ORC (Organic Rankine Cycle)
and CaCl2/BaCl2 two-stage adsorption freezer. Energy,
2014. 71: p. 377-387.
10. Wang, L., A.P. Roskilly, and R. Wang, Solar powered
cascading cogeneration cycle with ORC
and adsorption technology for electricity and refrigeration.
Heat Transfer Engineering, 2014. 35(11-12): p.
1028-1034.
11. Al-Mousawi, F.N., R. Al-Dadah, and S. Mahmoud,
Integrated adsorption-ORC system: Comparative study
of four scenarios to generate cooling and power
simultaneously. Applied Thermal Engineering, 2017.
114: p. 1038-1052
12. Sarkar, J., Ejector enhanced vapor compression
refrigeration and heat pump systems—A review.
Renewable and Sustainable Energy Reviews, 2012. 16(9):
p. 6647-6659.
13. Kornhauser, A.A., The use of an ejector as a refrigerant
expander. 1990.
14. Harrell, G.S. and A.A. Kornhauser, Performance tests of
a two phase ejector. 1995, American Society of
Mechanical Engineers, New York, NY (United States).
15. Disawas, S. and S. Wongwises, Experimental
investigation on the performance of the refrigeration
cycle using a two-phase ejector as an expansion device.
International Journal of Refrigeration, 2004. 27(6): p.
587-594.
16. Wongwises, S. and S. Disawas, Performance of the two-
phase ejector expansion refrigeration cycle. International
journal of heat and mass transfer, 2005. 48(19): p. 4282-
4286.
17. Wang, J., Y. Dai, and Z. Sun, A theoretical study on a
novel combined power and ejector refrigeration cycle.
International Journal of Refrigeration, 2009. 32(6): p.
1186-1194.
18. Habibzadeh, A., M. Rashidi, and N. Galanis, Analysis of a
combined power and ejector-refrigeration cycle using low
temperature heat. Energy Conversion and Management,
2013. 65: p. 381-391.
19. Zheng, B. and Y. Weng, A combined power and ejector
refrigeration cycle for low temperature heat sources.
Solar Energy, 2010. 84(5): p. 784-791.
20. Ahmadzadeh, A., M.R. Salimpour, and A. Sedaghat,
Thermal and exergoeconomic analysis of a novel solar
driven combined power and ejector refrigeration (CPER)
system. International Journal of Refrigeration, 2017. 83: p.
143-156.
21. Rostamzadeh, H., et al., Energy and Exergy Analysis of
Novel Combined Cooling and Power (CCP) Cycles.
Applied Thermal Engineering, 2017
22. Rostamzadeh, H., et al., Exergoeconomic optimisation of
basic and regenerative triple-evaporator combined power
and refrigeration cycles. International Journal of Exergy,
2018. 26(1-2): p. 186-225.
Journal of Solar Energy Research Vol 4 No 2 Spring (2019) 107-127
127
23. Ebadollahi, M., et al., Exergoeconomic analysis and
optimization of innovative cascade bi-evaporator
electricity/cooling cycles with two adjustable cooling
temperatures. Applied Thermal Engineering, 2019.
152: p. 890-906.
24. Boyaghchi, F.A. and A. Sohbatloo, Assessment and
optimization of a novel solar driven natural gas
liquefaction based on cascade ORC integrated with
linear Fresnel collectors. Energy Conversion and
Management, 2018. 162: p. 77-89.
25. El Gharbi, N., et al., A comparative study between
parabolic trough collector and linear Fresnel reflector
technologies. Energy Procedia, 2011. 6: p. 565-572.
26. Goswami, D.Y. and F. Kreith, Handbook of energy
efficiency and renewable energy. 2007: Crc Press.
27. Kalogirou, S.A., Solar energy engineering: processes
and systems. 2013: Academic Press.
28. Häberle, A., et al. The Solarmundo line focussing
Fresnel collector. Optical and thermal performance
and cost calculations. in Proceedings of the
International Symposium on Concentrated Solar Power
and Chemical Energy Technologies, SolarPACES,
Zürich, Sep. 2002.
29. Hu, E.J., et al. Solar power boosting of fossil fuelled
power plants. in Proceedings of the International Solar
Energy Congress. 2003.
30. Abbas, R., et al., Solar radiation concentration features
in Linear Fresnel Reflector arrays. Energy Conversion
and Management, 2012. 54(1): p. 133-144.
31. Calm, J.M. and G.C. Hourahan, Refrigerant data
summary. Engineered Systems, 2001. 18(11): p. 74-88.
32. Li, H., et al., Performance characteristics of R1234yf
ejector-expansion refrigeration cycle. Applied Energy,
2014. 121: p. 96-103.
33. Sumeru, K., H. Nasution, and F. Ani, A review on two-
phase ejector as an expansion device in vapor
compression refrigeration cycle. Renewable and
Sustainable Energy Reviews, 2012. 16(7): p. 4927-
4937.
34. Reddy, V.S., S. Kaushik, and S. Tyagi, Exergetic
analysis of solar concentrator aided natural gas fired
combined cycle power plant. Renewable Energy, 2012.
39(1): p. 114-125.
35. Wang, M., et al., Multi-objective optimization of a
combined cooling, heating and power system driven by
solar energy. Energy Conversion and Management,
2015. 89: p. 289-297.
36. Bejan, A. and G. Tsatsaronis, Thermal design and
optimization. 1996: John Wiley & Sons.
37. Lazzaretto, A. and G. Tsatsaronis, SPECO: a
systematic and general methodology for calculating
efficiencies and costs in thermal systems. Energy, 2006.
31(8-9): p. 1257-1289.
38. Ameri, M., P. Ahmadi, and A. Hamidi, Energy,
exergy and exergoeconomic analysis of a steam
power plant: A case study. International Journal of
Energy Research, 2009. 33(5): p. 499-512.
39. Boyaghchi, F.A. and P. Heidarnejad,
Thermodynamic analysis and optimisation of a
solar combined cooling, heating and power system
for a domestic application. International journal of
exergy, 2015. 16(2): p. 139-168.
40. Meyer, L., et al., Exergoenvironmental analysis
for evaluation of the environmental impact of
energy conversion systems. Energy, 2009. 34(1):
p. 75-89.
41. Deb, K., et al., A fast and elitist multiobjective
genetic algorithm: NSGA-II. IEEE transactions on
evolutionary computation, 2002. 6(2): p. 182-197.
42. Ahmadi, M.H., et al., Application of the multi-
objective optimization method for designing a
powered Stirling heat engine: design with
maximized power, thermal efficiency and
minimized pressure loss. Renewable Energy, 2013.
60: p. 313-322.
43. Sayyaadi, H. and R. Mehrabipour, Efficiency
enhancement of a gas turbine cycle using an
optimized tubular recuperative heat exchanger.
Energy, 2012. 38(1): p. 362-375.
44. Guisado, J.L., F. Jiménez-Morales, and J.M.
Guerra, Application of shannon's entropy to
classify emergent behaviors in a simulation of
laser dynamics. Mathematical and computer
modelling, 2005. 42(7-8): p. 847-854.
45. Li, Y., S. Liao, and G. Liu, Thermo-economic
multi-objective optimization for a solar-dish
Brayton system using NSGA-II and decision
making. International Journal of Electrical Power
& Energy Systems, 2015. 64: p. 167-175.
46. Zheng, B. and Y.W. Weng, A combined power
and ejector refrigeration cycle for low
temperature heat sources. Solar Energy, 2010.
84(5): p. 784-791.
47. Boyaghchi, F.A., M. Chavoshi, and V. Sabeti,
Optimization of a novel combined cooling, heating
and power cycle driven by geothermal and solar
energies using the water/CuO (copper oxide)
nanofluid. Energy, 2015. 91: p. 685-699.
48. Morin, G., et al., Comparison of linear Fresnel
and parabolic trough collector power plants. Solar
Energy, 2012. 86(1): p. 1-12.
Recommended