INTERNATIONAL JOURNAL OF CIVIL AND STRUCTURAL ENGINEERING
Volume 3, No 2, 2012
© Copyright 2010 All rights reserved Integrated Publishing services
Research article ISSN 0976 – 4399
Received on September 2012 Published on November 2012 367
Comparative large deformations studies on circular tubes Ram Ranjan Sahu
1, Pramod Gupta
2
1- PhD scholar, Civil Engineering Department, IIT Roorkee, India and Assistant General
Manager in Engineering Research Centre of TATA Motors-Pune, through Tata Technologies,
Pune, India
2- Associate Professor, Civil Engineering Department, IIT Roorkee, India (PhD guide of “1”)
doi:10.6088/ijcser.201203013035
ABSTRACT
This paper describes the large deformation phenomenon and compares the plastic energy
absorption of tubes, for the different phenomenon. Experiments were conducted on circular
aluminum tubes having typical external diameter of 25.5 mm and thickness 2 mm. Generally
the tube lengths were 100mm. Also 50mm lengths were chosen to see the length effect on the
deformation phenomenon. Numerical analysis was performed to simulate the different
phenomenon. A good agreement was observed between experimental data and numerical
simulation. The force-stroke curves of different deformation modes are discussed in detail.
Various characteristics associated with large deformation are explored and discussed. Based
on these experimental studies, best energy absorption phenomenon is found.
Keywords: Large deformations, fixtures, energy absorption, plastic deformation, force-stroke
1. Introduction
Energy absorbing devices are employed in vehicles to reduce the potential danger of impact
accidents. Large deformation associated with energy absorption of shell structures of
common shapes includes circular tubes, square tubes, frusta, cones, honeycombs, and
sandwich plates etc. Common modes of deformation are inversion, axial crushing, curling,
tearing, lateral indentation, tube flattening, buckling, tube expansion and contraction etc.
Circular tubes had been of great interest for researcher for its good energy absorption
characteristics. Alghamadi have given an overview on energy absorption by the tubes in 2001.
Nia and Hamedani, 2010 studied the axial crushing on various section shapes including
circular shapes. They found that the energy absorbed per unit mass is maximum for circular
tube. The common modes of deformation such as lateral and axial compression, indentation
and inversion were reviewed for metallic tubes by A.G. Olabi et al., 2007. Their advantage
and disadvantage were discussed.
Lateral compression of a tube is studied in details by Reid and Reddy, 1978-79 and they
presented a series of paper in this. A study of the crushing of tubes by two indenters was done
by G. Lu et al., in 1993. They observed that the force increases with displacement in a
nonlinear fashion. They also observed that the force increases with the length of the tube and
for short tubes, there exists a sort of collapse load corresponding to a sudden change of slope.
But for long ones, it is difficult to locate the collapse load on the curve. Tube inversion under
axial loading was studied by Al-Hassani et al., in 1972. They found that the splitting mode is
a special case of tube inversion where the die radius is large enough to cause splitting instead
of inversion. In 1972, Ezra and Fay identified the combined modes of axial splitting and
subsequent curling of the split ends of the tubes as an efficient means of energy dissipation in

Comparative large deformations studies on circular tubes
Ram Ranjan Sahu, Pramod Gupta
International Journal of Civil and Structural Engineering
Volume 3 Issue 2 2012
368
the absorber. The absorbed energy is dissipated in tearing of the metal of the tube into strips.
Axisymmetric collapse mode for the tubes had been studied by Alexander in 1960. Guillow
et al., 2001 did detailed experimental analysis for axial compression for thin walled circular
tubes. Jialing Yang et al., 2010 studied the energy absorption of expansion tubes under axial
compression by a conical–cylindrical die. Based on their experimental and numerical results,
characteristics of driving force (F)–stroke (H) curves in different deformation modes were
discussed in detail. Effects of tube dimensions and semi-angle of the die on steady-state force
and energy absorption efficiency are also presented.
In this paper, the aluminum tubes of 100mm length as base length is chosen for experiment.
The thickness for all the tubes is 2mm. Different fixtures were made to execute the different
large deformations phenomenon on the tube. The affected length (L) is measured for each
tube undergoing large deformations. The deformations of different phenomenon are plotted in
terms of force displacement graphs experimentally and numerically. The energy absorption
per unit mass is extracted from these graphs and compared. The deformations
phenomenoncould be decided based on this experiment for better energy absorption.
2. Experiments
2.1 Experimental setup
The experimental setup for this study has three main components i.e. system to apply
compression force to the model through fixture, model and fixtures. The Instron system
having maximum capacity up to 4 ton was used for applying force and recording F-H graphs.
In the system, the load cell is kept below the top stud. Top stud is fixed in place. The bottom
ram of system moves up and down with maximum ram stroke up to +/- 125 mm. The system
is hydraulically operated and can operate at quasi static and at transient load conditions.
During the experiment, the ram on which bottom fixture is kept, was moved up, in speed of
10mm/min to ensure the quasi static condition. The alignment of test tube and its fixture is
assured with machine axis. The test setup is shown in Figure 1. Aluminum tubes of 25.5 mm
outer diameter (Do) and thicknesses (T) of 2mm were machined from commercially available
tubes in the length of 100mm and 50mm. Samples are shown in Figure 2.
Figure 1: Test setup
Sample
Bottom fixture
Top fixture
Load cell
Ram

Comparative large deformations studies on circular tubes
Ram Ranjan Sahu, Pramod Gupta
International Journal of Civil and Structural Engineering
Volume 3 Issue 2 2012
369
Figure 2: Test samples
Variations in length were kept to study its effect on few deformation phenomenons. The
fixture has top and bottom parts. Top fixture is attached to load cell stud of Instron system. It
can be flat plate, simple pushing rod for inversion or notched vertical plate etc. This fixture is
stationary and butt against the model and restraint test sample for upward movement.
Similarly the bottom fixture could be flat plate, conical entry fixture, Conical tip expansion
fixture, angles and geometrical shaped fixture for curl in, various curvature curl out and tear
fixture etc as per the deformation phenomenon. These fixtures are fixed to moving ram of the
system, through which upward force is applied. These fixtures are made of steel material and
can be treated as rigid. To reduce the friction between tubes and fixture, say for tube
expansion, contraction and curl in, and curl out experiments etc, Kluber Isoflex NBU15
grease was used. The testing was done to maximum displacement to get the large
deformation phenomenon fully developed.
2.1 Material properties
The tubes were made by machining in workshop, by commercially available aluminum tubes.
The tensile testing was done on test pieces, prepared from the tubes, to the specifications of
ASTM. From the test, the yield strength obtained was 157.92MPa, while tensile strength was
182MPa at 7% elongation. The fixture were made of steel, having 0.2% proof stress of 800
MPa, and an elastic modulus, E, of 210 GPa, which is much greater than that of the tubes.
Hence the fixture can be regarded as rigid.
3. Experimental results
The experimental photographs are shown in Figure 3. In these Figures the left to right
columns illustrates the phenomenon, fixture, samples during and after the loadings. It is
emphasized here that the experiments were conducted keeping in mind that it should fulfill to
generate the deformation phenomenon first, continue the phenomenon by increasing the
stroke till any other phenomenon like buckling, tearing etc is not observed. Stop the stroke
once the other phenomenon is observed other than the intended one. Hence we suppose that
1. Large deformation phenomenon is generated fully in experiments
2. The specific energy is calculated with experimental data, for the distance of the tube
undergone the phenomenon.
The large deformation graph can be divided broadly into three stages as illustrated below

Comparative large deformations studies on circular tubes
Ram Ranjan Sahu, Pramod Gupta
International Journal of Civil and Structural Engineering
Volume 3 Issue 2 2012
370
1. Initiation stage- This is the stage where deformation process starts. In this stage the
stiffness of tube play important role. The applied force has to overcome this stiffness
to march further. This stage can be smooth or perturbed in nature. Except contraction
and expansion, other phenomenon has smooth starts.
2. Transition stage- This is the stage where the nature of contact between fixture and
tube may change or tube specific deformation characteristics starts like tearing,
buckling etc.
3. Stabilization- In this stage the process is fully stabilized. Graph nature is also smooth.
The experimental observations are discussed as follows.
S: single, TIT: tube inside tube, P: parallel, G: geometry, A: angle, SSP: single side parallel,
SS: single side
Figure 3: Fixtures and samples during and after loading for different large deformations
Refer Figure 3 for experimental photographs and Figure 4 for typical F-H graphs for large
deformations phenomenon, subsequently discussed. The photographs and graphs are covered
under “a” to “r” sub category.
3.1 Bending

Comparative large deformations studies on circular tubes
Ram Ranjan Sahu, Pramod Gupta
International Journal of Civil and Structural Engineering
Volume 3 Issue 2 2012
371
The bending takes place with increasing load constantly till it buckle at load application point.
After that the load decreases constantly. The top and bottom fixture were of 5mm width. The
support length to sample was kept 100mm. The bend zone is formed by compression of top
notched fixture, followed by bending. The zone is widened to 38mm at the middle and
bending effected length in both the side is 25mm approximately. Also scoring marks of 7mm
length in each side were noticed on tube at support location. It means, tube had slide freely by
14mm while bending process.
Refer Figure 4a for typical F-H graph of this phenomenon.
3.2 Contraction
In the process of contraction, tube reaches to the end of conical entry (10 degree) portion of
fixture, after which transition takes place to the straight portion (dia~22mm). The contact
state changes in this transition. Once tube crosses this stage, tube is stabilized in deformation
phenomenon. Perturbation is noticed in initiation stage as marked in Figure4 b. Afterwards
also repeated ripples are noticed in data due disturbance into hydraulic system of the
instrument.
3.3 Buckling
When tube of 100mm length was compressed between two flat plates, they performed the
Euler (global) bending mode to the progressive buckling. The force increased steadily till the
bending starts. Afterwards it diminishes fast as collapse mechanics is set as shown in Figure
4 c. The buckling usually started at 1/3 location from the top.
3.4 Crushing
The smaller tube of length 50mm when pressed between two platens, it starts folding from
top and bottom and ultimately making folds at 90 degree towards inside. The respective F-H
graph is shown in Figure 4 d, wherein after 1st peak, few smaller peaks can be noted which
are generated while making folds.
3.5 Expansion
The expansion is done with the solid fixture having 10 degree conical angle at the tip, with
straight cylindrical portion (dia~24 mm). The expansion is started with initial perturbation as
marked in respective F-H graph in Figure 4 e, until it does not cross the junction of conical
and straight portion of the fixture.
3.6 Flattening
Flattening experiment is done on tube in single (Figure 4 f), tube inside tube (Figure 4 g) and
tubes kept in parallel (Figure 4 h). The deformation graph rises initially to overcome the
circumferential bending strength of tube and with further displacement, it starts yielding from
two sides and as well from top and bottom, shaping into Figure ∞. Once the top and bottom
portion start touching each other, forces rises. If a tube is kept inside the tube, the F-H graph
has step at the point where outer tube touches the inner tube and the bending strength of inner
tube is also start count for resistance. Refer Figure 4 g wherein step is encircled. It is also
observed that the force required in parallel tubes arrangement is double of single tube as
shown in Figure 4 h, and hence result of one tube can be linearly extrapolated for more
Comparative large deformations studies on circular tubes
Ram Ranjan Sahu, Pramod Gupta
International Journal of Civil and Structural Engineering
Volume 3 Issue 2 2012
372
numbers of tubes.
3.7 Curl inside (Geometry)
The geometrical fixture is shown in Figure 3 i, which is made with the groove with central
guide to facilitate curling inside. Groove internal diameter is kept 26.5 mm, so that the tube
of 25.5 mm outer diameter could glide inside the groove. In this process the force rises
constantly with steep angle to overcome tube circumferential bending strength, initially.
Further displacement lead to an incubation stage where tube adjust itself to glide into outer
curvature of the fixture geometry. Further force causes it to glide towards inside and adopt
the inner curvature which causes rise in the force again as shown in F-H graph in Figure 4 i.
This phenomenon offers a good energy absorption in the process.
3.8 Curl inside (Angle)
This is another means to curl in the tubes. Refer Figure 3 j for angled fixture whose angle at
the centre is maintained to 127 degree. The central depth is kept 12mm. It offers initially
high force as shown in Figure 4 j. This force is greater for short tube as compare to long tube.
Force then drop once circumferential bending strength is overcome and again increases as
material from upper portion are forced towards tip and folds are made subsequently. This also
offers a great energy absorption capability.
3.9 Inversion
To prepare the tube for this experiment, tips were folded progressively at one end by hand
beating. A solid rod plunger with screw end arrangement was used with top & bottom washer,
to push the tube inside as shown in Figure 3 k. The phenomenon could be initiated and
stabilized by pushing tube inside by 10mm. After 10mm stroke, tearing in the tube was
noticed. The F-H graph is shown in Figure 4 k for this phenomenon.
3.10 Curl out
This deformation takes place in smoother way as tube glides through small radius curvature
(6mm radius) of the fixture shown in Figure 3 l. The force steadily rises as shown in its graph
in Figure 4 l, for flaring followed by fold inside.
3.11 Tearing
Tearing is a case of curl out which takes place in larger radius curvature (radius 10mm). Due
to this large radius, the tearing takes place. Once tearing start, the graph falls rapidly as
shown in Figure 4 m.
3.12 Indenting
Indenting is another phenomenon for energy absorption. Experiments were carried out on
single shorter (Figure 4 n) and longer tube (Figure 4 o) as well longer tubes kept in parallel
(Figure 4 p). Bulge out is noticed for indent on single side of longer tube as compared to
shorter tube as shown in Figure 4 o. This is because the adjacent support is obtained by
indented portion of longer tube while it is not in the case of shorter tube. The effort in loner
tube kept in parallel is double of single tube (Figure 4 p), hence here too linear interpolation
can be done for increased numbers of tubes. The experiment for both side indents was carried

Comparative large deformations studies on circular tubes
Ram Ranjan Sahu, Pramod Gupta
International Journal of Civil and Structural Engineering
Volume 3 Issue 2 2012
373
for shorter and longer tubes. The overall effort was more for longer tube, as shown in Figure
4 r as compared to shorter tube (Figure 4 q)
Figure 4: Force “F” (Y axis in kN) – Stroke “H” (X axis in mm) graphs of large
deformations
3.13 Finite Element simulation
Finite element simulation was used to simulate the experimental process. The Altair product
HyperMesh was used for FE model building. Aluminum models were presented with shell
elements at mid plane surface as shown in Figure 5. Top and bottom fixtures were modeled

Comparative large deformations studies on circular tubes
Ram Ranjan Sahu, Pramod Gupta
International Journal of Civil and Structural Engineering
Volume 3 Issue 2 2012
374
with rigid material property. The LsDyna was used as solver. It offers wide variety of
material modeling and provides lot of contact algorithm. The materials *MAT_RIGID (Mat-
20) was used for fixtures and *MAT_PIECEWISE_LINEAR_PLASTICITY (Mat-24) was
used for tube samples. The *CONTACT_SURFACE_TO_SURFACE was used to define
contacts between disjoint parts. Also self contact of model was defined through single
surface contact. Coulomb friction was used to define the coeeficient of friction between
interfaces. The post processing was done with LS-PREPOST.
4. Discussion
4.1 Experiment repeatability
Many samples of similar physical dimensions were tested and F-H graph extracted for
different large deformations phenomenon. The repetitions of experiments were ensured by
superimposing this experimental result as shown in Figure 6, for bending as an example.
Good agreement between samples were obtained for the different large deformation
phenomenon, which shows that the experiment do not have any variation on any parameters.
4.2 Energy graph comparison
The energy absorption in different stages of deformations was compared for experimental and
numerical simulation. Results matched well, for example, indent in single side as shown in
Figure 7. This shows that the numerical simulations taking material properties from the test,
its geometrical representations and boundary conditions are perfectly all right
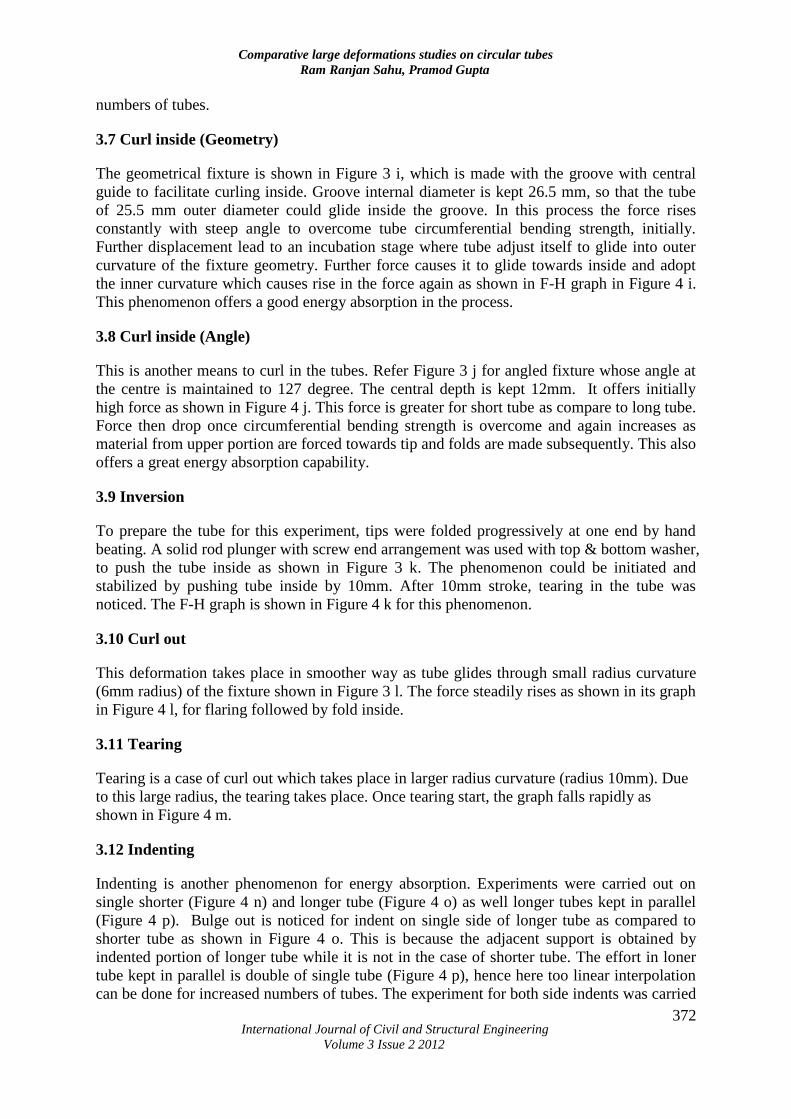
4.3 Specific energy capacity (ω) of different deformation phenomenon
The samples specifications and their specific energy (energy/wt) are enlisted in Table I, for
different large deformations. A bar chart has been drawn and shown in Figure 8 for specific
energy content in vertical axis and deformation phenomenon in horizontal axis. It is observed
that variation in energy is less, for a particular deformation phenomenon from sample to
sample.
Figure 5: FE models before (left) and after deformation (right)

Comparative large deformations studies on circular tubes
Ram Ranjan Sahu, Pramod Gupta
International Journal of Civil and Structural Engineering
Volume 3 Issue 2 2012
375
Figure 6: F (kN)-H (mm) graphs showing experimental repetition for bending
Figure 7: Energy comparison (indent single side)
From the bar char, it is evident that the curl in through geometrical fixtures and angled fixture
absorb the maximum energy as compared to others. This is then followed by inversion, curl
out, tear, crush, contraction and expansion. The least energy absorption phenomenon is both
side indenting.
4.4 Flattening and bending offered almost same amount of energy absorptions, but these
are the phenomenon with less energy absorbers.
4.5 The specific energy may vary by varying the parameters of fixtures and tubes. For
example the interference value in tube contraction and expansion phenomenon, curvatures in
curl out, curl in and tearing phenomenon. Researcher had been doing these kinds of
parametric studies. Here the optimum value fixtures taken and generated the large
deformations for comparison on phenomenon.
Comparative large deformations studies on circular tubes
Ram Ranjan Sahu, Pramod Gupta
International Journal of Civil and Structural Engineering
Volume 3 Issue 2 2012
376
4.6 In practicality the flattening, bending is easiest to achieve and curl in is the most
difficult process to perform. In the curl in process, the tube mostly locally buckles at upper
and lower fixture end. If the energy to be absorbed more in initial condition with smaller
stroke then curl in kind of phenomenon could be used.
Table 1: Samples and their specific energy capacity for different large deformation
phenomenon
Figure 8: Specific energy of samples (S1, 2, 3 etc--) for large deformations phenomenon
4.7 Curl in (angle), crushing and buckling phenomenon shows steep initial graph with
higher force value, as compared to others, as shown in Figure 9. Hence this phenomenon

Comparative large deformations studies on circular tubes
Ram Ranjan Sahu, Pramod Gupta
International Journal of Civil and Structural Engineering
Volume 3 Issue 2 2012
377
can be used, wherever a large amount of force to be absorbed initially.
4.8 Contraction and expansion had much initial perturbation in F-H graph as shown in
Figure 4 b and Figure 4 e. This is due to changed in contact condition and fixture profile
changed in both the phenomenon.
4.9 If energy has to be absorbed in steps with time interval, in an increased fashion, then
the flattening to the tube inside the tubes can be the option as shown in Figure 3 g and Figure
4 g. Multiple tubes can be used as per the desired steps, intervals and for the amount of
energy to be absorbed.
4.10 If energy to be absorbed in multiple amounts, energy absorbing objects (tubes) can
be kept in parallel. For example, as shown in Figure 3h and Figure 4 h. The amounts of
energy absorbed by two long parallel tubes for single side indent is double that of single tube.
4.11 Axial crushing has 8 to 10 times more energy absorption then flattening.
4.12 Indenting in single side get support at bottom and that is why it absorbs more
energy as compared to both side indenting. The longer tube has more material support
from adjacent of indent and hence it absorbs more energy than shorter tube initially. Hence it
has bulge out F-H graph as shown in Figure 4 o.
4.13 In indenting process, once the shorter tube start yielding, it doesn’t have material
adjacent to indent to get support and hence its slope declines after some time. The shorter
tube ends become oval in shape.
4.14 For longer duration energy absorption with longer stroke could be achieved by expansion, contraction, and curl out and also with tearing
Figure 9: F-H graphs for initial steepness
5. Conclusion

Comparative large deformations studies on circular tubes
Ram Ranjan Sahu, Pramod Gupta
International Journal of Civil and Structural Engineering
Volume 3 Issue 2 2012
378
The large deformations on aluminum tubes of similar physical properties were studied. The
experimental and numerical approach was adopted for the study. The different state of
deformations and its F-H graphs were presented and compared. The large deformation energy
absorption, deformation behavior’s studies were done. The best energy absorber phenomenon
and their practicality were also discussed. It was found that curl in phenomenon have
maximum energy absorption while both side indent has the least.
Acknowledgements
The authors gratefully acknowledge the support of engineering research centre of TATA
Motors at Pune-India for the support for experimental works. Also thanks to the material
testing group to provide the necessary support for getting the material non linear properties
through test.
6. References
1. Alexander JM, (1960), An approximate analysis of the collapse of thin
cylindrical shells under axial load, Journal of mechanics and applied
mathematics, 13, pp 10–5.
2. Alghamdi AAA, (2001), Collapsible impact energy absorbers: an overview. Thin-
walled structures, 39(2), pp 189–213.
3. Al-Hassani et al, (1972), Characteristics of inversion tube under axial loading, Journal
of mechanical engineering science, 14, pp 370–81.
4. ASTM International: ASTM E8 / E8M - 09 Standard Test Methods for Tension
Testing of Metallic Materials
5. Ezra A, Fay R., (1972), An assessment of energy absorbing devices for prospective
use in aircraft impact situation, In: Herrmann G, Perrone N, editors. Dynamic
response of structures. New York: Pergamon Press, pp 225–34.
6. G. Lu et al, (1993), Study of the crushing of tubes by two indenters, Int. J. Mech.
Science, 35(3/4), pp 267-278.
7. Guillow SR, Lu G, Grzebieta RH, (2001), Quasi-static axial compression of thin-
walled circular aluminum tubes, International Journal of Mechanical Sciences,
43(9), pp 2103–23.
8. HyperMesh11. A product of Altair Engineering HyperWorks
9. Jialing Yang et al, (2010), Energy absorption of expansion tubes using a conical–
cylindrical die-Experiments and numerical simulation, International Journal of
Mechanical Sciences, 52, pp 716–725.
10. LsDyna software & manuals, Livermore Software Technology Corporation,
Livermore, California 94550-1740.
11. LS-Prepost. Livermore Software Technology Corporation, Livermore, California
94550-1740.

Comparative large deformations studies on circular tubes
Ram Ranjan Sahu, Pramod Gupta
International Journal of Civil and Structural Engineering
Volume 3 Issue 2 2012
379
12. Nia and Hamedani, (2010), Comparative analysis of energy absorption and
deformations of thin walled tubes with various section geometries. Thin-Walled
Structures, 48(12), pp 946-954.
13. Olabi AG, Morris E, Hashmi MSJ, (2007), Metallic tube type energy absorbers:
a synopsis, Thin-Walled Structures, 45 pp 706–26.
14. Reid SR, Reddy TY, (1978), Effect of strain hardening on the lateral
compression of tubes between rigid plates, International Journal of Solids and
Structures, 14, pp 213–25.
15. Reddy TY, Reid SR, (1979), Lateral compression of tubes and tube-systems with side
constraints, International Journal of Mechanical Sciences, 21(3), pp 187–99.
Recommended