COMP4048Incremental Graph Drawing
Richard WebberNational ICT Australia

Lecture Overview
• The Problem
• Spring Algorithms
• Trees
• Orthogonal

Incremental Graph Drawing
• The aim of visualisation…to produce representations of information
that are
easy to understand• However…
– Sometimes the information is too “big”– Sometimes the information is dynamic – it
changes while it is being viewed– Visualisation should support exploration
through user interaction

Incremental Graph Drawing
• Incremental Interactive Iterative Dynamic
• Allow insert, delete, manual movement– Reflect changes in the underlying information
• Make the minimum change possible– Reduce computational cost of redraw –
e.g. (Cohen, et al., 1995)
– Reduce cognitive cost of redraw

The Mental Map
• User maintains an internal model of the visualisation
• Radical change to drawing loss of model (Misue, et al., 1995)

The Mental Map
• Relative-coordinate scenario– Preserve orthogonal ordering
– Preserve clustering (relative distances)
– Preserve topology (embedding)
• No-change scenario– Preserve position of all existing vertices

Spring-based Algorithms
1. Apply spring algorithm until stable2. Update graph3. Repeat from 1, using current positions as
initial positions– Animating changes helps mental map– e.g., OFDAV (Huang, et al., 1998)– Easy to force no-change scenario– Difficult to force relative-coordinate scenario
Force-Scan
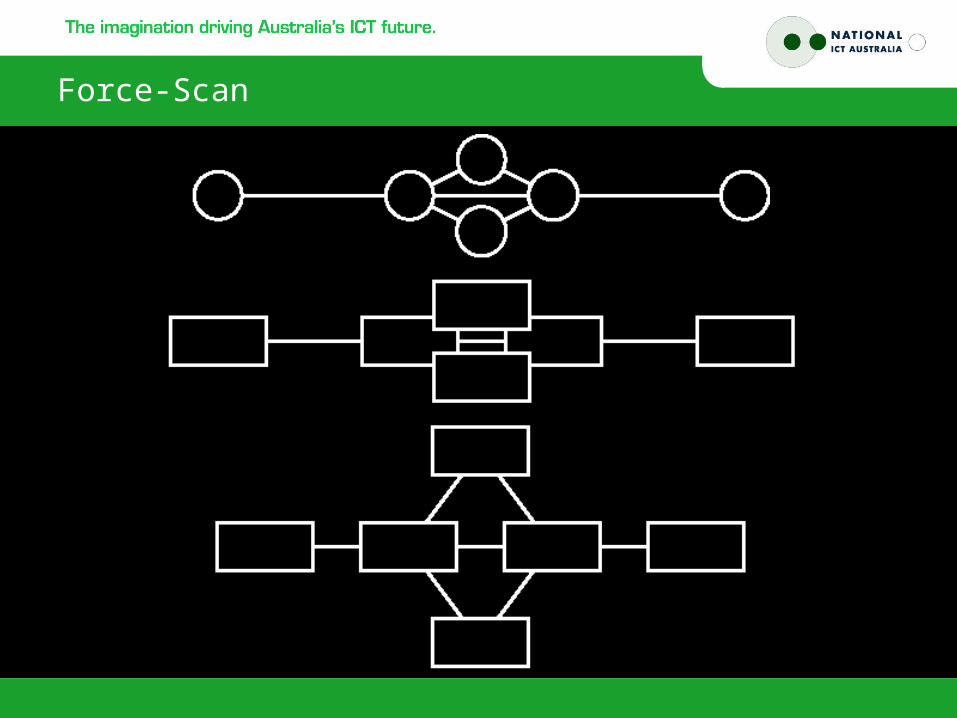
• (Lai, 1993)• Spring variant to remove node overlap• Force = desired d – actual d• Scan order is by horizontal then vertical• Satisfies relative-coordinate scenario• Dummy nodes can be introduces to avoid
edge-vertex crossings
Force-Scan

OFDAV
• On-line Force-Directed Animated Visualization
• (Huang, et al., 1998)• Layout a spanning tree of limited size
around a node of interest – the “focus”• When focus changes
– Recalculate tree and redo layout– Animate changes to preserve context
• Allows exploration of a partially unknown graph – e.g., WWW
OFDAV
• On change of focus– Place new focus Qi to buffer of size B
– Remove oldest focus Qi-B from buffer (FIFO)
– Build tree from nodes in buffer plus all neighbours within distance d
d-neighbours of Qi added to graph
d-neighbours of Qi-B probably removed

OFDAV
• Layout algorithm– Modified spring algorithm– Preserved nodes start in old positions
– Extra gravitational repulsion away from Qi helps focal path form a line
• Spring effectively “animates” the graph change between focal nodes

OFDAV

Abstraction
• Interaction can involve removing or summarising parts of a graph…
• Replace (large) components with smaller representations
• Often, representation = single node Component is “collapsed” /
“contracted” / “summarised” / “abstracted” / “abridged”
Node is “expanded” / “inflated” / “extracted”
Abstraction
• Components can be– Arbitrary – user-specified
– Geometric clusters of vertices
– Graph-theoretic cluster of vertices
– Specific structures: e.g., cliques, connected components (by specific relationships)
– Encoded in the visualisation structure: e.g. subtrees, cluster graphs, compound graphs
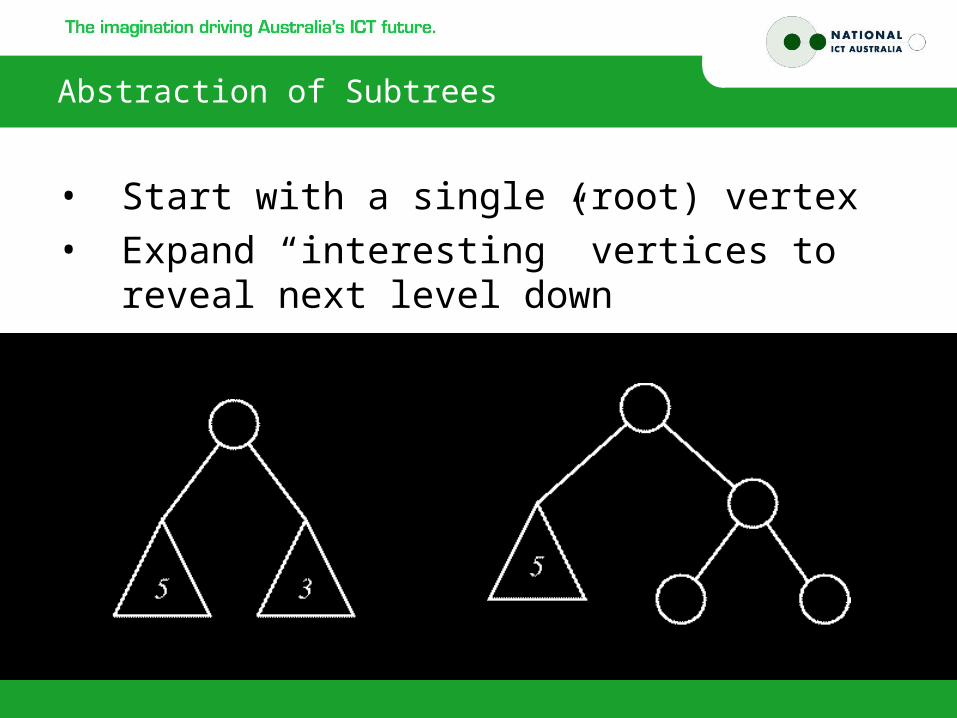
Abstraction of Subtrees
• Start with a single (root) vertex• Expand “interesting” vertices to reveal
next level down

Abstraction of Subtrees

Abstraction of Subtrees
• Can modify algorithm to try to preserve the mental map across expansion and contraction
• E.g., (Demetrescu, et al., 2000)• Can be generalised using Bayesian
models

Abstracting Compound Graphs
• Each vertex can be contracted to hide its descendants, and expanded to reveal them
• Use size/colour/label/… to identify interesting properties of descendants
• Animate to preserve mental map

Abstracting Compound Graphs

Orthogonal Graph Drawings
• Orthogonal Drawings– Vertices placed at integer coordinates– Edges parallel to coordinate axes– Edges can contain bends
• (Papakostas, et al., 1998), (Papakostas, et al., 1996)
• You will see algorithms for drawing these later in the course…
Orthogonal Graph Drawings
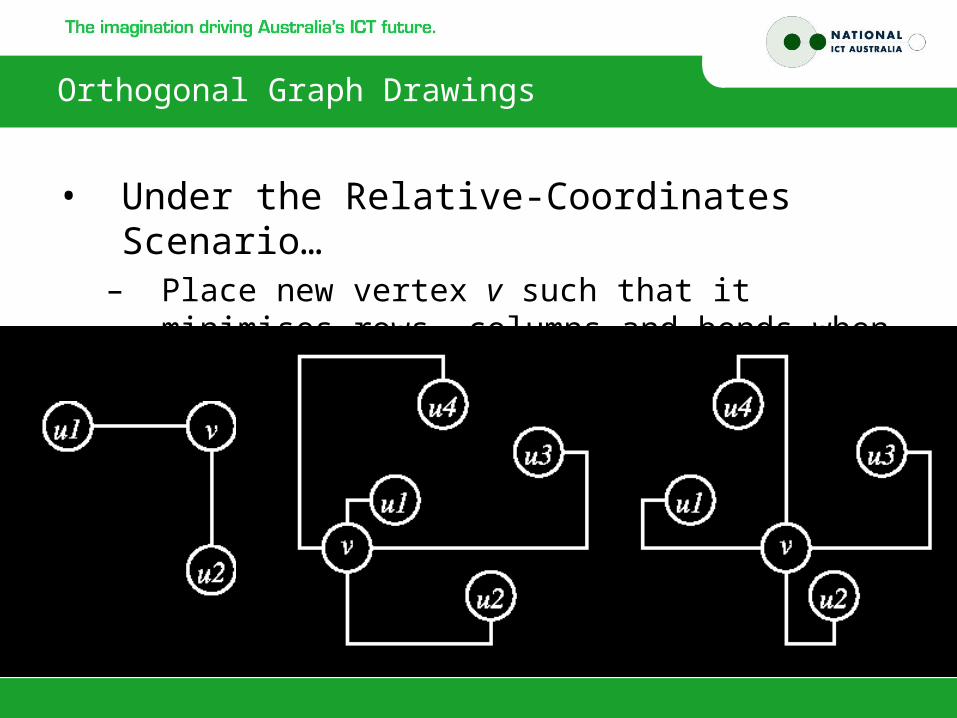
• Under the Relative-Coordinates Scenario…
– Place new vertex v such that it minimises rows, columns and bends when routing all (ui, v)

Orthogonal Graph Drawings
• Many cases to consider• hw drawing and n new vertices
8n new bends and ((h+w)/2 + 3n)2 area
• Incremental construction at time t at most 3 bends per edge at most 3t-1 total bends at most 2.25t2 area

Orthogonal Graph Drawings
• Under the No-Change Scenario…– New vertex v must be placed “outside”
existing drawing– Again placed to minimise rows, columns and
bends
• Incremental construction at time t at most 3 bends per edge at most 8t/3+2 total bends at most (4t/3)2 area

Orthogonal Graph Drawings
Relative

Four-Orthogonal
• Assumes a biconnected graph, degree 4
1. Calculate st-ordering2. Place first vertex3. Allocate columns for out-going edges4. Place next vertex, using columns for in-
coming edges5. Repeat from 3 until done

Four-Orthogonal

Four-Orthogonal
• Classify vertices a-b by in-coming a and out-going b edges s.t. 1 a, b, a+b 4
• Condensed G’ 1-1 vertices absorbed• Form vertex pairs then use to identify
vertices and edges which can share rows and columns

Four-Orthogonal
1. Computer st-numbering of G2. Condense G to G’ – update numbering3. i = n’-1; while i > 2:
– If vi 1-21-3 then pair vi-1,vi; i = i-2– Elseif vi 2-2 then find smallest j s.t.
vi-j 1-12-13-1 or vi-j immediate predecessor vi; pair vi-j,vi; i = i-j-1
– Else i = i-1• Finds pairs for all 1-21-32-2 vertices

Four-Orthogonal
vi 2-2 and vj 2-2

Four-Orthogonal
vi 2-2 and vj 1-12-13-1 ( predecessor)

Four-Orthogonal
vi 2-2 and vj 1-21-3

Four-Orthogonal
vi 1-21-3 and vi-1 2-22-13-1
• Covered by vi 2-2 cases
vi 1-21-3 and vi-1 1-21-3 (independent)

Four-Orthogonal
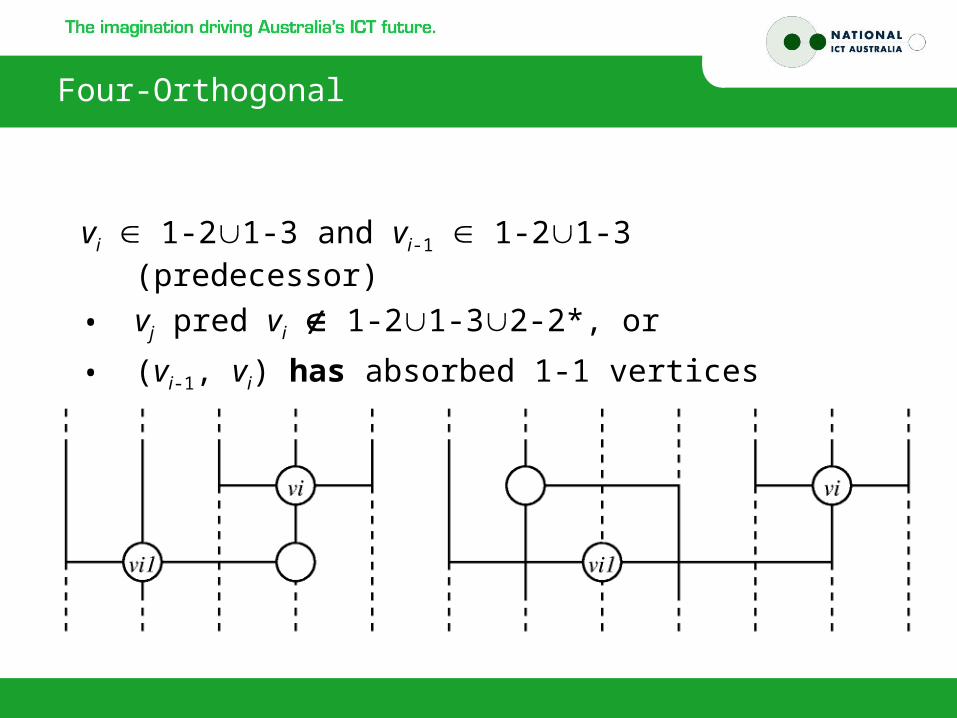
vi 1-21-3 and vi-1 1-21-3 (predecessor)
• vj pred vi 1-21-32-2*, and
• (vi-1, vi) has not absorbed 1-1 vertices
Four-Orthogonal
vi 1-21-3 and vi-1 1-21-3 (predecessor)
• vj pred vi 1-21-32-2*, or
• (vi-1, vi) has absorbed 1-1 vertices

Four-Orthogonal
1. st-number, condense and find pairs2. Place v1 and v2 (see next slide)
3. For v3 … vn’-1:– If vi unplaced:
• Place unpaired vi in new row with new columns
• Place paired vi,vj as shown
4. Place vn’ in new row (4th edge from vn’-1)5. Replace absorbed 1-1 vertices

Four-Orthogonal
• Placing v1 and v2

Four-Orthogonal
Four-Orthogonal
• Running time O(n)• Area O( (7n+10)2 / 64) O(0.77n2)• At most 2n+4 bends in total• At most 2 bends per edge

References
• R. F. Cohen, G. Di Battista, R. Tamassia, I. G. Tollis (1995): “Dynamic Graph Drawings: Trees, Series-Parallel Digraphs, and Planar st-Digraphs”, SIAM J. Computing, 24(5):970-1001.
• K. Misue, P. Eades, Wei Lai, K. Sugiyama (1995): “Layout Adjustment and the Mental Map”, J. Visual Languages and Computing, 6(2):183-210.
• M. L. Huang, P. Eades, J. Wang (1998): “On-line Animated Visualization of Huge Graphs using a Modified Spring Algorithm”, J. Visual Languages and Computing, 9(6):623-645.

References
• Wei Lai (1993): “Building Interactive Diagram Applications”, Ph.D. Thesis, Dept. Computer Science, University of Newcastle.
• C. Demetrescu, G. Di Battista, I. Finocchi, G. Liotta, M. Patrignani, M. Pizzonia (2000): “Infinite Trees and the Future”, Proc. 7th Int. Symp. Graph Drawing (1999), Springer-Verlag, LNCS, 1731:379-391.

References
• A. Papakostas, I. G. Tollis (1998): “Interactive Orthogonal Graph Drawing”, IEEE Trans. Computers, 47(11):1297-1309.
• A. Papakostas, J. M. Six, I. G. Tollis (1997) “Experimental and Theoretical Results in Interactive Orthogonal Graph Drawing”, Proc. 4th Int, Symp. Graph Drawing (1996), Springer-Verlag, LNCS, 1190:371-386.
Recommended