Corporate Presentation September 2016
Prepared with data at closing of June 30th 2016, unless noticed otherwise
Committed to trustworthy and profitable banking
2
Disclaimer
The purpose of this presentation is purely informative and the information contained herein is subject to, and must be read in conjunction with, all other publicly available information. In particular, regarding the data provided by third parties, neither CaixaBank, S.A. (“CaixaBank”), nor any of its administrators, directors or employees, is obliged, either explicitly or implicitly, to vouch that these contents are exact, accurate, comprehensive or complete, nor to keep them updated, nor to correct them in the case that any deficiency, error or omission were to be detected. Moreover, in reproducing these contents in any medium, CaixaBank may introduce any changes it deems suitable, may omit partially or completely any of the elements of this document, and in case of any deviation between such a version and this one, assumes no liability for any discrepancy.
This document has at no time been submitted to the Comisión Nacional del Mercado de Valores (CNMV – the Spanish Stock Markets regulatory body) for approval or scrutiny. In all cases its contents are regulated by the Spanish law applicable at time of writing, and it is not addressed to any person or legal entity located in any other jurisdiction. For this reason it may not necessarily comply with the prevailing norms or legal requisites as required in other jurisdictions.
CaixaBank cautions that this presentation might contain forward-looking statements. While these statements represent our judgment and future expectations concerning the development of our business, a number of risks, uncertainties and other important factors could cause actual developments and results to differ materially from our expectations.
Statements as to historical performance, historical share price or financial accretion are not intended to mean that future performance, future share price or future earnings for any period will necessarily match or exceed those of any prior year. Nothing in this presentation should be construed as a profit forecast.
This presentation on no account should be construed as a service of financial analysis or advice, nor does it aim to offer any kind of financial product or service. In particular, it is expressly remarked here that no information herein contained should be taken as a guarantee of future performance or results.
In making this presentation available, CaixaBank gives no advice and makes no recommendation to buy, sell or otherwise deal in CaixaBank shares, or any other securities or investment whatsoever. Any person at any time acquiring securities must do so only on the basis of such person’s own judgment as to the merits or the suitability of the securities for its purpose and only on such information as is contained in such public information having taken all such professional or other advice as it considers necessary or appropriate in the circumstances and not in reliance on the information contained in this presentation.
Without prejudice to legal requirements, or to any limitations imposed by CaixaBank that may be applicable, permission is hereby expressly refused for any type of use or exploitation of the contents of this presentation, and for any use of the signs, trademarks and logotypes which it contains. This prohibition extends to any kind of reproduction, distribution, transmission to third parties, public communication or conversion into any other medium, for commercial purposes, without the previous express permission of CaixaBank and/or other respective proprietary title holders. Any failure to observe this restriction may constitute a legal offence which may be sanctioned by the prevailing laws in such cases.
With regards to Alternative Performance Measures (APMs) as defined in the guidelines on Alternative Performance Measures issued by the European Securities and Markets Authority on 30 June 2015 (ESMA/2015/1057), this report uses certain APMs, which have not been audited, for a better understanding of the company's financial performance. These measures are considered additional disclosures and in no case replace the financial information prepared under IFRS. Moreover, the way the Group defines and calculates these measures may differ to the way similar measures are calculated by other companies. Accordingly, they may not be comparable. Refer to the quarterly report for a list of the APMs used, along with a reconciliation between certain management indicators and the indicators presented in the consolidated financial statements prepared under IFRS.
In so far as it relates to results from investments, this financial information from CaixaBank Group for 1H 2016 has been prepared mainly on the basis of estimates.
3
Index
1. CaixaBank at a glance p. 4
2. Competitive stance p. 11
3. Strategic Plan 2015-2018 p. 29
4. International presence & Investments p. 36
5. Results and activity update: 1H16 p. 39
Appendix p. 62
4
CaixaBank [At a glance]
5
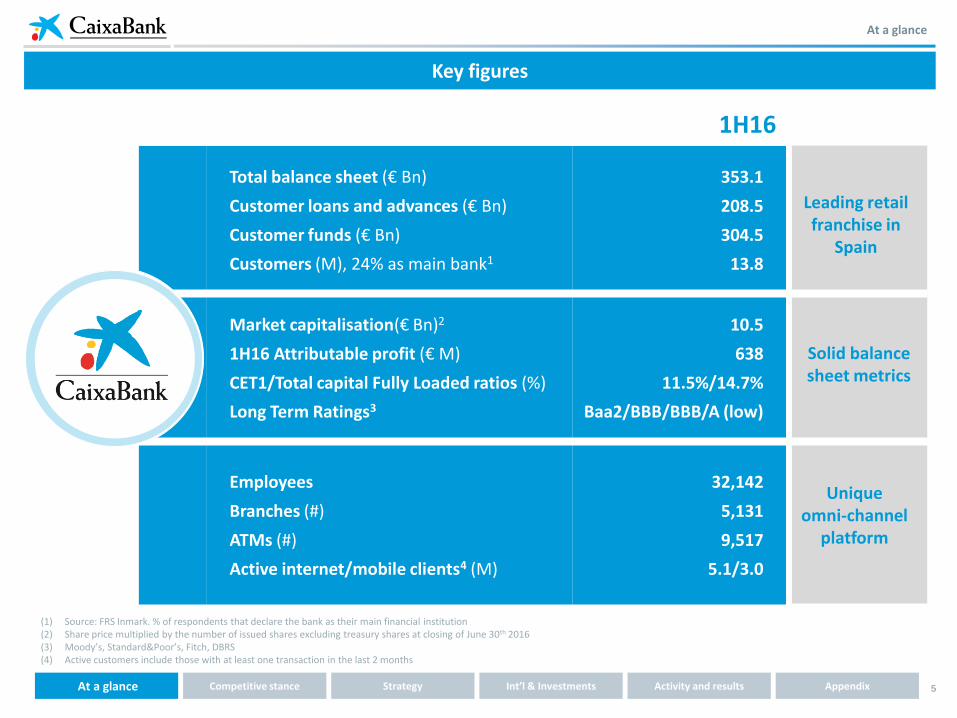
Total balance sheet (€ Bn)
Customer loans and advances (€ Bn)
Customer funds (€ Bn)
Customers (M), 24% as main bank1
353.1
208.5
304.5
13.8
Market capitalisation(€ Bn)2
1H16 Attributable profit (€ M)
CET1/Total capital Fully Loaded ratios (%)
Long Term Ratings3
10.5
638
11.5%/14.7%
Baa2/BBB/BBB/A (low)
Employees
Branches (#)
ATMs (#)
Active internet/mobile clients4 (M)
32,142
5,131
9,517
5.1/3.0
At a glance
1H16
Leading retail franchise in
Spain
Solid balance sheet metrics
Unique omni-channel
platform
(1) Source: FRS Inmark. % of respondents that declare the bank as their main financial institution (2) Share price multiplied by the number of issued shares excluding treasury shares at closing of June 30th 2016 (3) Moody’s, Standard&Poor’s, Fitch, DBRS (4) Active customers include those with at least one transaction in the last 2 months
Key figures
Int’l & Investments Activity and results At a glance Competitive stance Strategy Appendix
6
At a glance
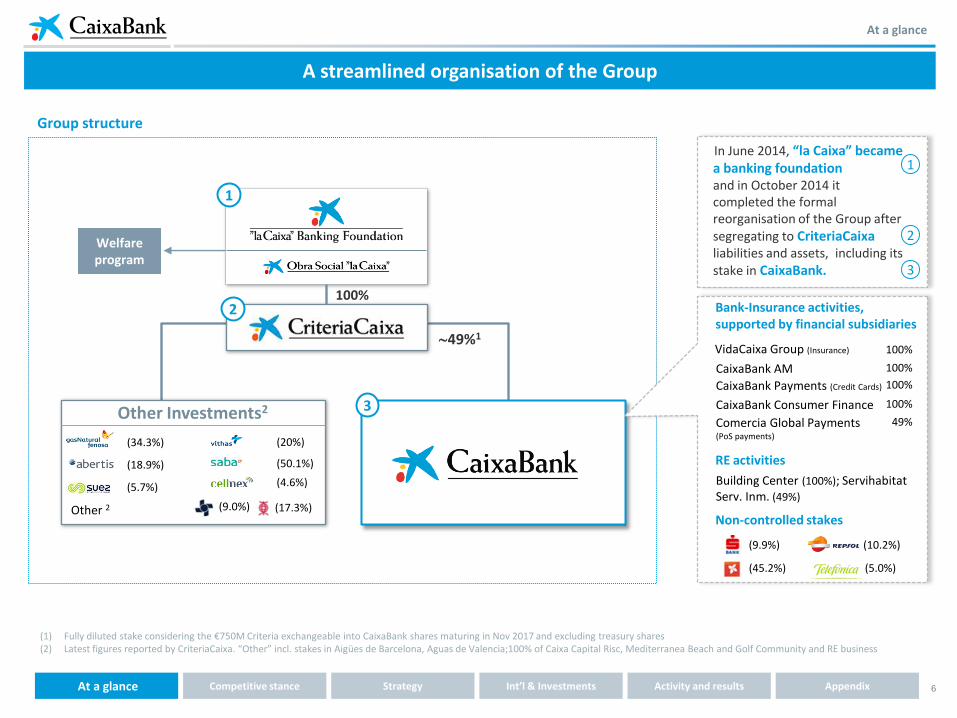
(1) Fully diluted stake considering the €750M Criteria exchangeable into CaixaBank shares maturing in Nov 2017 and excluding treasury shares (2) Latest figures reported by CriteriaCaixa. “Other” incl. stakes in Aigües de Barcelona, Aguas de Valencia;100% of Caixa Capital Risc, Mediterranea Beach and Golf Community and RE business
49%1
Other Investments2
Other 2
(34.3%)
(18.9%)
(5.7%)
(50.1%)
(20%)
Non-controlled stakes
Welfare program
In June 2014, “la Caixa” became a banking foundation and in October 2014 it completed the formal reorganisation of the Group after segregating to CriteriaCaixa liabilities and assets, including its stake in CaixaBank.
1
3
2
3
A streamlined organisation of the Group
(4.6%)
(9.0%) (17.3%)
100% 2
1
(10.2%)
(5.0%) (45.2%)
(9.9%)
Bank-Insurance activities, supported by financial subsidiaries
100%
100%
100%
49%
CaixaBank AM
VidaCaixa Group (Insurance) 100%
CaixaBank Payments (Credit Cards)
CaixaBank Consumer Finance
Comercia Global Payments (PoS payments)
RE activities
Building Center (100%); Servihabitat Serv. Inm. (49%)
Group structure
Int’l & Investments Activity and results At a glance Competitive stance Strategy Appendix
7
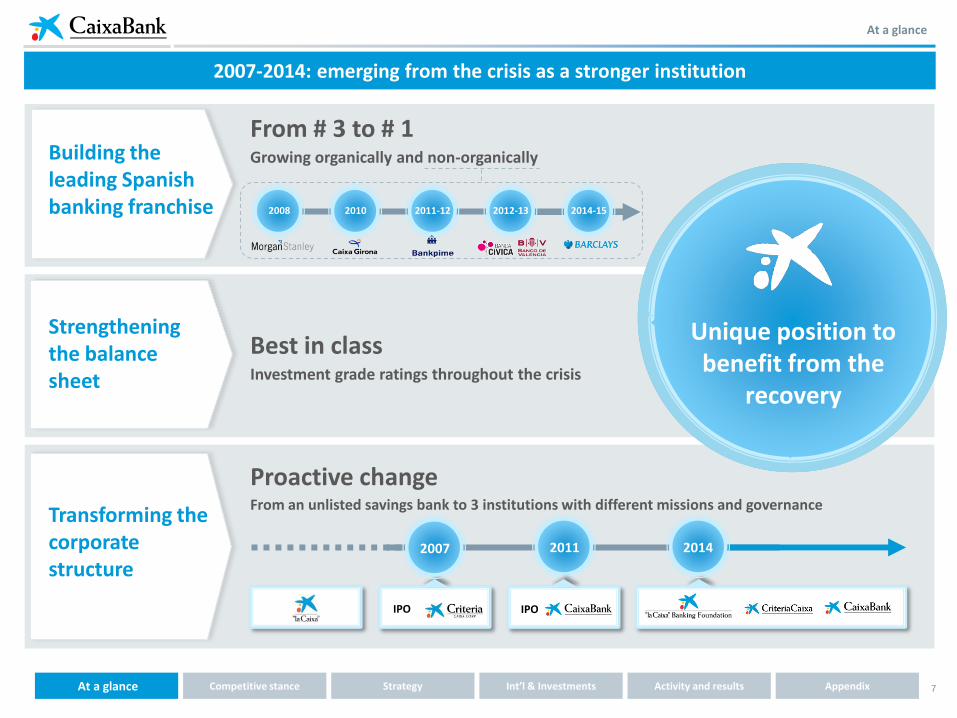
Unique position to benefit from the
recovery
Building the leading Spanish banking franchise
Strengthening the balance sheet
Proactive change From an unlisted savings bank to 3 institutions with different missions and governance
From # 3 to # 1 Growing organically and non-organically
Best in class Investment grade ratings throughout the crisis
2007-2014: emerging from the crisis as a stronger institution
2011 2014
IPO IPO
2007
Transforming the corporate structure
2008 2010 2011-12 2012-13 2014-15
At a glance
Int’l & Investments Activity and results At a glance Competitive stance Strategy Appendix
8
At a glance
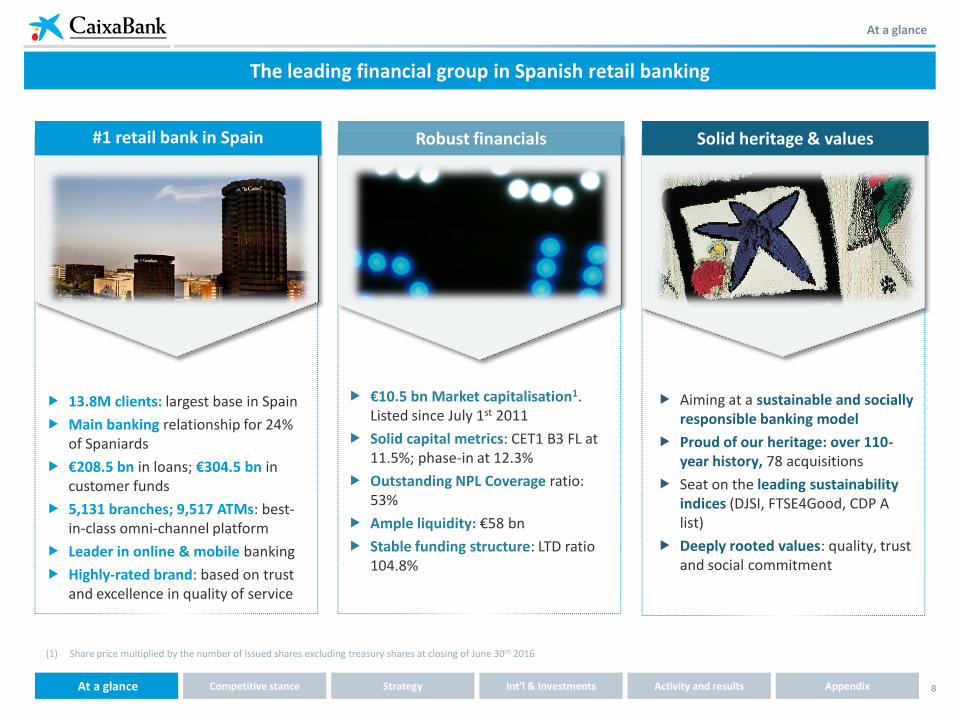
13.8M clients: largest base in Spain
Main banking relationship for 24% of Spaniards
€208.5 bn in loans; €304.5 bn in customer funds
5,131 branches; 9,517 ATMs: best-in-class omni-channel platform
Leader in online & mobile banking
Highly-rated brand: based on trust and excellence in quality of service
€10.5 bn Market capitalisation1. Listed since July 1st 2011
Solid capital metrics: CET1 B3 FL at 11.5%; phase-in at 12.3%
Outstanding NPL Coverage ratio: 53%
Ample liquidity: €58 bn
Stable funding structure: LTD ratio 104.8%
Aiming at a sustainable and socially responsible banking model
Proud of our heritage: over 110-year history, 78 acquisitions
Seat on the leading sustainability indices (DJSI, FTSE4Good, CDP A list)
Deeply rooted values: quality, trust and social commitment
#1 retail bank in Spain
The leading financial group in Spanish retail banking
Robust financials Solid heritage & values
(1) Share price multiplied by the number of issued shares excluding treasury shares at closing of June 30th 2016
Int’l & Investments Activity and results At a glance Competitive stance Strategy Appendix
9
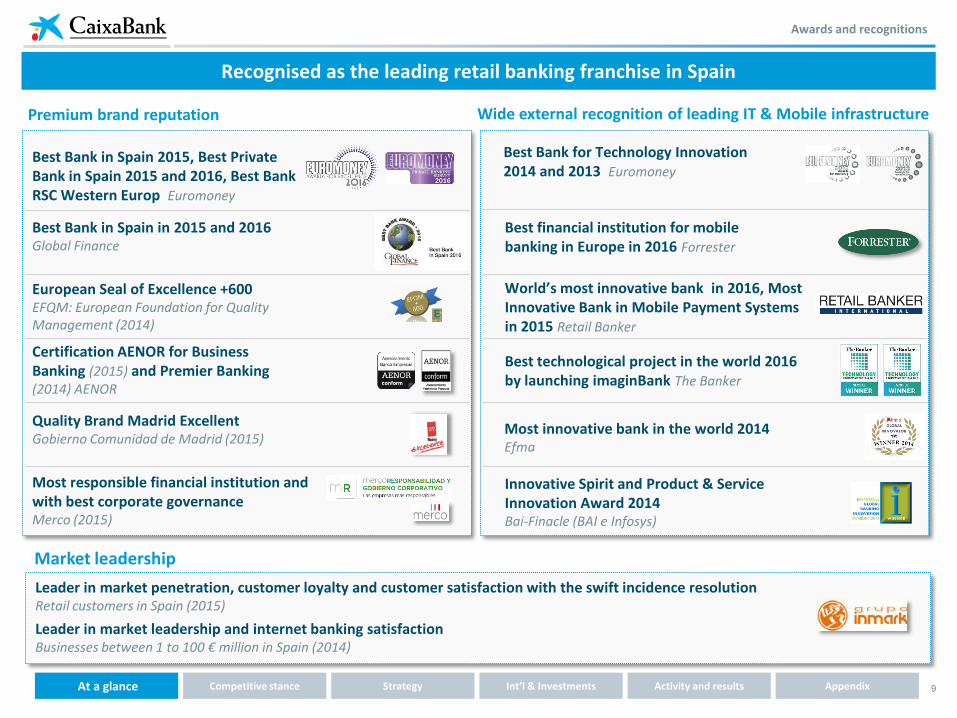
Premium brand reputation Wide external recognition of leading IT & Mobile infrastructure
European Seal of Excellence +600 EFQM: European Foundation for Quality Management (2014)
Best Bank in Spain in 2015 and 2016 Global Finance
Certification AENOR for Business Banking (2015) and Premier Banking (2014) AENOR
Best Bank in Spain 2015, Best Private Bank in Spain 2015 and 2016, Best Bank RSC Western Europ Euromoney
Quality Brand Madrid Excellent Gobierno Comunidad de Madrid (2015)
Best financial institution for mobile banking in Europe in 2016 Forrester
Best Bank for Technology Innovation 2014 and 2013 Euromoney
Innovative Spirit and Product & Service Innovation Award 2014 Bai-Finacle (BAI e Infosys)
World’s most innovative bank in 2016, Most Innovative Bank in Mobile Payment Systems in 2015 Retail Banker
Most responsible financial institution and with best corporate governance Merco (2015)
Market leadership
Leader in market penetration, customer loyalty and customer satisfaction with the swift incidence resolution Retail customers in Spain (2015)
Leader in market leadership and internet banking satisfaction Businesses between 1 to 100 € million in Spain (2014)
Awards and recognitions
Recognised as the leading retail banking franchise in Spain
Best technological project in the world 2016 by launching imaginBank The Banker
Int’l & Investments Activity and results At a glance Competitive stance Strategy Appendix
Most innovative bank in the world 2014 Efma

10 Int’l & Investments Performance Balance sheet At a glance Competitive stance Strategy Appendix
Macro & Industry Backdrop
Geared to the performance of the Spanish economy
24.8% 26.1% 24.4% 22.1% 19.8% 18.4% 17.1%
2012 2013 2014 2015 2016 2017 2018
-9.9% -9.4% -7.1%
-4.3% -2.2%
0.1% 1.4%
0.6% 1.4% -0.3% 1.0%
2.0% 2.3% 2.1%
2012 2013 2014 2015 2016 2017 2018
The economic recovery in Spain remains strong
GDP growth, % yoy
The banking system is supporting the recovery
-2.6% -1.7%
1.4%
3.2% 3.1% 2.4% 2.2%
2012 2013 2014 2015 2016 2017 2018
Labor market remains in recovery mode RE market has stabilised and starts an upward trend
Unemployment rate, % yoy
% yoy, industry forecasts
Housing prices (nominal) % yoy
forecast
forecast forecast
(1) Loans to the “Other Resident Sectors” excluding to financial services companies (Bank of Spain statistics). (2) Includes time and demand deposits as well as promissory notes of households and non-financial companies. Source: CaixaBank Research. Forecasts as of Aug 01, 2016
forecast
deposits2
credit1
• Largest client base • Premium network • Better asset quality
Economic activity continues to grow strongly: GDP increased by 0.8% qoq (3.2% yoy) in 2Q16. We forecast a slight decrease in future growth rates due to the loss of strength of some temporary tailwinds (less expansionary fiscal policy, increase in oil prices). We expect the negative impact of Brexit to be concentrated in the UK, with a limited negative effect on global confidence.
Macro dynamics support volume growth and improved asset quality: New credit is accelerating as a result of pent-up demand and improved financial conditions while the cost of risk is steadily declining. The main challenge is to achieve sustainable profitability levels.
-8.8% -5.8% -2.4%
1.1% 3.0% 4.0% 5.5%
2012 2013 2014 2015 2016 2017 2018

11
Competitive [Stance]
12
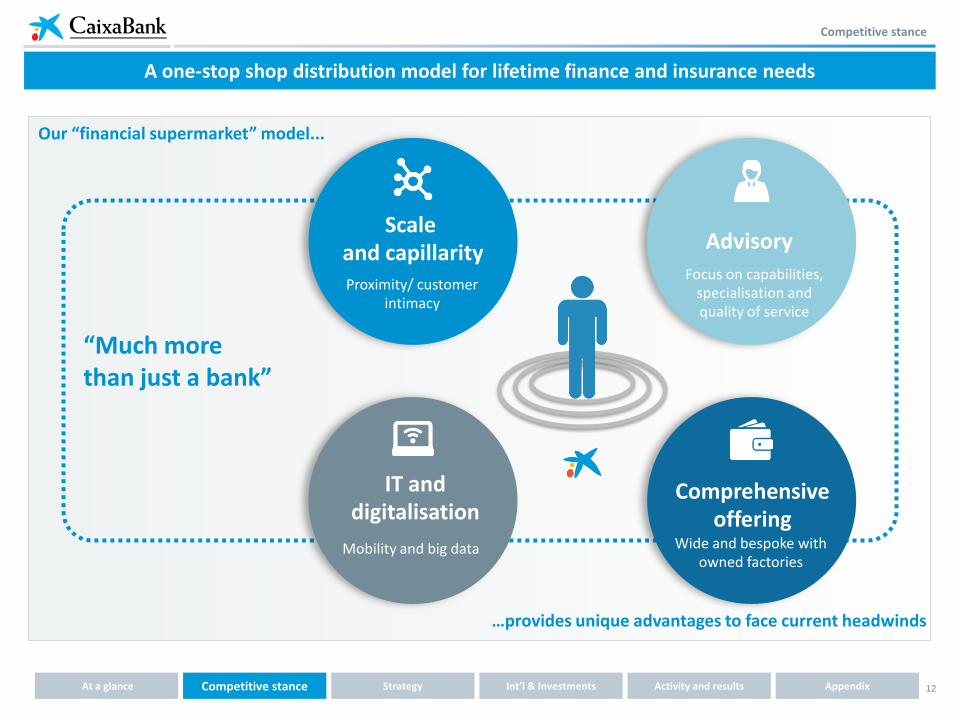
A one-stop shop distribution model for lifetime finance and insurance needs
Our “financial supermarket” model...
…provides unique advantages to face current headwinds
“Much more than just a bank”
Scale and capillarity Proximity/ customer
intimacy
Advisory
Focus on capabilities, specialisation and quality of service
Competitive stance
Int’l & Investments Activity and results At a glance Competitive stance Strategy Appendix
IT and digitalisation
Mobility and big data
Comprehensive offering
Wide and bespoke with owned factories
13
Market leadership
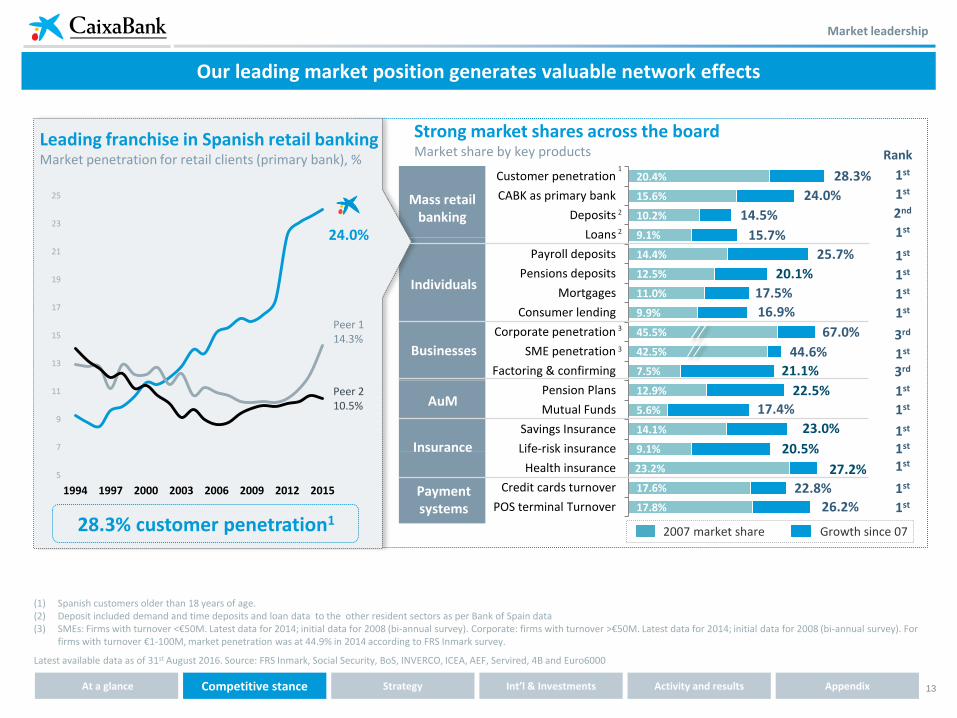
Our leading market position generates valuable network effects
17.8%
17.6%
23.2%
9.1%
14.1%
5.6%
12.9%
7.5%
42.5%
45.5%
9.9%
11.0%
12.5%
14.4%
9.1%
10.2%
15.6%
20.4%
POS terminal Turnover
Credit cards turnover
Health insurance
Life-risk insurance
Savings Insurance
Mutual Funds
Pension Plans
Factoring & confirming
SME penetration
Corporate penetration
Consumer lending
Mortgages
Pensions deposits
Payroll deposits
Loans
Deposits
CABK as primary bank
Customer penetration 28.3%
24.0%
15.7%
25.7%
16.9%
44.6%
23.0%
22.8%
14.5%
67.0%
17.4%
22.5%
20.5%
26.2%
2007 market share Growth since 07
1st
Rank
Mass retail banking
AuM
Payment systems
Insurance
Individuals
Businesses
20.1%
17.5%
21.1%
1st
2nd
1st
3rd
1st
3rd
1st
1st
1st
1st
1st
1st
1
2
3
1st
1st
1st
1st
1st 27.2%
3
2
Leading franchise in Spanish retail banking Market penetration for retail clients (primary bank), %
28.3% customer penetration1
(1) Spanish customers older than 18 years of age. (2) Deposit included demand and time deposits and loan data to the other resident sectors as per Bank of Spain data (3) SMEs: Firms with turnover <€50M. Latest data for 2014; initial data for 2008 (bi-annual survey). Corporate: firms with turnover >€50M. Latest data for 2014; initial data for 2008 (bi-annual survey). For
firms with turnover €1-100M, market penetration was at 44.9% in 2014 according to FRS Inmark survey.
Latest available data as of 31st August 2016. Source: FRS Inmark, Social Security, BoS, INVERCO, ICEA, AEF, Servired, 4B and Euro6000
24.0%
Peer 1 14.3%
Peer 2 10.5%
5
7
9
11
13
15
17
19
21
23
25
1994 1997 2000 2003 2006 2009 2012 2015
Strong market shares across the board Market share by key products
Int’l & Investments Activity and results At a glance Competitive stance Strategy Appendix

14
Proven integration track record
(1) Time lapsed from closing, legal merger or acquisition agreement until completion of IT integration (2) It involved completing 4 sequential integrations
Acquisitions
Strict financial discipline for acquisitions
Growth and market leadership have been reinforced by acquisitions
Synergies as % of initial costs Synergies 2016E (€M)
Timing (begin/completed)
Initial target Achieved
59% 63% 580 2012/2015
52% 62% 101 2013/2015
45% 56% 189 2015/2016
Effective delivery of synergies exceeding targets and earlier than expected. In €M
0.3x 0.0x
0.5x
Attractive multiples (P/BV multiples)
2008 2010 2011-12 2012-13 2014-15
10 months1 6 months1 4 months1 8.5 months1,2 5 months1 4.5 months1
Int’l & Investments Activity and results At a glance Competitive stance Strategy Appendix
15
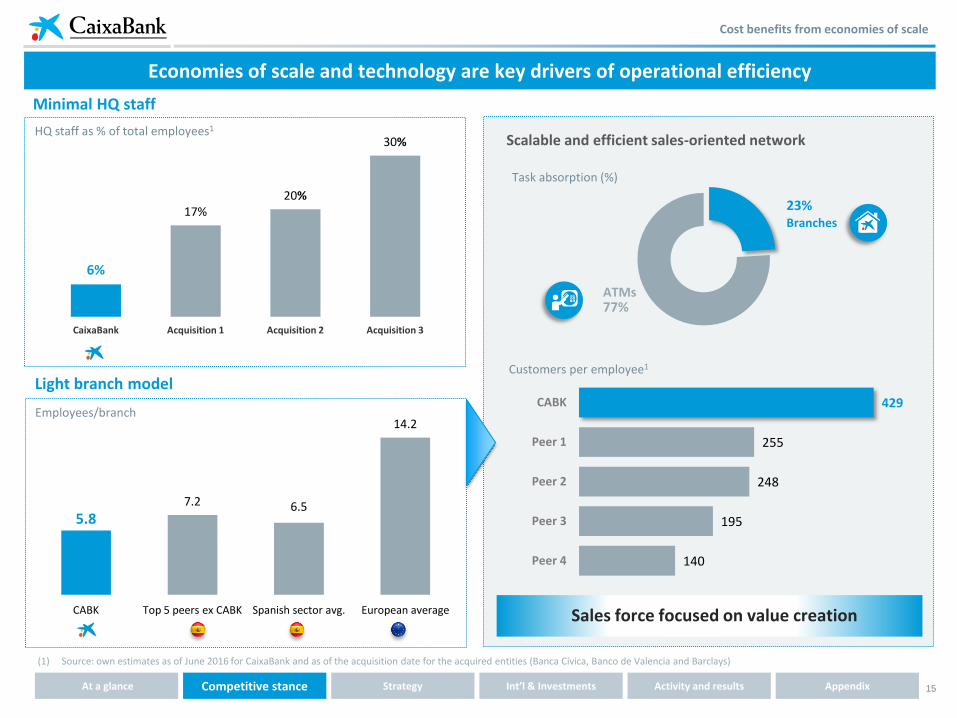
Economies of scale and technology are key drivers of operational efficiency
(1) Source: own estimates as of June 2016 for CaixaBank and as of the acquisition date for the acquired entities (Banca Cívica, Banco de Valencia and Barclays)
Cost benefits from economies of scale
Minimal HQ staff
HQ staff as % of total employees1
Light branch model
Employees/branch
5.8 7.2 6.5
14.2
CABK Top 5 peers ex CABK Spanish sector avg. European average
23%
77%
Task absorption (%)
Branches
ATMs
Sales force focused on value creation
Customers per employee1
Scalable and efficient sales-oriented network
6%
17% 20%
30%
CaixaBank Acquisition 1 Acquisition 2 Acquisition 3
429
255
248
195
140
CABK
Peer 1
Peer 2
Peer 3
Peer 4
Int’l & Investments Activity and results At a glance Competitive stance Strategy Appendix
16
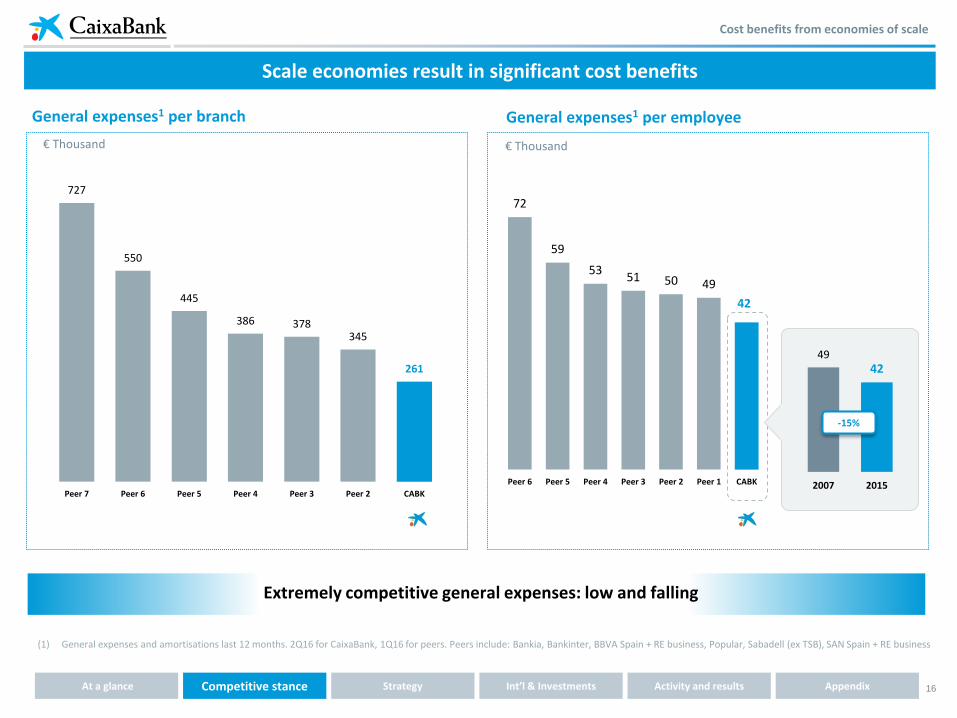
Scale economies result in significant cost benefits
(1) General expenses and amortisations last 12 months. 2Q16 for CaixaBank, 1Q16 for peers. Peers include: Bankia, Bankinter, BBVA Spain + RE business, Popular, Sabadell (ex TSB), SAN Spain + RE business
Cost benefits from economies of scale
€ Thousand € Thousand
72
59
53 51 50 49
42
Peer 6 Peer 5 Peer 4 Peer 3 Peer 2 Peer 1 CABK
General expenses1 per branch
49 42
2007 2015
-15%
General expenses1 per employee
Extremely competitive general expenses: low and falling
727
550
445
386 378 345
261
Peer 7 Peer 6 Peer 5 Peer 4 Peer 3 Peer 2 CABK
Int’l & Investments Activity and results At a glance Competitive stance Strategy Appendix
17
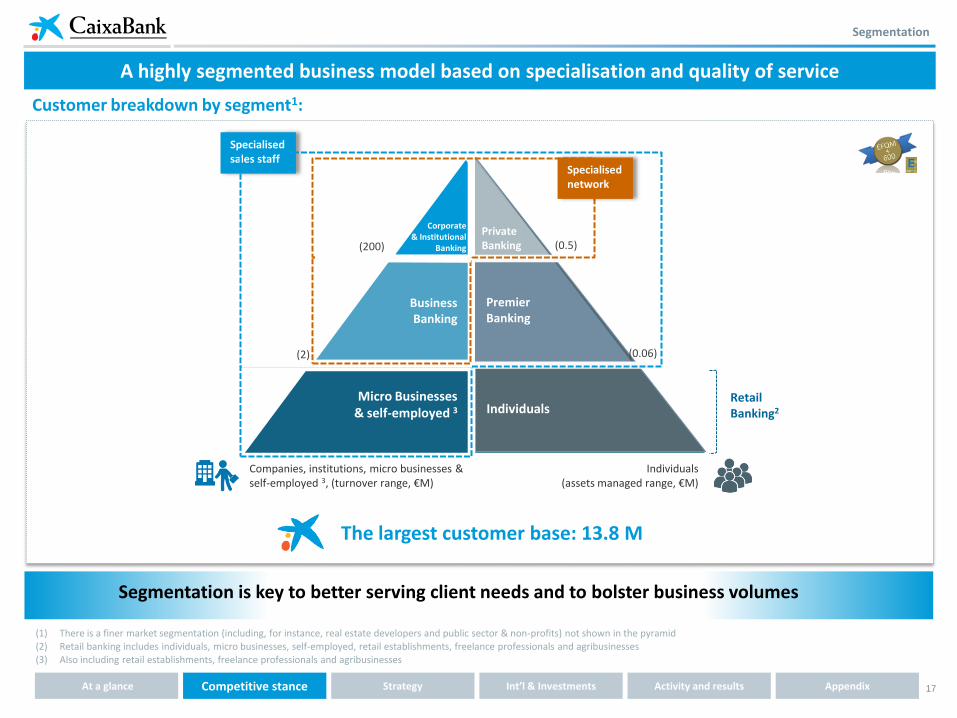
Segmentation
Business Banking
(0.06)
Individuals (assets managed range, €M)
Companies, institutions, micro businesses & self-employed 3, (turnover range, €M)
(1) There is a finer market segmentation (including, for instance, real estate developers and public sector & non-profits) not shown in the pyramid (2) Retail banking includes individuals, micro businesses, self-employed, retail establishments, freelance professionals and agribusinesses (3) Also including retail establishments, freelance professionals and agribusinesses
Customer breakdown by segment1:
(0.5)
Micro Businesses & self-employed 3 Individuals
Retail Banking2
Specialised sales staff
The largest customer base: 13.8 M
A highly segmented business model based on specialisation and quality of service
Segmentation is key to better serving client needs and to bolster business volumes
Premier Banking
Private Banking
Specialised network
(2)
Corporate & Institutional
Banking (200)
Int’l & Investments Activity and results At a glance Competitive stance Strategy Appendix
18
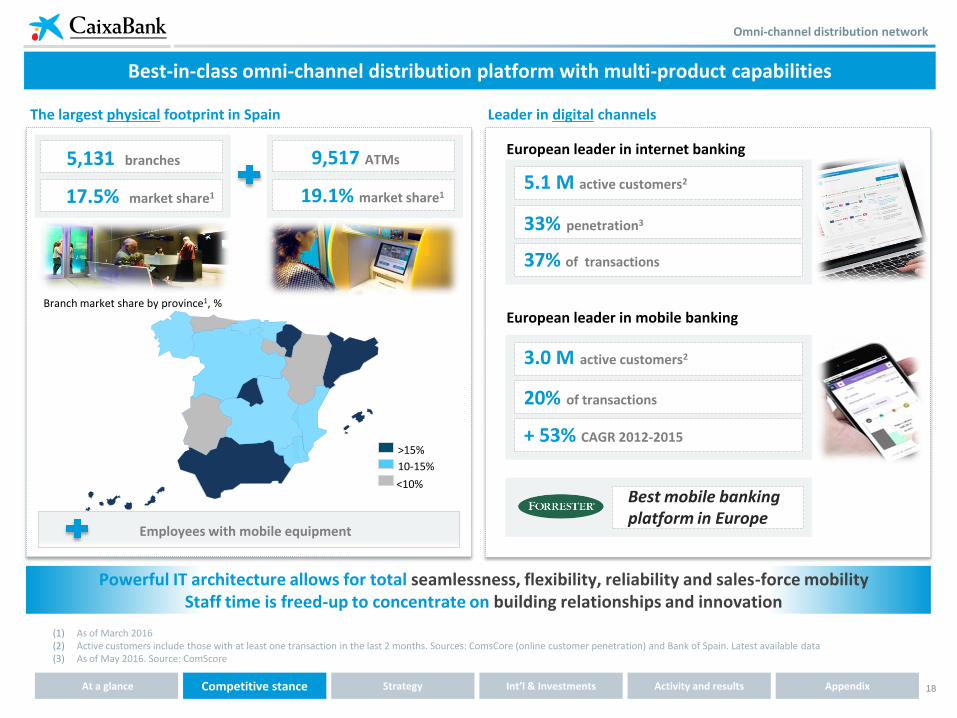
Omni-channel distribution network
Best-in-class omni-channel distribution platform with multi-product capabilities
Powerful IT architecture allows for total seamlessness, flexibility, reliability and sales-force mobility Staff time is freed-up to concentrate on building relationships and innovation
(1) As of March 2016 (2) Active customers include those with at least one transaction in the last 2 months. Sources: ComsCore (online customer penetration) and Bank of Spain. Latest available data (3) As of May 2016. Source: ComScore
5,131 branches
17.5% market share1
Branch market share by province1, %
The largest physical footprint in Spain
<10%
>15%
10-15%
Employees with mobile equipment
9,517 ATMs
19.1% market share1
Leader in digital channels
European leader in internet banking
5.1 M active customers2
37% of transactions
33% penetration3
European leader in mobile banking
3.0 M active customers2
+ 53% CAGR 2012-2015
20% of transactions
Best mobile banking platform in Europe
Int’l & Investments Activity and results At a glance Competitive stance Strategy Appendix
19
5,480
7,845
5,150
+2,365
+203
(2,898)
2007 Acquisitions 2007 PF with acquisitions
Open Closed 2Q16
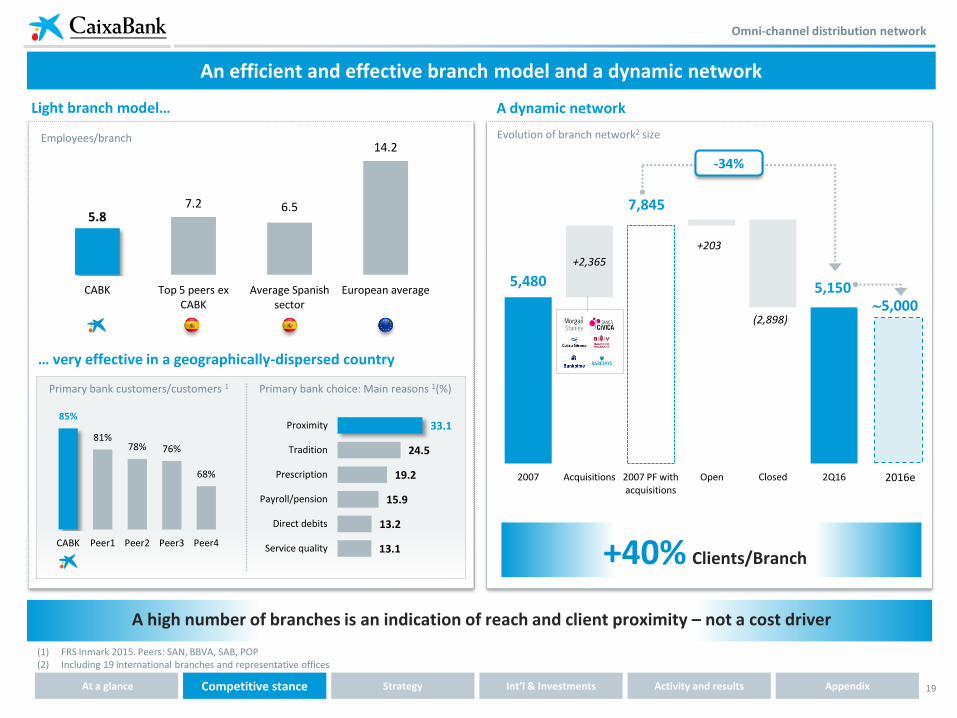
An efficient and effective branch model and a dynamic network
Omni-channel distribution network
5.8 7.2 6.5
14.2
CABK Top 5 peers ex CABK
Average Spanish sector
European average
Employees/branch
Light branch model…
… very effective in a geographically-dispersed country
13.1
13.2
15.9
19.2
24.5
33.1
Service quality
Direct debits
Payroll/pension
Prescription
Tradition
Proximity
Primary bank choice: Main reasons 1(%)
85%
81% 78% 76%
68%
CABK Peer1 Peer2 Peer3 Peer4
Primary bank customers/customers 1
A high number of branches is an indication of reach and client proximity – not a cost driver
(1) FRS Inmark 2015. Peers: SAN, BBVA, SAB, POP (2) Including 19 international branches and representative offices
Evolution of branch network2 size
2016e
5,000
-34%
A dynamic network
+40% Clients/Branch
Int’l & Investments Activity and results At a glance Competitive stance Strategy Appendix

20
CaixaFuturo
Private Banking
Premier Banking
Business Banking
Personalised saving strategy– Investment and Protection
Best private banking in Spain 2015 y 2016 Euromoney
AENOR conform certified
Preferred and personal service based on quality
Rapid implementation of our advisory model
Transforming branches into advisory hubs
New commercial protocols
Differentiated relationship
Reinforced capabilities
Redesigned tools and spaces
Advisory focus
Focus on the quality of service
Advisory
Int’l & Investments Activity and results At a glance Competitive stance Strategy Appendix
21
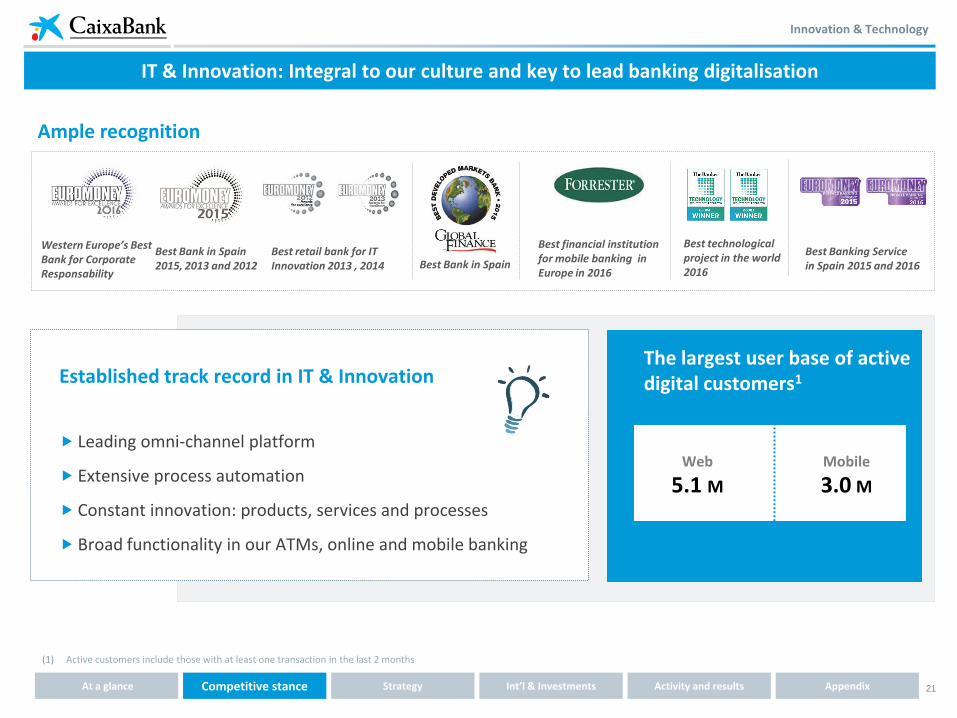
Innovation & Technology
IT & Innovation: Integral to our culture and key to lead banking digitalisation
(1) Active customers include those with at least one transaction in the last 2 months
Established track record in IT & Innovation
Leading omni-channel platform
Extensive process automation
Constant innovation: products, services and processes
Broad functionality in our ATMs, online and mobile banking
The largest user base of active digital customers1
Ample recognition
Web
5.1 M
Mobile
3.0 M
Best Bank in Spain Best Bank in Spain 2015, 2013 and 2012
Best financial institution for mobile banking in Europe in 2016
Best Banking Service in Spain 2015 and 2016
Best retail bank for IT Innovation 2013 , 2014
Western Europe’s Best Bank for Corporate Responsability
Best technological project in the world 2016
Int’l & Investments Activity and results At a glance Competitive stance Strategy Appendix

22
Focus on omni-channel banking reduces costs and increases client’s perceived value
(1) Total number of transactions in 1H16: 4,108M. A transaction is defined as any action initiated by a client through a contract with CaixaBank. (2) Click & Go loans represent 19% of total personal loans sold through CaixaBank network
21% 11% 9% 8% 7% 7%
20%
14% 10% 9% 8% 7%
41%
34%
29% 29% 30% 29%
18%
41% 52% 54% 54% 57%
2004 2009 2013 2014 2015 1H16
Digital channels gain importance Transactions by channel1 (%)
Internet &
Mobile
(Mobile: 20%)
Branches ATMs
POS terminals and
automated
...remaining complementary to the physical channel
… freeing up retail staff time to concentrate on building relationships, advisory and innovation
+ Quality
+ Convenience
+ Efficiency
Recently ranked as the best financial institution for mobile banking in Europe
Branches
ATMs
Online
Mobile
25% 39%
11% 25%
70% of Click & Go2 loans sales sold through electronic channels
Pre-approved instant consumer loan (Click & Go loans2) sales by channel, % of total sold 1H16
Int’l & Investments Activity and results At a glance Competitive stance Strategy Appendix
Innovation & Technology
23
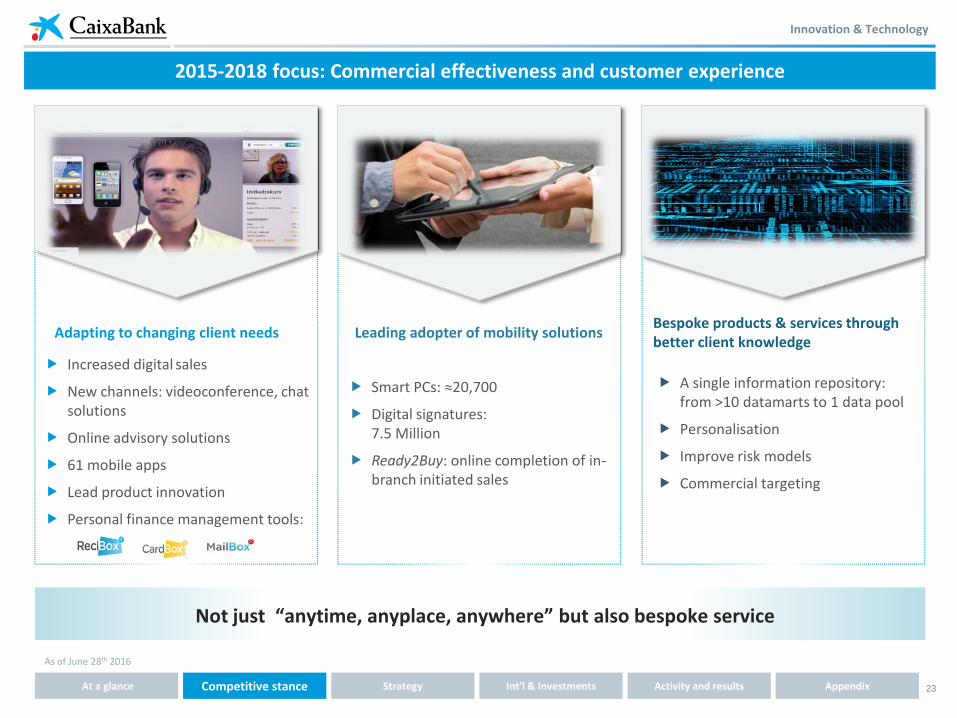
Increased digital sales
New channels: videoconference, chat solutions
Online advisory solutions
61 mobile apps
Lead product innovation
Personal finance management tools:
Adapting to changing client needs
Smart PCs: ≈20,700
Digital signatures: 7.5 Million
Ready2Buy: online completion of in-branch initiated sales
Leading adopter of mobility solutions Bespoke products & services through better client knowledge
A single information repository: from >10 datamarts to 1 data pool
Personalisation
Improve risk models
Commercial targeting
Not just “anytime, anyplace, anywhere” but also bespoke service
2015-2018 focus: Commercial effectiveness and customer experience
As of June 28th 2016
Innovation & Technology
Int’l & Investments Activity and results At a glance Competitive stance Strategy Appendix
24
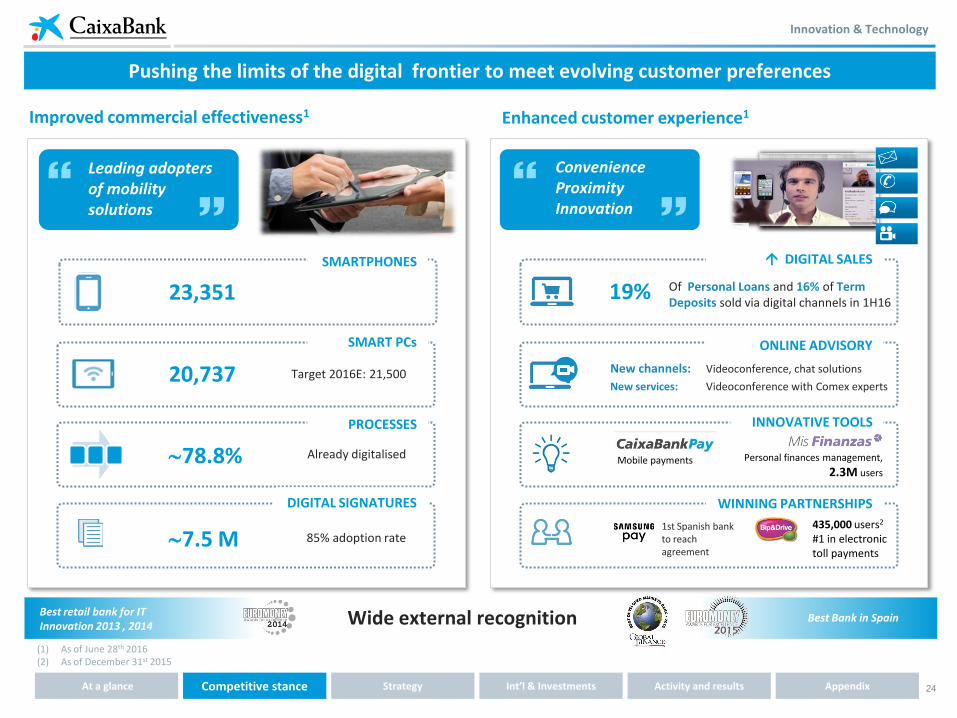
Improved commercial effectiveness1
Pushing the limits of the digital frontier to meet evolving customer preferences
Enhanced customer experience1
Leading adopters of mobility solutions
Convenience Proximity Innovation
Best retail bank for IT Innovation 2013 , 2014
Best Bank in Spain Wide external recognition
23,351
20,737
7.5 M
Target 2016E: 21,500
85% adoption rate
19% Of Personal Loans and 16% of Term Deposits sold via digital channels in 1H16
ONLINE ADVISORY
New channels: Videoconference, chat solutions
New services: Videoconference with Comex experts
INNOVATIVE TOOLS
Personal finances management,
2.3M users Mobile payments
435,000 users2
#1 in electronic toll payments
1st Spanish bank to reach agreement
SMARTPHONES DIGITAL SALES
SMART PCs
DIGITAL SIGNATURES WINNING PARTNERSHIPS
PROCESSES
78.8% Already digitalised
Innovation & Technology
(1) As of June 28th 2016 (2) As of December 31st 2015
Int’l & Investments Activity and results At a glance Competitive stance Strategy Appendix
25
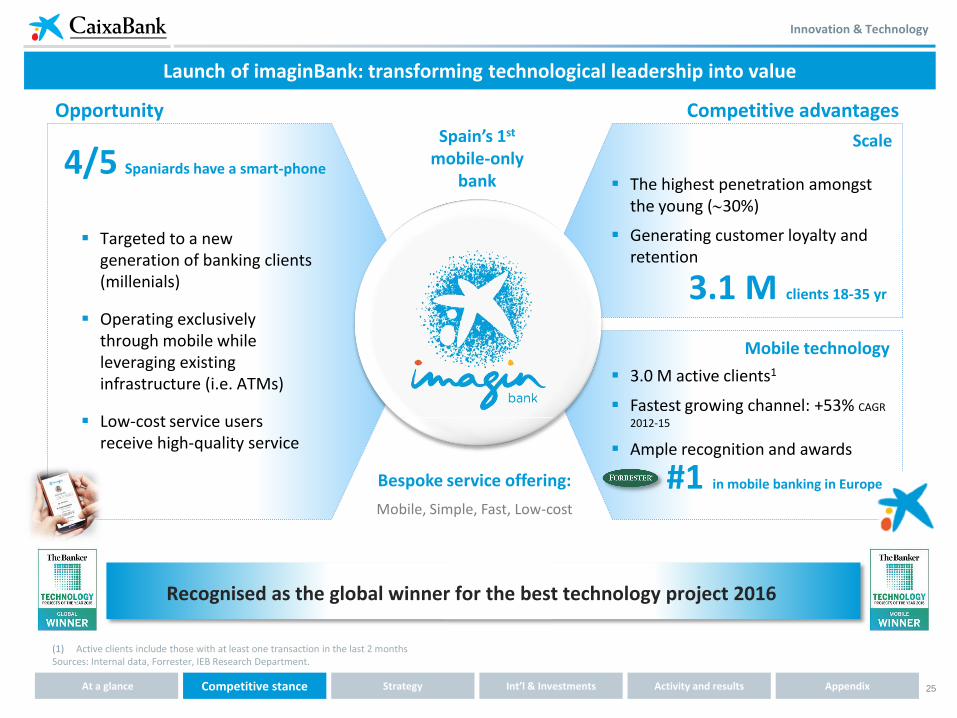
Launch of imaginBank: transforming technological leadership into value
Spain’s 1st mobile-only
bank
Targeted to a new generation of banking clients (millenials)
Operating exclusively through mobile while leveraging existing infrastructure (i.e. ATMs)
Low-cost service users receive high-quality service
4/5 Spaniards have a smart-phone
Bespoke service offering:
Mobile, Simple, Fast, Low-cost
Opportunity Competitive advantages
The highest penetration amongst the young (30%)
Generating customer loyalty and retention
3.1 M clients 18-35 yr
#1 in mobile banking in Europe
3.0 M active clients1
Fastest growing channel: +53% CAGR
2012-15
Ample recognition and awards
Scale
Mobile technology
Recognised as the global winner for the best technology project 2016
(1) Active clients include those with at least one transaction in the last 2 months Sources: Internal data, Forrester, IEB Research Department.
Innovation & Technology
Int’l & Investments Activity and results At a glance Competitive stance Strategy Appendix

26
Ownership preserved and growth fostered throughout the crisis
Integrated management of client savings and spending needs
Agile time-to-market
Flexibility in pricing, packaging and distribution
No conflicting views with partners
Through a single integrated distribution platform
Business Key figures 1H16 Company %
ownership
Life insurance €61bn Assets #1 in Spain
100%
Non-life insurance
€1.7bn premia(1) #1 in Health ins.(2)
49.9%
Asset management
€49.8bn AuM
#1 in Spain 100%
Consumer Finance
€1.5 Bn New business
€2.1 Bn assets 100%
Credit cards €31.5bn turnover
#1 in Spain 100%
Payments at point of sale
€18.8bn turnover
325,545 PoS 49%
Microcredit +64% new microcredit to households (yoy)(1)
100%
One-stop financial shop
(1) Latest available data (2) In Spain
A financial supermarket providing a one-stop shop for lifetime finance & insurance needs
Market-leading factories provide revenue diversification and benefits from scope
A key competitive advantage to lead to RoTE higher than peers
Int’l & Investments Activity and results At a glance Competitive stance Strategy Appendix
27
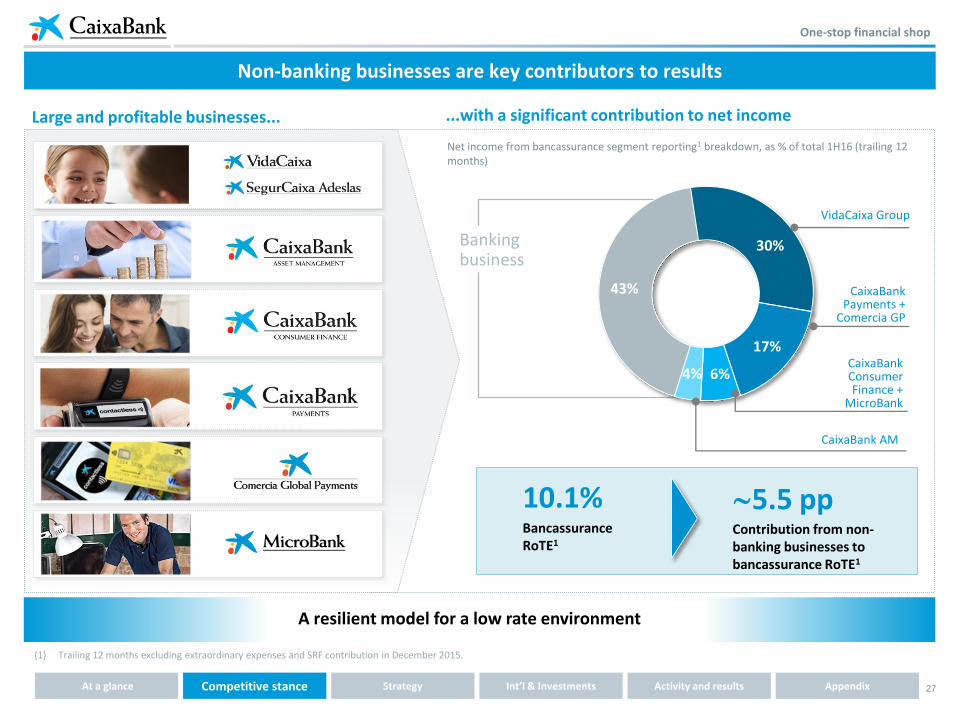
Non-banking businesses are key contributors to results
...with a significant contribution to net income
Net income from bancassurance segment reporting1 breakdown, as % of total 1H16 (trailing 12 months)
Large and profitable businesses...
(1) Trailing 12 months excluding extraordinary expenses and SRF contribution in December 2015.
Banking business
43%
30%
17%
6% 4%
VidaCaixa Group
CaixaBank Payments +
Comercia GP
CaixaBank AM
CaixaBank Consumer Finance +
MicroBank
10.1% Bancassurance RoTE1
5.5 pp Contribution from non-banking businesses to bancassurance RoTE1
A resilient model for a low rate environment
One-stop financial shop
Int’l & Investments Activity and results At a glance Competitive stance Strategy Appendix
28
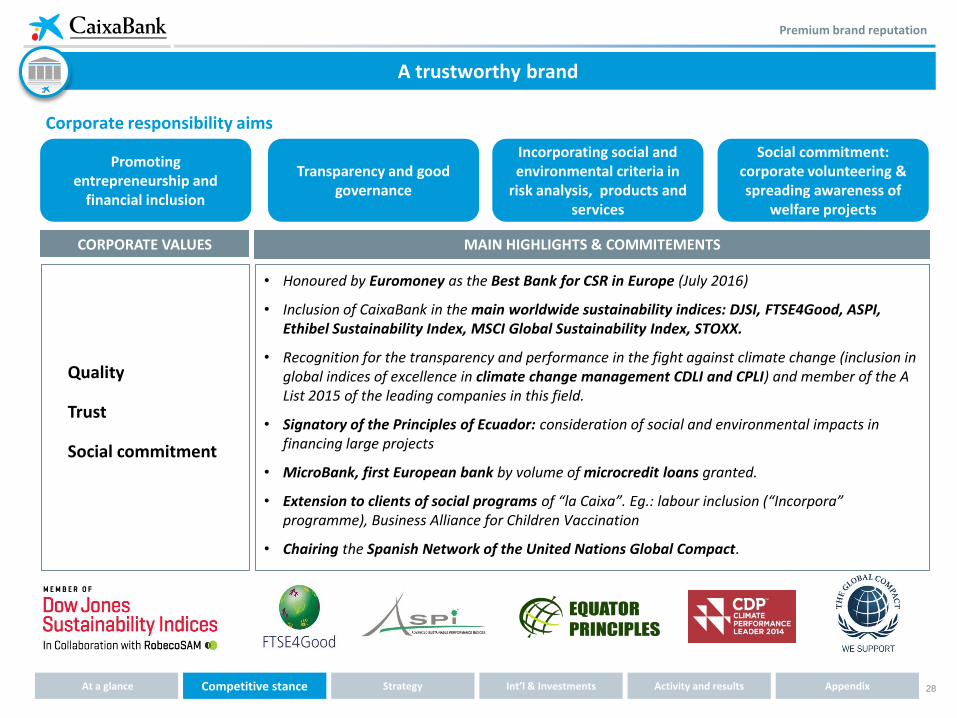
• Honoured by Euromoney as the Best Bank for CSR in Europe (July 2016)
• Inclusion of CaixaBank in the main worldwide sustainability indices: DJSI, FTSE4Good, ASPI, Ethibel Sustainability Index, MSCI Global Sustainability Index, STOXX.
• Recognition for the transparency and performance in the fight against climate change (inclusion in global indices of excellence in climate change management CDLI and CPLI) and member of the A List 2015 of the leading companies in this field.
• Signatory of the Principles of Ecuador: consideration of social and environmental impacts in financing large projects
• MicroBank, first European bank by volume of microcredit loans granted.
• Extension to clients of social programs of “la Caixa”. Eg.: labour inclusion (“Incorpora” programme), Business Alliance for Children Vaccination
• Chairing the Spanish Network of the United Nations Global Compact.
CORPORATE VALUES MAIN HIGHLIGHTS & COMMITEMENTS
Quality
Trust
Social commitment
Premium brand reputation
Promoting entrepreneurship and
financial inclusion
Transparency and good governance
Social commitment: corporate volunteering & spreading awareness of
welfare projects
Incorporating social and environmental criteria in
risk analysis, products and services
Corporate responsibility aims
A trustworthy brand
Int’l & Investments Activity and results At a glance Competitive stance Strategy Appendix

29
Strategic Plan [2015-2018]

30
Strategic Plan 2015-2018
Strategic priorities 2015-2018
Best-in-class in quality of service and reputation
Sustainable profitability above cost of capital
Optimisation of capital allocation
Enhance our leadership in banking digitalisation
Retain and attract the best talent
strategic priorities
Committed to trustworthy and profitable banking
5
Int’l & Investments Activity and results At a glance Competitive stance Strategy Appendix
31
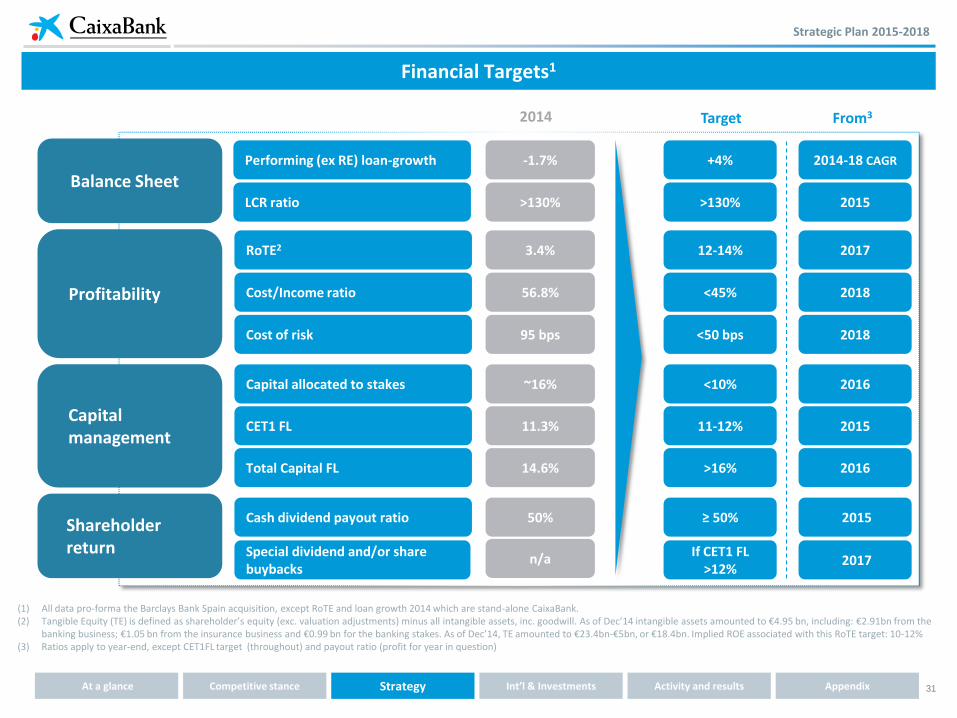
Financial Targets1
2014 Target From3
(1) All data pro-forma the Barclays Bank Spain acquisition, except RoTE and loan growth 2014 which are stand-alone CaixaBank. (2) Tangible Equity (TE) is defined as shareholder’s equity (exc. valuation adjustments) minus all intangible assets, inc. goodwill. As of Dec’14 intangible assets amounted to €4.95 bn, including: €2.91bn from the
banking business; €1.05 bn from the insurance business and €0.99 bn for the banking stakes. As of Dec’14, TE amounted to €23.4bn-€5bn, or €18.4bn. Implied ROE associated with this RoTE target: 10-12% (3) Ratios apply to year-end, except CET1FL target (throughout) and payout ratio (profit for year in question)
Profitability
Capital management
CET1 FL
Capital allocated to stakes
Cash dividend payout ratio
RoTE2
Total Capital FL
Cost/Income ratio
Cost of risk
Performing (ex RE) loan-growth
11-12%
<10%
≥ 50%
12-14%
>16%
<45%
<50 bps
+4%
Balance Sheet LCR ratio >130%
2015
2016
2015
2017
2016
2018
2018
2014-18 CAGR
2015
Shareholder return Special dividend and/or share
buybacks If CET1 FL
>12% 2017
11.3%
~16%
50%
3.4%
14.6%
56.8%
95 bps
-1.7%
>130%
n/a
Strategic Plan 2015-2018
Int’l & Investments Activity and results At a glance Competitive stance Strategy Appendix

32
↓ Cost to income
%
56.8% <45%
2014 PF 2018
2014 2017-2018
3.4%
12-14%
RoTE1
x4
Core income: NII+Fees
CoR normalisation C/I ratio, in %
Capital optimisation
95 <50
2014 PF 2018
Value distribution
Strong solvency & liquidity
6.4
~8
2014 PF 2018
€ bn
bps
16% <10%
2014PF 2016
Capital consumption of non-controlled stakes as % of total
6% CAGR
Note: 2014 data is pro forma the acquisition of Barclays Bank Spain (2014PF) except RoTE data, which corresponds to CaixaBank standalone (1) Breakdown of €4.95 bn of intangible assets as of December 2014: €2.91 bn from the banking business; €1.05 bn from the insurance business and €0.99 bn for banking stakes
RoTE to be boosted by improved operating performance and cost of risk normalisation
Strategic Plan 2015-2018
Int’l & Investments Activity and results At a glance Competitive stance Strategy Appendix

33
3.4%
12-14%
2.9% 1.1%
2.1%
2.1%
7.3%
1.9%
-6.6%
-1.3%
ROTE 2014 (CaixaBank standalone)
NII Fees Other income Operating costs Loan loss and other provisions
Loss on disposal of RE assets
Taxes Accumulated equity exceeding
11% target
ROTE 2017-2018
1
2
3
2
Higher core revenues
Lower provisioning and lower RE losses
Flat costs
(1) RoTE decomposition by change of contribution of P&L lines (2014 pro forma the acquisition of Barclays Bank Spain) as % of regulatory capital excluding intangibles. The item labelled “Accumulated equity exceeding 11% target” measures the decrease in RoTE associated with a higher capital base.
(2) Other income includes dividends and income from associates, trading income and “other income” as defined in quarterly reporting.
Increased revenues combined with a lower cost of risk are the key RoTE drivers1
Strategic Plan 2015-2018
Int’l & Investments Activity and results At a glance Competitive stance Strategy Appendix

34
Freeing up capital from equity portfolio and real estate exposure
Freeing up capital from the equity portfolio
Early and over-delivery of strategic ambition
2011
2014
2016
24%
16%
<7%
June
December
June
Capital allocated to non-controlled stakes, as % of total capital charge(1)
(1) Capital allocation defined as the capital consumption of the investment portfolio over total capital charge
Further optimisation with continued wind-down of RE NPAs
~11
<5
2014 PF Barclays 2018 Ambition
-60%
Over the life of the strategic plan
Ambition 2015-18: 60% net non-performing RE assets
OREO plus RE developer NPLs (net of provisions), €Bn
Strategic Plan 2015-2018
Int’l & Investments Activity and results At a glance Competitive stance Strategy Appendix
vs. Strategic target of
<10% by YE16
35
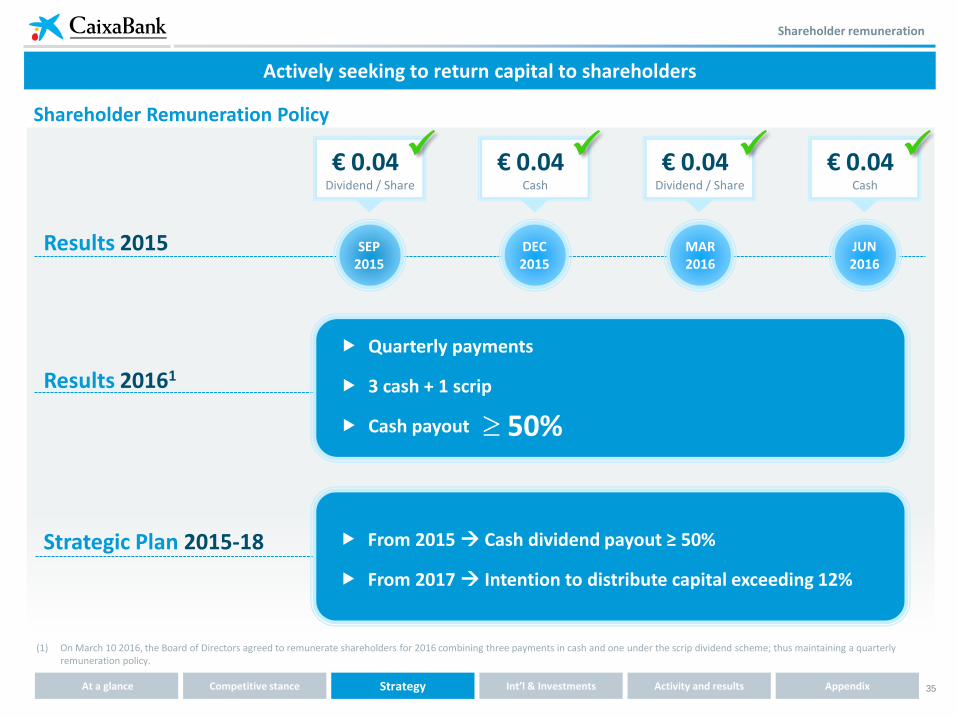
Results 20161
Shareholder remuneration
Actively seeking to return capital to shareholders
Shareholder Remuneration Policy
(1) On March 10 2016, the Board of Directors agreed to remunerate shareholders for 2016 combining three payments in cash and one under the scrip dividend scheme; thus maintaining a quarterly remuneration policy.
Results 2015 SEP 2015
DEC 2015
MAR 2016
JUN 2016
Dividend / Share
€ 0.04 Cash
€ 0.04 Dividend / Share
€ 0.04 Cash
€ 0.04
Quarterly payments
3 cash + 1 scrip
Cash payout 50%
Strategic Plan 2015-18
From 2015 Cash dividend payout ≥ 50%
From 2017 Intention to distribute capital exceeding 12%
Int’l & Investments Activity and results At a glance Competitive stance Strategy Appendix
36
International presence & [Investments]
37
Internationalisation
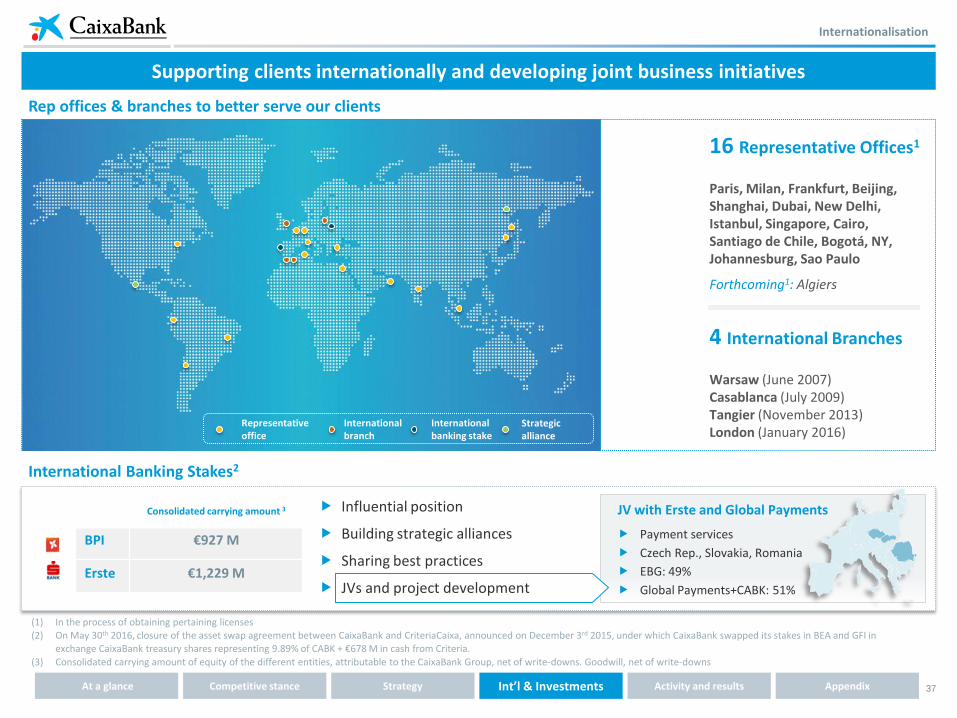
Supporting clients internationally and developing joint business initiatives
16 Representative Offices1
Paris, Milan, Frankfurt, Beijing, Shanghai, Dubai, New Delhi, Istanbul, Singapore, Cairo, Santiago de Chile, Bogotá, NY, Johannesburg, Sao Paulo
Forthcoming1: Algiers
4 International Branches
Warsaw (June 2007) Casablanca (July 2009) Tangier (November 2013) London (January 2016)
Rep offices & branches to better serve our clients
International Banking Stakes2
Consolidated carrying amount 3
BPI €927 M
Erste €1,229 M
(1) In the process of obtaining pertaining licenses (2) On May 30th 2016, closure of the asset swap agreement between CaixaBank and CriteriaCaixa, announced on December 3rd 2015, under which CaixaBank swapped its stakes in BEA and GFI in
exchange CaixaBank treasury shares representing 9.89% of CABK + €678 M in cash from Criteria.
(3) Consolidated carrying amount of equity of the different entities, attributable to the CaixaBank Group, net of write-downs. Goodwill, net of write-downs
JV with Erste and Global Payments
Payment services
Czech Rep., Slovakia, Romania
EBG: 49%
Global Payments+CABK: 51%
Influential position
Building strategic alliances
Sharing best practices
JVs and project development
Int’l & Investments Activity and results At a glance Competitive stance Strategy Appendix
Representative office
International branch
International banking stake
Strategic alliance
38
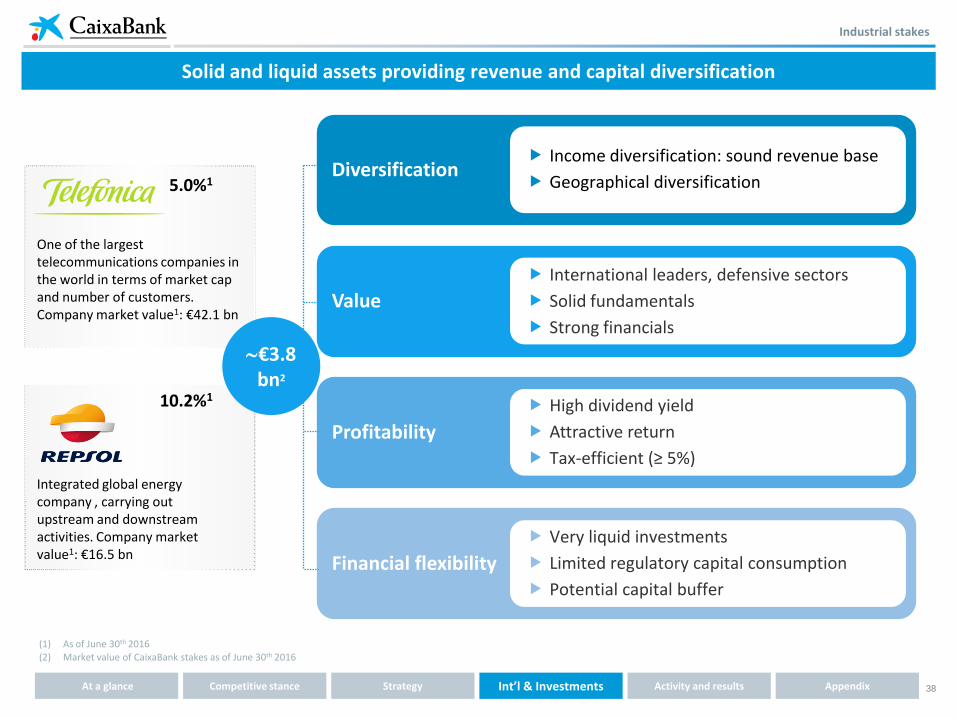
Industrial stakes
5.0%1
One of the largest telecommunications companies in the world in terms of market cap and number of customers. Company market value1: €42.1 bn
10.2%1
Integrated global energy company , carrying out upstream and downstream activities. Company market value1: €16.5 bn
(1) As of June 30th 2016 (2) Market value of CaixaBank stakes as of June 30th 2016
Diversification
Value
Profitability
Financial flexibility
Income diversification: sound revenue base
Geographical diversification
Very liquid investments
Limited regulatory capital consumption
Potential capital buffer
High dividend yield
Attractive return
Tax-efficient (≥ 5%)
International leaders, defensive sectors
Solid fundamentals
Strong financials
€3.8bn2
Solid and liquid assets providing revenue and capital diversification
Int’l & Investments Activity and results At a glance Competitive stance Strategy Appendix
39
Activity & results [1H 2016]

40
Earnings rebound as key operating metrics improve
2Q 2016 Highlights
Performing loan-book inflection confirmed (+1.6% ytd/+1.4% qoq)
Further growth in production of consumer and retail mortgage loans (58% and 46% yoy)
Sharp increase in customer funds (+2.7% ytd/+3.0% qoq)
Insurance (+8.4% ytd/+4.1% qoq) bolsters on-B/S funds and increases contribution to core business
Revenues grow on solid operating performance
Positive asset
quality trends continue
Solid capital metrics despite persistent market volatility: CET1 FL at 11.5% (-9 bps ytd); total FL capital at 14.7% (+6 bps ytd)
Rationalisation of non-controlled stakes and early delivery of strategic target:
closing of BEA/GFI disposal reduces capital consumption of stakes to <7% while TBVPS +0.5% qoq
Improvement in activity levels confirmed
1
2
3
Solid solvency
metrics and better capital allocation
4
Steady reduction in NPLs (-5.9% ytd/-2.0% qoq) with ratio down 56 bps ytd to 7.3%
Gradual decline in foreclosed RE assets confirmed (-1.9% ytd/-1.0% qoq)
Another quarter of profits on OREO sales: 3% over sale price in 1H
Net income up 34% qoq
NII stabilises as expected (+0.1% qoq)
Strict margin discipline on both funding and lending: deposit FB yields at 9 bps (-11bps qoq) and loan FB yields at 313 bps1 (+22bps qoq)
Fees show strong recovery across the board (+6.8% qoq)
Profits from VISA Europe disposal offset early retirement provisions
Recurrent costs keep trending down (-0.4% qoq)
CoR at 0.45%2 remains below year-end guidance (0.50%)
(1) Loans to the private sector (2) Trailing 12 months
Int’l & Investments Activity and results At a glance Competitive stance Strategy Appendix
41
Commercial activity
(1) Includes SICAVs and managed portfolios besides mutual funds (2) Includes, among other things, a subordinated bond issued by “la Caixa” (currently Criteria Caixa) as well as insurance contracts from Barclays (3) Mutual funds and pension plans
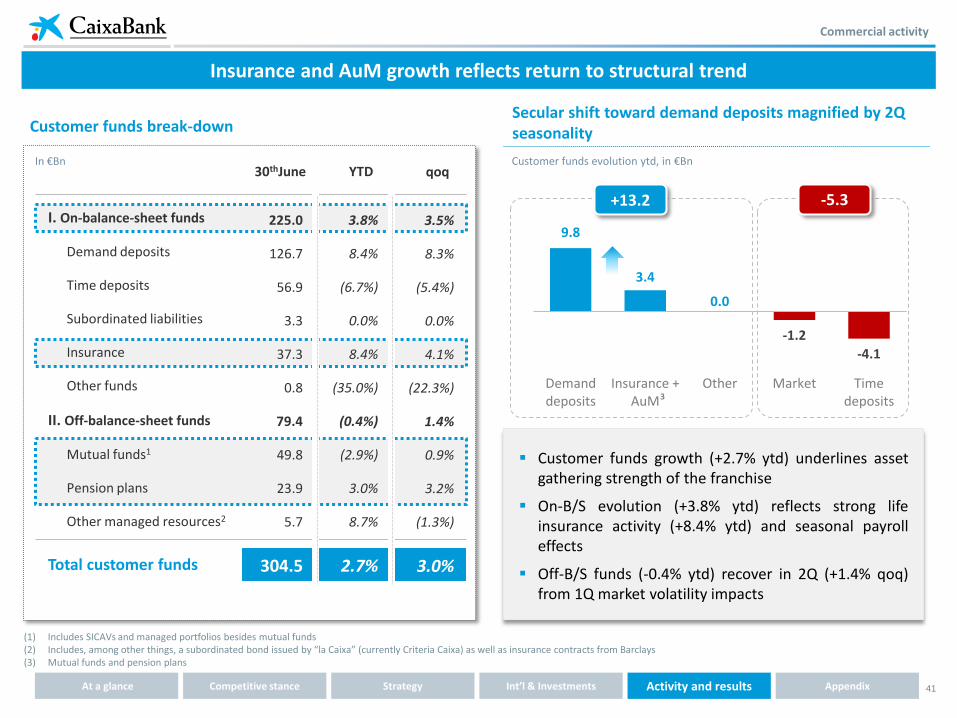
Secular shift toward demand deposits magnified by 2Q seasonality
Insurance and AuM growth reflects return to structural trend
Customer funds break-down
Customer funds evolution ytd, in €Bn
I. On-balance-sheet funds
Demand deposits
Time deposits
Subordinated liabilities
Insurance
Other funds
II. Off-balance-sheet funds
Mutual funds1
Pension plans
Other managed resources2
Total customer funds
225.0
126.7
56.9
3.3
37.3
0.8
79.4
49.8
23.9
5.7
304.5
30thJune
3.8%
8.4%
(6.7%)
0.0%
8.4%
(35.0%)
(0.4%)
(2.9%)
3.0%
8.7%
2.7%
YTD In €Bn
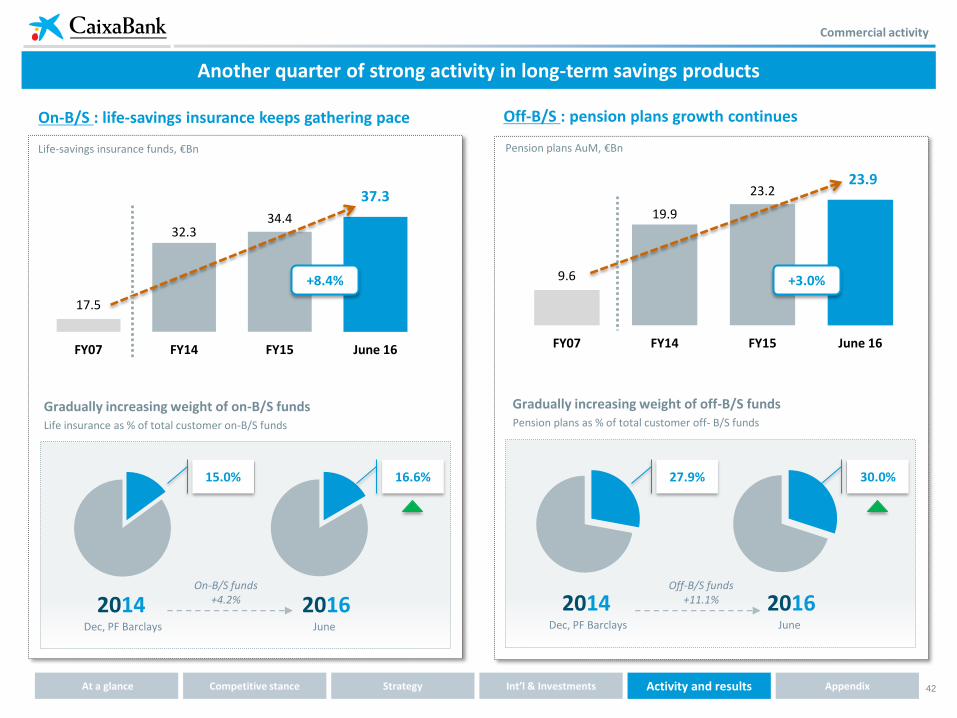
Customer funds growth (+2.7% ytd) underlines asset gathering strength of the franchise
On-B/S evolution (+3.8% ytd) reflects strong life insurance activity (+8.4% ytd) and seasonal payroll effects
Off-B/S funds (-0.4% ytd) recover in 2Q (+1.4% qoq) from 1Q market volatility impacts
3.5%
8.3%
(5.4%)
0.0%
4.1%
(22.3%)
1.4%
0.9%
3.2%
(1.3%)
3.0%
qoq
+13.2 -5.3
-4.1
-1.2
0.0
3.4
9.8
Time deposits
Market Other Insurance + AuM
Demand deposits 3
Int’l & Investments Activity and results At a glance Competitive stance Strategy Appendix
42
Another quarter of strong activity in long-term savings products
Commercial activity
2016 June
2014 Dec, PF Barclays
On-B/S : life-savings insurance keeps gathering pace
Life-savings insurance funds, €Bn
Off-B/S : pension plans growth continues
Pension plans AuM, €Bn
17.5
32.3 34.4
37.3
FY07 FY14 FY15 June 16
+8.4% 9.6
19.9
23.2 23.9
FY07 FY14 FY15 June 16
+3.0%
15.0%
Gradually increasing weight of on-B/S funds
16.6%
Life insurance as % of total customer on-B/S funds
Gradually increasing weight of off-B/S funds Pension plans as % of total customer off- B/S funds
2016 June
2014 Dec, PF Barclays
27.9% 30.0%
On-B/S funds +4.2%
Off-B/S funds +11.1%
Int’l & Investments Activity and results At a glance Competitive stance Strategy Appendix

43
Delivering steady market share growth in insurance and pensions
Commercial activity
Production, €Bn
Life-risk insurance Savings insurance and pension plans
Sources: INVERCO, ICEA
Production, €M
Market share in savings insurance and pension plans, %
Production2, €Bn
Market share2 in non-life, %
1H16
Market share in life-risk , %
Market share, % 1H16 Market share, % 1H16 +13% yoy +78% yoy +6% yoy +20% yoy CABK network3
+57 bps YTD
+677 bps since 2010
+306 bps YTD
+1,040 bps
since 2010
27.2% Health ins.
9.0% Household ins.
Non-life insurance
375 390 433 497
569 656
732
2010 2011 2012 2013 2014 2015 1H16 TTM
4.8
6.1 5.6
6.1 6.7
8.4
10.4
2010 2011 2012 2013 2014 2015 1H16 TTM
16.0%
22.8%
2010 Jun 16
5.8%
9.8%
2010 Jun 16
10.1%
20.5%
2010 Mar 16
1 1 1
1.9 2.0
2.4 2.6
2.8 3.0 3.1
2010 2011 2012 2013 2014 2015 1H16 TTM
(1) Trailing 12 months (2) Production and market share of SegurCaixa Adeslas (3) Production of CABK network accounts for 40% of total SegurCaixa Adeslas production in 1H16
Int’l & Investments Activity and results At a glance Competitive stance Strategy Appendix
44
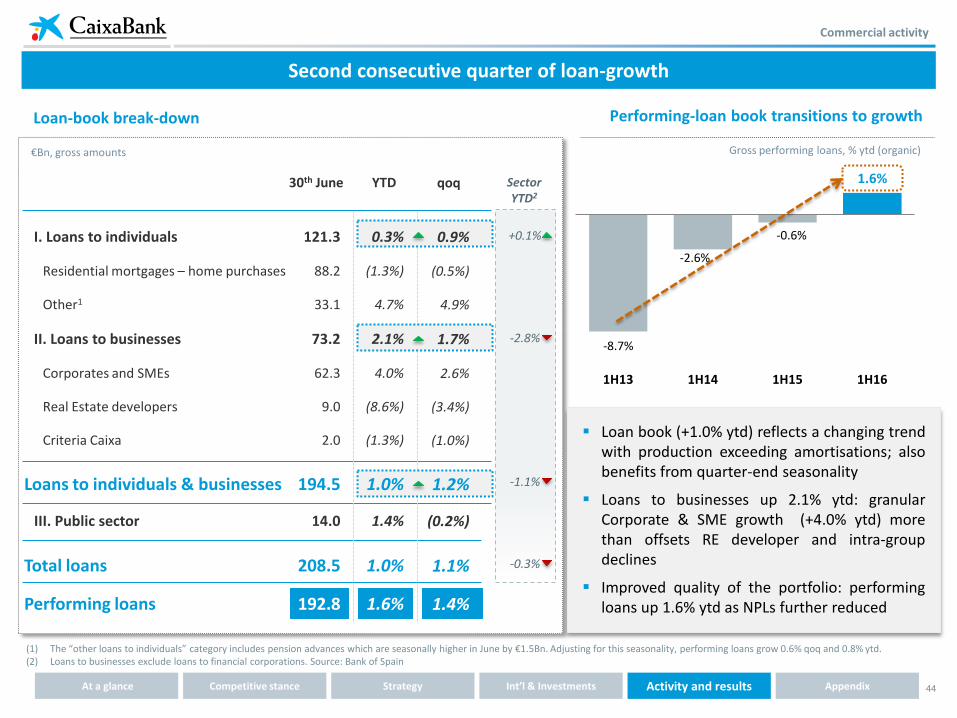
-8.7%
-2.6%
-0.6%
1.6%
1H13 1H14 1H15 1H16
I. Loans to individuals
Residential mortgages – home purchases
Other1
II. Loans to businesses
Corporates and SMEs
Real Estate developers
Criteria Caixa
Loans to individuals & businesses
III. Public sector
Total loans
Performing loans
30th June YTD
€Bn, gross amounts
qoq
Loan-book break-down
121.3
88.2
33.1
73.2
62.3
9.0
2.0
194.5
14.0
208.5
192.8
Performing-loan book transitions to growth
Gross performing loans, % ytd (organic)
Second consecutive quarter of loan-growth
Loan book (+1.0% ytd) reflects a changing trend with production exceeding amortisations; also benefits from quarter-end seasonality
Loans to businesses up 2.1% ytd: granular Corporate & SME growth (+4.0% ytd) more than offsets RE developer and intra-group declines
Improved quality of the portfolio: performing loans up 1.6% ytd as NPLs further reduced
(1) The “other loans to individuals” category includes pension advances which are seasonally higher in June by €1.5Bn. Adjusting for this seasonality, performing loans grow 0.6% qoq and 0.8% ytd. (2) Loans to businesses exclude loans to financial corporations. Source: Bank of Spain
Commercial activity
-2.8%
-1.1%
+0.1%
Sector YTD2
0.9%
(0.5%)
4.9%
1.7%
2.6%
(3.4%)
(1.0%)
1.2%
(0.2%)
1.1%
1.4%
0.3%
(1.3%)
4.7%
2.1%
4.0%
(8.6%)
(1.3%)
1.0%
1.4%
1.0%
1.6%
-0.3%
Int’l & Investments Activity and results At a glance Competitive stance Strategy Appendix

45
Positive production dynamics drive loan book and margin growth
Commercial activity
Loan production gathers pace
New lending growth, % 1H16 vs. 1H15
... with increasing margins
796 863
950 970
1,150
1,463
1Q15 2Q15 3Q15 4Q15 1Q16 2Q16
+27%
+70%
Consumer lending1
Residential mortgages
Corporate and SMEs
+58%
+46%
+24%
Loans to the private sector front book yields, bps qoq
Faster growth in higher yielding segments
(1) CaixaBank and MicroBank personal loans plus new lending by CaixaBank Consumer Finance (2) Front book yield includes CaixaBank and MicroBank personal loans but excludes CaixaBank Consumer Finance (3) Click & Go loans represent 19% of total personal loans sold through CaixaBank network
New consumer lending1 evolution, in €M
FB yield2
9%
+22
+10
+38
Total
Retail & SMEs
Corporate
25% online
Pre-approved instant consumer loan (Click & Go loans3) sales by channel, % of total sold 1H16
+194% yoy
Technology enables seamless combination of purchasing and financing decisions
39% branches
25% mobile 11% ATMs
Int’l & Investments Activity and results At a glance Competitive stance Strategy Appendix

46
Growth in lending to individuals further supported by better mortgage trends
Commercial activity
46% of 1H16 household mortgages at fixed rates
... also supported by slower mortgage deleveraging
Change in residential mortgages portfolio qoq in €Bn
-1.0 -1.0 -1.0
-1.1
-0.7
-0.4
1Q15 2Q15 3Q15 4Q15 1Q16 2Q16
New mortgages on clear upward trend
657
1,062
1,554
2Q14 2Q15 2Q16
+46%
+136%
... supported by positive macro dynamics
-6%
10%
16%
1H15 1H16 1H14
Sector data: housing sales1, % yoy
(1) Source: INE. For 1H16, growth for the period refers to Jan-May (latest available data)
New residential mortgages, €M
Outperforming the sector in credit to individuals
Loans to individuals, % ytd
0.3%
0.1%
Sector
FB yield
2%
Int’l & Investments Activity and results At a glance Competitive stance Strategy Appendix

47
Recovery in revenues and falling costs lead to significant bottom line improvement
1H16
Consolidated income statement1
(1) In relation to the income statement for 2015 and for 1Q 2016, Bank of Spain Circular 5/2014 has resulted in the restatement of gains and losses on the purchase and sale of foreign currency, which are no longer presented under Trading income, but under Net fee and commission income.
(2) Barclays Spain consolidated from 1st January 2015. 1H15 includes, among others, €602M of badwill from the Barclays Spain acquisition (including fair value adjustments of the assets and liabilities of Barclays); €64M of impairment due to asset obsolescence and €257M in restructuring costs associated with the Barclays Spain acquisition
yoy (%) In €M
Net interest income
Net fees and commissions1
Income from investments & associates
Trading income1
Income and exp. from insurance
Other operating income & exp.
Gross income
Recurring expenses
Extraordinary operating expenses
Pre-impairment income
Impairment losses & others
Gains/losses on assets disposals & others2
Pre-tax income
Income tax
Profit for the period
Minority interests
Profit attributable to the Group
(10.1)
(6.1)
(18.8)
(8.1)
38.3
(11.3)
(2.5)
3.9
(36.6)
59.4
(9.1)
(9.9)
2,041
1,010
400
593
140
(135)
4,049
(2,002)
0
2,047
(912)
(247)
888
(243)
645
7
638
2,270
1,076
492
647
101
(22)
4,564
(2,053)
(541)
1,970
(1,439)
26
557
152
709
1
708
0.1
6.8
91.9
22.0
18.6
47.4
10.7
(0.4)
22.7
22.5
(13.7)
35.9
38.3
35.0
34.0
qoq (%) NII stabilises as lower funding costs and loan
growth offset Euribor repricing
Fees (+6.8% qoq) back to sustainable levels after an exceptionally low 1Q
TEF dividend and solid Erste results more than compensate for BEA/GFI sale
VISA Europe disposal grows trading income while 2Q contribution to SRF impacts other operating expenses
Cost discipline brings recurring cost base below €1bn/quarter
CoR down by half in 12 months, from 88 bps in 2Q15 to 45 bps (-13 bps qoq)
Early retirements affect charges to other provisions
Gains/losses on disposals continues to improve on profits from RE sales and absence of 1Q one-offs (REP bond conversion)
Well-entrenched improvement below the line
Solid operating performance
1H15
Financial results
Int’l & Investments Activity and results At a glance Competitive stance Strategy Appendix
48
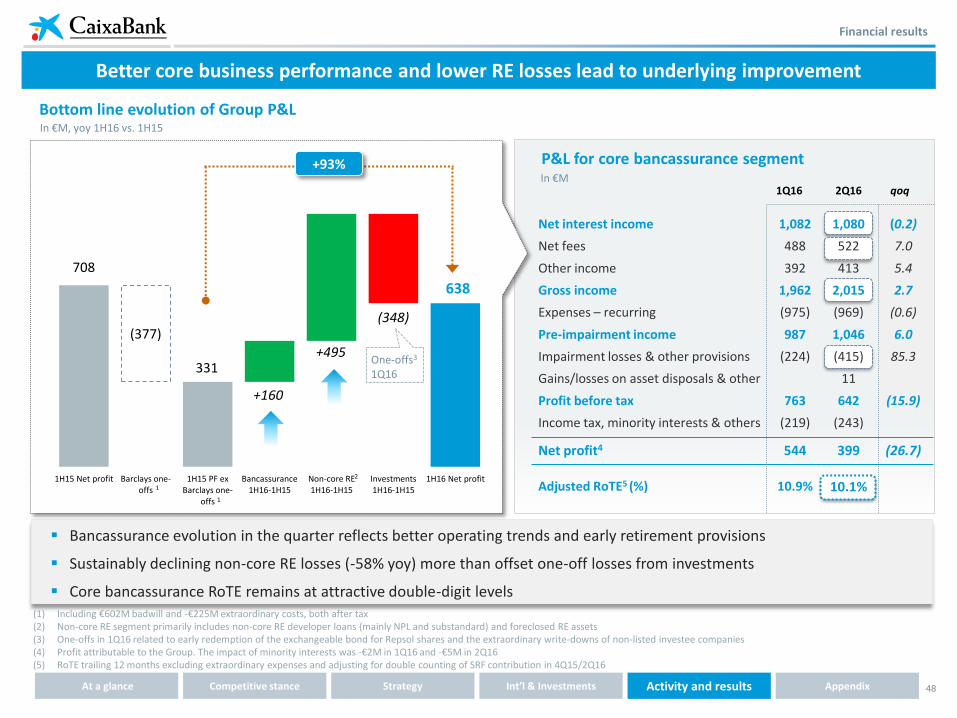
Better core business performance and lower RE losses lead to underlying improvement
Financial results
(1) Including €602M badwill and -€225M extraordinary costs, both after tax (2) Non-core RE segment primarily includes non-core RE developer loans (mainly NPL and substandard) and foreclosed RE assets (3) One-offs in 1Q16 related to early redemption of the exchangeable bond for Repsol shares and the extraordinary write-downs of non-listed investee companies (4) Profit attributable to the Group. The impact of minority interests was -€2M in 1Q16 and -€5M in 2Q16 (5) RoTE trailing 12 months excluding extraordinary expenses and adjusting for double counting of SRF contribution in 4Q15/2Q16
Bottom line evolution of Group P&L In €M, yoy 1H16 vs. 1H15
Net interest income
Net fees
Other income
Gross income
Expenses – recurring
Pre-impairment income
Impairment losses & other provisions
Gains/losses on asset disposals & other
Profit before tax
Income tax, minority interests & others
Net profit4
Adjusted RoTE5 (%)
2Q16 1Q16
1,082
488
392
1,962
(975)
987
(224)
763
(219)
544
10.9%
(0.2)
7.0
5.4
2.7
(0.6)
6.0
85.3
(15.9)
(26.7)
qoq
Bancassurance evolution in the quarter reflects better operating trends and early retirement provisions
Sustainably declining non-core RE losses (-58% yoy) more than offset one-off losses from investments
Core bancassurance RoTE remains at attractive double-digit levels
1,080
522
413
2,015
(969)
1,046
(415)
11
642
(243)
399
10.1%
In €M
P&L for core bancassurance segment
2
1
1
708
331
638
(377)
+160
+495
(348)
1H15 Net profit Barclays one-offs
1H15 PF ex Barclays one-
offs
Bancassurance 1H16-1H15
Non-core RE 1H16-1H15
Investments 1H16-1H15
1H16 Net profit
One-offs3 1Q16
+93%
Int’l & Investments Activity and results At a glance Competitive stance Strategy Appendix
49
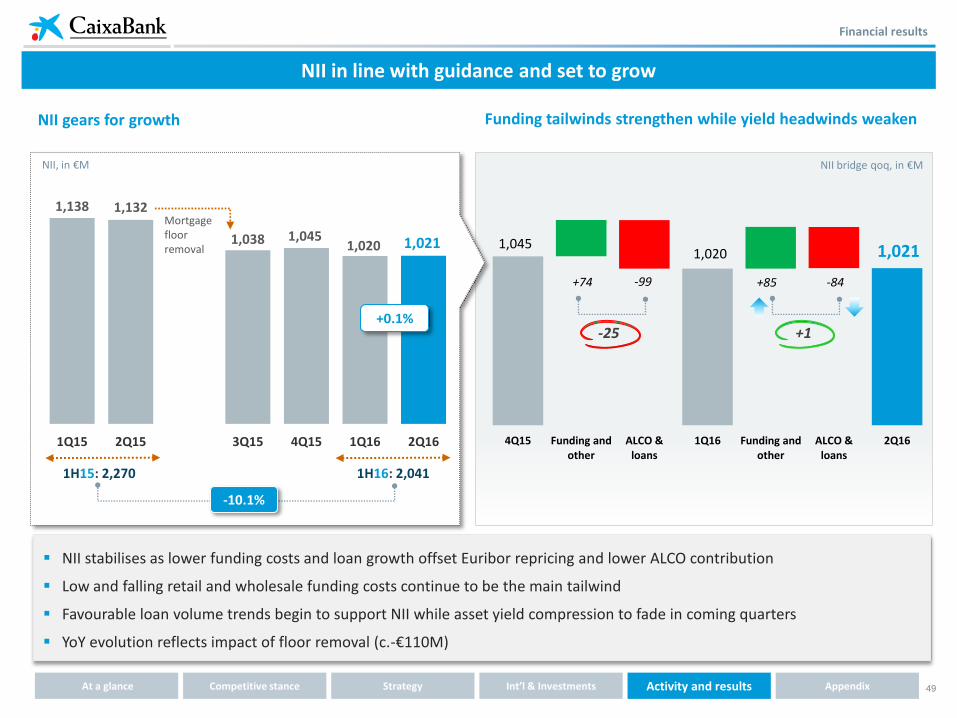
NII in line with guidance and set to grow
NII gears for growth
1,138 1,132
1,038 1,045 1,020 1,021
1Q15 2Q15 3Q15 4Q15 1Q16 2Q16
+0.1%
NII bridge qoq, in €M
NII, in €M
Funding tailwinds strengthen while yield headwinds weaken
NII stabilises as lower funding costs and loan growth offset Euribor repricing and lower ALCO contribution
Low and falling retail and wholesale funding costs continue to be the main tailwind
Favourable loan volume trends begin to support NII while asset yield compression to fade in coming quarters
YoY evolution reflects impact of floor removal (c.-€110M)
Mortgage floor removal 1,045
1,020 1,021
+74 -99 +85 -84
4Q15 Funding and other
ALCO & loans
1Q16 Funding and other
ALCO & loans
2Q16
+1 -25
1H15: 2,270 1H16: 2,041
-10.1%
Financial results
Int’l & Investments Activity and results At a glance Competitive stance Strategy Appendix
50
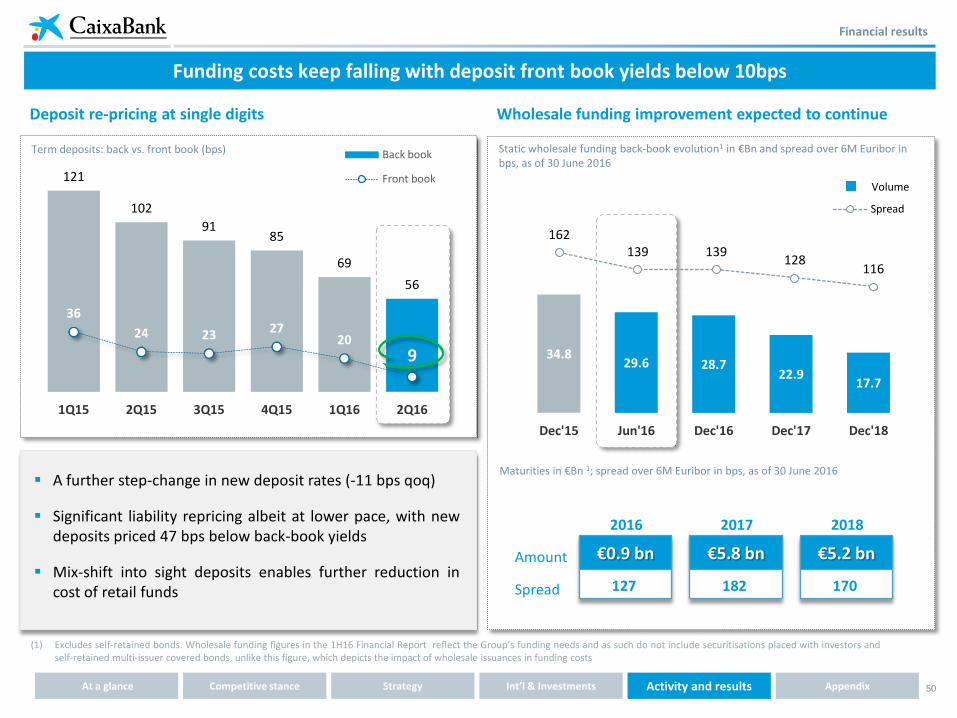
€0.9 bn
2016
127 Spread
€5.8 bn
2017
182
€5.2 bn
2018
170
Amount
Maturities in €Bn 1; spread over 6M Euribor in bps, as of 30 June 2016
162 139 139
128 116
Spread
(1) Excludes self-retained bonds. Wholesale funding figures in the 1H16 Financial Report reflect the Group’s funding needs and as such do not include securitisations placed with investors and self-retained multi-issuer covered bonds, unlike this figure, which depicts the impact of wholesale issuances in funding costs
Funding costs keep falling with deposit front book yields below 10bps
Static wholesale funding back-book evolution1 in €Bn and spread over 6M Euribor in bps, as of 30 June 2016
Wholesale funding improvement expected to continue Deposit re-pricing at single digits
Term deposits: back vs. front book (bps)
A further step-change in new deposit rates (-11 bps qoq)
Significant liability repricing albeit at lower pace, with new deposits priced 47 bps below back-book yields
Mix-shift into sight deposits enables further reduction in cost of retail funds
Volume
34.8 29.6 28.7
22.9 17.7
Dec'15 Jun'16 Dec'16 Dec'17 Dec'18
121
102
91 85
69
56
36
24 23 27 20
9
1Q15 2Q15 3Q15 4Q15 1Q16 2Q16
Back book
Front book
Financial results
Int’l & Investments Activity and results At a glance Competitive stance Strategy Appendix
51
(1) Banking book fixed-income securities portfolio, excluding trading book assets and liquidity management portfolio of €3.9 Bn, as of the end of the quarter. As part of its ALCO management CaixaBank holds a portfolio of fixed income investments including, among others, bonds guaranteed by the Kingdom of Spain such as ICO, FADE, FROB and others); ESM bonds; as well as Spanish covered bonds. The sovereign bond portfolio is made up mostly of Spanish and Italian government bonds.
(2) Peers include Bankia, Bankinter, BBVA Spain + RE business, Popular, Sabadell (ex TSB). Latest available data: CaixaBank, Bankia, Bankinter and Sabadell (ex TSB) as of 2Q16; other peers as of 1Q16. Sources: Based on company information
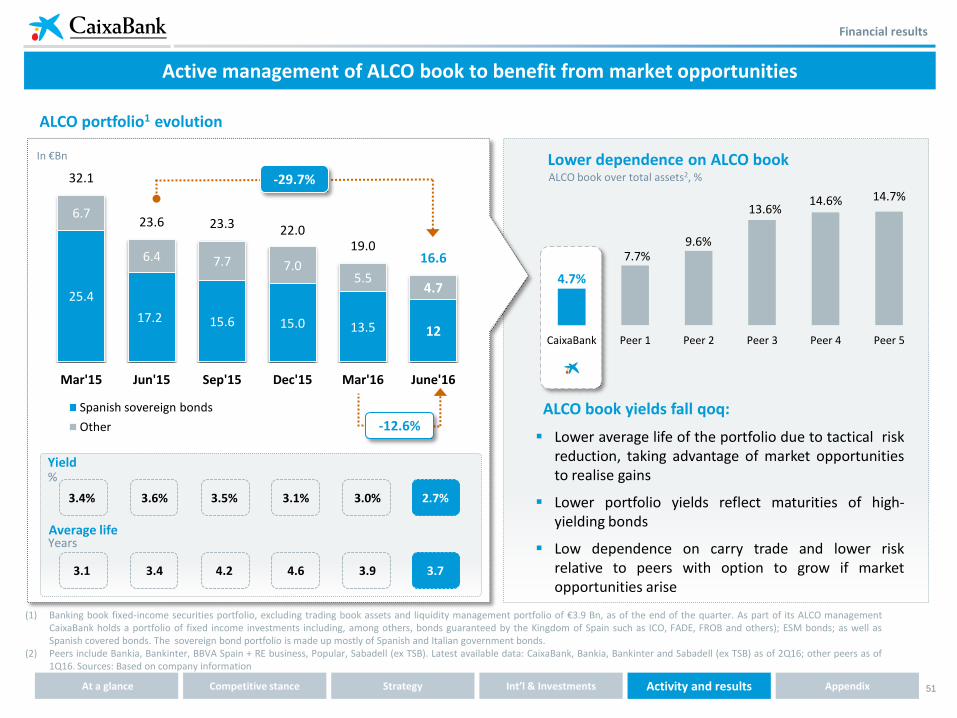
Active management of ALCO book to benefit from market opportunities
ALCO portfolio1 evolution
25.4
17.2 15.6 15.0 13.5 12
6.7
6.4 7.7 7.0 5.5
4.7
32.1
23.6 23.3 22.0 19.0
16.6
Mar'15 Jun'15 Sep'15 Dec'15 Mar'16 June'16
Spanish sovereign bonds
Other
In €Bn
ALCO book yields fall qoq:
Lower average life of the portfolio due to tactical risk reduction, taking advantage of market opportunities to realise gains
Lower portfolio yields reflect maturities of high-yielding bonds
Low dependence on carry trade and lower risk relative to peers with option to grow if market opportunities arise
4.7%
7.7% 9.6%
13.6% 14.6% 14.7%
CaixaBank Peer 1 Peer 2 Peer 3 Peer 4 Peer 5
Lower dependence on ALCO book ALCO book over total assets2, %
3.4% 3.6% 3.5% 3.1% 3.0% 2.7%
3.1 3.4 4.2 4.6 3.9 3.7
Average life Years
Yield %
-29.7%
-12.6%
Financial results
Int’l & Investments Activity and results At a glance Competitive stance Strategy Appendix

52
Loan-book yields
FB (ex public sector) up 22 bps qoq and accretive to the BB underpinned by mix shift to higher-yielding segments
BB yields down -10 bps qoq still dragged by Euribor repricing (-5 bps), commercial flows and other
Asset yield compression expected to fade in coming quarters
In bps
(1) The cost of customer funds reflects the cost of both demand and time deposits, as well as repos with retail clients. Excludes the cost of institutional issuance and subordinated liabilities
Front book yields in loan portfolio are widening
Margins supported by steady liability repricing
Customer funds1 Loans and credits Customer spread
Customer spread, in %
2.16 2.18 2.03 2.06 2.07 2.04
1Q15 2Q15 3Q15 4Q15 1Q16 2Q16
2.80 2.70 2.47 2.47 2.38 2.28
0.64 0.52 0.44 0.41 0.31 0.24
NIM, in %
1.32 1.33 1.23 1.21 1.20 1.21
1Q15 2Q15 3Q15 4Q15 1Q16 2Q16
Customer spread declines slightly on lower BB asset yields
NIM slightly up as disposal of BEA/GFI reduces proportion of non-interest bearing assets in balance sheet
280 270 247 247 238 228
293 311 305
283 291
313
1Q15 2Q15 3Q15 4Q15 1Q16 2Q16
Back book
Front book ex public sector
Financial results
Int’l & Investments Activity and results At a glance Competitive stance Strategy Appendix

53
Insurance and pension fees on an upward trend
Banking and other fees
Mutual funds
Pension plans
Insurance distribution fees
yoy (%) 1H16
646
196
89
79
(11.1)
(4.9)
22.0
12.1
qoq (%)
8.1
1.9
12.2
3.6
Net fees breakdown, €M
Fees show strong recovery in the quarter
Improvement across the board in 2Q
Net fee income1, €M
(1) In relation to the income statement for 2015 and for 1Q 2016, Bank of Spain Circular 5/2014 has resulted in the restatement of gains and losses on the purchase and sale of foreign currency, which are no longer presented under Trading income, but under Net fee and commission income.
Net fees recover sustainable levels after an exceptionally low 1Q
Asset management and insurance fees grow +4.1% yoy, with a rising contribution to total fees (+3 pp yoy)
+6.8%
1H15: 1,076 1H16: 1,010
Insurance + AuM revenues offsetting lower banking fees
Revenues from insurance (ex trading income) and AM activity vs. banking fees, €M
726 646
636 712
1,362 1,358
Banking fees
Revenues from insurance and AuM activity
1H15 1H16
+12%
-11%
-0.3%
538 538 524
515
488
522
+26
+8
1Q15 2Q15 3Q15 4Q15 1Q16 Banking AuM + insurance
2Q16
Financial results
-6.1%
Int’l & Investments Activity and results At a glance Competitive stance Strategy Appendix
54
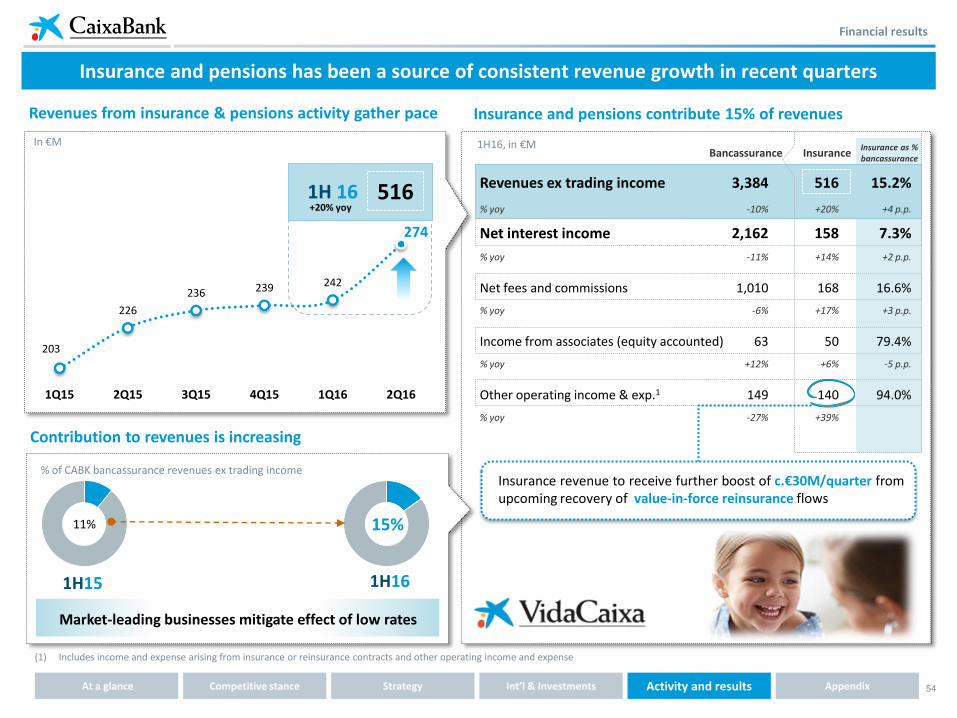
Insurance and pensions has been a source of consistent revenue growth in recent quarters
203
226
236 239 242
274
1Q15 2Q15 3Q15 4Q15 1Q16 2Q16
Revenues from insurance & pensions activity gather pace
11% 15%
% of CABK bancassurance revenues ex trading income
Market-leading businesses mitigate effect of low rates
Bancassurance 1H16, in €M Insurance as %
bancassurance Insurance
Revenues ex trading income
% yoy
Net interest income
% yoy
Net fees and commissions
% yoy
Income from associates (equity accounted)
% yoy
Other operating income & exp.1
% yoy
3,384
-10%
2,162
-11%
1,010
-6%
63
+12%
149
-27%
516
+20%
158
+14%
168
+17%
50
+6%
140
+39%
15.2%
+4 p.p.
7.3%
+2 p.p.
16.6%
+3 p.p.
79.4%
-5 p.p.
94.0%
Insurance and pensions contribute 15% of revenues
1H15 1H16
Contribution to revenues is increasing
Insurance revenue to receive further boost of c.€30M/quarter from upcoming recovery of value-in-force reinsurance flows
516 1H 16 +20% yoy
Financial results
In €M
(1) Includes income and expense arising from insurance or reinsurance contracts and other operating income and expense
Int’l & Investments Activity and results At a glance Competitive stance Strategy Appendix
55
Financial results
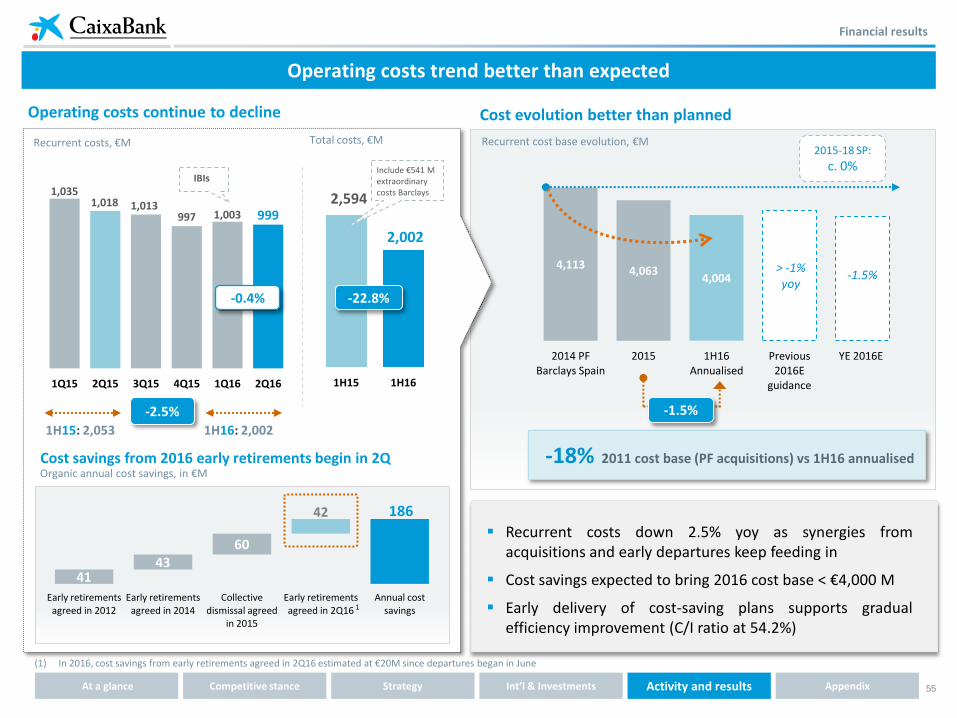
Operating costs trend better than expected
Operating costs continue to decline
Recurrent costs, €M Total costs, €M
1H15 1H16
-22.8%
2,594
2,002
Include €541 M extraordinary costs Barclays
-2.5%
1,035 1,018 1,013
997 1,003 999
1Q15 2Q15 3Q15 4Q15 1Q16 2Q16
IBIs
-0.4%
Cost savings from 2016 early retirements begin in 2Q
186
41 43
60
42
Early retirements agreed in 2012
Early retirements agreed in 2014
Collective dismissal agreed
in 2015
Early retirements agreed in 2Q16
Annual cost savings
Organic annual cost savings, in €M
1H15: 2,053 1H16: 2,002
Cost evolution better than planned
Recurrent cost base evolution, €M
4,113 4,063 4,004 3.999
2014 PF Barclays Spain
2015 1H16 Annualised
Previous 2016E
guidance
YE 2016E
> -1% yoy
-1.5%
2015-18 SP:
c. 0%
Recurrent costs down 2.5% yoy as synergies from acquisitions and early departures keep feeding in
Cost savings expected to bring 2016 cost base < €4,000 M
Early delivery of cost-saving plans supports gradual efficiency improvement (C/I ratio at 54.2%)
-18% 2011 cost base (PF acquisitions) vs 1H16 annualised
-1.5%
1
(1) In 2016, cost savings from early retirements agreed in 2Q16 estimated at €20M since departures began in June
Int’l & Investments Activity and results At a glance Competitive stance Strategy Appendix
56
Financial results
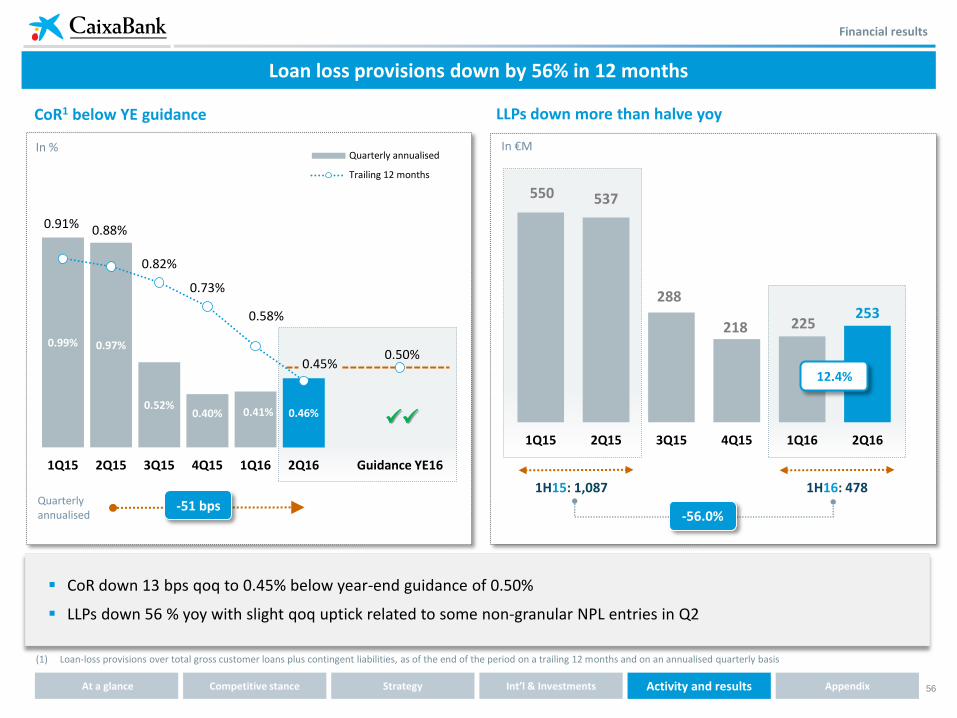
(1) Loan-loss provisions over total gross customer loans plus contingent liabilities, as of the end of the period on a trailing 12 months and on an annualised quarterly basis
Loan loss provisions down by 56% in 12 months
0.99% 0.97%
0.52% 0.40% 0.41% 0.46%
0.91% 0.88%
0.82%
0.73%
0.58%
0.45% 0.50%
1Q15 2Q15 3Q15 4Q15 1Q16 2Q16 Guidance YE16
Quarterly annualised
Trailing 12 months
In %
CoR1 below YE guidance
Quarterly annualised
LLPs down more than halve yoy
In €M
1H15: 1,087 1H16: 478
-56.0% -51 bps
CoR down 13 bps qoq to 0.45% below year-end guidance of 0.50%
LLPs down 56 % yoy with slight qoq uptick related to some non-granular NPL entries in Q2
550 537
288
218 225 253
1Q15 2Q15 3Q15 4Q15 1Q16 2Q16
12.4%
Int’l & Investments Activity and results At a glance Competitive stance Strategy Appendix
57
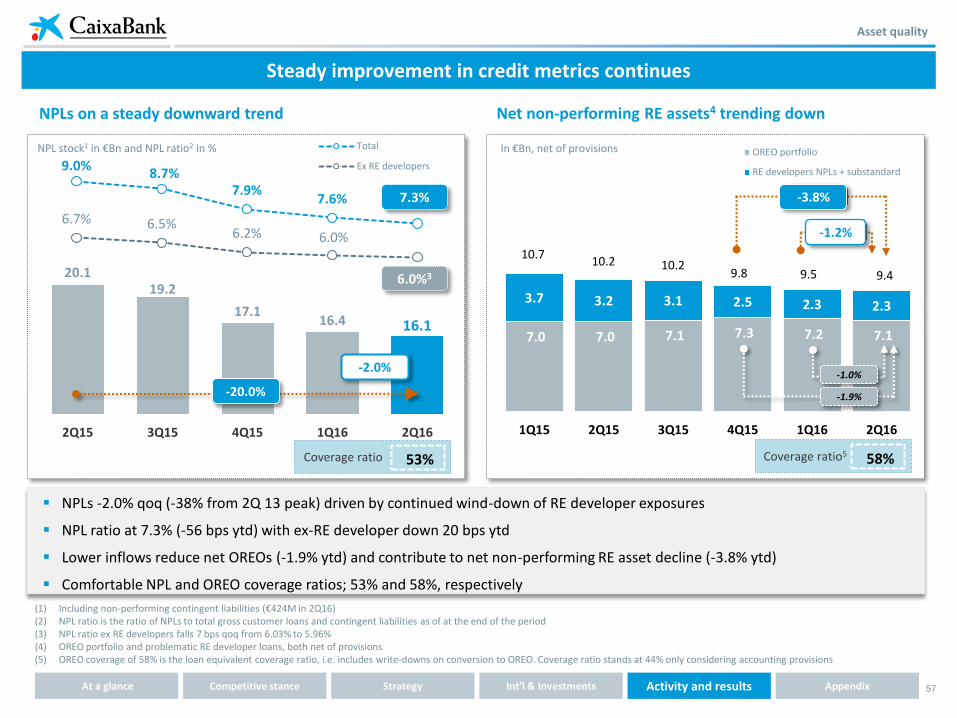
NPLs on a steady downward trend
Asset quality
Steady improvement in credit metrics continues
Net non-performing RE assets4 trending down
(1) Including non-performing contingent liabilities (€424M in 2Q16) (2) NPL ratio is the ratio of NPLs to total gross customer loans and contingent liabilities as of at the end of the period (3) NPL ratio ex RE developers falls 7 bps qoq from 6.03% to 5.96% (4) OREO portfolio and problematic RE developer loans, both net of provisions (5) OREO coverage of 58% is the loan equivalent coverage ratio, i.e. includes write-downs on conversion to OREO. Coverage ratio stands at 44% only considering accounting provisions
NPLs -2.0% qoq (-38% from 2Q 13 peak) driven by continued wind-down of RE developer exposures
NPL ratio at 7.3% (-56 bps ytd) with ex-RE developer down 20 bps ytd
Lower inflows reduce net OREOs (-1.9% ytd) and contribute to net non-performing RE asset decline (-3.8% ytd)
Comfortable NPL and OREO coverage ratios; 53% and 58%, respectively
NPL stock1 in €Bn and NPL ratio2 in %
20.1 19.2
17.1 16.4 16.1
2Q15 3Q15 4Q15 1Q16 2Q16
-2.0%
-20.0%
7.3%
6.0%3
In €Bn, net of provisions
7.0 7.0 7.1 7.3 7.2 7.1
3.7 3.2 3.1 2.5 2.3 2.3
10.7 10.2 10.2
9.8 9.5 9.4
1Q15 2Q15 3Q15 4Q15 1Q16 2Q16
OREO portfolio
RE developers NPLs + substandard
-3.8%
-1.2%
-1.0%
-1.9%
53% Coverage ratio 58% Coverage ratio5
9.0% 8.7%
7.9% 7.6%
6.7% 6.5% 6.2% 6.0%
Total
Ex RE developers
Int’l & Investments Activity and results At a glance Competitive stance Strategy Appendix

58
Asset quality
(1) Revenue of RE sales (2) Source: CaixaBank Research forecasts and Spanish Government data
An additional quarter of RE profits with increased sales
Robust and profitable sales with a positive outlook
Disposals, in €M
1
+20% Sales 2Q16 vs. 1Q16
651 610
395
217
Sales Rental
1H15 1H16
Profits, as % of sale price
-11%
+3% +14pp
1H15 1H16
-12%
-9%
-6%
-3%
0%
3%
6%
Mar-10 Sep-11 Mar-13 Sep-14 Mar-16
Spanish housing prices evolution and outlook2, % yoy
RE inflows on downward trend
Better RE fundamentals continue to drive profits on sale of RE assets
Progressive stabilisation of stock and positive price outlook supports focus on value-preservation
Sales maintained at high levels of €610M in 1H16
1.8
1.2
0.6
1H15 1H16 1H14
-48%
Inflows (net of provisions) to OREO portfolio, in €Bn
Int’l & Investments Activity and results At a glance Competitive stance Strategy Appendix
59
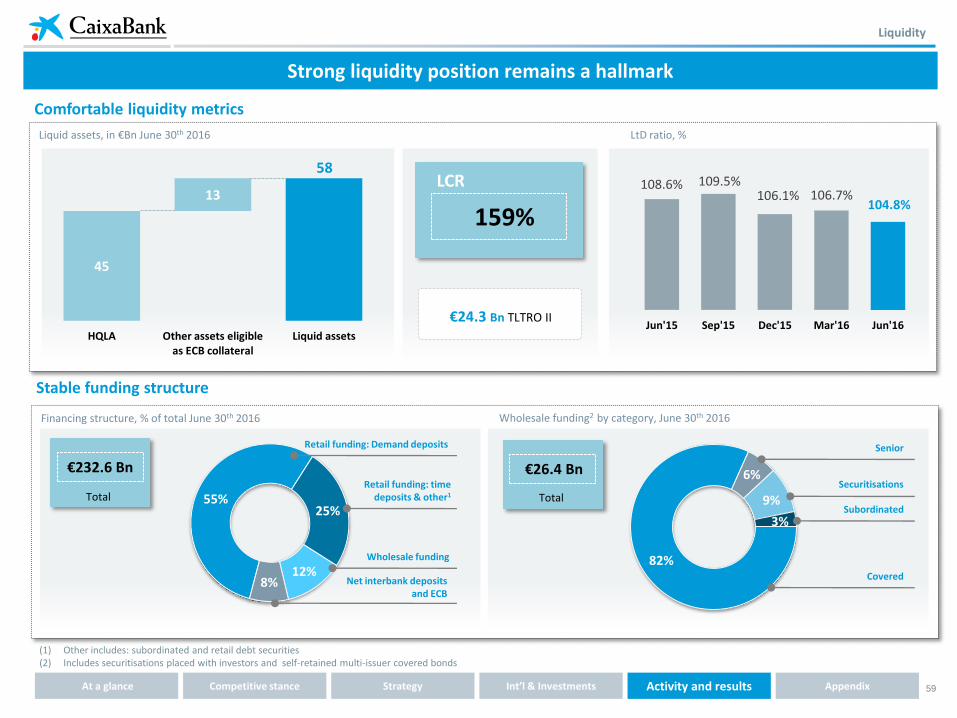
Strong liquidity position remains a hallmark
Liquidity
(1) Other includes: subordinated and retail debt securities (2) Includes securitisations placed with investors and self-retained multi-issuer covered bonds
159%
LCR
Comfortable liquidity metrics
Liquid assets, in €Bn June 30th 2016
108.6% 109.5% 106.1% 106.7%
104.8%
Jun'15 Sep'15 Dec'15 Mar'16 Jun'16
LtD ratio, %
Stable funding structure
Financing structure, % of total June 30th 2016
55% 25%
12% 8%
Retail funding: Demand deposits
Retail funding: time deposits & other1
Wholesale funding
Net interbank deposits and ECB
82%
6%
9%
3%
Senior
Securitisations
Subordinated
Covered
Wholesale funding2 by category, June 30th 2016
€232.6 Bn
Total
€26.4 Bn
Total
€24.3 Bn TLTRO II
45
58
13
HQLA Other assets eligible as ECB collateral
Liquid assets
Int’l & Investments Activity and results At a glance Competitive stance Strategy Appendix
60
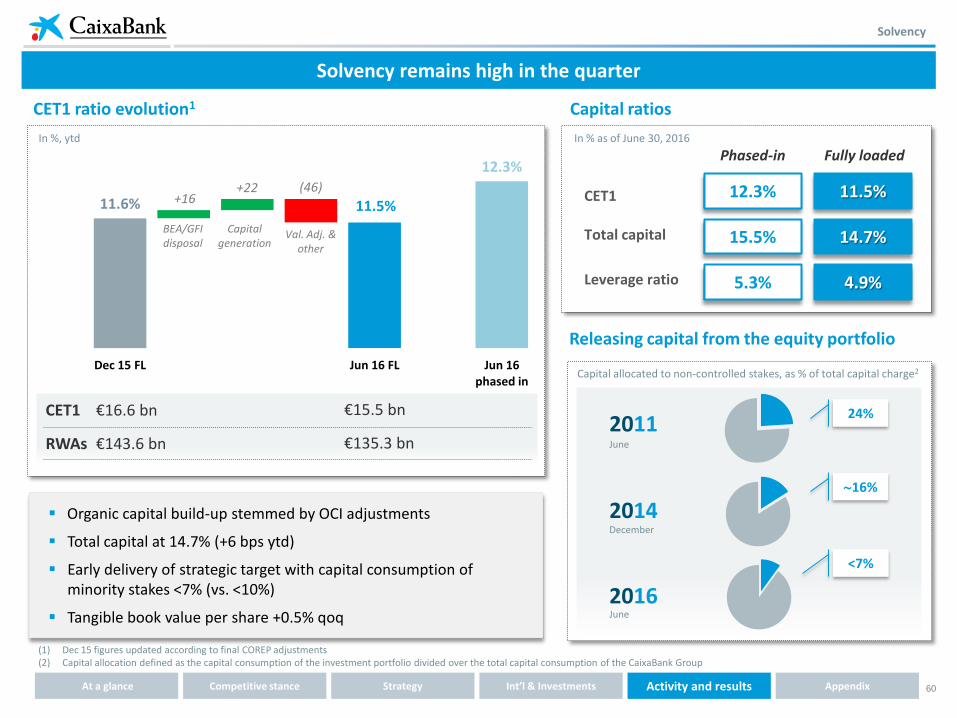
Solvency
CET1 ratio evolution1
Solvency remains high in the quarter
Organic capital build-up stemmed by OCI adjustments
Total capital at 14.7% (+6 bps ytd)
Early delivery of strategic target with capital consumption of minority stakes <7% (vs. <10%)
Tangible book value per share +0.5% qoq
CET1
Total capital
Phased-in Fully loaded
12.3% 11.5%
15.5% 14.7%
Leverage ratio 5.3% 4.9%
In % as of June 30, 2016
Capital ratios
(1) Dec 15 figures updated according to final COREP adjustments (2) Capital allocation defined as the capital consumption of the investment portfolio divided over the total capital consumption of the CaixaBank Group
11.6% 11.5%
12.3%
+16 +22 (46)
Dec 15 FL Jun 16 FL Jun 16 phased in
RWAs €143.6 bn
CET1 €16.6 bn
In %, ytd
Capital generation
€15.5 bn
€135.3 bn
Val. Adj. & other
BEA/GFI disposal
Releasing capital from the equity portfolio
24%
16%
<7%
2011 June
2014 December
2016 June
Capital allocated to non-controlled stakes, as % of total capital charge2
Int’l & Investments Activity and results At a glance Competitive stance Strategy Appendix

61
Solvency reinforced in the quarter 2Q 2016: key takeaways
4 NPA rundown continues
3
1 Rebound in revenues with costs down
5
2 Outstanding performance of insurance businesses
Early delivery of capital allocation targets
Improvement in both volumes and margins
Well-equipped to navigate a low rate environment
Final remarks
Int’l & Investments Activity and results At a glance Competitive stance Strategy Appendix

62
[Appendix]

63
(1) As of 20/04/16 (2) As of 22/04/16 (3) As of 26/04/16 (4) As of 13/04/16 (5) As of 18/06/15 (6) As of 27/05/16 (7) As of 10/03/16
Moody’s Investors Service Baa2
BBB
BBB
P-2
A-2
F2
negative
positive
Long term Short term Outlook
Aa2
A+
Rating of covered bond program
stable
A (low) R-1 (low)
stable
(2)
(1)
- (3)
(4)
Appendix
CaixaBank Credit Ratings
(5)
(6)
AA (high) (7)
Int’l & Investments Activity and results At a glance Competitive stance Strategy Appendix

64
Shareholder base and corporate governance
Transparency, independence and good governance are key priorities
Increased free float with diversified investor base
51% Retail
Free float 41%
49% Institutional
Shareholder base by group, In % of share capital as of June 2016
US and Canada 34%
UK/Ireland 23%
Spain 16%
RoW 10%
Geographical distribution of institutional investors1
% of total shares owned by institutional investors, Dec-2015
Rest of Europe 17%
(1) Percentage calculated on the institutional capital base identified at the Shareholder identification elaborated by Nasdaq OMX (2) As of July 19th 2016, two members of the Board (1 proprietary and 1 independent) appointed on June 30th 2016 are pending for approval by the ECB (3) Including 2 from Cajas (Fundación Bancaria Caja Navarra, Fundación Cajasol, Fundación Caja Canarias and Fundación Caja de Burgos Fundación Bancaria). The total number of proprietary directors
including the executive director appointed by “la Caixa” Banking Foundation is 9. (4) One executive director is appointed by “la Caixa” Banking Foundation and, as such, is both executive and proprietary
Number of shareholders, in thousands
Control and management of the bank is shared by the AGM, Board of Directors and Board committees: Audit and control; Executive; Appointments; Remuneration; Risks. The majority shareholder is not overrepresented in the board.
CABK’s relationship with other Group entities is immaterial, performed on an arm’s length basis and governed by the Internal Relations Protocol
Int’l & Investments Activity and results At a glance Competitive stance Strategy Appendix
Board of Directors composition2
Proprietary directors2,3 8 2 Executive directors4
Independent directors2 8
59%
CriteriaCaixa,
Board of
Directors, and
Treasury stock
360
698
2007 June-2016
65
Financial statements
Balance sheet P&L
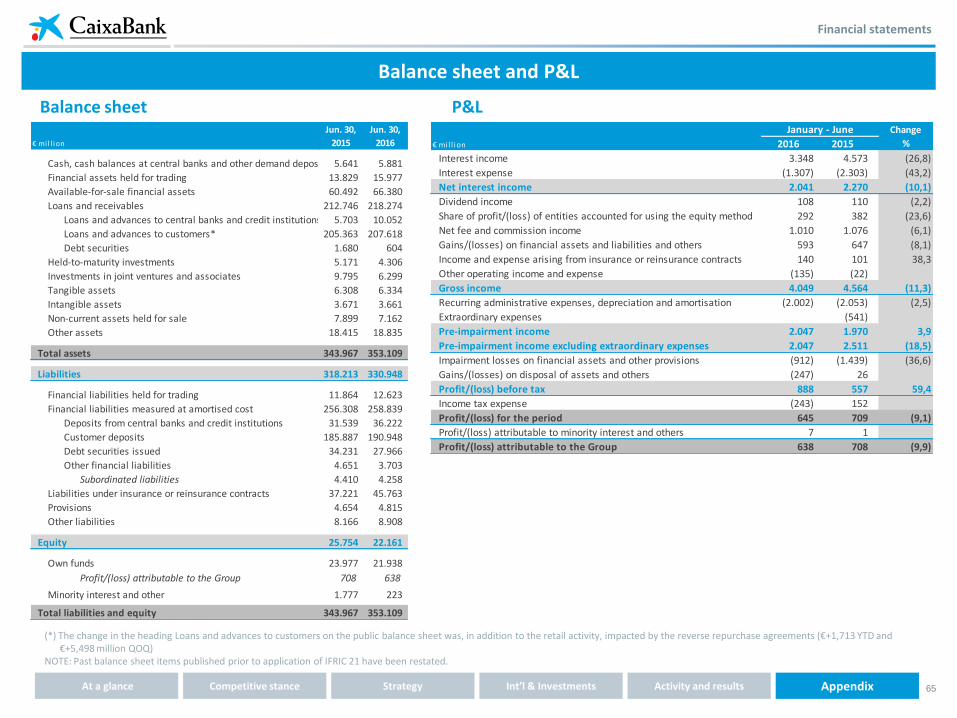
Balance sheet and P&L
(*) The change in the heading Loans and advances to customers on the public balance sheet was, in addition to the retail activity, impacted by the reverse repurchase agreements (€+1,713 YTD and €+5,498 million QOQ)
NOTE: Past balance sheet items published prior to application of IFRIC 21 have been restated.
€ mi l l ion 2016 2015
Interest income 3.348 4.573 (26,8)
Interest expense (1.307) (2.303) (43,2)
Net interest income 2.041 2.270 (10,1)
Dividend income 108 110 (2,2)
Share of profit/(loss) of entities accounted for using the equity method 292 382 (23,6)
Net fee and commission income 1.010 1.076 (6,1)
Gains/(losses) on financial assets and liabilities and others 593 647 (8,1)
Income and expense arising from insurance or reinsurance contracts 140 101 38,3
Other operating income and expense (135) (22)
Gross income 4.049 4.564 (11,3)
Recurring administrative expenses, depreciation and amortisation (2.002) (2.053) (2,5)
Extraordinary expenses (541)
Pre-impairment income 2.047 1.970 3,9
Pre-impairment income excluding extraordinary expenses 2.047 2.511 (18,5)
Impairment losses on financial assets and other provisions (912) (1.439) (36,6)
Gains/(losses) on disposal of assets and others (247) 26
Profit/(loss) before tax 888 557 59,4
Income tax expense (243) 152
Profit/(loss) for the period 645 709 (9,1)
Profit/(loss) attributable to minority interest and others 7 1
Profit/(loss) attributable to the Group 638 708 (9,9)
Change
%
January - June
Cash, cash balances at central banks and other demand deposits 5.641 5.881
Financial assets held for trading 13.829 15.977
Available-for-sale financial assets 60.492 66.380
Loans and receivables 212.746 218.274
Loans and advances to central banks and credit institutions 5.703 10.052
Loans and advances to customers* 205.363 207.618
Debt securities 1.680 604
Held-to-maturity investments 5.171 4.306
Investments in joint ventures and associates 9.795 6.299
Tangible assets 6.308 6.334
Intangible assets 3.671 3.661
Non-current assets held for sale 7.899 7.162
Other assets 18.415 18.835
Total assets 343.967 353.1090 0
Liabilities 318.213 330.948
Financial liabilities held for trading 11.864 12.623
Financial liabilities measured at amortised cost 256.308 258.839
Deposits from central banks and credit institutions 31.539 36.222
Customer deposits 185.887 190.948
Debt securities issued 34.231 27.966
Other financial liabilities 4.651 3.703
Subordinated liabilities 4.410 4.258
Liabilities under insurance or reinsurance contracts 37.221 45.763
Provisions 4.654 4.815
Other liabilities 8.166 8.908
Equity 25.754 22.161
Own funds 23.977 21.938
Profit/(loss) attributable to the Group 708 638
Minority interest and other 1.777 223
Total liabilities and equity 343.967 353.109
€ mi l l ion
Jun. 30,
2015
Jun. 30,
2016
Int’l & Investments Activity and results At a glance Competitive stance Strategy Appendix
66
+34 93 411 75 03
Investor Relations
Av. Diagonal, 621 08028 Barcelona
www.CaixaBank.com
Recommended