COMBINED FERMENTATION AND RECOVERY USING
EXPANDED BED CHROMATOGRAPHY
A Thesis
Submitted to the Faculty of
WORCESTER POLYTECHNIC INSTITUTE
in partial fulfillment of the requirements for the
Degree of Master of Science
in
Biotechnology
by
Keith J. Cochran
____________________
August 2006 APPROVED:
_________________________ Dr. Alexander A. Di Iorio, Major Advisor
_________________________ Dr. Theodore C. Crusberg, Co-Advisor
_________________________ Dr. Michael A. Buckholt, Committee Member
_________________________ Dr. William D. Hobey, Committee Member
_________________________ Dr. Eric W. Overström, Head of Department

i
ABSTRACT
Expanded Bed Chromatography (EBC) is rapidly becoming the preferred choice
for initial product recovery from crude process streams as it enables direct protein
recovery from culture broths after appropriate dilution. However, the process is time
intensive, and there are still some difficulties with very high cell density cultures in the
500 g/L range. Problems include in-column clogging and poor column efficiency. With
the development of a new prototype EBC column capable of product recovery from
undiluted culture broth, it is proposed in this study to combine the fermentation with EBC
recovery. This strategy was tested using a wild type, non-producing strain of Pichia
pastoris. Culture broths were spiked with 200 mg/L lysozyme to mimic actual
production fermentation. Key parameters for the process were identified and tested
independently to better assess system performance: potential toxic effects of the resin on
the culture, nutrient deprivation of the cells as they pass through the column and binding
of the target protein from whole broth. The cation exchanger had a negligible effect on
cell proliferation in shake flask studies using YNB Medium. Isolation of the culture from
the fermenter for up to two hours appeared to have minimal effect on overall cell viability
and the ability to metabolize methanol. The dynamic binding capacity for lysozyme was
50 mg/mL in buffer, and 20 mg/mL in undiluted fermentation broth containing 500 g/L
cells. When harvested undiluted fermentation broth was allowed to recirculate through
the EBC column, the binding capacity was increased to 30 mg/mL. The combination of
the fermentation and recovery process allowed for a binding capacity of 30-40 mg/mL,
with no dramatic effects on biomass accumulation or metabolic rate.

ii
ACKNOWLEDGEMENTS
I would like to first and foremost thank Dr. Alexander Di Iorio, for his
cooperation and patience in the face of what must have been a never-ending stream of
questions. Without his assistance this project would have been more difficult.
I would also like to thank my parents, who kept me fed and clothed, and made
concerted efforts to understand what I was spending years of my life working on.
Many thanks to other members of the WPI community who have given me help
and support. Thanks to Ted Crusberg, Mike Buckholt, and Bill Hobey for serving as
members of my committee, as well as assistance and advice. I would also like to thank
Dr. Elizabeth Ryder for her assistance with statistics. Jes Caron and JoAnn Whitefleet-
Smith assisted me with the use of numerous pieces of equipment and allowed me to
borrow as need be.

iii
TABLE OF CONTENTS ABSTRACT.................................................................................................................... i ACKNOWLEDGEMENTS........................................................................................... ii LIST OF ABBREVIATIONS........................................................................................ iv LIST OF EQUATIONS.................................................................................................. v LIST OF FIGURES........................................................................................................ vi LIST OF TABLES..........................................................................................................vii INTRODUCTION........................................................................................................... 1 MATERIALS AND METHODS.................................................................................... 7 RESULTS........................................................................................................................ 22 DISCUSSION.................................................................................................................. 35 BIBLIOGRAPHY........................................................................................................... 44 APPENDIX...................................................................................................................... 46

iv
LIST OF ABBREVIATIONS ΔA Change in Absorbance AF Anti-foam AOX1 Alcohol Oxidase 1 BMGY Buffered Minimal Glycerol Complex Medium BSM Basal Salt Media CHO Chinese Hamster Ovary CMHZ CM Hyper-Z DBC Dynamic Binding Capacity DO Dissolved Oxygen EBC Expanded Bed Chromatography EFT Estimated Fermentation Time OD Optical Density PI Isoelectric Point PSI Pounds per Square Inch RPM Rotations Per Minute TFF Tangential Flow Filtration YEP Yeast Extract Peptone YNB Yeast Nitrogen Base

v
LIST OF EQUATIONS Equation 1 - Activity of Lysozyme................................................................................... 15 Equation 2 - Equation for the Determination of Ideal Residence Time ........................... 38

vi
LIST OF FIGURES Figure 1 - Expanded Bed Chromatography Steps (Amersham Biosciences) ..................... 4 Figure 2 - Expanded Bed Chromatography Bead (Pall Corporation)................................. 5 Figure 3 - Schematic of Operating System....................................................................... 19 Figure 4 - Cell Density Comparison Between Fermenters With and Without Resin Present............................................................................................................................... 23 Figure 5 - Wet Weight as a Function of Residence Time, Adjusted for Feed Volume .... 26 Figure 6 - Milliliters Carbon Dioxide per Minute Evolved from the 5 L Fermenter as a Function of Time............................................................................................................... 27 Figure 7 - The Dynamic Binding Capacity of Lysozyme in Citrate Buffer ..................... 29 Figure 8 - Binding Capacity of Lysozyme in Whole Pichia pastoris Fermentation Broth........................................................................................................................................... 30 Figure 9 - Recirculating Binding Capacity Study in Whole Broth................................... 31 Figure 10 - Whole Broth Binding Study While Recirculating and Growing Pichia pastoris; Run 1.................................................................................................................. 32 Figure 11 - Whole Broth Binding Study While Recirculating and Growing Pichia pastoris; Run 2.................................................................................................................. 33 Figure 12 - Lysozyme Structure (Rypniewski et al., 1993).............................................. 36 Figure 13 - Growth curve of P. pastoris at 27°C and 200 RPM in YNB media. ............. 49

vii
LIST OF TABLES Table 1 – Cell Counts in Shake Flask Study..................................................................... 24 Table 2 - Plate Counts From a Shake Flask Maceration Study ........................................ 24 Table 3 - - The Effect of Basal Salt Media, and its Components, on CM Hyper-Z Binding Capacity, and Binding Percentages................................................................................... 28 Table 4 - Static Binding Capacity of Lysozyme With CM Hyper-Z................................ 28 Table 5 - Elution Volumes and Enzyme Activity for Run #1........................................... 33 Table 6 - Elution Volumes and Enzyme Activity for Run #2........................................... 34 Table 7 - Rate of Change in Wet Weight, Normalized for Feed Volume ........................ 38 Table 8 - Rate of Change in CO2 Output, Normalized for Feed Volume......................... 38 Table 9 - Combined Fermentation and Recovery Results ................................................ 42 Table 10 - Comparison of Binding Capacities.................................................................. 43 Table 11 - Cole-Farmer Masterflex Pump Calibration Using #16 Tubing and Aerated Fermentation Broth ........................................................................................................... 49 Table 12 – Maceration Effects of CM Hyper-Z in a Bioflo 3000 on P. pastoris ............. 50 Table 13 - The Effect of Residence Time on CO2 and Wet Weight – Control................. 50 Table 14 - The Effect of Residence Time on CO2 and Wet Weight – Control (2)........... 50 Table 15 - The Effect of Residence Time on CO2 and Wet Weight – 7.5 Minutes.......... 51 Table 16 - The Effect of Residence Time on CO2 and Wet Weight - 7.5 Minutes (2)..... 51 Table 17 - The Effect of Residence Time on CO2 and Wet Weight - 60 Minutes ........... 51 Table 18 - The Effect of Residence Time on CO2 and Wet Weight - 130 Minutes ......... 51 Table 19 - The Effect of Residence Time on CO2 and Wet Weight - 130 Minutes ......... 52 Table 20 - Dynamic Binding Capacity in Buffer - 250 cm/hr .......................................... 56 Table 21 - Dynamic Binding Capacity in Buffer - 350 cm/hr .......................................... 56 Table 22 - Binding Capacity of Lysozyme in Whole Pichia pastoris Fermentation Broth........................................................................................................................................... 57 Table 23 - Recirculating Binding Capacity in Whole Pichia pastoris Fermentation Broth........................................................................................................................................... 58 Table 24 - Run #1 of the Complete Experimental System ............................................... 59 Table 25 - Run #2 of the Complete Experimental System ............................................... 59

1
INTRODUCTION
Protein manufacturing via transgenic organisms has become an important and
growing business in today’s society. As the demand for additional pharmaceutical and
industrial proteins increases, new technology must be developed to make the recovery of
these proteins both more economical and efficient
Pichia pastoris, a methylotrophic yeast, has been developed into a heterologous
protein expression system (Higgins and Cregg, 1998). Pichia combines many of the
benefits of E. coli expression, such as high biomass and yield, with the advantages of
expression in a eukaryotic system (Wegner, 1990). Eukaryotic systems allow for more
advanced post-translational modifications, such as glycosylation, disulfide-bond
formation and proteolytic processing (Cregg et al., 2000). Also, protein expression levels
can be high, with levels as high as 14.8 g/L of clarified supernatant reported (Werten et
al., 1999). Pichia may be grown at a pH range of 3-6.
One of the two genes which encode alcohol oxidase in P. pastoris is the AOX1
gene, the expression of which is controlled at the level of transcription (Lin Cereghino
and Cregg, 1999). When the cells are grown on methanol, approximately 5% of poly(A)+
RNA is from AOX1, however the AOX1 message is not detectable when grown on other
carbon sources (Cregg and Madden, 1988). When the yeast are grown on methanol as
the sole carbon source, alcohol oxidase may contribute up to 35% of the total cellular
protein (Couderc and Baratti, 1980). The Pichia pastoris system has been genetically
engineered so that an upregulation in the AOX1 promoter causes an induction of a target
foreign protein.

2
Despite the fact that methanol serves as a carbon source for P. pastoris, if allowed
to accumulate it is toxic to the cells. For this reason the methanol feeds are well defined,
so as not to cause significant stress to the yeast. Studies have shown that 10 g/L
methanol causes only a slight lessening in specific growth rates; growth is not fully
inhibited until 30 g/L (Katakura et al., 1998; Charoenrat et al., 2005). Methanol levels
are generally maintained at a nearly undetectable level such that as a drop of methanol is
added to the culture, it is immediately consumed. A simple test for this can be done
using what is referred to as a DO (dissolved oxygen) spike test. If the culture is truly
limited on methanol, i.e. there is no residual methanol in the fermenter, than an
interruption of the methanol fed will cause a rapid and immediate spike in DO since no
carbon source is available. If residual methanol is present, than an interruption of the
feed will have no effect on DO.
In addition, the presence of too much molecular oxygen in culture can lead to
significant stress on the cells. In culture medium, molecular oxygen may form several
reactive oxygen species: superoxide radicals (O2•-), hydrogen peroxide (H2O2), or
hydroxyl radicals (HO•) (Tran et al., 1993). These reactive oxygen species attack nearly
all cell parts and cause DNA strand breaks, as well (Cantoni et al., 1986; Tran et al.,
1993). Other stressing factors which may also lead to the formation of reactive oxygen
species within the cell (Hristozova et al., 2002) include osmotic stress, hypoxic
conditions, excessive transcription of the target protein, carbon starvation, change of
carbon sources, temperature and pH changes, or toxic chemicals (Gasser et al., 2006;
Sinha et al., 2005; Shi et al., 2003; Vijayasankaran et al., 2005). The perennial difficulty
when working with P. pastoris, or any other recombinant microorganism, is to moderate

3
the negative effects caused by culture conditions with the positive effects those
conditions have on the production and quality of the target protein. Consequently,
specific protein production per cell is often at odds with an increased cell count within
the fermenter; usually neither are at their maximal level, since the two aspects must be
balanced to create a maximal protein titer.
Pichia pastoris fermentations can reach very high cell densities, with wet weights
nearing 500 g/L and viscosities higher than 40 mPas (Anspach et al, 1999). Traditional
recovery methods which have been used include tangential flow filtration (TFF) and
centrifugation. Because of the high solids concentration and ionic strength of the
fermentation broth, the broth must be diluted and run at a low flow rate; consequently
these processes are relatively slow and inefficient. In addition, during centrifugation a
significant amount of broth is lost with subsequent loss of product; with TFF the
membranes are easily plugged by a layer of cells and cell debris, leading to a decrease in
trans-membrane flux, and thus low flow rates and high backpressures.
It has been proposed that replacing the traditional steps involved in cell separation
and product recovery with expanded bed chromatography (EBC) will increase the
efficiency of purification. While traditional chromatography generally uses a packed bed
design, EBC employs a specialized resin to adsorb the target protein while in a fluidized
bed (Figure 1). The resin is designed to have a high density and smaller radius than
many resins used in other chromatography applications. This alteration of physical
properties allows for the beads to remain suspended and uniformly distributed in the
media, without sinking or being washed away.

4
Figure 1 - Expanded Bed Chromatography Steps (Amersham Biosciences)
The high cell densities achieved in Pichia pastoris fermentations also have the
potential to cause adverse effects in an EBC column. The high cell densities can cause
clogging of the distributor and frit entering the EBC column, leading to uneven flow and
poor adsorption in the column.
Numerous techniques and alterations in design have been used to address the
difficulties noted in EBC operation. One of the most common and successful methods
has been to increase the density of the chromatography resin by using zirconium oxide
(bead density of 3.2 g/ml) as a backbone which allows for an increased feedstock density
(Charoenrat et al., 2006). This resin also utilizes a higher charge density as shown in
Figure 2, by creating a hydrogen matrix containing the binding sites, thereby improving
mass transfer and allowing for a high fluidization velocity (Shiloach et al, 2003). This
resin, which was used throughout this study, is currently marketed as CM-Hyper-Z and is
available from Pall Corp. Another common approach has been to alter the basic design
of the EBC column from having the entire incoming stream pass up through the
distributor and into the column, to using a tangential flow type design which circulates
broth under the distributor, causing a scrubbing effect and preventing debris from
accumulating under the distributor. This column will be referred to as the “T-column”

5
(Biseps Inc., Monroe, WA) and was used throughout this study. Operation of the T-
column is as described in Figure 1.
Figure 2 - Expanded Bed Chromatography Bead (Pall Corporation)
The concept of coupling a fermentation with a recovery column is not new,
however, coupling a column with a high cell density fermentation in which the cells are
recycled has never been recorded in the literature. Other systems, where the cells are not
recycled, are more common. One of these systems was used by Charoenrat et al., (2006)
where the EBC Streamlinetm column, from GE EBC was used to compare a newer,
denser, resin to an older resin, and were able to improve their binding efficiency using
unclarified broth by 25%. They were unable to run undiluted whole broth however and
instead diluted 450 g/L fermentation broth to 246 g/L. Brobjer et al., (1999) performed
an EBC separation on a dense culture of crude Escherichia coli homogenate. In other
systems where the cells and products are considered to be more valuable, such as
mammalian cell culture, undiluted hybridoma cells have been passed through a fluidized
bed to absorb monoclonal antibodies but these were not recycled back to the production
fermenter (Erickson et al., 1994; Lütkemeyer et al., 1999). Another system used in

6
mammalian cell culture is the perfusion reactor, where the cells are actively retained in
the bioreactor using a membrane separation, while cell-free product is removed. A
separate stream is typically drawn off to help remove any dead cells. Perfusion reactors
are similar to a combined fermentation and recovery system, but do not allow for cells to
pass through the adsorbent, and instead only pass spent media through. A great deal of
research has been performed to increase the perfusion system (Gray et al., 1996; Hu and
Adams, 1997).
Even with the advantages EBC provides for recovery of fermentation products,
one of the main issues which must be addressed is the extended time required to perform
a single EBC process (up to 24 hrs). Since the T-column allows for capture and recovery
from undiluted cell broth, the fermentation step may be combined with an EBC cation
exchange step without adverse effects on the culture.
The purpose of this study was to determine the feasibility of combining an active
fermentation with product recovery by recycling cells back to the fermenter after passing
through the EBC column. A non-producing strain of P. pastoris was used and during
methanol induction, the culture was spiked with a known amount of lysozyme.
Lysozyme was used due to the high isoelectric point, and that it has a well-characterized
assay. Studies were performed to isolate and test individual parameters which were
expected to cause adverse effects on the culture. The individual parameters examined
were (1) the effect of the CM-Hyper-Z resin on the cells; (2) the effect on the culture of
nutrient deprivation caused by passing out of the fermenter and through the EBC column;
and (3) the determination of the binding capacity for lysozyme under test-tube or static,
dynamic or flow-through, and recirculating binding conditions.
7
MATERIALS AND METHODS
The chemicals and gasses used were of analytical grade whenever available and
were obtained from Sigma, Fisher Scientific, or Merriam Graves. CM-Hyper-Z resin
(CMHZ), manufactured by Pall Corporation, was the sole resin used throughout these
experiments. Reagent grade, 18 Mohm, de-ionized water was used for all experiments.
1. Pichia pastoris
An empty-vector parent strain of Pichia pastoris, X-33, was obtained from Blue
Sky Biotech, Inc. (Worcester, MA). Cryostocks were generated by taking the original
sample and inoculating into 40 mL of BMGY media, in a 250 mL Erlenmeyer flask for
11.5 hours at 28°C and 200 RPM. The 40mL of liquid was then divided equally into two
2L Erlenmeyer flasks, with 500 mL BMGY media in each of them, and grown at 26°C
for 15 hours, until the OD600 reached 11.48. The cells were harvested aseptically and
centrifuged at 4,000 RPM for 20 minutes in pre-sterilized 500 mL centrifuge bottles in a
Beckman J2-21 centrifuge, with a JA-10 rotor at 4°C. The cell pellet was resuspended in
an equal volume of sterile 80% glycerol, and divided into sixty cryovials each containing
0.5mL apiece. The cryovials were stored until used in a -80°C chest freezer (Thermo
Electron Corp, model #5472, Waltham, MA).
2. Fermentation Procedure
2.1. Operation of the Bioflo 3000 Fermenter
A typical P. pastoris fed-batch fermentation was performed as follows:

8
1. The desired volume of BSM was prepared and introduced into the reactor.
DO and pH probes, a nutrient feed port, a line for air and oxygen feeding, a
harvest line, a sampling port, as well an agitator motor of the correct size for
the fermentation vessel were attached to the fermenter.
2. The reactor was sterilized at 15 PSI for 35 minutes. Any lines which might
allow air in or out were clamped.
3. The night prior to the experiment the pH of the medium was adjusted to 3.0
with concentrated ammonium hydroxide (NH4OH), the DO probe was
connected to the instrument power in order to polarize and stabilize the signal,
and the temperature was set to 30°C.
4. The following morning the pH was adjusted to 4.5 using concentrated
NH4OH.
5. With the aeration to the vessel activated, a 20 min. time interval was allowed
to pass for the NH3 fumes to clear from the vessel headspace. After this time,
the trace metal solution was added (PTM1 salts) at 4.35 mL/L and
0.435 mL/L of 0.4 g/L D-biotin was also added to the fermenter(s).
6. The DO probe was calibrated to 100% once the DO signal stabilized.
7. When applicable, the resin was placed aseptically into the fermenter.
8. The fermenter was inoculated.
a. P. pastoris was grown in batch culture until all of the fixed-carbon
(glycerol) in the fermenter was consumed, which was usually 20-24 hours.
The pH was maintained at 4.5 using concentrated NH4OH and the Bioflo

9
3000’s control system, and the DO concentration was maintained at 40% -
50% saturation.
b. KFO™ 880 anti-foam (Kabo Chemicals, Inc., Cheyenne, WY) was used
to control the foaming within the fermenter.
9. A 50% glycerol solution was fed at umeInitialVolL
hrmL /15.18 for four hours. The
glycerol feed contained 12 mL/L PTM1 and 1.2 mL/L of 0.4 g/L biotin.
10. After glycerol feeding, methanol feed was introduced to the culture and the
pH set point was decreased to 3.0, mimicking a typical Pichia process. In this
way, the metabolism of the culture would drop the pH gradually to the set
point of 3.0. The methanol feed also contained 12 mL/L PTM1 and 1.2 mL/L
of 0.4 g/L biotin.
a. Methanol feeding was introduced at a low feed rate initially to allow the
culture to adapt. umeInitialVolL
hrmL /63.3 of pure methanol for a minimum of two
hours was fed, or until a successful dissolved oxygen (DO) spike is
obtained. A DO spike is determined by stopping the nutrient feed, in this
case methanol, and measuring the time required for the DO to rise at least
20%. If the DO rises by at least 20% in under a minute, the spike is
considered successful.
b. The flow rate was the increased to umeInitialVolL
hrmL /26.7 methanol for at least
one hour, or until a successful DO spike was obtained.

10
c. The flow rate was increased again to the maximum feed rate of
umeInitialVolLhrmL /89.10 methanol for the remainder of the experiment.
11. In the recirculation, and combined fermentation and recovery experiments, 46
hours after beginning methanol feeding, an Expanded Bed Chromatography
separation was performed using the Bioseps, Inc. 1.1 cm EBC T-column. See
Methods section (3.1) for the operational procedure to run the EBC.
3. Expanded Bed Chromatography (EBC)
3.1. Operational Procedure
A 1.1 cm diameter T-column, manufactured by Biseps Inc. (Monroe, WA), was
used for all EBC studies. The column was cleaned by passing at least 10 column
volumes of 1 M NaOH through in up-flow mode, followed by sufficient deionized water
to remove all NaOH until the pH at the column outlet was less than 9.
Prior to the introduction of culture broth, the column was equilibrated with
20 mM sodium citrate buffer, pH 3.0 in up-flow mode until the resin bed height had
equilibrated and the effluent pH was 3.0. The sample (containing lysozyme) was then
applied by switching the feed tube from the equilibrating solution to the sample solution.
For samples with a high density, the flow rate through the column was lowered in order
to prevent overexpansion and maintain column expansion at approximately 2X. After the
sample load was complete, the column was washed with 20 bed volumes of 20 mM
sodium citrate buffer, pH 3.5 in up-flow mode to remove solids and weakly bound
proteins. The resin was then allowed to settle, and the column was further washed with 7
11
bed volumes of 20 mM sodium citrate buffer, pH 3.5 in down-flow mode. Early EBC
runs utilized an application of 10 bed volumes of 20 mM tris-acetate buffer, pH 7.5 in
down-flow mode in order to remove undesired proteins from the resin. In those runs, to
recover the lysozyme, 20 mM tris-acetate buffer with 1 M NaCl, pH 9.5 was applied
followed by 20 mM tris-acetate buffer with 2 M NaCl, pH 9.5 in order to collect all of the
lysozyme from the resin. Later EBC runs used 40 mM, pH 7.5 tris-acetate buffer in order
to remove the undesired proteins, and 40 mM tris-acetate buffer with 1 M and 2 M NaCl,
pH 8.5 in order to collect the lysozyme from the resin since it was found that lysozyme
stability was affected above pH 9.
Following the removal of the lysozyme from the resin, the column was washed
employing the original cleaning procedure. When not in use the resin was stored in 20%
ethanol.
4. Determination of Resin Effects upon Cells
4.1. Sterilization Procedure
The CM Hyper-Z resin was sterilized by rinsing in several changes of sterile
dH2O in a pre-sterilized flask, followed by incubation in 1 M NaOH for one hour, and
then rinsed with sterile dH2O until a pH measurement of less than 9 verified removal of
the NaOH.
To sterilize the 0.5 mm glass beads, the beads were rinsed, placed into a sealed
Erlenmeyer flask, and autoclaved for a minimum of 30 minutes at 121°C.
All flasks containing media were autoclaved for a minimum of 30 minutes at
121°C prior to the addition of resin or glass beads.
12
4.2. Maceration Effects of the Resin on P. pastoris in a Bioflo 3000
Fermenter
To determine the effect of the resin on cell growth, an experiment was performed
in two 5 L Bioflo 3000 fermenters (New Brunswick Scientific, Edison, NJ). One reactor
was used as a control, and run as previously described for 72 hours. Into the other
fermenter, was placed 250 mL of resin just prior to inoculation. Later, additional PTM1
solution was added to the fermenter containing the resin to determine if the resin was
adsorbing the heavy metals.
4.3. Maceration Effects of the Resin on P. pastoris in Shake Flasks
The seven flasks prepared contained the following in 500 mL Erlenmeyer flasks:
1. 85 mL YNB media.
2. 115 mL YNB media.
3. 100 mL YNB media; 15mL CMHZ resin.
4. 100 mL YNB media; 15mL CMHZ resin; 20mg lysozyme.
5. 100 mL YNB media; 15mL CMHZ resin; 20mg lysozyme.
6. 100 mL YNB media; 15mL glass beads.
7. 100 mL YNB media; 15mL glass beads.
A 10 mg/mL stock solution of lysozyme was made in 100 mM phosphate buffer,
pH 7.0 and filter-sterilized (Cameo 25GAS, 0.22 µm pore size), and 2 mL of this stock
solution was aseptically pipetted into flasks #4 and 5. Flask #1 was inoculated the night
before with P. pastoris and grown up for 18.5 hours. It was used to inoculate flasks #2,
3, 4 and 6 with 10 mL each. Flasks #5 and 7 were not inoculated and were left sterile to

13
act as a sterility control. The 0.5 mm glass beads were used to test the maceration effects
on the cells, since glass beads are approximately the same size, but unlike the resin, will
not absorb nutrients under the experimental conditions used. The flasks were incubated
for two days at 28°C and 200 RPM. Cell counts were performed using a Reichert
hemocytometer (Bright-Line, Buffalo, NY). A 0.1 mL droplet of medium was placed
onto the hemocytometer, at a dilution of 1:105, and the number of counted cells was
multiplied by 104 in order to calculate the cells/mL concentration. All counts were
performed in at least triplicate.
Separate experiments were also performed using YEP plates. In these
experiments, an additional flask was prepared in the same manner as flask #3. This flask
was inoculated at the same time as the other flasks, but the resin was added 10 hours after
flask inoculation. The samples were plated on YEP plates at dilutions of 1:10-7, 10-8 and
10-9. All platings occurred in duplicate.
5. Determining the Effect of Nutrient Deprivation on P. pastoris
5.1. Operational Setup of the System
Nutrient deprivation while the cells were away from the primary fermenter had
the potential to have a large negative effect on cell viability. To isolate the possible
effect of nutrient deprivation on P. pastoris, another, smaller, fermenter was added into a
loop together with the main fermenter. The main fermenter was a 5 L Bioflo 3000
fermenter containing 3 L of BSM media initially. The second fermenter was a 1 L Bioflo
3000 fermenter which was maintained at a fluid volume of 1 L. The fermenters were
connected by #16 Masterflex tubing and fluid was circulated between the fermenters
using a Cole-Parmer Instrument Company Masterflex pump (Vernon Hills, Illinois) at

14
140 mL/min between the fermenters, in order to ensure that the DO and pH in both
fermenters were maintained at similar levels. Both fermenters were fed, aerated, and
controlled at the DO, pH and temperature set points until 20 hours after the start of
methanol. At this point, all controls other than agitation and temperature, including
aeration and the methanol feed, to the 1 L fermenter were terminated. Residence time
studies were performed where the average time fermentation broth spent away from the
5 L fermenter was 7.5, 60, or 130 minutes. A control was also run where the 1 L
fermenter was aerated and fed methanol throughout the entire experiment.
During the course of the residence time studies, both the wet weight and CO2
outputs were monitored in order to determine if the yeast were negatively affected. The
CO2 was monitored using an EX-2000 on-line gas analyzer (New Brunswick Scientific,
Edison, NJ).
6. Determination of the Lysozyme Binding Capacity
6.1. Protocol for Determination of Lysozyme Concentration
A 0.3 g/mL Micrococcus lysodeikticus substrate solution was prepared in 0.1 M
phosphate buffer, pH 7.0. A Beckman DU530 spectrophotometer was set to 450 nm and
was zeroed using a macro (1 cm path) visible light transmitting cuvette containing 3 mL
phosphate buffer.
To test samples, 2.9 mL of substrate solution was placed into a macro visible-light
cuvette and allowed to equilibrate at ambient temperature. The reaction was begun by
adding 100 μL of the enzyme solution to the cuvette and mixing gently, but thoroughly,
with the pipette tip. The spectrophotometer was then closed and the timer started. Once
the timer was running the OD450 was recorded every 15 seconds for a total of 2 minutes.

15
The assay tests for a decrease in absorbance as the lysozyme, an enzyme, breaks down
the cell walls of Micrococcus lysodeikticus.
If the reaction velocity was not between 0.02 and 0.04 absorbance units/minute
the solution was diluted until it fell within that range and the assay run again. The
reaction velocity (ΔA/min) was calculated for all the possible one-minute intervals, and
the initial reaction velocity, the largest ΔA, was used for further calculations. The
units/mL of the original sample was calculated using the following formula, where the
volume assayed was 100μL, and by definition, 1 unit is a ΔA of 0.001/minute:
( )( )Assayed
AssayedUndiluted
VolctorDilutionFaUnits
mLUnits
ocityInitialVeledUnitsAssay
=
=001.0
Equation 1 - Activity of Lysozyme
6.2. Effect of Basal Salt Media on the Binding Capacity of the Resin
In order to determine the effect of the basal salt media on the binding capacity of
the CMHZ resin, an experiment was performed testing each of the individual media
components separately. Two sets of seven 100 mL samples were prepared, each at the
same concentrations as in the BSM media:
1) H3PO4 (392 mM), pH adjusted to pH 3.0 with KOH.
2) H3PO4 (392 mM) and MgSO4•7H2O (153 mM), pH adjusted to pH 3.0
with KOH.
3) H3PO4 (392 mM) and CaSO4 (392 mM), pH adjusted to pH 3.0 with KOH.
4) H3PO4 (392 mM) and K2SO4 (104 mM), pH adjusted to pH 3.0 with KOH.

16
5) H3PO4 (392 mM) and trace salts to 10 μL/mL, pH adjusted to pH 3.0 with
KOH.
6) Basal salt media without glycerol.
7) 20 mM sodium citrate buffer (control).
With the exception of trial 7, 1 mL of each solution was pipetted into a 2 mL
Eppendorf microfuge tube containing 0.5 mL of settled resin and 15 mg of lysozyme.
Trial 7 did not include resin and served as a control. The tubes were inverted every half
hour for two hours, and then assayed for lysozyme as previously described.
6.3. Test-tube Binding Capacity
A stock solution of 5 mg/mL lysozyme was prepared in 20 mM sodium citrate
buffer, pH 3.3. A combination of the stock solution and 20 mM sodium citrate buffer, pH
3.3 were put into 2 mL Eppendorf tubes with 100 μL of settled resin, and put on a Clay
Adams Nutator Mixer (BD Diagnostic Systems, Parsippany, NJ) for two hours. Tubes
were adjusted so that they had 0, 5, 10, 25, 50, or 75 milligrams of lysozyme per milliliter
of resin. After allowing the resin to settle, the supernatant in the tube was tested to
determine binding capacity.
6.4. Dynamic Binding Capacity in Whole Fermentation Buffer
The dynamic binding capacity of a system is the amount of target protein the
system will bind under actual flow conditions before significant breakthrough of unbound
protein occurs. It is considered more reliable for predicting real process performance
than static binding capacity. Significant breakthrough is defined on a case-by-case basis,
and thus dynamic binding capacities are often accompanied with a context value, such as

17
stating it is at 2% breakthrough, signifying that 2% of the target protein entering the
system is leaving unbound.
To determine the binding capacity in buffer, after setting up the EBC column with
a resin bed depth of 19 cm, a stock solution of 5 mg/mL lysozyme in pH 3.1, 20 mM
sodium citrate buffer was passed through the column at multiple flow rates in order to
determine the dynamic binding capacity. Stock solution was passed through the column
at 250 and 347 cm/hr, which corresponds to 3.9 and 5.4 mL/minute, respectively. These
flow rates resulted in overall bed expansion of 1.6 and 2.0-fold, for the 250 and
347 cm/hr trials, respectively. Binding experiments were performed until significant
breakthrough was detected.
6.5. Dynamic Binding Capacity in Whole Fermentation Broth
To determine the binding capacity using fermentation broth, the EBC column was
set up with a resin bed depth of 15 cm, and fresh fermentation broth was harvested and
spiked to 200 mg/L with lyophilized commercial lysozyme. The fermentation broth had
a wet weight of 476 g/L. The spiked fermentation broth was applied to the EBC column,
which had been pre-expanded with pH 3, 20 mM sodium citrate buffer. Initially, the
sample was applied at 6 mL/min, but this was later reduced to 4.9 mL/min, to maintain
the bed expansion between 2-3X. Binding experiments were performed until significant
breakthrough was detected.
6.6. Recirculating Binding Capacity in Fermentation Broth
The binding capacity in recirculation mode was tested in order to determine the
saturation point of the resin, as well as to simulate and prepare for conditions to be tested

18
in later experiments when the active fermentation was coupled to the recovery column.
A 3 L batch of Pichia pastoris was grown under normal conditions in a 5 L fermenter,
and attained a final wet weight of 424 g/L before the run was ended, and all controls
other than temperature and agitation were terminated. Prior to terminating the
fermentation, the EBC column was prepared by equilibrating and expanding the resin in
upflow mode with 20 mM sodium citrate buffer, pH 3.0 flowing at 10 mL/min. The
fermentation broth was then applied from the fermenter to the column at 3 mL/min. All
fluid leaving the EBC column, prior to cells exiting the column, was discarded. Once
cells began exiting the column, the EBC exit tube was reattached to the fermenter and all
material leaving the EBC was allowed to return to the fermenter.
A sample was removed from the experiment approximately every 30-60 minutes
and assayed for lysozyme activity as described in Materials section 6.1 on page 14.
Originally the temperature was maintained at 30°C; however the temperature was
lowered to 20.5° approximately 6 hours into the binding experiment because it was
thought that lowering the temperature could possibly increase binding. The binding
experiment was allowed to run a total of 30 hours or until the lysozyme activity in the
fermenter remained constant, signifying that no more lysozyme was being removed from
the broth by the resin.

19
7. The Combined Fermentation and Recovery System
7.1. System Set-up and Operation
Figure 3 - Schematic of Operating System
The fermenter was set up, inoculated, and run as described in Methods section 2.1
throughout batch phase, and glycerol fed-batch. Forty six hours after starting the low
feed-rate of methanol, lysozyme was added to a concentration of approximately
200 mg/L.
The 1.1cm EBC column was prepared by equilibrating and expanding the resin in
up-flow mode with pH 3, 20 mM sodium citrate buffer flowing at 10 mL/min, which
maintained a bed expansion of 2-2.5-fold.
Figure 3 shows the schematic of the system used in these experiments. The
fermentation broth was pumped out of the fermenter (indicated by green line) into a small
container, which had a holding volume of 20 mL. The holding container was used to
allow the entrained gasses in fermentation broth to escape so as not to introduce air into
the EBC column. Introduction of bubbles into the EBC would pose a significant bed
Glycerol, Methanol
Air, O2
Dissolved Oxygen
Level
NH4OH (conc.)
pH

20
stability problem. A level controller, controlled by the Bioflo 3000, was placed into the
holding container to ensure that the liquid level was maintained. A Cole-Parmer
peristaltic pump was used to recirculate the fermentation broth through the EBC column.
This loop served to keep the mesh at the bottom of the column from clogging up. As the
broth was then pumped into the EBC, and as soon as cells began to enter the column, the
feed rate was reduced immediately to 3 mL/min, a previously determined flow rate which
would give a 2-2.5-fold expansion. All fluid leaving the EBC column, prior to cells
exiting the column, was not recirculated to the fermenter. Once cells began leaving the
column, the EBC exit tube was reattached to the fermenter and all material leaving the
EBC was allowed to return to the fermenter. The fluid exiting the EBC column was
returned to the fermenter via gravity. The residence time outside of the bioreactor
(including the column) was reduced from 60 minutes, to 30 minutes, due to
improvements made on the design of the air removal trap. Throughout the entire
experiment, the fermenter was maintained under optimal conditions as described in
Methods section 2.1.
Samples were taken every 1-3 hours and centrifuged 4,000 RPM for 20 minutes in
a Beckman J2-21 centrifuge, with a JA-18 rotor at 4°C. The pellet and supernatant were
separated, and the wet weight was determined. In several experiments, the CO2
concentration in the off-gas was also determined as described in Methods section 5.1.
The experiment was conducted for 24 hours, and then all feeds and controls, with the
exception of temperature and agitation, were terminated. The temperature control was
lowered to 18°C, and the agitation was lowered to 200 rpm. The culture was recirculated

21
for an additional 20 hours, in order to determine if the resin had been saturated, as well as
to monitor the fermentation.
7.2. Lysozyme Recovery
To recover the lysozyme from the resin, the resin was first washed in up-flow
mode with 20 mM sodium citrate, pH 3.5 until all traces of cell debris were removed
from the column. The resin was then allowed to settle, and was washed in down-flow
mode with 250 mL of 20 mM sodium citrate buffer, pH 3.5 and sequentially in down-
flow mode, the resin was washed with 20 mM tris-acetate buffer, pH 7.5, to remove
loosely bound undesired proteins. In run #1, the target protein, lysozyme, was then
eluted using 20 mM tris-acetate buffer, pH 9.5 with 1 M sodium chloride, followed by 20
mM tris-acetate buffer, pH 9.5 with 2 M sodium chloride. In run #2 the lysozyme was
eluted using 20 mM tris-acetate buffer, pH 8.5 with 1 M sodium chloride, followed by
20 mM tris-acetate buffer, pH 8.5 with 2 M sodium chloride. Each of the tris-acetate
elutions were performed until an OD280 reading upon them showed no additional protein
being eluted.
A benchtop experiment was also performed to determine whether lysozyme
activity was degraded in fermentation broth under ambient conditions. This was
performed by removing a sample from the fermentation, and placing it in a microfuge
tube, and leaving it on the bench for 24 hours, and then centrifuging and assaying the
supernatant for lysozyme activity.

22
RESULTS
1. Determination of Resin Effects upon Cells
1.1. Effects of the Resin on P. pastoris in a Bioflo 3000 Fermenter
The comparison between cell density increases in single runs of fermenters with
and without resin appears in Figure 4. In the control, the glycerol feed began at 47:23
EFT (Elapsed Fermentation Time, in hours), and the low methanol feed began at 51:48
EFT.
The experimental fermenter with resin was terminated early due to the unusually
slow growth rate, and that the fermentation had not gone limited on the batch-phase
carbon, even eight hours after the control fermentation had. In order to isolate the cause
of the slow growth, at 12:35 EFT a dose of 1 mL of PTM1 salts were added to the
fermenter. The subsequent decrease in dissolved oxygen (DO) indicated a high demand
for oxygen, most likely due to an increase in culture metabolism. To ensure this decrease
was not due to the metals actually affecting the probe itself, a trial was run where metals
were added to an operating probe without culture and the DO was found to not be
affected. The increased metabolism noted by the decreasing DO lasted for approximately
fifteen minutes, and then the DO returned to the original level. The addition of PTM1
salts was tested at other times during the fermentation, and a similar effect occurred each
time. The addition of glycerol or ammonium, a nitrogen source, had no effect on DO. A
similar dose of PTM1 salts to the control fermentation had no similar effect (data not
shown).

23
0
1
2
3
4
5
6
0 5 10 15 20 25 30
Time (hours)
OD
600
With resin Without Resin
Figure 4 - Cell Density Comparison Between Fermenters With and Without Resin Present.
1.2. Maceration Effects of the Resin on P. pastoris in Shake Flasks
Similar cell densities were found between all medium formulations containing
glass beads and resin as in the control (Table 1). Each value is the average of at least
three readings. Similar results were found in a later study (Table 2), where the cell
densities determined were comparable to the control among the flasks containing resin
and glass beads. Interestingly, the flask which had the resin added many hours after
inoculation had a higher level of cell growth than any of the other flasks. Several
repetitions of this experiment showed that this occurred regularly and was not an isolated
incident (data not shown). The 10-9 dilution is not shown due to non-growth.

24
Cell Counts (cell/mL)115 mL media, no resin (control), inoculated 6.50 x 10¹⁰
100 mL media, 15 mL glass beads, inoculated 2.63 x 10¹⁰ 100 mL media, 15 mL resin, Lysozyme, inoculated 3.00 x 10¹⁰ 100 mL media, 15 mL resin, inoculated 2.66 x 10¹⁰
Table 1 – Cell Counts in Shake Flask Study
Colony count (10-7 dilution)
Colony count (10-8 dilution)
Average cell density (cells/mL)
100 mL media, 15 mL glass beads Not inoculated
Both plates sterile
100 mL media, 15 mL resin Not inoculated
Both plates sterile
69 7 100 mL media, Inoculated (Control) 100 6 7.4 x 10⁹
61 9 100 mL media, 15 mL resin, Inoculated 79 9
8.0 x 10⁹
70 11 100 mL media, 15 mL resin, Lysozyme, Inoculated 92 6
8.3 x 10⁹
154 18 100 mL media, 15 mL resin (Late), inoculated 129 14
15.8 x 10⁹
79 8 100 mL media, 15mL glass beads 81 7 7.8 x 10⁹
Table 2 - Plate Counts From a Shake Flask Maceration Study
2. Determining the Effect of Nutrient Deprivation on P. Pastoris
Figure 5 shows the effect of residence time biomass accumulation, measured as
wet weight. The residence time is defined in this study as the average amount of time
which fermentation culture spends away from both a carbon and oxygen source, i.e., the
primary or 5 L fermenter. The control fermentation, however was fed carbon and
supplied with oxygenation continuously, even while in the secondary, or 1 L fermenter.
The results of the residence time experiments, especially at high residence times were

25
unexpected. Even for a 130 minute residence time in the 1 L fermenter, the wet weight
and CO2 output did not appear to decrease to the extent expected (Figure 5 and Figure 6)
and were very similar to those values obtained for the control and the other residence
times. The units used in Figure 5 are the wet weight of biomass, in grams per liter.
Since the control was in effect fed proportionally more carbon (4/3 more carbon) the
corresponding wet weights must be adjusted accordingly. For this reason, the rate of
change for the wet weight in the control system was lowered by 25%. The data from the
experimental system was not altered. Since the increase in feed rates is directly
proportional to the increase in volume, this adjustment is justified. The units used in
Figure 6 are milliliters of CO2 evolved from the 5 L fermenter per minute, and were not
adjusted since the CO2 evolved in the small fermenter was allowed to exit through the
condenser attached to the small fermenter.

26
200
250
300
350
400
450
500
15 20 25 30 35 40 45 50
Time into Methanol (hr)
Wet
Wei
ght (
g/L)
Control 7.5 Min Res 130 Min Res 60 Min Res 130 Min Res (2) Control (2) 7.5 Min Res (2)
Figure 5 - Wet Weight as a Function of Residence Time, Adjusted for Feed Volume

27
100
120
140
160
180
200
220
15 20 25 30 35 40 45 50
Time into Methanol (hr)
CO
2 ou
tput
(mL/
min
)
Control 7.5 Min Res 130 Min Res 60 Min Res 130 Min Res (2) Control (2) 7.5 Min Res (2)
Figure 6 - Milliliters Carbon Dioxide per Minute Evolved from the 5 L Fermenter as a Function of Time
3. Determination of the Lysozyme Binding Capacity
3.1. Effect of Basal Salt Media on the Binding Capacity of the Resin
Table 3 shows the effect of Basal Salt Media (BSM), and its components, on the
binding capacity of the CM Hyper-Z resin for lysozyme. The samples tested were
supernatants after exposure to the resin for a period of 2 hours. The average activity
shown in Table 3 is the average of a minimum of two assays performed in multiple
independent microfuge tubes.

28
Residual activity (U/mL)
Percentage Bound
Control with resin (20 mM citrate buffer, pH 3) ND 100%
Control without resin (20 mM citrate buffer, pH 3) 137,000 0%
H3PO4 (392 mM) + KOH 2,383 98.3%
H3PO4 (392 mM) + MgSO4•7H2O (153 mM) + KOH 3,675 97.3%
H3PO4 (392 mM) + CaSO4 (392 mM) + KOH 3,548 97.4%
H3PO4 (392 mM) + K2SO4 (104 mM) + KOH 3,868 97.2%
H3PO4 (392 mM) + PTM1 trace salts 2,432 98.2%
BSM w/o glycerol 7,765 94.3% Table 3 - - The Effect of Basal Salt Media, and its Components, on CM Hyper-Z Binding Capacity,
and Binding Percentages
3.2. Test-Tube Binding Capacity
The data presented in Table 4 show the static binding capacity of the CM Hyper-
Z resin in microfuge tubes. From these data, it appears that breakthrough occurs at just
under 25 mg/mL.
Units/mL of lysozyme activity % of lysozyme bound 0 mg/mL starting concentration 0 ― 10 mg/mL starting concentration 0 100% 25 mg/mL starting concentration 510 80% 50 mg/mL starting concentration 8320 20% 75 mg/mL starting concentration 9330 10%
Table 4 - Static Binding Capacity of Lysozyme With CM Hyper-Z
3.3. Dynamic Binding Capacity in Buffer
The dynamic binding capacity of lysozyme in 20 mM sodium citrate buffer, pH
3.1, was determined at flow rates of 250 and 350 cm/hr in a 1.1 cm column (Figure 7).
The 2% breakthrough points for 250 and 350 cm/hr with 20 mL of CM Hyper-Z resin at

29
1.6-2.0-fold expansion were determined to be 50 and 75 mg/mL, respectively. C/C0
represents the ratio of the lysozyme concentration leaving the column, to that entering the
expanded bed chromatography (EBC) column. A ratio of 1.0 signifies that no material
entering the EBC column is being bound to the resin before leaving the column. These
values indicate individual runs.
0
0.1
0.2
0.3
0.4
0.5
0.6
0.7
0.8
0.9
1
0 500 1000 1500 2000 2500mg Lysozyme
C/C
o 250 cm/hr350 cm/hr
Figure 7 - The Dynamic Binding Capacity of Lysozyme in Citrate Buffer
3.4. Dynamic Binding Capacity in Whole Fermentation Broth
The dynamic binding capacity (DBC) of hen egg lysozyme in whole fermentation
broth was determined by harvesting the culture, then passing the undiluted fermentation
broth, spiked with 200 mg/L lysozyme, through the EBC column. The initial linear
velocity was 6.31 cm/min or 6 mL/min, but was lowered to 5.16 cm/min (4.9 mL/min)
after 207 mg of lysozyme had passed through the column, due to the bed being over-
expanded. When 300 mg of lysozyme had passed through the column, 2% breakthrough

30
was achieved (Figure 8). Since there was 15 mL of resin in the column, this translated to
a 2% breakthrough at 20 mg/mL resin. This level of lysozyme was chosen in order to
provide resin saturation; despite that strains of P. pastoris producing 1 - 3 g/L of product
are common in industrial settings.
Despite the higher initial flow rate, the 2% breakthrough determined is considered
to be applicable for the 4.9 mL/min flow rate, because the bed had come to equilibrium at
4.9 mL/min. Breakthrough occurred during the 4.9 mL/min flow rate after having been
at equilibrium for 100 minutes.
0
200
400
600
800
1000
1200
1400
1600
1800
0 100 200 300 400 500 600 700
mg lysozyme entering column
U/m
l lea
ving
col
umn
Figure 8 - Binding Capacity of Lysozyme in Whole Pichia pastoris Fermentation Broth
3.5. Recirculating Binding Capacity in Whole Fermentation Broth
To determine the saturation point of the CM Hyper-Z resin under conditions
similar to the complete system, a recirculation binding study was performed. Figure 9
shows the lysozyme activity within the fermenter for one run. The long running time was

31
specified in order to ensure resin saturation, which was determined to be approximately
30 mg/mL.
The conditions in the fermenter were changed during the experiment, to lower the
temperature from 30 to 20.5°C just less than 6 hours into the experiment, to determine if
temperature had an effect on binding. In order to maintain 2-2.5-fold bed expansion, the
experiment was run at 3 mL/min.
0
500
1000
1500
2000
2500
0:00:00 3:36:00 7:12:00 10:48:00 14:24:00 18:00:00 21:36:00 25:12:00 28:48:00 32:24:00Column Running Time
U/m
L in
Fer
men
ter
Figure 9 - Recirculating Binding Capacity Study in Whole Broth
4. The Combined Fermentation and Recovery System
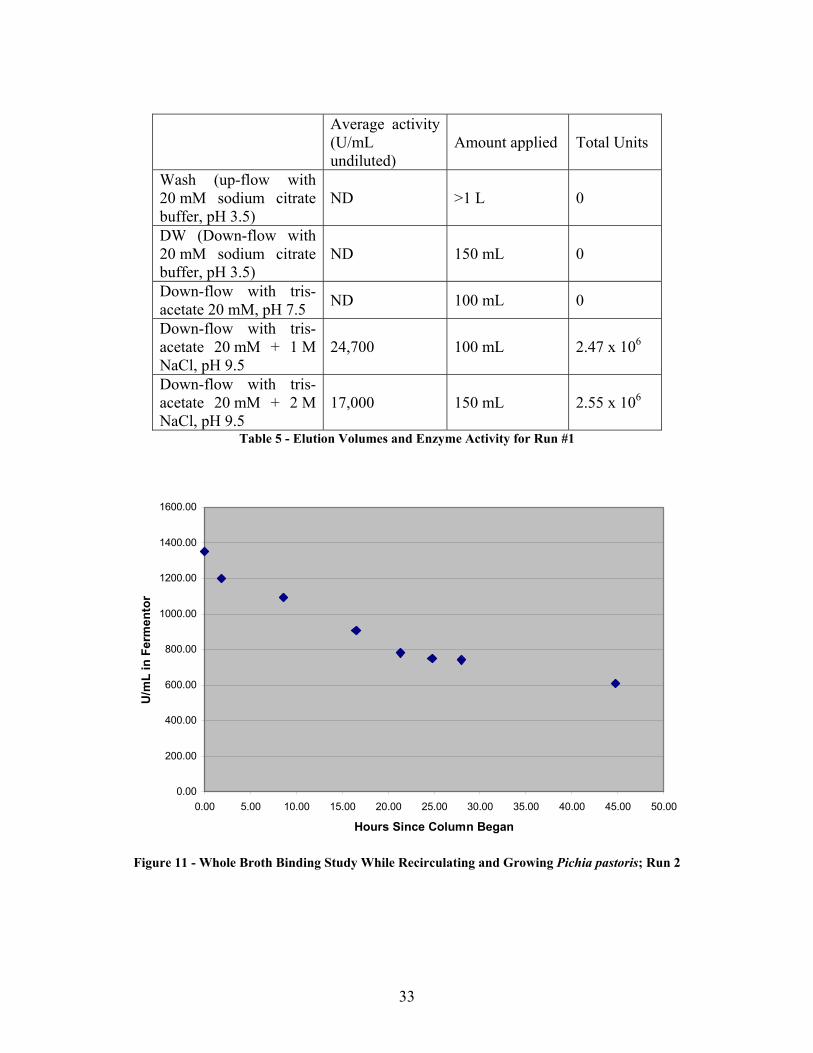
In the combined fermentation and recovery apparatus, the activity within the
fermenter was measured and plotted against the running time of the EBC column.
Figure 10 and Figure 11 show the results from two separate sets of experiments, but had

32
similar behaviors. In both experiments there was little additional binding after 24 hours.
The binding capacities of the experiments were different though; the first run
demonstrated a binding capacity of 43 mg/mL at 496 g/L wet weight, whereas the second
experiment showed a 31 mg/mL binding capacity at 478 g/L wet weight.
The total activities within the reactors were 10 x 106 and 5.5 x 10⁶ units for runs
#1 and #2, respectively, as calculated by the starting lysozyme concentration within the
fermenter and the initial volume within the fermenter. Using the final lysozyme activities
and reactor volumes, there were 3.2 x 10⁶ and 2.5 x 10⁶ units of activity remaining in the
reactors at the ends of Runs #1 and #2, respectively. As shown in Table 5, 5.02 x 10⁶
units were eluted from the resin, leaving 1.8 x 10⁶ units unaccounted for in run #1. In run
#2, 1.77 x 10⁶ units were recovered from the resin (Table 6), which leaves 1.23 x 10⁶
units unaccounted for.
0
500
1000
1500
2000
2500
3000
3500
0.00 5.00 10.00 15.00 20.00 25.00 30.00 35.00 40.00 45.00 50.00
Hours Since Column Began
U/m
L in
Fer
men
tor
Figure 10 - Whole Broth Binding Study While Recirculating and Growing Pichia pastoris; Run 1
33
Average activity (U/mL undiluted)
Amount applied Total Units
Wash (up-flow with 20 mM sodium citrate buffer, pH 3.5)
ND >1 L 0
DW (Down-flow with 20 mM sodium citrate buffer, pH 3.5)
ND 150 mL 0
Down-flow with tris-acetate 20 mM, pH 7.5 ND 100 mL 0
Down-flow with tris-acetate 20 mM + 1 M NaCl, pH 9.5
24,700 100 mL 2.47 x 10⁶
Down-flow with tris-acetate 20 mM + 2 M NaCl, pH 9.5
17,000 150 mL 2.55 x 10⁶
Table 5 - Elution Volumes and Enzyme Activity for Run #1
0.00
200.00
400.00
600.00
800.00
1000.00
1200.00
1400.00
1600.00
0.00 5.00 10.00 15.00 20.00 25.00 30.00 35.00 40.00 45.00 50.00
Hours Since Column Began
U/m
L in
Fer
men
tor
Figure 11 - Whole Broth Binding Study While Recirculating and Growing Pichia pastoris; Run 2

34
Average activity (U/mL undiluted) Amount applied Total Units
Wash (up-flow with 20 mM sodium citrate buffer, pH 3.5)
NQ >1 L 0
DW (Down-flow with 20 mM sodium citrate buffer, pH 3.5)
NQ 150 mL 0
Down-flow with tris-acetate 40 mM, pH 7.5 NQ 200 mL 0
Down-flow with tris-acetate 40 mM + 1 M NaCl, pH 8.5
5,800 200 mL 1.16 x 10⁶
Down-flow with tris-acetate 40 mM + 2 M NaCl, pH 8.5
3,040 200 mL 0.608 x 10⁶
Table 6 - Elution Volumes and Enzyme Activity for Run #2

35
DISCUSSION
The model protein used in these trials, hen egg lysozyme, has an isoelectric point
of 11.0, and a molecular weight of 14,400 Da. Lysozyme is responsible for breaking
down the polysaccharide walls of many kinds of bacteria and thus it provides some
protection against infection. Lysozyme functions by serving as an unspecific innate
opsonin by binding to the bacterial surface to reduce the negative charge and facilitate
phagocytosis of the bacterium before opsonins from the acquired immune systems attack
the bacterium. Lysozyme attacks peptidoglycans and hydrolyzes the bond that connects
N-acetyl muramic acid with the fourth carbon atom of N-acetylglucosamine. Hen egg-
white lysozyme is a single chain of 129 residues. It has an alpha+beta fold, consisting of
five to seven alpha helices and a three-stranded antiparallel beta sheet. The enzyme is
approximately ellipsoidal in shape, with a large cleft in one side forming the active site
(Figure 12). Lysozyme is considered to be a stable protein under most conditions,
although low temperatures and low pH further enhance stability. Lysozyme was chosen
for this experiment due to its apparent stability and high isoelectric point, which causes
the lysozyme to bind strongly to the cation exchange resin used, even with the low pH
condition at pH 3 used in these trials.

36
Figure 12 - Lysozyme Structure (Rypniewski et al., 1993)
The experimental hypothesis that cell viability would not be strongly affected by a
combined fermentation and recovery system was examined by investigating several key
parameters thought to be of critical importance: 1) the effect of the resin itself on growth
of the culture; 2) the determination of any toxic or nutrient-binding effects of the resin
which would reduce capacity for protein binding; 3) the assessment of nutrient
deprivation the culture would experience while passing through the EBC column; and 4)
the determination of the lysozyme binding capacity under various conditions including
the combined fermentation and recovery process.
Although the CM Hyper-Z resin has the ability to bind positively charged metal
components in the trace metal supplement (Figure 4, page 23), it is apparent that during
an actual fermentation induced with methanol, this binding effect will be reduced due to
the presence of competing secreted proteins in the culture medium. This conclusion is

37
supported by the fact that during the actual combined recovery process, the cells were not
limited by heavy metal uptake of the resin. The difference between the heavy metal
result noted in Figure 4 and the combined fermentation and recovery trial is that during
the combined recovery trial, the resin was not exposed to the culture medium until 20
hours into the induction phase. The heavy metal trial, which showed limitation on heavy
metals due to resin binding, was in effect a worst case scenario. Further, the
demonstrated maceration effect of the resin on the cells indicated that more significant
factors were present in the heavy metal trial which had shown adverse effects on the
culture.
The effect of nutrient deprivation was evaluated by substituting a second, smaller
bioreactor for the EBC column, and using residence times, or the total time a portion of
fermentation broth is out of the main fermenter, to determine whether the deprivation of a
carbon and oxygen source was harmful to the fermentation. The second fermenter was
presumed to be ideally mixed (Equation 2). Since the control experiments were fed 33%
more methanol over the course of the study compared to the experimental fermenters, due
to both the small and large fermenters feeding methanol, the data for the control system
wet weights were normalized to the volume being fed. The rate of change after the
experiment was begun was lowered by 25%, due to the increased volume of methanol fed
to the system. The data was not altered for the entire course of the experiment, due to
that the control and experimental systems were fed the same during glycerol batch,
glycerol fed-batch, and 20 hours of methanol feeding, and that it was only then that the
systems began to differ. The values of CO2 evolution were not altered, due to that it is a
reading of an instantaneous flow rate, whereas wet weight is a cumulative value.

38
This study showed that CO2 is being evolved at a slower rate, with increased
residence times, and that the trend is inconclusive for wet weight comparison (Table 7
and Table 8). There is a statistically significant difference between the experimental
systems for the CO2 measurements (P < 0.001), but not for the wet weights (P > 0.3).
There was also sufficient data to produce a statistically significant correlation
(P < 0.001). This suggests that there is something adverse occurring to the cells, but it is
not a major problem, as the cells within the system were not strongly affected. Using a
producing strain, the change in product titer will prove to be an important parameter to be
studied in the future to determine the cause of these effects.
( )
( )( )∫
∫
∫ ∞
∞
∞
≅=0
0
0 dtttEdttE
dtttEtm
Equation 2 - Equation for the Determination of Ideal Residence Time
Slope (g/L·hr) Average slope (g/L·hr) Control 3.588
Control (2) 3.244 3.416
7.5 minute residence time 3.216 7.5 minute residence time (2) 3.387 3.302
60 minute residence time 3.036 3.036 130 minute residence time 3.139
130 minute residence time (2) 4.061 3.600
Table 7 - Rate of Change in Wet Weight, Normalized for Feed Volume
Slope (mL CO2 per minute/hr)
Average slope (mL CO2 per minute/hr)
Control 1.440 Control (2) 1.273 1.356
7.5 minute residence time 0.944 7.5 minute residence time (2) 1.055 1.000
60 minute residence time 0.940 0.940 130 minute residence time 0.852
130 minute residence time (2) 0.889 0.870
Table 8 - Rate of Change in CO2 Output, Normalized for Feed Volume

39
In order to assess factors which might potentially affect binding capacity, the
effect of various BSM components on the binding capacity of lysozyme was investigated.
All BSM components were used in the same concentrations as the media. As may be
seen in Table 3, irrespective of the medium component, binding was always greater than
94% which indicates a minimal affect on binding capacity.
The binding capacity of the resin for lysozyme ascertained in the test-tube study
was low, as expected, due to inefficient binding kinetics inherent in the system. This
study was used to gain a basic understanding as to the approximate binding capacity of
the resin. The test-tube binding capacity of the resin was determined to be just below
25 mg/mL. Using this data, a dynamic binding study in sodium citrate buffer was
performed. The data showed that the 2% breakthrough for flow-through speeds of 250
and 350 cm/hr, occurred at 50 and 75 mg/mL, respectively. While it is often the case that
an increased flow rate through the EBC column corresponds to decreased binding
efficiency, the opposite was found here. This was likely due to poor binding kinetics in
the slower feed rate due to insufficient expansion. Using the data, a dynamic binding
capacity study was performed using whole broth, to model conditions inside the column,
and prepare for later experiments. In this study harvested, undiluted broth was passed
through the T-column containing 15 mL of resin, reaching 2% breakthrough at 300 mg of
lysozyme (Figure 8), which corresponds to a 20 mg/mL dynamic binding capacity. As
expected, the binding in whole broth was less efficient than in buffer, due to the very high
ionic strength and density of the whole broth. The feed rate into the column was lowered
partially into the experiment due to that the resin bed was over-expanded. In subsequent
runs the feed rate was lower, in order to avoid this difficulty.

40
Using the experience gained in the whole broth DBC study, a recirculating
binding study was performed. The goal of this study was to determine the saturation
capacity of the resin, as well as determine a binding profile for a recirculating system.
For this reason, there was insufficient resin provided to bind all of the lysozyme added.
This study determined that the majority of the binding lysozyme was adsorbed within 12
hours, reaching a saturation capacity of 30 mg/mL (Figure 9).
The combined fermentation and recovery process was performed using data from
previous studies in order to maximize efficiency. The binding capacities of the resin for
lysozyme determined were 31-43 mg/mL, which was an improvement on traditional, one-
pass, binding capacities. It was also determined that the binding capacities in the second
run were lower than those in the first run, likely due to that the resin wasn’t as fresh in the
second run. Also, all runs performed showed approximately a 20% disappearance of the
lysozyme (Table 9). It is not fully understood where this portion of the lysozyme went,
but it is possible that the remainder is being degraded by the low pH of the fermentation,
or that a byproduct of the fermentation is acting as an inhibitor. Known inhibitors of hen
egg lysozyme include heparin, histidine methylester, chitotriose, and chitobiose as well as
large, acidic polymers, some of which may possibly be found in P. pastoris cultures
(Valisena et al., 1996; Wang et al., 1991; Skarnes and Watson, 1955). It is also possible
that X-33, the P. pastoris strain used, was releasing proteases into the culture medium, as
it is unknown if X-33 is a protease deficient mutant (Cereghino and Cregg, 2000). It is
likely that X-33 produces proteases, as protease-deficient mutants are known to be less
vigorous, and have slower growth rates (Cereghino and Cregg, 2000). The effects of
proteases on the assays performed would be similar to those of inhibitors; the proteases
41
would lower the apparent activity of the lysozyme. During the course of these studies, a
container of lysozyme purchased was determined to contain proteases, and while the
lysozyme activity was decreased, the effects were significantly more pronounced than in
the experimental studies. For this reason, it is unlikely that proteases alone are the cause
for the difference in the lysozyme quantities added, and the apparent loss of 20% of the
lysozyme by the end of the study. Due to the mechanism of proteases, it would be
possible to determine the presence of proteases by using gel electrophoresis, and
determined if there are cleaved pieces of lysozyme in the culture medium. This test may
be complicated by the large quantities of other proteins, excreted by the P. pastoris, in the
culture medium. It may also be complicated by that the gel electrophoresis would only
show the presence of cleaved pieces of lysozyme if the lysozyme is uniformly degraded.
If the lysozyme structure was degraded at random points, then a gel would not be able to
show what happened to the lysozyme. The previously encountered difficulty with the
resin absorbing the PTM1 salts and causing diminished growth was not noticed over the
course of the combined system.

42
Lysozyme Activity
(106 Units)
Percent of Initial
Lysozyme Activity
Initially in the fermenter 10.0
Remaining in the fermenter 3.20 32%
Recovered from the EBC 5.02 50% First Run
Not fully accounted for 1.80 18%
Initially in the fermenter 5.50
Remaining in the fermenter 2.50 46%
Recovered from EBC 1.77 32% Second Run
Not fully accounted for 1.23 22%
Table 9 - Combined Fermentation and Recovery Results
The use of a combined fermentation and recovery process was determined to be
an effective method for separations of high cell density cultures. There appeared to be no
major loss of viability caused by the binding conditions. The binding of the target protein
to the resin increased with recirculation, as compared to a single-pass study using whole
broth (Table 10).

43
Binding Capacity (mg/mL)
Test-tube binding 25
DBC in sodium citrate buffer 50 – 75
DBC using Whole Broth 20
Recirculating in Whole Broth 30
Combined Fermentation and Recovery Process 31 – 43
Table 10 - Comparison of Binding Capacities
Due to the significant loss of activity encountered using a lysozyme system;
future studies should investigate other, more stable, protein systems which are available.
A study should also be performed to determine the cause of the activity loss although
choosing the right production system and protein should eliminate this degradation factor.
The efficiency of the fermentation and recovery processes should be improved upon by
isolating and improving the aspects deemed important. One of the more important
aspects should be the scale-up of the recovery process. The 200 mg/L protein
concentrations used in this experiment are lower than a typical Pichia pastoris titer. It
would be a worthwhile study to determine if this process would work efficiently with
higher titers, a larger EBC column, and more resin. It would also be important to use a
strain of P. pastoris which produces protein, in order to gain a better understanding of the
effect of carbon and oxygen deprivation. Such a strain would allow the investigator to
monitor the AOX1 gene for changes during the deprivation, as well as provide the ability
to analyze titer for metabolic changes.

44
BIBLIOGRAPHY
1. Anspach FB, Curbelo D, Hartmann R, Garke G, Deckwer WD. 1999. Expanded-bed chromatography in primary protein purification. Journal of Chromatography A. 865:129-144.
2. Brobjer, M. 1999. Development and scale up of a capture step (expanded bed chromatography) for a fusion protein expressed intracellularly in Escherichia coli. Bioseparation. 8:219-228.
3. Cantoni, O., D. Murray and R.E. Meyn. 1986. Effect of 3-aminobenzamide on DNA strand-break rejoining and cytotoxicity in CHO cells treated with hydrogen peroxide. Biochimica et Biophysica Acta. 867(3):135-43.
4. Cereghino, J.L. and J.M. Cregg. 2000. Heterologous protein expression in the methylotrophic yeast Pichia pastoris. FEMS microbiology reviews. 24:45-66.
5. Charoenrat, T., M. Ketudat-Cairns, H. Stendahl-Anderson, M. Jahic, and S.-O. Enfors. 2005. Oxygen-limited fed-batch process: an alternative control for Pichia pastoris recombinant protein processes. Pioprocess Biosystem Engineering. 27:399-406.
6. Charoenrat, T., M. Ketudat-Cairns, M. Jahic, S.-O. Enfors, and A. Veide. 2006. Recovery of recombinant β-glucosidase by expanded bed adsorption from Pichia pastoris high-cell-density culture broth. Journal of Biotechnology. 122:86-98.
7. Couderc, R. and J. Baratti. 1980. Oxidation of methanol by the yeast Pichia pastoris. Purification and properties of alcohol oxidase. Agric Biol Chem. 44:2279-2289.
8. Cregg, J.M. and K.R. Madden. 1988. Development of the methylotrophic yeast, Pichia pastoris, as a host system for the production of foreign proteins. Developments in Industrial Microbiology. 29:33-41.
9. Cregg J.M., J.Lin Cereghino, J. Shi, and D.R. Higgins. 2000. Recombinant protein expression in Pichia pastoris. Molecular Biotechnology. 16:23-52.
10. Erickson J.C., J.D. Finch, and D.C. Greene. 1994. Direct capture of recombinant proteins from animal cell culture media using a fluidized bed adsorber. In: B Griffiths, RE Spier and W Berthold (eds) Animal Cell Technology: Products for today, prospects for tomorrow. Butterworth & Heinemann, Oxford. pp. 557–560.
11. Gasser, B., M. Maurer, J. Gach, R. Kunert, and D. Mattanovich. 2006. Engineering of Pichia pastoris for improved production of antibody fragments. Biotechnology and Bioengineering. 94:353-361.
12. Gray, D.R., S. Chen, W. Howarth, D. Inlow and B.L. Maiorella. 1996. CO2 in large-scale and high-density CHO cell perfusion culture. Cytotechnology. 22:65-78.
13. Higgins, D.R., and J.M. Cregg. Editors. 1998. Methods in Molecular Biology; Pichia Protocols. Humana Press: Totawa, New Jersey. In: Lin Cereghino, G.P., J. Lin Cereghino, C. Ilgen, and J.M. Cregg. 2002. Production of recombinant proteins in fermeter cultures of the yeast Pichia pastoris. Current Opinion in Biotechnology. 13:329-332.
14. Hristozova, T., T. Rasheva, T. Nedeva, and A. Kujumdzieva. 2002. Superoxide Dismutase during Glucose Repression of Hansenula polymorpha CBS 4732. Zeitschrift für Naturforschung. C. A journal of biosciences. 57(3-4):313-8.

45
15. Hu, W-S. and J.G. Adams. 1997. Large-scale mammalian cell culture. Current Opinion in Biotechnology. 8:148-153.
16. Katakura, Y., W. Zhang, G. Zhuang, T. Omasa, M. Kishimoto, Y. Goto, and K.-I. Suga. 1998. Effect of methanol concentration on the production of human β2-glycoprotein I domain V by a recombinant Pichia pastoris: a simple system for the control of methanol concentration using a semiconductor gas sensor. Journal of Fermentation Bioengineering. 86:482-487.
17. Lütkemeyer, D., N. Ameskamp, H. Tebbe, J. Wittler, and J. Lehmann. 1999. Estimation of cell damage in bench- and pilot-scale affinity expanded bed chromatography for the purification of monoclonal antibodies. Biotechnology and Bioengineering. 65:114-119.
18. Rypniewski, W.R., H.M. Holden, and I. Rayment. 1993. Structural consequences of reductive methylation of lysine residues in hen egg white lysozyme: an X-ray analysis at 1.8 Å resolution. Biochemistry. 32:9851.
19. Shi, X., T. Karkut, M. Chamankhah, M. Ating-Mees, S.M. Hemmingsen, and D. Hegedus. 2003. Optimal conditions for the expression of a single-chain antibody (scFv) gene in Pichia pastoris. Protein Expression and Purification. 28:321-330.
20. Shiloach J, Santambien P, Trinh L, Schapman A, Boschetti E. 2003. Endostatin capture from Pichia pastoris culture in a fluidized bed. From on-chip process optimization to application. J Chromatogr B. 790:327-36.
21. Sinha J., B.A. Plantz, M. Inan, M.M. Meagher. 2005. Causes of proteolytic degradation of secreted recombinant proteins produced in methylotrophic yeast Pichia pastoris: case study with recombinant ovine interferon-τ. Biotechnology and Bioengineering. 89:102–112.
22. Skarnes, R.C. and D.W. Watson. 1955. The inhibition of lysozyme by acidic polymers from pathogenic bacteria. Journal of Bacteriology. 70:110-112.
23. Tran, L.-T., Y. Inoue, and A. Kimura. 1993. Oxidative stress response in yeast: purification and some properties of a membrane-bound glutathione peroxidase from Hansenula mrakii. Biochimica et Biophysica Acta. 1164:166-172.
24. Valisena, S., P.E. Varaldo, and R. Fontana. 1996. Lysozyme inhibitors enhance immune response in mice. The New Microbiologica : Official Journal of the Italian Society for Medical, Odontoiatric, and Clinical Microbiology (SIMMOC). 19:25-30.
25. Vijayasankaran, N., R. Carlson, and F. Srienc. 2005. Synthesis of Poly[(R)-3-hydroxybutyric acid) in the Cytoplasm of Pichia pastoris under Oxygen Limitation. Biomacromolecules, 6:604-611.
26. Wang, S.L., S. Murao, and M. Arai. 1991. Inhibition of lysozyme activity by acidic polymers. Agric Biol Chem. 55:1401-1402.
27. Wegner, G. 1990. Emerging application of methelotrophic yeast. FEMS Microbiology Reviews. 87:279-284.
28. Werten, M.W.T., T.J. Van Den Bosch, R.D. Wind, H. Mooibroek, and D.A. de Wolf. 1999. High yield secretion of recombinant gelatins by Pichia pastoris. Yeast. 15:1087-1096.

46
APPENDIX
1. Process Recipes:
1.1. BSM (Basal Salt Media): Concentration H3PO4 (conc.) 26.7 mL/L CaSO4 0.93 g/L K2SO4 18.2 g/L MgSO4·7H2O 18.4 g/L KOH 4.13 g/L Glycerol 40 g/L
1.2. Biotin Solution: Concentration Sterile DI water 10 mL 2M NaOH A few drops D-biotin 0.4 g/L Sterile DI water Remaining vol.
1.3. BMGY (Buffered Minimal Glycerol complex) Medium: Concentration Biotin 400 µg/L Peptone 20 g/L Yeast Extract 10 g/L Glycerol 10 mL Yeast Nitrogen Base 13.4 g/L

47
1.4. PTM1 Trace Salts: Concentration H2SO4 5 mL/L CuSO4·5H2O 6 g/L NaI 0.08 g/L MnSO4·H2O 3.36 g/L Molybdic acid 0.2 g/L Boric acid 0.02 g/L CoCl2·6H2O 0.82 g/L ZnCl2 (work in hood) 20 g/L
FeSO4·7H2O 64.6 g/L
1.5. YEP (Yeast Extract Peptone) Plates: Concentration Yeast Extract 5 g/L Peptone 10 g/L Glucose 10 g/L Agar 20 g/L
Autoclave, mix, and pour at 50-60°C
1.6. YNB (Yeast Nitrogen Base) media: Concentration Yeast Nitrogen Base 6.7 g/L
KH2PO4 11.5 g/L K2HPO4 2.66 g/L Glycerol 20 g/L
1.7. Phosphate Buffer, 0.1 M, pH 7.0: Concentration 0.1M Na2HPO4 800 mL 0.1M NaH2PO4 200 mL Concentrated NaOH To pH 7.0
1.8. Tris-acetate buffer:
1.8.1 Tris-acetate buffer, 20 mM, pH 7.5 Concentration Tris (base) 0.484 g/L C2H4O2 To pH 7.5

48
1.8.2 Tris-acetate buffer, 20 mM, pH 9.5 + 1 M NaCl Concentration Tris (base) 0.484 g/L NaCl 58.44 g/L C2H4O2 To pH 9.5
1.8.3 Tris-acetate buffer, 20 mM, pH 9.5 + 2 M NaCl Concentration Tris (base) 0.484 g/L NaCl 116.88 g/L C2H4O2 To pH 9.5
1.8.4 Tris-acetate buffer, 40 mM, pH 8.5 + 1 M NaCl Concentration Tris (base) 0.969 g/L NaCl 58.44 g/L C2H4O2 To pH 8.5
1.8.5 Tris-acetate buffer,40 mM, pH 8.5 + 2 M NaCl Concentration Tris (base) 0.969 g/L NaCl 116.88 g/L C2H4O2 To pH 8.5
2. Pump Calibration The Cole-Farmer Instrument Company Masterflex three-roller peristaltic pumps
were calibrated using #16 Pharmed Masterflex tubing ranging in flowrates from
7.67 mL/min to 180 mL/min. The settings are arbitrary values written on the pump
motor. All calibrations used fermentation broths which were both growing and aerated.
(Table 11)

49
Setting mL Time (minutes) mL/min Residence Time for 1L (minutes) 0.5 23 3 7.67 130.4 0.75 35 2 17.5 57 1.00 43 2 21.5 46.5 1.50 47 1 47 21.27 2.00 70 1 70 14.28 2.50 170 2 85 11.76 3.00 212 2 106 9.43 3.50 125 1 125 8.00 3.75 135 1 135 7.40 4.00 150 1 150 6.67 4.50 165 1 165 6.06 5.00 180 1 180 5.55
Table 11 - Cole-Farmer Masterflex Pump Calibration Using #16 Tubing and Aerated Fermentation Broth
3. Growth curve of Pichia pastoris
1
10
100
0:00:00 4:48:00 9:36:00 14:24:00 19:12:00
Hours since inoculation
Opt
ical
Den
sity
(OD
600)
Figure 13 - Growth curve of P. pastoris at 27°C and 200 RPM in YNB media.

50
4. Maceration Effects of the CM Hyper-Z Resin on P. pastoris in a Bioflo 3000 Fermenter
Time Since inoculation
With Resin
Without Resin
0.566667 0.445 1.25 0.69 2.833333 0.707 4.75 1.396 21.15 2.252 21.91667 4.9 22.73333 3.182 24.16667 5.82 24.21667 4.11 25.5 6.28 28.75 7.04 32.23333 4.82 32.91667 9.56 51.75 65.4 56.11 77.6 57.65 86 72.4 117.5
Table 12 – Maceration Effects of CM Hyper-Z in a Bioflo 3000 on P. pastoris
5. Determining the Effect of Nutrient Deprivation on P. pastoris
Time into Methanol (hours) Wet weight (g/L) Adjusted Wet weight (g/L) CO2 (mL/min) 20:13 266 266 146.115 22:34 286 281 149.24 26:38 318 305 148.46 29:58 348 327.5 156.78 42:09 384 354.5 176 45:08 390 359 177.38 49:06 418 380 187.92 Table 13 - The Effect of Residence Time on CO2 and Wet Weight – Control
Time into Methanol (hours) Wet weight (g/L) Adjusted Wet weight (g/L) CO2 (mL/min) 20:05 290 290 144.12 21:00 296 294.5 149.89 22:35 304 300.5 149.84 25:40 322 314 155.68 40:10 368 348.5 169.6 43:15 394 368 178.41 45:00 398 371 178.57 48:30 422 389 182.85
Table 14 - The Effect of Residence Time on CO2 and Wet Weight – Control (2)

51
Time into Methanol (hours) Wet weight (g/L) CO2 (mL/min) 19:29 280 144.56 22:22 302 147.68 25:28 302 152.36 29:33 328 158.6 40:58 344 163.8 44:10 372 169.78 46:34 374 171.6
Table 15 - The Effect of Residence Time on CO2 and Wet Weight – 7.5 Minutes
Time into Methanol (hours) Wet weight (g/L) CO2 (mL/min) 20:15 294 150.24 23:31 328 148.96 27:54 326 155.28 32:35 350 156.16 43:40 375.1 171.2 48:25 403.6 178.8
Table 16 - The Effect of Residence Time on CO2 and Wet Weight - 7.5 Minutes (2)
Time into Methanol (hours) Wet weight (g/L) CO2 (mL/min) 20:25 280 143.1 23:45 312 153.9 25:25 326 157.68 29:15 346 155.25 32:55 358 163.08 44:05 376 169.56 49:30 404 173.61 52:55 418 180.9 55:35 420 180.125 67:25 434 192.78 69:30 448 195.48
Table 17 - The Effect of Residence Time on CO2 and Wet Weight - 60 Minutes
Time into Methanol (hours) Wet weight (g/L) CO2 (mL/min) 19:55 316 154.71 22:40 318 156.87 25:24 326 156.87 27:34 346 159.3 29:59 358 160.38 32:12 352 162 43:48 394 170.395 47:32 398 180.63 49:45 408 178.345
Table 18 - The Effect of Residence Time on CO2 and Wet Weight - 130 Minutes

52
Time into Methanol (hours) Wet weight (g/L) CO2 (mL/min)
19:30 298 CO2 detection system error
24:00 344 148.19 27:25 352 150.8 30:55 364 153.8125 33:15 360 156.6875 44:10 414 166.32 48:05 426 169.12
Table 19 - The Effect of Residence Time on CO2 and Wet Weight - 130 Minutes
5.1. Statistical Analysis of the CO2 Output using SPSS 14.00 Univariate Analysis of Variance Between-Subjects Factors
Value Label N 1 Control (1) 72 Control (2) 83 7.5 Min (1) 74 7.5 Min (2) 65 60 Min 116 130 Min (1) 9
Condition
7 130 Min (2) 6 Tests of Between-Subjects Effects Dependent Variable: CO2
Source Type III Sum of Squares df Mean Square F Sig.
Corrected Model 9354.776(a) 13 719.598 122.657 .000 Intercept 70838.835 1 70838.835 12074.590 .000 Condition 201.476 6 33.579 5.724 .000 Time 6270.374 1 6270.374 1068.795 .000 Condition * Time 266.492 6 44.415 7.571 .000 Error 234.671 40 5.867 Total 1446849.585 54 Corrected Total 9589.447 53
a R Squared = .976 (Adjusted R Squared = .968)

53
Parameter Estimates Dependent Variable: CO2
95% Confidence Interval Parameter B Std. Error t Sig. Lower Bound Upper Bound Intercept 126.684 4.066 31.160 .000 118.467 134.901[Condition=1] -12.059 5.059 -2.384 .022 -22.284 -1.834[Condition=2] -5.450 4.866 -1.120 .269 -15.284 4.384[Condition=3] .818 5.086 .161 .873 -9.461 11.097[Condition=4] -1.099 5.242 -.210 .835 -11.694 9.497[Condition=5] 2.651 4.533 .585 .562 -6.511 11.813[Condition=6] 9.408 4.874 1.930 .061 -.443 19.260[Condition=7] 0(a) . . . . .Time .889 .114 7.811 .000 .659 1.119[Condition=1] * Time .551 .142 3.874 .000 .263 .838[Condition=2] * Time .384 .137 2.806 .008 .108 .661[Condition=3] * Time .055 .145 .381 .705 -.237 .348[Condition=4] * Time .166 .149 1.110 .274 -.136 .467[Condition=5] * Time .051 .122 .421 .676 -.195 .298[Condition=6] * Time -.037 .138 -.269 .789 -.315 .241[Condition=7] * Time 0(a) . . . . .a This parameter is set to zero because it is redundant.

54
Control (1) Control (2) 7.5 Min (1)
7.5 Min (2) 60 Min 130 Min (1)(
130 Min (2)
Linear Regression with95.00% Mean Prediction Interv al
150.00
175.00
200.00
225.00
CO
2
CO2 = 114.63 + 1.44 * TimeR-Square = 0.97 CO2 = 121.23 + 1.27 * Time
R-Square = 0.98
CO2 = 127.50 + 0.94 * TimeR-Square = 0.97
150.00
175.00
200.00
225.00
CO
2
CO2 = 125.59 + 1.05 * TimeR-Square = 0.96 CO2 = 129.34 + 0.94 * Time
R-Square = 0.97CO2 = 136.09 + 0.85 * TimeR-Square = 0.95
20.000 30.000 40.000 50.000 60.000 70.000
Time
150.00
175.00
200.00
225.00
CO
2
CO2 = 126.68 + 0.89 * TimeR-Square = 1.00

55
5.2. Statistical Analysis of the Wet Weight using SPSS 14.00
Univariate Analysis of Variance Between-Subjects Factors Value Label N
1 Control (1) 72 Control (2) 83 7.5 Min (1) 74 7.5 Min (2) 65 60 Min 116 130 Min (1) 9
Condition
7 130 Min (2) 7 Tests of Between-Subjects Effects Dependent Variable: WetWeight
Source Type III Sum of Squares df Mean Square F Sig.
Corrected Model 103158.047(a) 13 7935.234 85.345 .000 Intercept 265192.159 1 265192.159 2852.191 .000 Condition 1166.652 6 194.442 2.091 .075 Time 69563.009 1 69563.009 748.163 .000 Condition * Time 683.887 6 113.981 1.226 .313 Error 3812.114 41 92.978 Total 6825723.220 55 Corrected Total 106970.161 54
a R Squared = .964 (Adjusted R Squared = .953) Parameter Estimates Dependent Variable: WetWeight
95% Confidence Interval Parameter B Std. Error t Sig. Lower Bound Upper Bound Intercept 233.557 12.820 18.218 .000 207.666 259.448[Condition=1] -29.690 17.551 -1.692 .098 -65.134 5.755[Condition=2] -7.057 16.662 -.424 .674 -40.707 26.593[Condition=3] -9.700 17.674 -.549 .586 -45.393 25.993[Condition=4] 1.732 18.384 .094 .925 -35.394 38.859[Condition=5] 11.241 15.104 .744 .461 -19.262 41.744[Condition=6] 19.584 16.702 1.173 .248 -14.146 53.314[Condition=7] 0(a) . . . . .Time 4.061 .378 10.729 .000 3.296 4.825[Condition=1] * Time -.473 .508 -.930 .358 -1.499 .554

56
[Condition=2] * Time -.817 .485 -1.686 .099 -1.796 .162[Condition=3] * Time -.845 .519 -1.627 .111 -1.893 .204[Condition=4] * Time -.674 .539 -1.249 .219 -1.763 .416[Condition=5] * Time -1.025 .416 -2.460 .018 -1.866 -.183[Condition=6] * Time -.922 .488 -1.891 .066 -1.907 .062[Condition=7] * Time 0(a) . . . . .
a This parameter is set to zero because it is redundant.
6. Binding Experiments
6.1. Dynamic Binding Capacity in Buffer
time (minutes) mg Lys UV 280 C/C0 10 195 0.006 0.00096825 487.5 0.01 0.00161335 682.5 0.011 0.00177445 877.5 0.028 0.00451655 1072.5 0.176 0.02838765 1267.5 2.01 0.32419475 1462.5 3.96 0.63871 95 1852.5 5.2 0.83871 105 2047.5 5.7 0.919355115 2242.5 6.13 0.98871
Table 20 - Dynamic Binding Capacity in Buffer - 250 cm/hr
time (minutes) mg Lys UV280 C/Co
10 270 0.007 0.00112920 540 0.014 0.00225830 810 0.005 0.00080640 1080 0.006 0.00096850 1350 0.033 0.00532360 1620 0.338 0.05451670 1890 2.52 0.40645280 2160 4.56 0.735484
Table 21 - Dynamic Binding Capacity in Buffer - 350 cm/hr

57
6.2. Dynamic Binding Capacity in Whole Fermentation Broth
Max U/min
ml into the
column
Amt gone into column
(mg) 9:12 9:27 0 90 18 9:35 0 138 27.6 9:53 0 246 49.2
10:00 0 288 57.6 10:12 0 360 72 10:29 0 462 92.4 10:40 0 528 105.6 10:56 0 624 124.8 11:09 0 702 140.4 11:24 0 792 158.4 11:43 0 906 181.2 12:05 0 1038 207.6 12:26 0 1140.9 228.18 12:53 0 1273.2 254.64 13:15 0 1381 276.2 13:29 0 1449.6 289.92 13:45 100 1528 305.6 13:58 120 1591.7 318.34 14:14 0 1670.1 334.02 14:46 220 1826.9 365.38 15:10 180 1944.5 388.9 15:43 250 2106.2 421.24 16:15 340 2263 452.6 16:56 420 2463.9 492.78 17:22 530 2591.3 518.26 17:45 620 2704 540.8 18:20 920 2875.5 575.1 18:51 1050 3027.4 605.48 19:50 1700 3316.5 663.3
Ingoing 2500 Table 22 - Binding Capacity of Lysozyme in Whole Pichia pastoris Fermentation Broth

58
6.3. Recirculating Binding Capacity in Whole Fermentation Broth
Hours into Methanol
Hours from Experimental Start
Max U/min
10:12:00 0:00:00 2350 10:35:00 0:23:00 2300 11:07:00 0:55:00 2300 11:26:00 1:14:00 2200 11:43:00 1:31:00 2250 12:04:00 1:52:00 2250 12:32:00 2:20:00 2725 13:01:00 2:49:00 2275 13:33:00 3:21:00 2650 14:36:00 4:24:00 1750 14:59:00 4:47:00 1700 15:30:00 5:18:00 1750 16:04:00 5:52:00* 1550 16:45:00 6:33:00 1700 17:26:00 7:14:00 1500 18:39:00 8:27:00 1400 19:05:00 8:53:00 1525 19:33:00 9:21:00 1125 21:15:00 11:03:00 1650 22:10:00 11:58:00 1050 34:27:00 24:15:00 900 37:00:00 26:48:00 1180 37:57:00 27:45:00 1200 39:29:00 29:17:00 1000
Table 23 - Recirculating Binding Capacity in Whole Pichia pastoris Fermentation Broth (* Temperature lowered from 30 to 20.5°C)

59
7. The Complete Experimental System
Hours into fermentation
Hours from Column Start
U/mL in fermenter
73.67 0.00 3033 76.05 2.38 3000 79.33 5.67 2130 82.93 9.27 1620 95.42 21.75 1350 98.87 25.20 1000 100.65 26.98 1000 103.40 29.73 960 120.35 46.68 795
Table 24 - Run #1 of the Complete Experimental System
Hours into fermentation
Hours from Column Start
U/mL in fermenter
74.93 0.00 1350.00 76.77 1.83 1200.00 83.50 8.57 1095.00 91.45 16.52 905.00 96.28 21.35 780.00 99.70 24.77 750.00 102.87 27.93 740.00 119.70 44.77 610.00
Table 25 - Run #2 of the Complete Experimental System
Recommended