FINAL - June 15, 2004
H:\Clients\Lincoln_KCO\6903A.10\Dlv\TM\Tech Memo 3\Technical Memo 3.doc i
CITY OF LINCOLN, NEBRASKA
STEVENS CREEK BASIN TRUNK SEWER
TECHNICAL MEMORANDUM NO. 3
TABLE OF CONTENTS
Page No.
1.0 INTRODUCTION........................................................................................................1
2.0 HYDRAULIC BASICS ................................................................................................1
2.1 Manning’s Equation ...................................................................................... 1
2.2 Depth of Flow (d/D) ......................................................................................... 2
2.3 Pipeline Velocity .............................................................................................. 2
2.4 Pipe Size ........................................................................................................ 2
3.0 MODELING ................................................................................................................3
3.1 Methodology .................................................................................................. 3
3.2 System Layout............................................................................................... 3
3.3 Hydraulic Model Development .................................................................... 4
3.4 Subbasin Inflow............................................................................................. 5
4.0 DESCRIPTION OF TRUNK SEWER MODEL RUNS ................................................9
4.1 Trunk Sewer Model Run No. 1.................................................................... 9
4.2 Trunk Sewer Model Run No. 2 ...................................................................... 14
4.3 Trunk Sewer Model Run No. 3 ...................................................................... 18
4.4 Trunk Sewer Model Run No. 4 ...................................................................... 22
4.5 Trunk Sewer Model Run No. 5 ...................................................................... 26
4.6 Subbasin E-2 Sewer Model Run ................................................................... 29
4.7 Probable Opinion of Estimated Project Costs................................................ 32
4.8 Summary of Modeling Results....................................................................... 33
5.0 SELECTION OF THE PREFERRED TRUNK SEWER SIZE ...................................34
5.1 Purpose of Modeling...................................................................................... 34
5.2 Selecting the Trunk Sewer Size To Serve Tier I and Tier II........................... 34
5.3 Selecting the Trunk Sewer Size Based On Estimated Years of Service ....... 34
5.4 Recommended Model Run (Trunk Sewer Size) ............................................ 37
LIST OF TABLES
Table 1 Modeling Input Constraints ..................................................................................5
Table 2 Comparison of GIS Data to City Data ..................................................................5
Table 3 Randomly Selected Subbasin Area Comparison .................................................6
Table 4 Subbasin Area......................................................................................................7
Table 5 Model Run No. 1 - Westside Only......................................................................13

FINAL - June 15, 2004
H:\Clients\Lincoln_KCO\6903A.10\Dlv\TM\Tech Memo 3\Technical Memo 3.doc ii
Table 6 Model Run No. 2 – Westside plus Subbasin E6.................................................17
Table 7 Model Run 3 – Westside plus Subbasin E6 & Eastside Subbasins ...................21
Table 8 Model Run 4 – Westside plus Subbasin E6 and Eastside Subbasins at Jct Structure E-7.................................................................................................................25
Table 9 Model Run Subbasin E-2 ...................................................................................31
Table 10 Preliminary Costs (1) (2) for Model Runs 1 Through 4 ..........................................32
Table 11 Phase I – Area Served by Pipe Size ..................................................................37
LIST OF FIGURES
Figure 1 Watershed Subbasins and Stream Network 8
Figure 2 Model Run No. 1 Plan View 10
Figure 3 Model Run No. 1 Flow Schematic 11
Figure 4 Model Run No. 1 Profile 12
Figure 5 Model Run No. 2 Plan View 15
Figure 6 Model Run No. 2 Flow Schematic 16
Figure 7 Model Run No. 3 Plan View 19
Figure 8 Model Run No 3. Flow Schematic 20
Figure 9 Model Run No. 4 Plan view 23
Figure 10 Model Run No. 4 Flow Schematic 24
Figure 11 Model Run No. 5 Plan View 27
Figure 12 Model Run No. 5 Flow Schematic 28
Figure 13 Subbasin E-2 Plan View 30
Figure 14 Projected Peak Flow vs Pipe Size 36
APPENDIX A Model Run No. 1 Output APPENDIX B Model Run No. 1 Estimated Cost Data APPENDIX C Model Run No. 2 Output APPENDIX D Model Run No. 2 Estimated Cost Data APPENDIX E Model Run No. 3 Output APPENDIX F Model Run No. 3 Estimated Cost Data APPENDIX G Model Run No. 4 Output APPENDIX H Model Run No. 4 Estimated Cost Data APPENDIX I Model Run No. 5 Output APPENDIX J Model Run No. 5 Estimated Cost Data APPENDIX K Subbasin E-2 Model Output APPENDIX L Subbasins E-2 Model Estimated Cost Data
FINAL - June 15, 2004
H:\Clients\Lincoln_KCO\6903A.10\Dlv\TM\Tech Memo 3\Technical Memo 3.doc 1
Technical Memorandum No. 3
HYDRAULICS & PRELIMINARY MODELING
1.0 INTRODUCTION
The purpose of preliminary modeling is to establish the peak design flow from the various
subbasins and to determine the preliminary size of the Stevens Creek Basin Trunk Sewer that
will be required to convey these flows to the Northeast Wastewater Treatment Plant (NE
WWTP). Several scenarios were modeled to provide the City with the information needed to
select a trunk sewer to provide capacity for the west side or a combination of the west and east
side (future) service areas. In addition, preliminary slopes, depth of flow, velocities, and
locations of structures were identified.
It should be noted that the preliminary modeling is not to be used as the method for the
selection of the preferred alignment. The selection of the preferred alignment will be completed
after the basic decisions relating to the area to be served have been identified. Once the
preferred alignment has been selected, additional field reconnaissance will be conducted. This
reconnaissance will include field survey to verify stream flow lines, locating major utilities and
collecting other data. At this point, the model will be refined to reflect the preferred alignment
and the actual field survey. Additionally, it is recommended that the model be revisited during
final design to reflect any changes made.
2.0 HYDRAULIC BASICS
2.1 Manning’s Equation
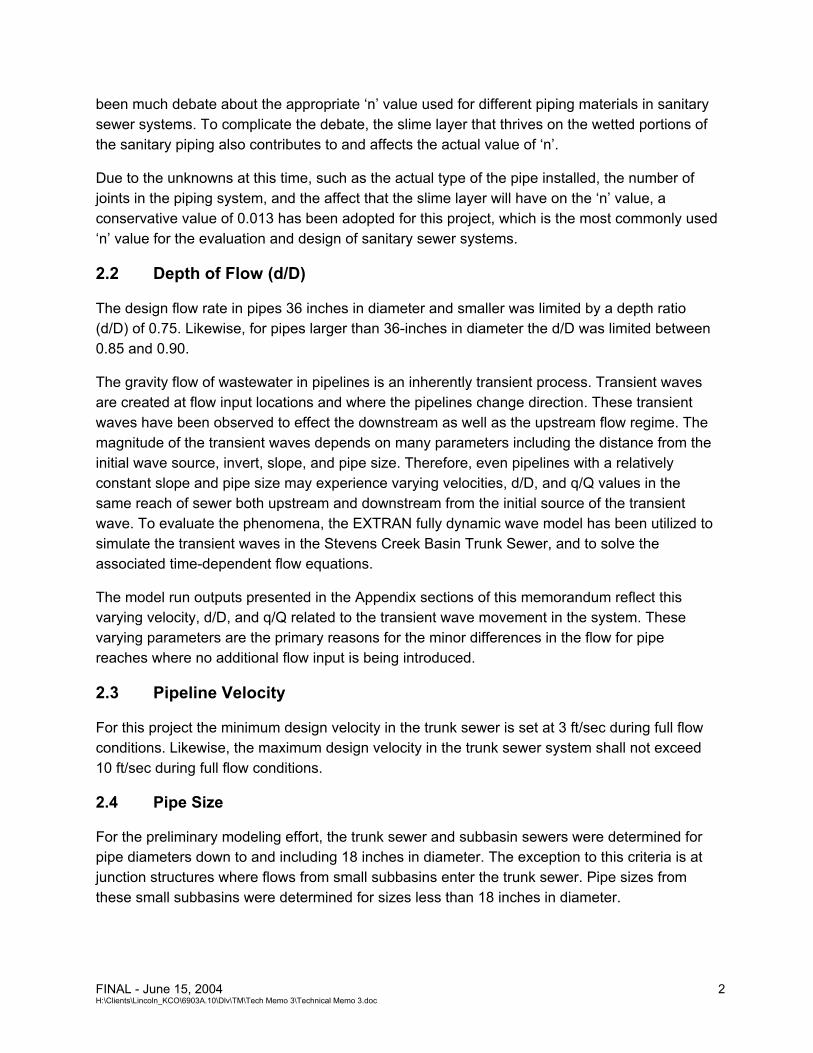
The Manning’s Equation is the most commonly used resistance formula for the analysis of open
channel and gravity flow pipe systems. The equation modified to English Units is shown below.
21
3249.1 SR
nV
Where:
V = Average velocity (ft/sec)
R = Hydraulic radius (ft)
S = Slope of the Energy Grade Line (ft/ft)
‘n’ = Roughness coefficient
The roughness coefficient varies depending on the type of material. For example, glass would
have an ‘n’ value of 0.010 while earth channels would have an ‘n’ value of 0.020. There has
FINAL - June 15, 2004
H:\Clients\Lincoln_KCO\6903A.10\Dlv\TM\Tech Memo 3\Technical Memo 3.doc 2
been much debate about the appropriate ‘n’ value used for different piping materials in sanitary
sewer systems. To complicate the debate, the slime layer that thrives on the wetted portions of
the sanitary piping also contributes to and affects the actual value of ‘n’.
Due to the unknowns at this time, such as the actual type of the pipe installed, the number of
joints in the piping system, and the affect that the slime layer will have on the ‘n’ value, a
conservative value of 0.013 has been adopted for this project, which is the most commonly used
‘n’ value for the evaluation and design of sanitary sewer systems.
2.2 Depth of Flow (d/D)
The design flow rate in pipes 36 inches in diameter and smaller was limited by a depth ratio
(d/D) of 0.75. Likewise, for pipes larger than 36-inches in diameter the d/D was limited between
0.85 and 0.90.
The gravity flow of wastewater in pipelines is an inherently transient process. Transient waves
are created at flow input locations and where the pipelines change direction. These transient
waves have been observed to effect the downstream as well as the upstream flow regime. The
magnitude of the transient waves depends on many parameters including the distance from the
initial wave source, invert, slope, and pipe size. Therefore, even pipelines with a relatively
constant slope and pipe size may experience varying velocities, d/D, and q/Q values in the
same reach of sewer both upstream and downstream from the initial source of the transient
wave. To evaluate the phenomena, the EXTRAN fully dynamic wave model has been utilized to
simulate the transient waves in the Stevens Creek Basin Trunk Sewer, and to solve the
associated time-dependent flow equations.
The model run outputs presented in the Appendix sections of this memorandum reflect this
varying velocity, d/D, and q/Q related to the transient wave movement in the system. These
varying parameters are the primary reasons for the minor differences in the flow for pipe
reaches where no additional flow input is being introduced.
2.3 Pipeline Velocity
For this project the minimum design velocity in the trunk sewer is set at 3 ft/sec during full flow
conditions. Likewise, the maximum design velocity in the trunk sewer system shall not exceed
10 ft/sec during full flow conditions.
2.4 Pipe Size
For the preliminary modeling effort, the trunk sewer and subbasin sewers were determined for
pipe diameters down to and including 18 inches in diameter. The exception to this criteria is at
junction structures where flows from small subbasins enter the trunk sewer. Pipe sizes from
these small subbasins were determined for sizes less than 18 inches in diameter.
FINAL - June 15, 2004
H:\Clients\Lincoln_KCO\6903A.10\Dlv\TM\Tech Memo 3\Technical Memo 3.doc 3
3.0 MODELING
3.1 Methodology
In order to accurately design and model the Stevens Creek Basin Trunk Sewer system it is
necessary that the computer model be able to account for the time wastewater takes to flow
from one manhole or structure to the next. For this to be accomplished, the model calculated the
flow velocity based on the contributed flows at each input point to determine the time for this
flow to reach the next input flow point. Inflows are added at each input point and the total flow is
then used to calculate the travel time to the next downstream manhole or structure. The model
then determines the water surface elevation at each manhole or junction structure so that the
depth of flow and velocity can be determined.
XP SWMM and SewerCAD computer models were both used for the hydraulic analysis and
modeling efforts. XP SWMM, marketed by XP-software, is a dynamic-state analysis tool and is
an extremely powerful program for the design and analysis of flows in pipe networks.
SewerCAD, marketed by Haestad Methods, is a steady-state analysis tool and one of the most
advanced design, analysis, and planning tools, handling both pressurized force mains and
gravity hydraulics.
3.2 System Layout
3.2.1 Utility Planning Zones
The City of Lincoln has developed utility planning zones. These zones are further separated into
Tiers relating to the planning time frame when the need for sewage interceptors are anticipated
to be needed as described in the Wastewater Facilities Plan, Update, October 2002. Tier I areas
are defined as needing sewage interceptor service within the next 25 years, Tier II areas are
defined as needing sewage interceptor service between 25 and 50 years, and Tier III areas are
identified as needing sewage service 50 years or more into the future. These Tier zones
generally follow the subbasin areas that were used to calculate the wastewater flows for the
different modeling runs that are discussed in Section 1.5. A summary of these Tiers and the
associated subbasins associated with them is as follows:
Tier I includes subbasins E-1, E-2, E-3, E-11 and E-12. Tier II includes subbasins E-4, E-5, and E-6. Tier III includes subbasins E-7, E-8, E-9, and E-10.
3.2.2 Phasing
For the purpose of the preliminary trunk sewer modeling (Technical Memorandum No. 3) and
subsequent alternative alignment analysis (Technical Memorandum No. 4), the west side of the
Stevens Creek Basin Trunk Sewer has been divided into the following preliminary construction
phases. The actual phasing of the construction may vary from that shown here as determined
by the City as the project proceeds.

FINAL - June 15, 2004
H:\Clients\Lincoln_KCO\6903A.10\Dlv\TM\Tech Memo 3\Technical Memo 3.doc 4
Tier I Areas (West Side of Stevens Creek):
Phase I - NE WWTP (Junction Structure E-12) to Fletcher Avenue (Junction Structure E-11/E-6). Phase II - Fletcher Avenue (Junction Structure E-11/E-6) to Murdock Trail (Junction Structure E-1) which is located approximately half way between Havelock Avenue and Adams Street. Phase III - Murdock Trail (Junction Structure E-1) to Holdrege Avenue (Junction Structure E-2). Phase IV - Holdrege Avenue (Junction Structure E-2) to near 98th and “O” Street. (Subbasin trunk sewer that will serve Subbasin E-2). Phase V - Holdrege Avenue (Junction Structure E-2) to just north of “A” Street (Junction Structure E-3A). Phase VI - “A” Street (Junction Structure E-3A) to Van Dorn Street (Junction Structure E-4)
Tier II Areas (West Side of Stevens Creek):
Phase VII - Van Dorn Street (Junction Structure E-4) to Pioneers Blvd (Junction Structure E-5G). Phase VIII - Pioneers Blvd. (Junction Structure E-5G) to Pine Lake Road (Junction Structure E-5C). Phase IX - Pine Lake Road (Junction Structure E-5C) to Yankee Hill Road (Junction Structure E-5A).
Tier II Area (East Side of Stevens Creek)
Subbasin E-6 is the farthest north subbasin located on the east side of the Stevens Creek which is also identified as being a Tier II Zone.
A more detailed description of these phases is discussed in Technical Memorandum No. 4.
3.3 Hydraulic Model Development
SewerCAD was used to determine the physical constraints and characteristics, such as pipe
size and structure locations. This was accomplished using minimum and maximum constraints
such as depth of cover, velocity, and pipe slope. The output from SewerCAD was then used to
define the model input for XP-SWMM. XP-SWMM was utilized to determine the dynamic
hydraulic model of the trunk sewer system.
The basic information used to preliminarily size the sewers using the SewerCAD Program
included:
Ground surface elevation. Minimum and maximum cover over the pipe. Minimum and maximum allowed pipeline velocities. Mannings ‘n’. Flow input data for each sub basin. Physical sewer manholes (nodes) location (located using Cartesian Coordinates).
The minimum and maximum cover, minimum and maximum velocities, and Manning’s n were
defined as modeling constraints as shown in Table 1 below. In general, the design constraints
attempt to minimize excavation and pipe size while maximizing capacity.
FINAL - June 15, 2004
H:\Clients\Lincoln_KCO\6903A.10\Dlv\TM\Tech Memo 3\Technical Memo 3.doc 5
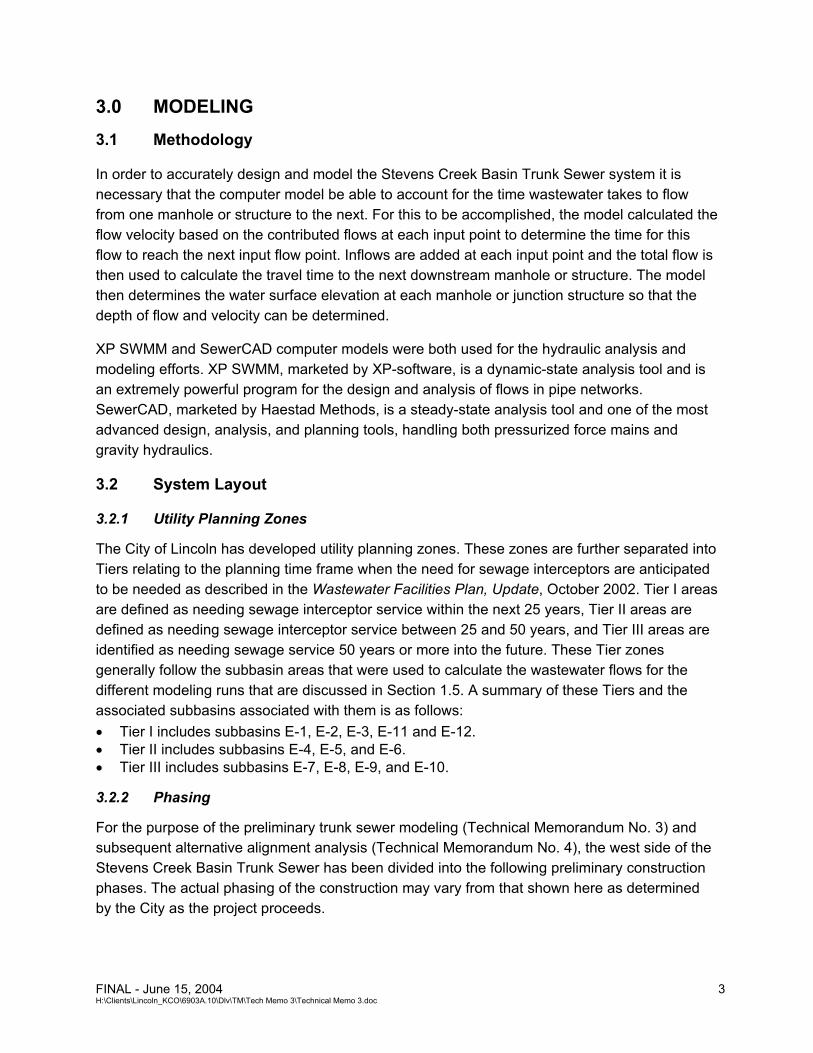
Table 1 Modeling Input Constraints Stevens Creek Trunk Basin Sewer City of Lincoln, Nebraska
Constraint Value
Mannings ‘n’ 0.013
Minimum allowable velocity at design conditions 3 ft/sec
Maximum allowable velocity at design condition 10 ft/sec
Maximum slope Varies
Minimum slope Varies
Maximum cover 25 ft
Minimum cover 15 ft
3.4 Subbasin Inflow
The City’s flow equation for peak design flow was used for the modeling of the Stevens Creek
Basin Trunk Sewer as defined in Technical Memorandum 1 and as shown below.
Q = 0.01726 A(0.8) + 0.003 A
Where:
Q = wastewater flow in cfs
A = Area in acres.
The only variable required to determine peak subbasin flow to the main trunk sewer is the
contributing subbasin area. Subbasin areas were calculated from the City’s two-foot contour
intervals data using an automated ArcView GIS computer model. Prior to the actual modeling
these subbasin areas where compared against the City Planning Department values. This
comparison revealed that the GIS computer generated areas were within one percent of the
planning departments values as shown in Table 2 below.
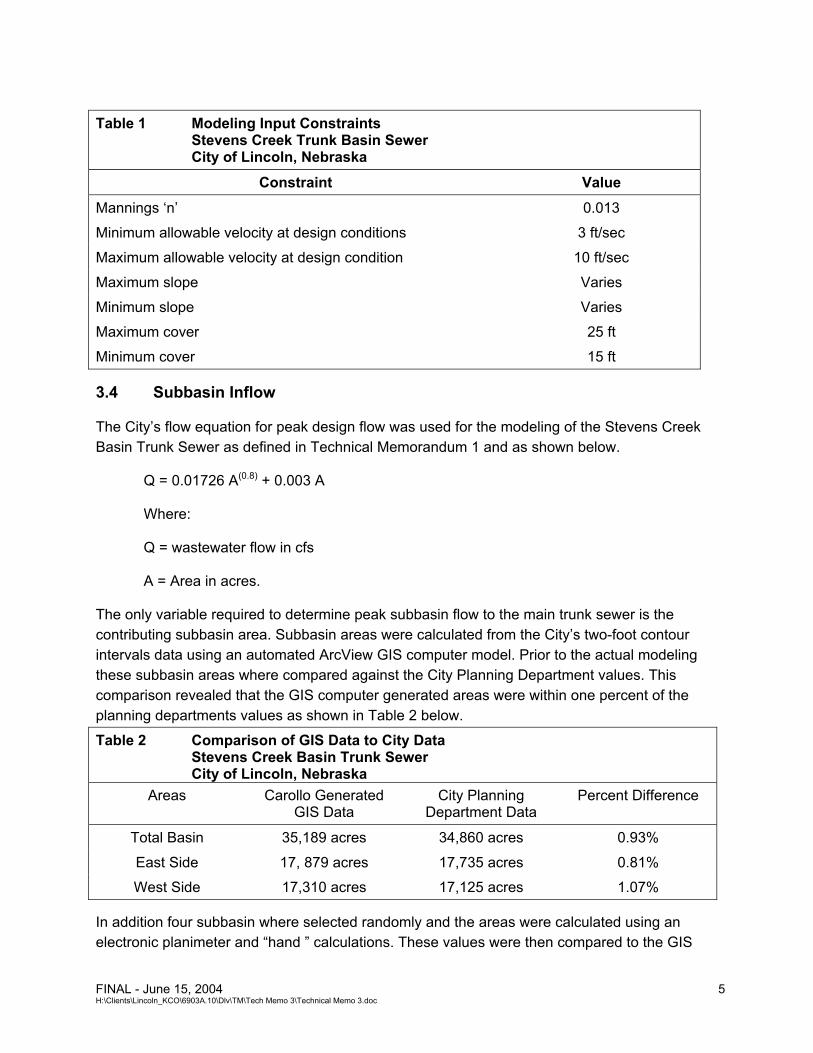
Table 2 Comparison of GIS Data to City Data Stevens Creek Basin Trunk Sewer City of Lincoln, Nebraska
Areas Carollo Generated GIS Data
City Planning Department Data
Percent Difference
Total Basin 35,189 acres 34,860 acres 0.93%
East Side 17, 879 acres 17,735 acres 0.81%
West Side 17,310 acres 17,125 acres 1.07%
In addition four subbasin where selected randomly and the areas were calculated using an
electronic planimeter and “hand ” calculations. These values were then compared to the GIS
FINAL - June 15, 2004
H:\Clients\Lincoln_KCO\6903A.10\Dlv\TM\Tech Memo 3\Technical Memo 3.doc 6
generated areas to confirm the subbasin areas used in the modeling. This exercise revealed
that the GIS generated areas were within acceptable limits as shown in Table 3 below.
Table 3 Randomly Selected Subbasin Area Comparison Stevens Creek Basin Trunk Sewer City of Lincoln, Nebraska
Subbasin GIS-generated Area (acres)
Manually-generated Area (acres) Deviation (%)
E1 1485.024 1539 3.5
E2 1816.941 1815 -0.11
E3 4405.285 4397 -0.19
E5 4818.472 4938 2.4
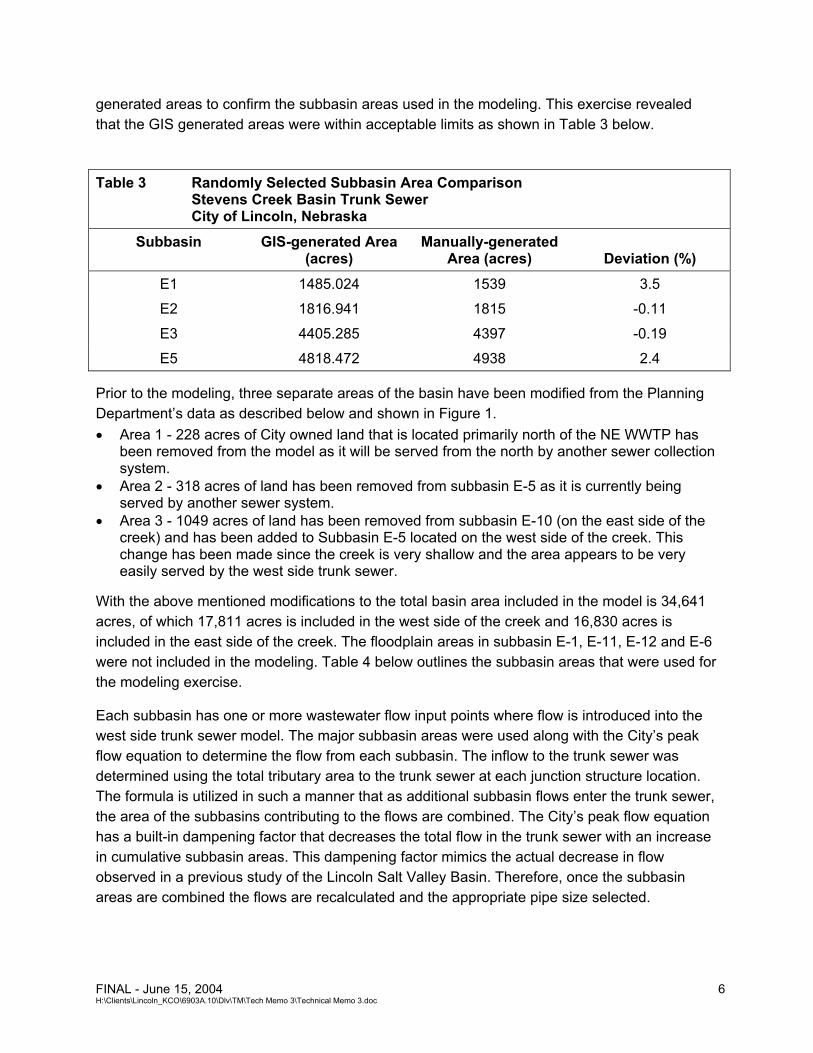
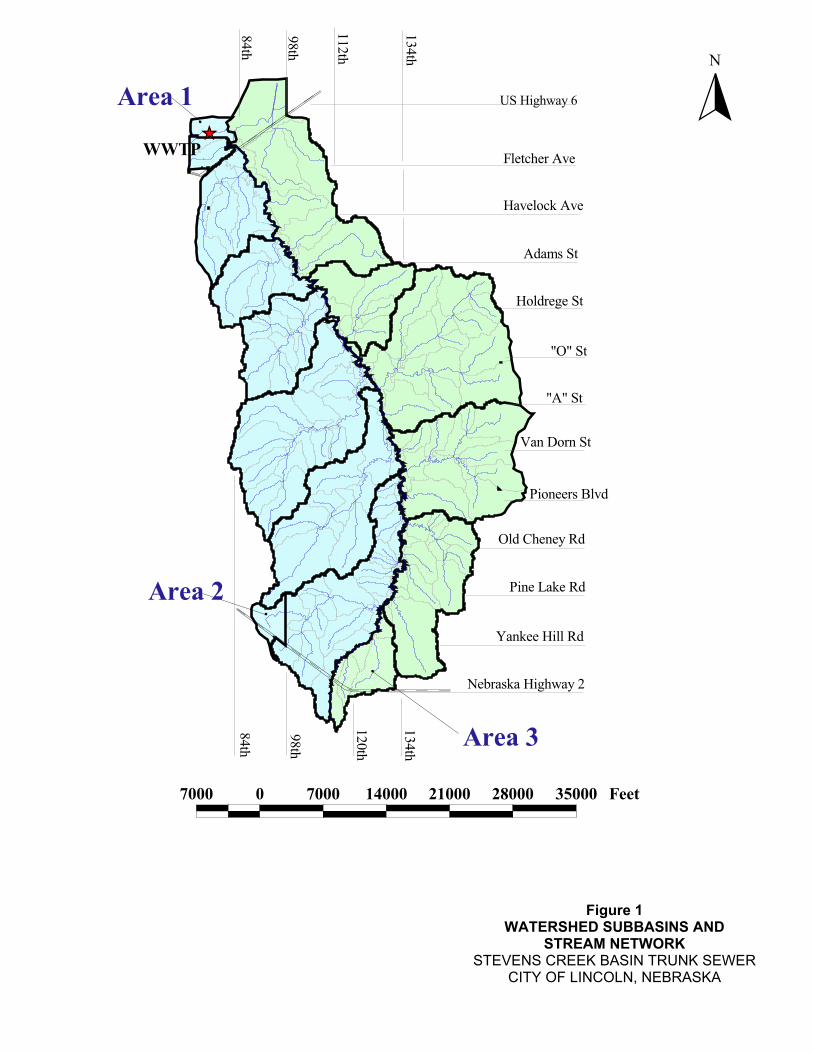
Prior to the modeling, three separate areas of the basin have been modified from the Planning
Department’s data as described below and shown in Figure 1.
Area 1 - 228 acres of City owned land that is located primarily north of the NE WWTP has been removed from the model as it will be served from the north by another sewer collection system. Area 2 - 318 acres of land has been removed from subbasin E-5 as it is currently being served by another sewer system. Area 3 - 1049 acres of land has been removed from subbasin E-10 (on the east side of the creek) and has been added to Subbasin E-5 located on the west side of the creek. This change has been made since the creek is very shallow and the area appears to be very easily served by the west side trunk sewer.
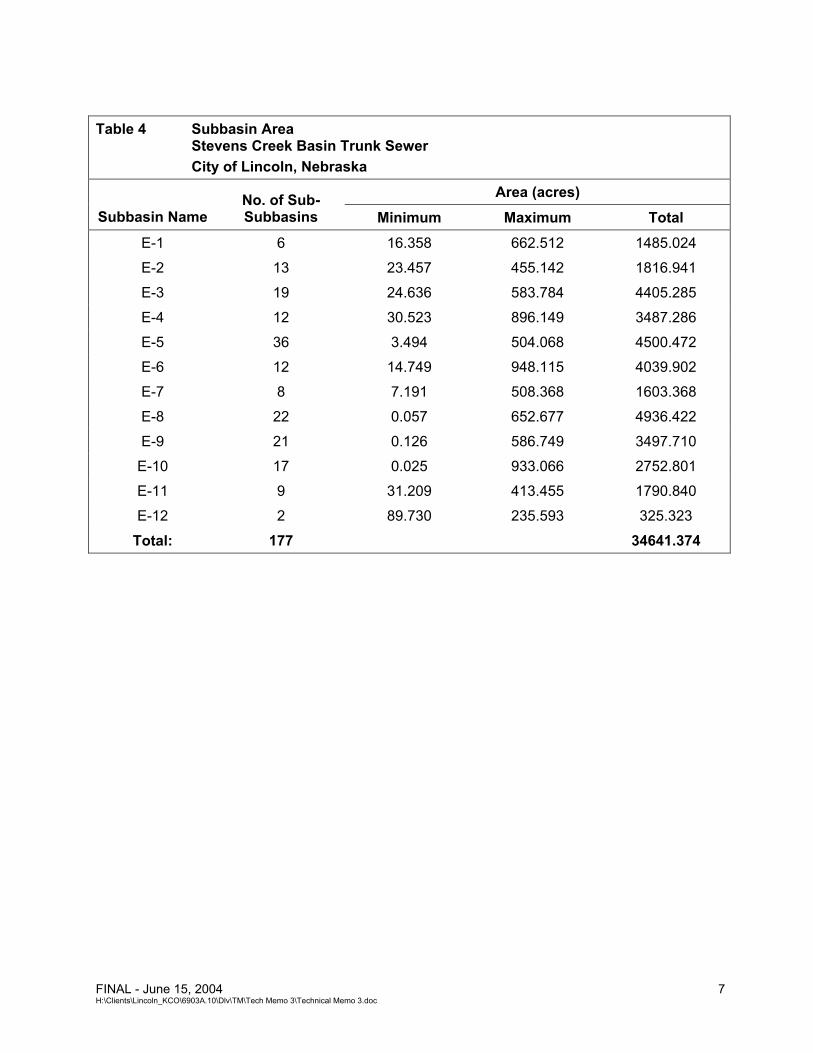
With the above mentioned modifications to the total basin area included in the model is 34,641
acres, of which 17,811 acres is included in the west side of the creek and 16,830 acres is
included in the east side of the creek. The floodplain areas in subbasin E-1, E-11, E-12 and E-6
were not included in the modeling. Table 4 below outlines the subbasin areas that were used for
the modeling exercise.
Each subbasin has one or more wastewater flow input points where flow is introduced into the
west side trunk sewer model. The major subbasin areas were used along with the City’s peak
flow equation to determine the flow from each subbasin. The inflow to the trunk sewer was
determined using the total tributary area to the trunk sewer at each junction structure location.
The formula is utilized in such a manner that as additional subbasin flows enter the trunk sewer,
the area of the subbasins contributing to the flows are combined. The City’s peak flow equation
has a built-in dampening factor that decreases the total flow in the trunk sewer with an increase
in cumulative subbasin areas. This dampening factor mimics the actual decrease in flow
observed in a previous study of the Lincoln Salt Valley Basin. Therefore, once the subbasin
areas are combined the flows are recalculated and the appropriate pipe size selected.
FINAL - June 15, 2004
H:\Clients\Lincoln_KCO\6903A.10\Dlv\TM\Tech Memo 3\Technical Memo 3.doc 7
Table 4 Subbasin Area Stevens Creek Basin Trunk Sewer
City of Lincoln, Nebraska
Area (acres)
Subbasin Name No. of Sub-Subbasins Minimum Maximum Total
E-1 6 16.358 662.512 1485.024
E-2 13 23.457 455.142 1816.941
E-3 19 24.636 583.784 4405.285
E-4 12 30.523 896.149 3487.286
E-5 36 3.494 504.068 4500.472
E-6 12 14.749 948.115 4039.902
E-7 8 7.191 508.368 1603.368
E-8 22 0.057 652.677 4936.422
E-9 21 0.126 586.749 3497.710
E-10 17 0.025 933.066 2752.801
E-11 9 31.209 413.455 1790.840
E-12 2 89.730 235.593 325.323
Total: 177 34641.374
��
�����
�����
����� �
������ �
���� ��
������ ��
��� ��
� � ��
��� ���� ��
������ ����
��� ��! "�
��� #�� "�
$��� ���� "�
%&����� ����'�! �
()��
)���
)���
()��
��*��
�����
+� ����'�! ,
����
�
����
�
����
�
���� �
%
� � � � �� ����
Figure 1 WATERSHED SUBBASINS AND
STREAM NETWORK STEVENS CREEK BASIN TRUNK SEWER
CITY OF LINCOLN, NEBRASKA

FINAL - June 15, 2004
H:\Clients\Lincoln_KCO\6903A.10\Dlv\TM\Tech Memo 3\Technical Memo 3.doc 9
4.0 DESCRIPTION OF TRUNK SEWER MODEL RUNS
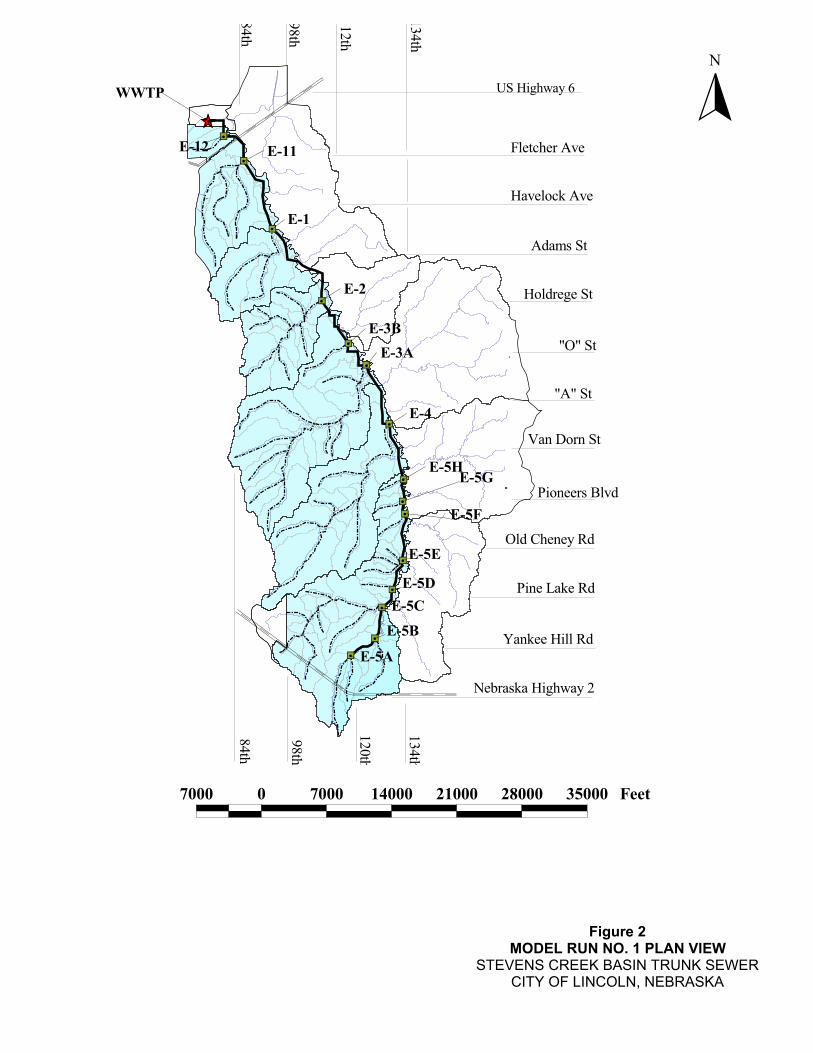
4.1 Trunk Sewer Model Run No. 1
This modeling run evaluates the flows from subbasins on the west side of Stevens Creek and
includes the Tier I and Tier II zones, as shown in Figures 2 and 3. This trunk sewer alignment
generally follows the west side of the creek except for one area near Adams Street where the
trunk sewer crosses to the east side of the creek near Subbasin E-1 to avoid a hill which would
result in excessive trenching, tunneling, potential conflicts with the stream and other
construction related problems. A preliminary piping profile of this model run has been prepared
as shown in Figure 4. A more detailed piping profile will be developed after the alignment
(Technical Memorandum 4) has been selected. The trunk sewer alignment developed in this
model serves as the base alignment for the subsequent model runs.
Table 5 lists each junction structure, as well as the pipe size of the trunk sewer, inflow and
subbasin area associated with each junction structure. Pipe sizes for this model run range from
18 inches at the upstream end to 72 inches at the NE WWTP. To confirm the 72-inch Phase I
segment of this model, a 66-inch pipe was also evaluated. The model revealed that a 66-inch
pipe in this reach of the sewer was excessively surcharged. The detailed results of this model
run are located in Appendix A.
��
��
��
��
��
��
��
��
��
��
��
��
��
��
��
��
����
�����
����� �
������ �
���� ��
������ ��
��� ��
� � ��
��� ���� ��
������ ����
��� ��! "�
��� #�� "�
$��� ���� "�
%&����� ����'�! �
()��
)���
)���
()��
��*� �
�����
�
����
�
����
+� ����'�! ,
�
����
�
���
�
���
�
���
�
���
�
���
�
���
�����
�����
� ����
�
���
� ���
�
����
� ����
%
���� � ���� ����� ����� ����� ����� ����
Figure 2 MODEL RUN NO. 1 PLAN VIEW
STEVENS CREEK BASIN TRUNK SEWER CITY OF LINCOLN, NEBRASKA
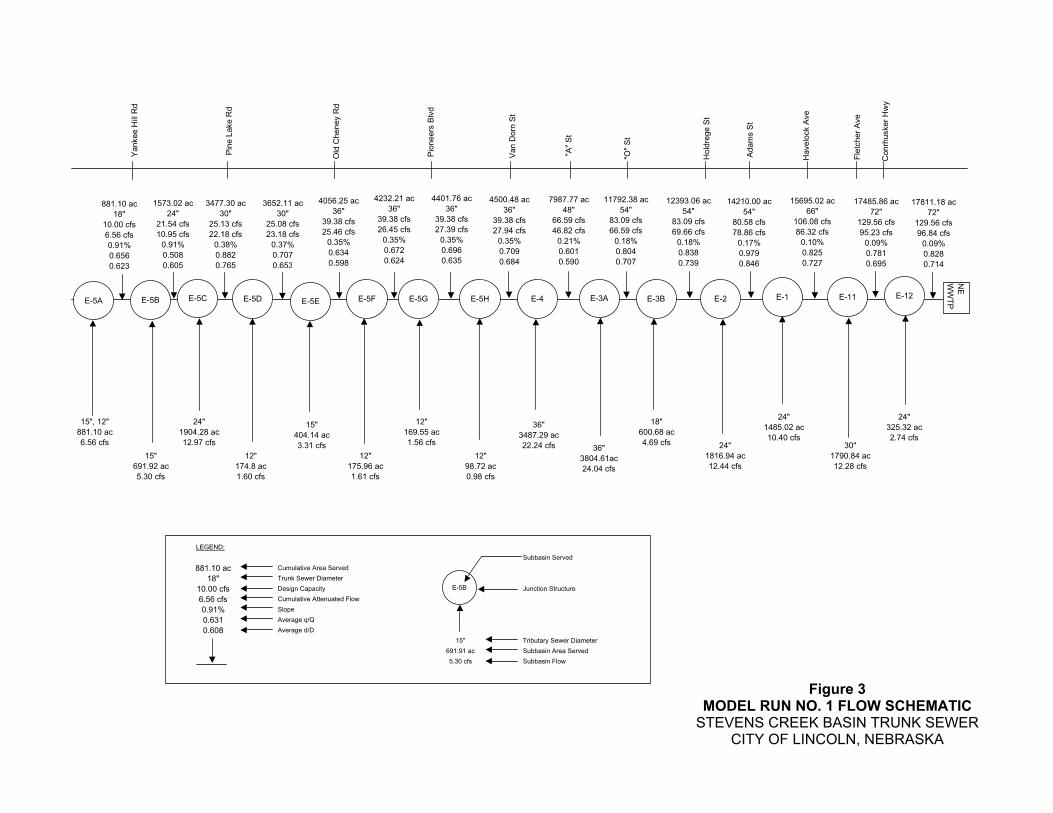
LEGEND:
Subbasin Served
Cumulative Area Served
Trunk Sewer Diameter
Design Capacity Junction Structure
Cumulative Attenuated Flow
Slope
Average q/Q
Average d/D
15" Tributary Sewer Diameter
691.91 ac Subbasin Area Served
5.30 cfs Subbasin Flow
E-5A
15", 12"
881.10 ac
6.56 cfs
12"
174.8 ac
1.60 cfs
15"
404.14 ac
3.31 cfs
12"
175.96 ac
1.61 cfs
12"
169.55 ac
1.56 cfs
12"
98.72 ac
0.98 cfs
36"
3487.29 ac
22.24 cfs 36"
3804.61ac
24.04 cfs
18"
600.68 ac
4.69 cfs 24"
1816.94 ac
12.44 cfs
24"
1485.02 ac
10.40 cfs30"
1790.84 ac
12.28 cfs
24"
325.32 ac
2.74 cfs
15"
691.92 ac
5.30 cfs
24"
1904.28 ac
12.97 cfs
E-5C E-5D E-5E E-5F E-5G E-5H E-4 E-3A E-3B E-2 E-1 E-11 E-12E-5B
NE
WW
TP
881.10 ac
18"
10.00 cfs
6.56 cfs
0.91%
0.656
0.623
17811.18 ac
72"
129.56 cfs
96.84 cfs
0.09%
0.828
0.714
1573.02 ac
24"
21.54 cfs
10.95 cfs
0.91%
0.508
0.605
3477.30 ac
30"
25.13 cfs
22.18 cfs
0.38%
0.882
0.765
11792.38 ac
54"
83.09 cfs
66.59 cfs
0.18%
0.804
0.707
12393.06 ac
54"
83.09 cfs
69.66 cfs
0.18%
0.838
0.739
14210.00 ac
54"
80.58 cfs
78.86 cfs
0.17%
0.979
0.846
15695.02 ac
66"
106.08 cfs
86.32 cfs
0.10%
0.825
0.727
17485.86 ac
72"
129.56 cfs
95.23 cfs
0.09%
0.781
0.695
4401.76 ac
36"
39.38 cfs
27.39 cfs
0.35%
0.696
0.635
4232.21 ac
36"
39.38 cfs
26.45 cfs
0.35%
0.672
0.624
4056.25 ac
36"
39.38 cfs
25.46 cfs
0.35%
0.634
0.598
3652.11 ac
30"
25.08 cfs
23.18 cfs
0.37%
0.707
0.653
7987.77 ac
48"
66.59 cfs
46.82 cfs
0.21%
0.601
0.590
4500.48 ac
36"
39.38 cfs
27.94 cfs
0.35%
0.709
0.684
Yankee H
ill R
d
Pio
neers
Blv
d
Van D
orn
St
"A"
St
"O"
St
Hold
rege S
t
Adam
s S
t
Havelo
ck A
ve
Fle
tcher
Ave
Pin
e L
ake R
d
Old
Cheney R
d
Conrh
usker
Hw
y
E-5B
881.10 ac
18"
10.00 cfs
6.56 cfs
0.91%
0.631
0.608
Figure 3 MODEL RUN NO. 1 FLOW SCHEMATIC
STEVENS CREEK BASIN TRUNK SEWER CITY OF LINCOLN, NEBRASKA

1000
1050
1100
1150
1200
1250
1300
1350
1400
1450
1500
0 10000 20000 30000 40000 50000 60000 70000 80000 90000
Distance (feet)
Ele
vati
on
(fe
et)
Ground Surface Sewer Pipe Stevens Creek Flowline
NE Hwy 2
Old Cheney Rd
Pioneers BlvdPine Lake Rd
Yankee Hill Rd "O" St
"A" St
Van Dorn St
Adams StHoldrege StFlecther Ave
Havelock Ave NE WWTP
E-5A
E-5F
E-5E
E-5D
E-5C
E-5B
E-12E-11E-1
E-2E-3B
E-3AE-4
E-5H
E-5G
Figure 4 MODEL RUN NO. 1 PROFILE
STEVENS CREEK BASIN TRUNK SEWER CITY OF LINCOLN, NEBRASKA

H:\Clients\Lincoln_KCO\6903A.10\Dlv\TM\Tech Memo 3\Figures_06-08-04\Tbl 5_Model Run 1.doc
Table 5 Model Run No. 1 – Westside Only Stevens Creek Basin Trunk Sewer City of Lincoln, Nebraska
Individual Sub Basins Trunk Sewer
Jct Box/ Manhole
Node #
Sub Basin Area
(acres) Sub Basin
Q (cfs)
Attenuated Sub Basin Q
(cfs)
Sub Basin Pipe Dia.
(in.)
Cum. Area
Served (acres)
Cum. Attenuated
QIN (cfs) Velocity In (fps)
Cum. Attenuated QOUT (cfs)
Velocity Out (fps)
Pipe Dia. Out (in.)
E-5A 14 881.10 6.56 6.56 15, 12 881.10 6.56 4.58 6.56 5.83 18
E-5B 28 691.92 5.30 4.39 15 1573.02 6.56 5.46 10.95 6.65 24
E-5C 44 1904.28 12.97 11.23 24 3477.30 10.95 4.84 22.18 5.57 30
E-5D 112 174.80 1.60 0.99 12 3652.11 22.18 5.48 23.18 5.58 30
Manhole 120 36
E-5E 141 404.14 3.31 2.28 15 4056.25 23.18 5.78 25.46 5.70 36
E-5F 148 175.96 1.61 0.99 12 4232.21 25.46 5.58 26.45 5.76 36
E-5G 156 169.55 1.56 0.95 12 4401.76 26.45 5.69 27.39 5.81 36
E-5H 164 98.72 0.98 0.55 12 4500.48 27.39 5.77 27.94 5.83 36
E-4 251 3487.29 22.24 18.87 36 7987.77 27.94 5.05 46.82 5.54 48
Manhole 257 54
E-3A 264 3804.61 24.04 19.77 36 11792.38 46.82 4.66 66.59 5.60 54
E-3B 368 600.68 4.69 3.07 18 12393.06 66.59 5.50 69.66 5.63 54
E-2 388 1816.94 12.44 9.21 24 14210.00 69.66 5.23 78.86 5.54 54
E-1 482 1485.02 10.40 7.45 24 15695.02 78.86 5.45 86.32 4.79 66
E-11 493 1790.84 12.28 8.91 30 17485.86 86.32 5.09 95.23 4.89 72
E-12 530 325.32 2.74 1.61 24 17811.18 95.23 4.75 96.84 4.93 72

FINAL - June 15, 2004
H:\Clients\Lincoln_KCO\6903A.10\Dlv\TM\Tech Memo 3\Technical Memo 3.doc 14
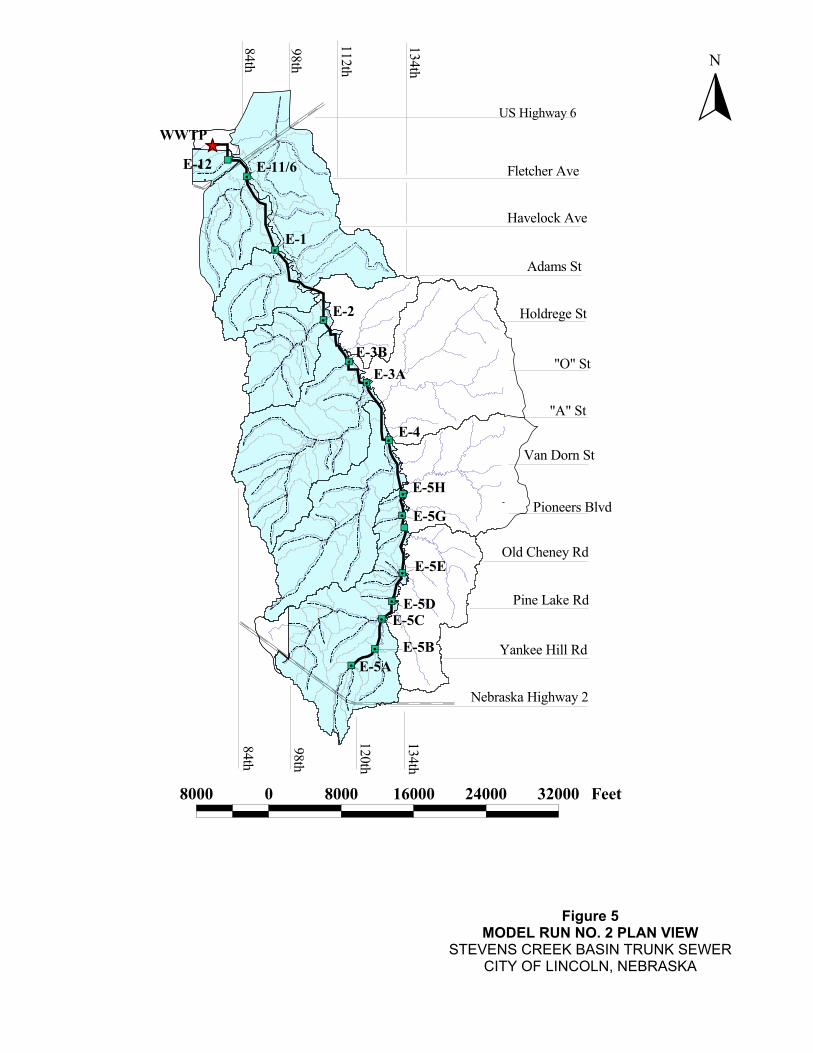
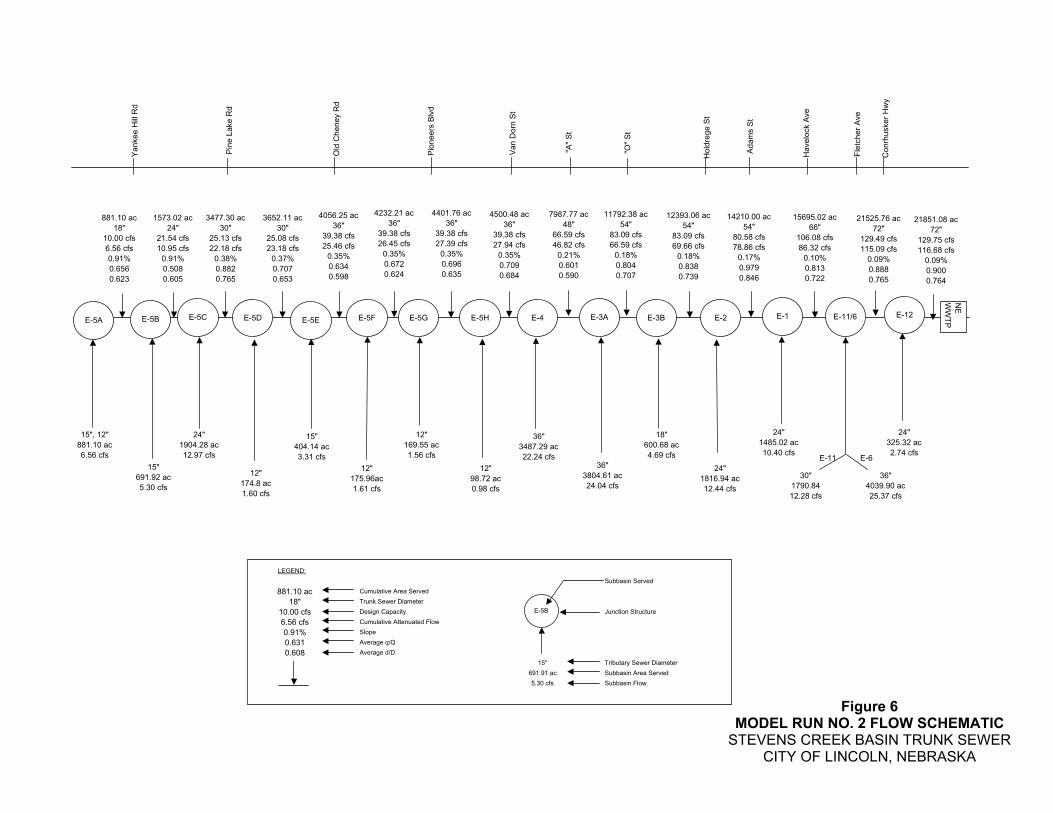
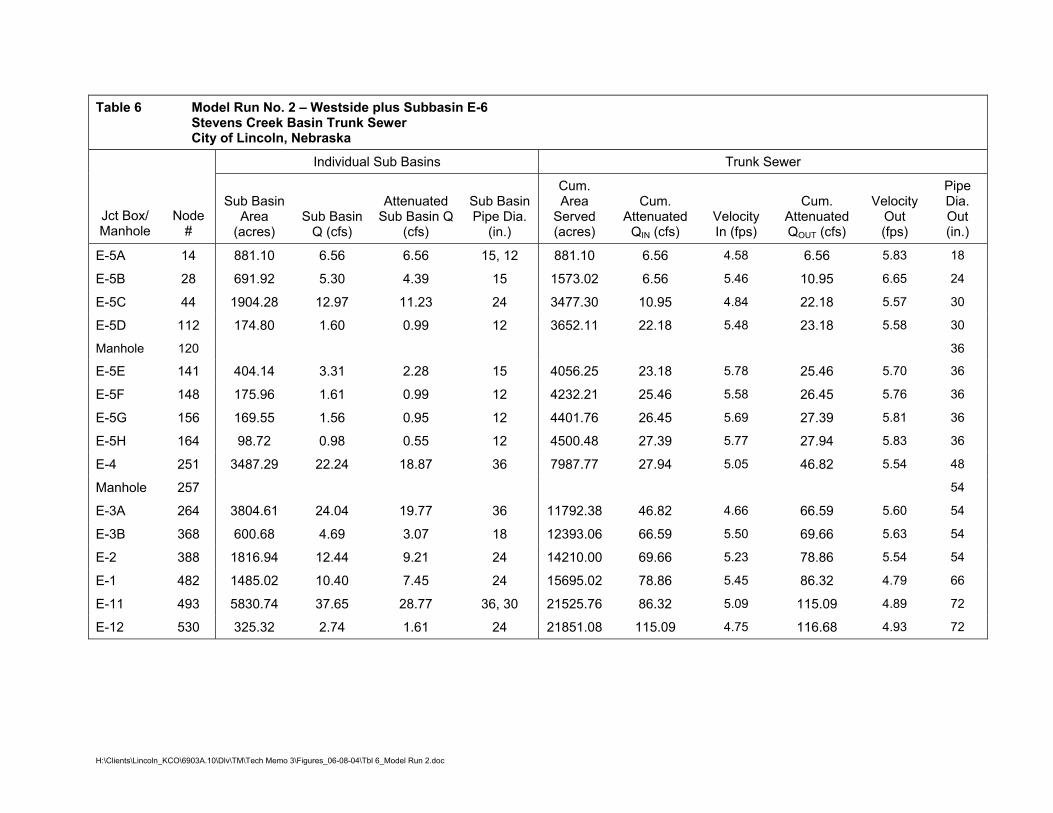
4.2 Trunk Sewer Model Run No. 2
Trunk Sewer Model Run No. 2 evaluates the flow from the west side and the lower east side of
the basin which is identified as Subbasin E-6. This model run includes the Tier I and Tier II
areas to be served as described in the City’s Wastewater Facilities Plan Update, October 2002
as shown in Figures 5 and 6. Additionally, this model run includes the areas defined in the
Scope of Services to be served by the trunk sewer.
The trunk sewer alignment on the west side of the basin is the same as Model Run No. 1. The
primary difference between this model run and Model Run No. 1 is that the flows from subbasin
E-6 is introduced at a node near Fletcher Avenue at Junction Structure E-11/E-6 through a 36-
inch diameter sewer. To cross the creek at this location it appears that a siphon would be
required for the 36-inch diameter sewer from Subbasin E-6.
Table 6 lists each junction structure, as well as the pipe size of the trunk sewer, inflow and
subbasin area associated with each junction structure. Pipe sizes for this model run range from
18 inches at the upstream end to 72 inches at the NE WWTP. The detailed results of this model
run are shown in Appendix C.
��
��
��
��
��
��
��
��
��
��
��
��
��
��
��
��
�����
�����
����� �
������ �
���� ��
������ ��
��� ��
� � ��
��� ���� ��
������ ����
��� ��! "�
��� #�� "�
$��� ���� "�
%&����� ����'�! �
()��
)���
)���
()��
��*��
�����
����
+� ����'�! ,
� ����
� ����
� ���
�
���
�
����
� ����
�
����
�
��
�
����
�
����
�
���
�
���
�
�����������
%
���� � ���� ����� � ��� ����� ����
Figure 5 MODEL RUN NO. 2 PLAN VIEW
STEVENS CREEK BASIN TRUNK SEWER CITY OF LINCOLN, NEBRASKA
LEGEND:
Subbasin Served
Cumulative Area Served
Trunk Sewer Diameter
Design Capacity Junction Structure
Cumulative Attenuated Flow
Slope
Average q/Q
Average d/D
15" Tributary Sewer Diameter
691.91 ac Subbasin Area Served
5.30 cfs Subbasin Flow
E-5A
15", 12"
881.10 ac
6.56 cfs
12"
174.8 ac
1.60 cfs
15"
404.14 ac
3.31 cfs
12"
175.96ac
1.61 cfs
12"
169.55 ac
1.56 cfs
12"
98.72 ac
0.98 cfs
36"
3487.29 ac
22.24 cfs36"
3804.61 ac
24.04 cfs
18"
600.68 ac
4.69 cfs
24"
1816.94 ac
12.44 cfs
24"
1485.02 ac
10.40 cfs
36"
4039.90 ac
25.37 cfs
24"
325.32 ac
2.74 cfs
15"
691.92 ac
5.30 cfs
24"
1904.28 ac
12.97 cfs
E-5C E-5D E-5E E-5F E-5G E-5H E-4 E-3A E-3B E-2 E-1 E-11/6 E-12E-5B
NE
WW
TP
Ya
nke
e H
ill R
d
Pio
ne
ers
Blv
d
Va
n D
orn
St
"A"
St
"O"
St
Ho
ldre
ge
St
Ad
am
s S
t
Ha
ve
lock A
ve
Fle
tch
er
Ave
Pin
e L
ake
Rd
Old
Ch
en
ey R
d
Co
nrh
uske
r H
wy
30"
1790.84
12.28 cfs
E-11 E-6
21851.08 ac
72"
129.75 cfs
116.68 cfs
0.09%
0.900
0.764
15695.02 ac
66"
106.08 cfs
86.32 cfs
0.10%
0.813
0.722
21525.76 ac
72"
129.49 cfs
115.09 cfs
0.09%
0.888
0.765
E-5B
881.10 ac
18"
10.00 cfs
6.56 cfs
0.91%
0.631
0.608
881.10 ac
18"
10.00 cfs
6.56 cfs
0.91%
0.656
0.623
1573.02 ac
24"
21.54 cfs
10.95 cfs
0.91%
0.508
0.605
3477.30 ac
30"
25.13 cfs
22.18 cfs
0.38%
0.882
0.765
11792.38 ac
54"
83.09 cfs
66.59 cfs
0.18%
0.804
0.707
12393.06 ac
54"
83.09 cfs
69.66 cfs
0.18%
0.838
0.739
14210.00 ac
54"
80.58 cfs
78.86 cfs
0.17%
0.979
0.846
4401.76 ac
36"
39.38 cfs
27.39 cfs
0.35%
0.696
0.635
4232.21 ac
36"
39.38 cfs
26.45 cfs
0.35%
0.672
0.624
4056.25 ac
36"
39.38 cfs
25.46 cfs
0.35%
0.634
0.598
3652.11 ac
30"
25.08 cfs
23.18 cfs
0.37%
0.707
0.653
7987.77 ac
48"
66.59 cfs
46.82 cfs
0.21%
0.601
0.590
4500.48 ac
36"
39.38 cfs
27.94 cfs
0.35%
0.709
0.684
Figure 6 MODEL RUN NO. 2 FLOW SCHEMATIC
STEVENS CREEK BASIN TRUNK SEWER CITY OF LINCOLN, NEBRASKA
H:\Clients\Lincoln_KCO\6903A.10\Dlv\TM\Tech Memo 3\Figures_06-08-04\Tbl 6_Model Run 2.doc
Table 6 Model Run No. 2 – Westside plus Subbasin E-6 Stevens Creek Basin Trunk Sewer City of Lincoln, Nebraska
Individual Sub Basins Trunk Sewer
Jct Box/ Manhole
Node #
Sub Basin Area
(acres) Sub Basin
Q (cfs)
Attenuated Sub Basin Q
(cfs)
Sub Basin Pipe Dia.
(in.)
Cum. Area
Served (acres)
Cum. Attenuated
QIN (cfs) Velocity In (fps)
Cum. Attenuated QOUT (cfs)
Velocity Out (fps)
Pipe Dia. Out (in.)
E-5A 14 881.10 6.56 6.56 15, 12 881.10 6.56 4.58 6.56 5.83 18
E-5B 28 691.92 5.30 4.39 15 1573.02 6.56 5.46 10.95 6.65 24
E-5C 44 1904.28 12.97 11.23 24 3477.30 10.95 4.84 22.18 5.57 30
E-5D 112 174.80 1.60 0.99 12 3652.11 22.18 5.48 23.18 5.58 30
Manhole 120 36
E-5E 141 404.14 3.31 2.28 15 4056.25 23.18 5.78 25.46 5.70 36
E-5F 148 175.96 1.61 0.99 12 4232.21 25.46 5.58 26.45 5.76 36
E-5G 156 169.55 1.56 0.95 12 4401.76 26.45 5.69 27.39 5.81 36
E-5H 164 98.72 0.98 0.55 12 4500.48 27.39 5.77 27.94 5.83 36
E-4 251 3487.29 22.24 18.87 36 7987.77 27.94 5.05 46.82 5.54 48
Manhole 257 54
E-3A 264 3804.61 24.04 19.77 36 11792.38 46.82 4.66 66.59 5.60 54
E-3B 368 600.68 4.69 3.07 18 12393.06 66.59 5.50 69.66 5.63 54
E-2 388 1816.94 12.44 9.21 24 14210.00 69.66 5.23 78.86 5.54 54
E-1 482 1485.02 10.40 7.45 24 15695.02 78.86 5.45 86.32 4.79 66
E-11 493 5830.74 37.65 28.77 36, 30 21525.76 86.32 5.09 115.09 4.89 72
E-12 530 325.32 2.74 1.61 24 21851.08 115.09 4.75 116.68 4.93 72

FINAL - June 15, 2004
H:\Clients\Lincoln_KCO\6903A.10\Dlv\TM\Tech Memo 3\Technical Memo 3.doc 18
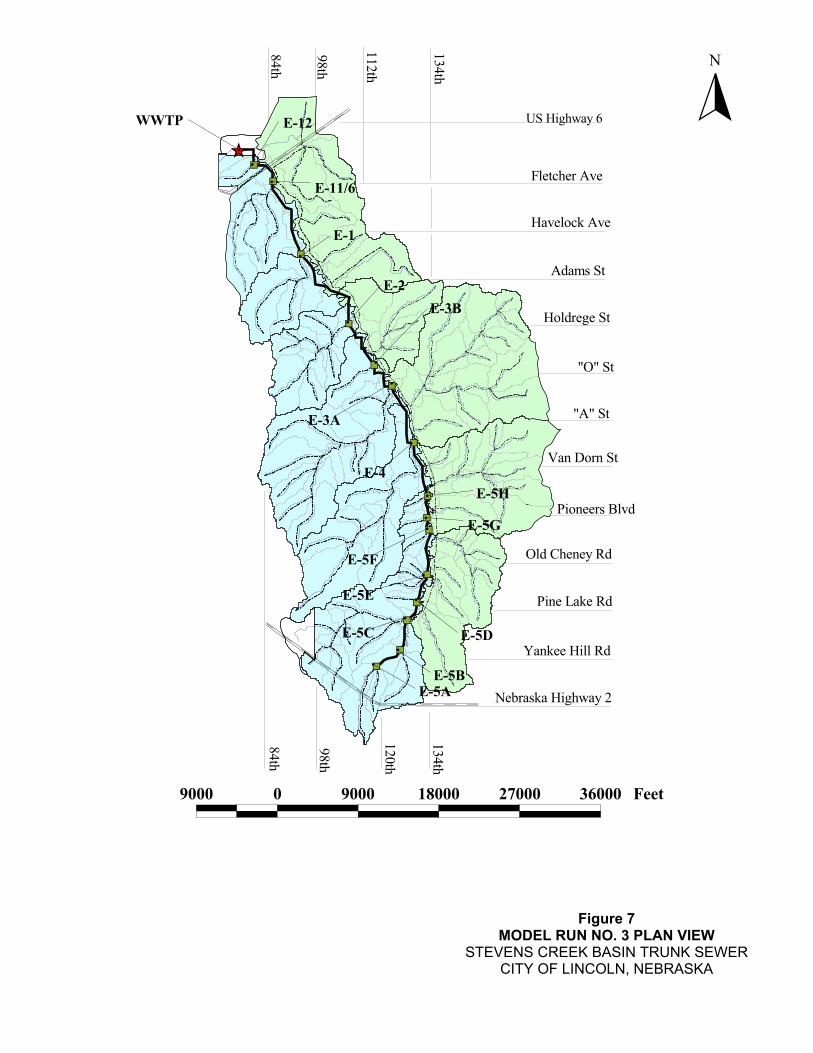
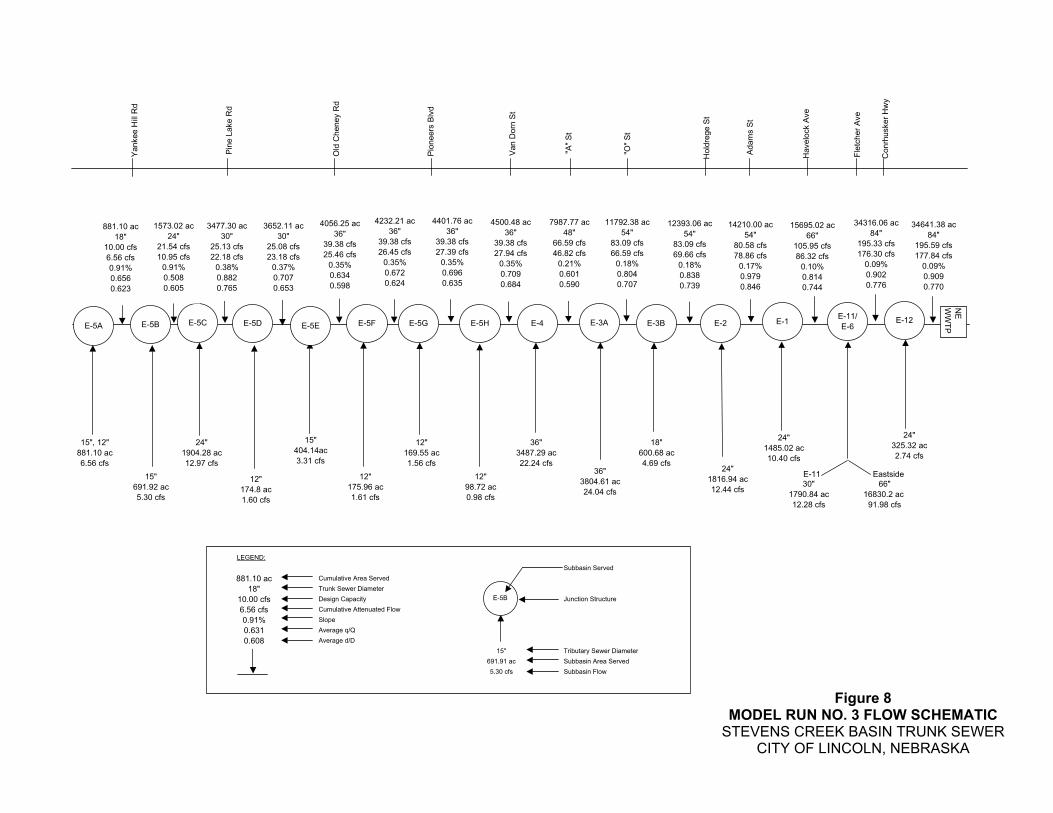
4.3 Trunk Sewer Model Run No. 3
Trunk Sewer Model Run No. 3 evaluates the combination of flows from the entire basin (both
the west and east sides) and serves the all of the Tier I, Tier II, and Tier III zones as shown in
Figures 7 and 8. The flows from the east side of the basin would enter the west side trunk basin
sewer near Fletcher Avenue at Junction Structure E-11/E-6 through a 66-inch diameter sewer.
To get under Stevens Creek at this location it appears that a siphon would be required on the
66-inch diameter sewer from the east side.
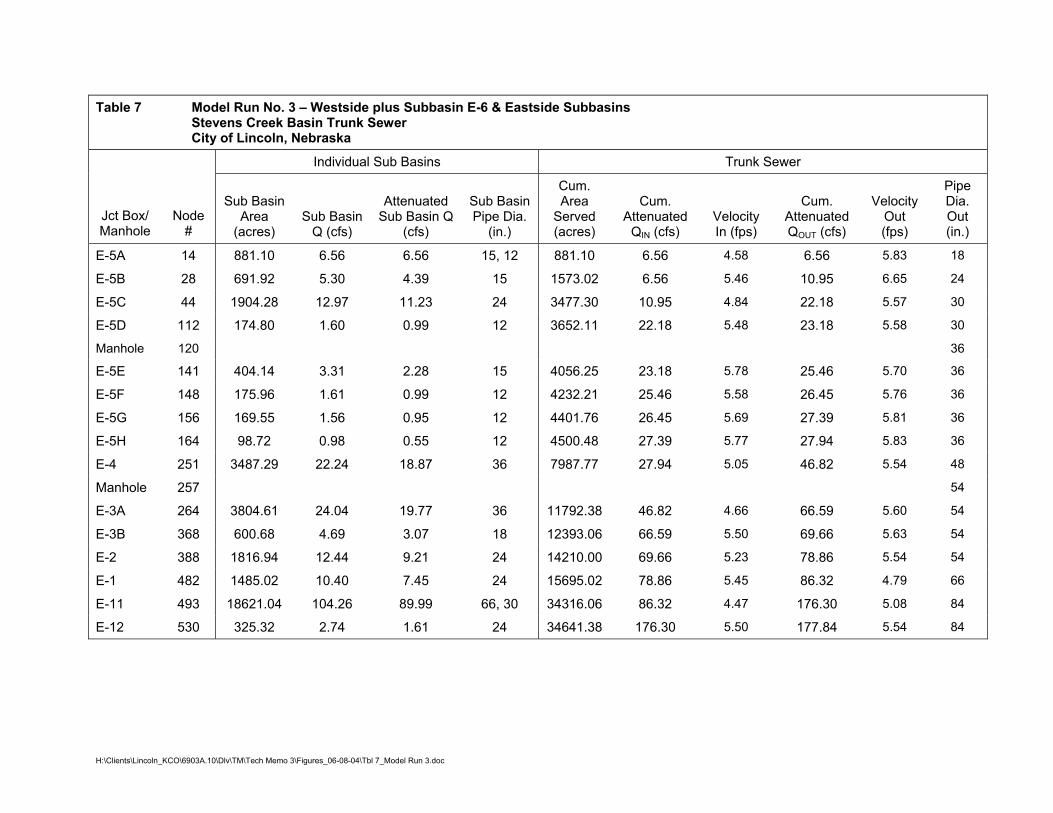
Table 7 lists each junction structure, as well as the pipe size of the west side trunk sewer, inflow
and subbasin area associated with each junction structure. Pipe sizes for this model run range
from 18 inches at the upstream end to 84 inches at the NE WWTP. The detailed results of this
model run are shown in Appendix E. This model run indicated that an 84-inch diameter pipe
would be required from Fletcher Avenue to the NE WWTP to convey the total flow from the
basin.
��
��
��
��
��
��
��
��
��
��
��
��
��
��
��
��
�����
�����
����� �
������ �
���� ��
������ ��
��� ��
� � ��
��� ���� ��
������ ����
��� ��! "�
��� #�� "�
$��� ���� "�
%&����� ����'�! �
()��
)���
)���
()��
��*��
�����
+� ����'�! ,
�
���
�
���
�
����
�
����
�
���
� ��
�
����
��� �
���
�
��
�
���
�
���
�
����
�
����
�
������
�
���
%
���� � ���� ����� ����� ����� ����
Figure 7 MODEL RUN NO. 3 PLAN VIEW
STEVENS CREEK BASIN TRUNK SEWER CITY OF LINCOLN, NEBRASKA
LEGEND:
Subbasin Served
Cumulative Area Served
Trunk Sewer Diameter
Design Capacity Junction Structure
Cumulative Attenuated Flow
Slope
Average q/Q
Average d/D
15" Tributary Sewer Diameter
691.91 ac Subbasin Area Served
5.30 cfs Subbasin Flow
E-5A
15", 12"
881.10 ac
6.56 cfs
12"
174.8 ac
1.60 cfs
15"
404.14ac
3.31 cfs
12"
175.96 ac
1.61 cfs
12"
169.55 ac
1.56 cfs
12"
98.72 ac
0.98 cfs
36"
3487.29 ac
22.24 cfs36"
3804.61 ac
24.04 cfs
18"
600.68 ac
4.69 cfs24"
1816.94 ac
12.44 cfs
24"
1485.02 ac
10.40 cfs
24"
325.32 ac
2.74 cfs
15"
691.92 ac
5.30 cfs
24"
1904.28 ac
12.97 cfs
E-5C E-5D E-5E E-5F E-5G E-5H E-4 E-3A E-3B E-2 E-1E-11/
E-6E-12
E-5B
NE
WW
TP
34641.38 ac
84"
195.59 cfs
177.84 cfs
0.09%
0.909
0.770
15695.02 ac
66"
105.95 cfs
86.32 cfs
0.10%
0.814
0.744
34316.06 ac
84"
195.33 cfs
176.30 cfs
0.09%
0.902
0.776
66"
16830.2 ac
91.98 cfs
30"
1790.84 ac
12.28 cfs
E-11 Eastside
Yankee H
ill R
d
Pio
neers
Blv
d
Van D
orn
St
"A"
St
"O"
St
Hold
rege S
t
Adam
s S
t
Havelo
ck A
ve
Fle
tcher
Ave
Pin
e L
ake R
d
Old
Cheney R
d
Conrh
usker
Hw
y
E-5B
881.10 ac
18"
10.00 cfs
6.56 cfs
0.91%
0.631
0.608
881.10 ac
18"
10.00 cfs
6.56 cfs
0.91%
0.656
0.623
1573.02 ac
24"
21.54 cfs
10.95 cfs
0.91%
0.508
0.605
3477.30 ac
30"
25.13 cfs
22.18 cfs
0.38%
0.882
0.765
11792.38 ac
54"
83.09 cfs
66.59 cfs
0.18%
0.804
0.707
12393.06 ac
54"
83.09 cfs
69.66 cfs
0.18%
0.838
0.739
14210.00 ac
54"
80.58 cfs
78.86 cfs
0.17%
0.979
0.846
4401.76 ac
36"
39.38 cfs
27.39 cfs
0.35%
0.696
0.635
4232.21 ac
36"
39.38 cfs
26.45 cfs
0.35%
0.672
0.624
4056.25 ac
36"
39.38 cfs
25.46 cfs
0.35%
0.634
0.598
3652.11 ac
30"
25.08 cfs
23.18 cfs
0.37%
0.707
0.653
7987.77 ac
48"
66.59 cfs
46.82 cfs
0.21%
0.601
0.590
4500.48 ac
36"
39.38 cfs
27.94 cfs
0.35%
0.709
0.684
Figure 8 MODEL RUN NO. 3 FLOW SCHEMATIC
STEVENS CREEK BASIN TRUNK SEWER CITY OF LINCOLN, NEBRASKA
H:\Clients\Lincoln_KCO\6903A.10\Dlv\TM\Tech Memo 3\Figures_06-08-04\Tbl 7_Model Run 3.doc
Table 7 Model Run No. 3 – Westside plus Subbasin E-6 & Eastside Subbasins Stevens Creek Basin Trunk Sewer City of Lincoln, Nebraska
Individual Sub Basins Trunk Sewer
Jct Box/ Manhole
Node #
Sub Basin Area
(acres) Sub Basin
Q (cfs)
Attenuated Sub Basin Q
(cfs)
Sub Basin Pipe Dia.
(in.)
Cum. Area
Served (acres)
Cum. Attenuated
QIN (cfs) Velocity In (fps)
Cum. Attenuated QOUT (cfs)
Velocity Out (fps)
Pipe Dia. Out (in.)
E-5A 14 881.10 6.56 6.56 15, 12 881.10 6.56 4.58 6.56 5.83 18
E-5B 28 691.92 5.30 4.39 15 1573.02 6.56 5.46 10.95 6.65 24
E-5C 44 1904.28 12.97 11.23 24 3477.30 10.95 4.84 22.18 5.57 30
E-5D 112 174.80 1.60 0.99 12 3652.11 22.18 5.48 23.18 5.58 30
Manhole 120 36
E-5E 141 404.14 3.31 2.28 15 4056.25 23.18 5.78 25.46 5.70 36
E-5F 148 175.96 1.61 0.99 12 4232.21 25.46 5.58 26.45 5.76 36
E-5G 156 169.55 1.56 0.95 12 4401.76 26.45 5.69 27.39 5.81 36
E-5H 164 98.72 0.98 0.55 12 4500.48 27.39 5.77 27.94 5.83 36
E-4 251 3487.29 22.24 18.87 36 7987.77 27.94 5.05 46.82 5.54 48
Manhole 257 54
E-3A 264 3804.61 24.04 19.77 36 11792.38 46.82 4.66 66.59 5.60 54
E-3B 368 600.68 4.69 3.07 18 12393.06 66.59 5.50 69.66 5.63 54
E-2 388 1816.94 12.44 9.21 24 14210.00 69.66 5.23 78.86 5.54 54
E-1 482 1485.02 10.40 7.45 24 15695.02 78.86 5.45 86.32 4.79 66
E-11 493 18621.04 104.26 89.99 66, 30 34316.06 86.32 4.47 176.30 5.08 84
E-12 530 325.32 2.74 1.61 24 34641.38 176.30 5.50 177.84 5.54 84
FINAL - June 15, 2004
H:\Clients\Lincoln_KCO\6903A.10\Dlv\TM\Tech Memo 3\Technical Memo 3.doc 22
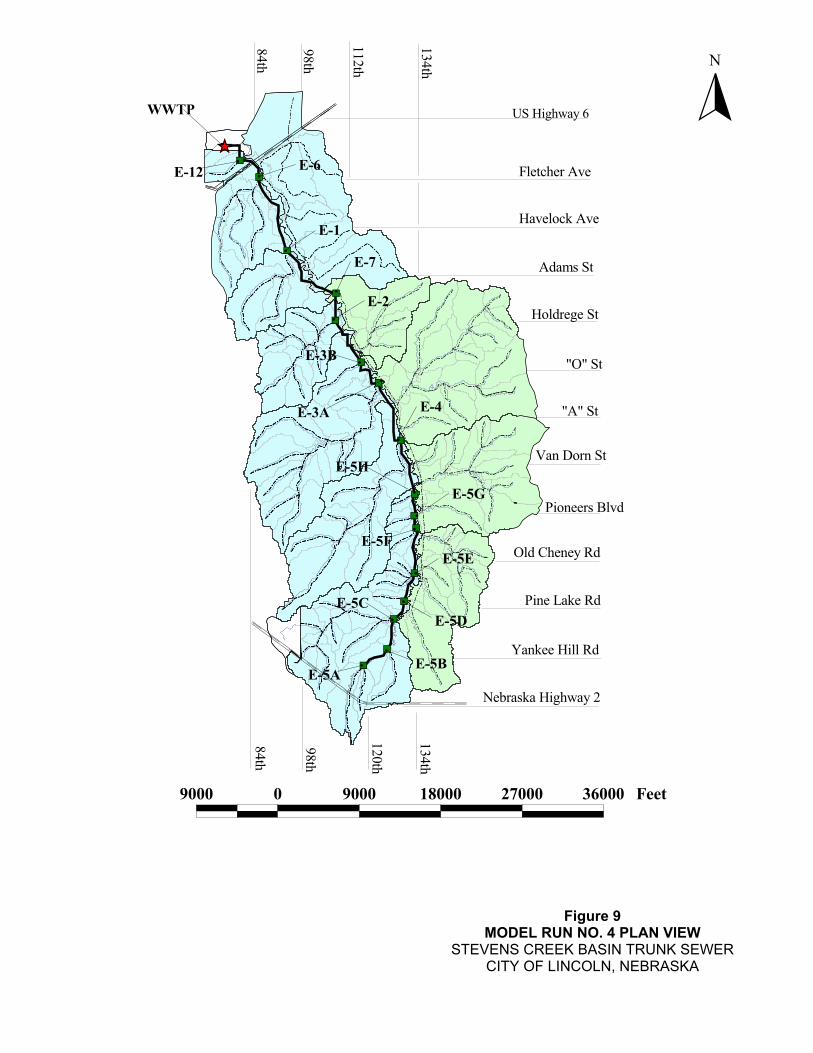
4.4 Trunk Sewer Model Run No. 4
Trunk Sewer Model Run No. 4 evaluates flows from the whole basin similar to Model Run No. 3
(Tiers I, II and III) as shown in Figures 9 and 10. The difference is that the flows from Subbasin
E-6 on the eastside of Stevens Creek enters the west side trunk sewer at Junction Structure E-
11/E-6 through a 36-inch diameter sewer. Due to the elevation of the existing headworks at the
NE WWTP the 36-inch diameter sewer from Subbasin E-6 would probably require a siphon
under Stevens Creek. The flows from the other subbasins (Subbasins E-7, E-8, E-9, E-10) on
the east side enter the west side trunk sewer at Junction Structure E-7 located between Adams
and Holdrege Street through a 60-inch diameter pipe. At this location it appears that the sewer
can cross under the creek without a siphon. This however will be confirmed when an alignment
has been selected and ground survey completed.
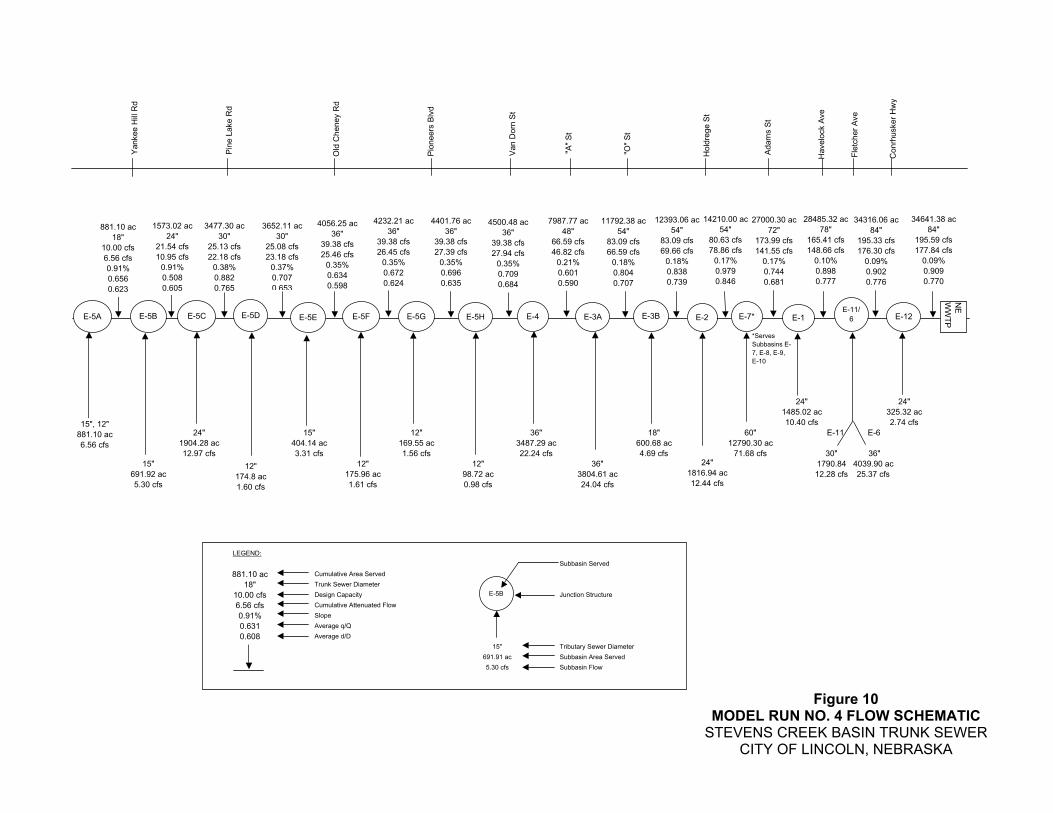
Table 8 lists each junction structure, as well as the pipe size of the trunk sewer, inflow and
subbasin area associated with each junction structure. The detailed results of this model run are
located in Appendix G. The Pipe sizes for this model range from 18 inches at the upstream end
to 84 inches at the NE WWTP. As expected the west side trunk from Junction Structure E-7 to
Junction Structure E-11/E-6 at Fletcher Avenue was increased to carry the east side flows. This
resulted in the pipe size increasing from 60-inch to 78-inch between Junction Structures E-7 and
E-1 and from 66-inch to 78-inch between Junction Structures E-1 and E-11/E-6.
��
��
��
��
��
��
��
��
��
��
��
��
��
��
��
��
��
�����
�����
����� �
������ �
���� ��
������ ��
��� ��
� � ��
��� ���� ��
������ ����
��� ��! "�
��� #�� "�
$��� ���� "�
%&����� ����'�! �
()��
)���
)���
()��
��*��
�����
+� ����'�! ,
�
����
�
���� �
���
�
���
�
��
�
���
�
���
�
���
�
��
�
����
�
����
�
����
�
����
�
�����
����
�
�����
����
%
���� � ���� ����� ���� ���� ����
Figure 9 MODEL RUN NO. 4 PLAN VIEW
STEVENS CREEK BASIN TRUNK SEWER CITY OF LINCOLN, NEBRASKA
LEGEND:
Subbasin Served
Cumulative Area Served
Trunk Sewer Diameter
Design Capacity Junction Structure
Cumulative Attenuated Flow
Slope
Average q/Q
Average d/D
15" Tributary Sewer Diameter
691.91 ac Subbasin Area Served
5.30 cfs Subbasin Flow
E-5A
15", 12"
881.10 ac
6.56 cfs
12"
174.8 ac
1.60 cfs
15"
404.14 ac
3.31 cfs
12"
175.96 ac
1.61 cfs
12"
169.55 ac
1.56 cfs
12"
98.72 ac
0.98 cfs
36"
3487.29 ac
22.24 cfs
36"
3804.61 ac
24.04 cfs
18"
600.68 ac
4.69 cfs24"
1816.94 ac
12.44 cfs
60"
12790.30 ac
71.68 cfs 36"
4039.90 ac
25.37 cfs
24"
325.32 ac
2.74 cfs
15"
691.92 ac
5.30 cfs
24"
1904.28 ac
12.97 cfs
E-5C E-5D E-5E E-5F E-5G E-5H E-4 E-3A E-3B E-2 E-1E-11/
6 E-12E-5B
NE
WW
TP
34641.38 ac
84"
195.59 cfs
177.84 cfs
0.09%
0.909
0.770
27000.30 ac
72"
173.99 cfs
141.55 cfs
0.17%
0.744
0.681
28485.32 ac
78"
165.41 cfs
148.66 cfs
0.10%
0.898
0.777
34316.06 ac
84"
195.33 cfs
176.30 cfs
0.09%
0.902
0.776
Yankee H
ill R
d
Pio
neers
Blv
d
Van D
orn
St
"A"
St
"O"
St
Hold
rege S
t
Adam
s S
t
Havelo
ck A
ve
Fle
tcher
Ave
Pin
e L
ake R
d
Old
Cheney R
d
Conrh
usker
Hw
y
30"
1790.84
12.28 cfs
E-11 E-6
E-7*
24"
1485.02 ac
10.40 cfs
14210.00 ac
54"
80.63 cfs
78.86 cfs
0.17%
0.979
0.846
*Serves
Subbasins E-
7, E-8, E-9,
E-10
E-5B
881.10 ac
18"
10.00 cfs
6.56 cfs
0.91%
0.631
0.608
881.10 ac
18"
10.00 cfs
6.56 cfs
0.91%
0.656
0.623
1573.02 ac
24"
21.54 cfs
10.95 cfs
0.91%
0.508
0.605
3477.30 ac
30"
25.13 cfs
22.18 cfs
0.38%
0.882
0.765
11792.38 ac
54"
83.09 cfs
66.59 cfs
0.18%
0.804
0.707
12393.06 ac
54"
83.09 cfs
69.66 cfs
0.18%
0.838
0.739
4401.76 ac
36"
39.38 cfs
27.39 cfs
0.35%
0.696
0.635
4232.21 ac
36"
39.38 cfs
26.45 cfs
0.35%
0.672
0.624
4056.25 ac
36"
39.38 cfs
25.46 cfs
0.35%
0.634
0.598
3652.11 ac
30"
25.08 cfs
23.18 cfs
0.37%
0.707
0.653
7987.77 ac
48"
66.59 cfs
46.82 cfs
0.21%
0.601
0.590
4500.48 ac
36"
39.38 cfs
27.94 cfs
0.35%
0.709
0.684
Figure 10 MODEL RUN NO. 4 FLOW SCHEMATIC
STEVENS CREEK BASIN TRUNK SEWER CITY OF LINCOLN, NEBRASKA

H:\Clients\Lincoln_KCO\6903A.10\Dlv\TM\Tech Memo 3\Figures_06-08-04\Tbl 8_Model Run 4.doc
Table 8 Model Run No. 4 – Westside plus Subbasin E6 with Eastside Subbasins at Jct Box E-7 Stevens Creek Basin Trunk Sewer City of Lincoln, Nebraska
Individual Subbasins Trunk Sewer
Jct Box/ Manhole
Node #
Subbasin Area
(acres) Subbasin
Q (cfs)
Attenuated Subbasin Q
(cfs)
Subbasin Pipe Dia.
(in.)
Cum. Area
Served (acres)
Cum. Attenuated
QIN (cfs) Velocity In (fps)
Cum. Attenuated QOUT (cfs)
Velocity Out (fps)
Pipe Dia. Out (in.)
E-5A 14 881.10 6.56 6.56 15, 12 881.10 6.56 4.58 6.56 5.83 18
E-5B 28 691.92 5.30 4.39 15 1573.02 6.56 5.46 10.95 6.65 24
E-5C 44 1904.28 12.97 11.23 24 3477.30 10.95 4.84 22.18 5.57 30
E-5D 112 174.80 1.60 0.99 12 3652.11 22.18 5.48 23.18 5.58 30
Manhole 120 36
E-5E 141 404.14 3.31 2.28 15 4056.25 23.18 5.78 25.46 5.70 36
E-5F 148 175.96 1.61 0.99 12 4232.21 25.46 5.58 26.45 5.76 36
E-5G 156 169.55 1.56 0.95 12 4401.76 26.45 5.69 27.39 5.81 36
E-5H 164 98.72 0.98 0.55 12 4500.48 27.39 5.77 27.94 5.83 36
E-4 251 3487.29 22.24 18.87 36 7987.77 27.94 5.05 46.82 5.54 48
Manhole 257 54
E-3A 264 3804.61 24.04 19.77 36 11792.38 46.82 4.66 66.59 5.60 54
E-3B 368 600.68 4.69 3.07 18 12393.06 66.59 5.50 69.66 5.63 54
E-2 388 1816.94 12.44 9.21 24 14210.00 69.66 5.23 78.86 5.54 54
E-7 442 12790.30 71.68 62.69 60 27000.30 78.86 5.23 141.55 7.03 72
Manhole 448 78
E-1 482 1485.02 10.40 7.11 24 28485.32 141.55 5.81 148.66 5.43 78
E-11/E-6 525 5830.74 37.65 27.65 36, 30 34316.06 148.66 5.19 176.30 5.52 84
E-12 530 325.32 2.74 1.53 24 34641.38 176.30 5.50 177.84 5.54 84
FINAL - June 15, 2004
H:\Clients\Lincoln_KCO\6903A.10\Dlv\TM\Tech Memo 3\Technical Memo 3.doc 26
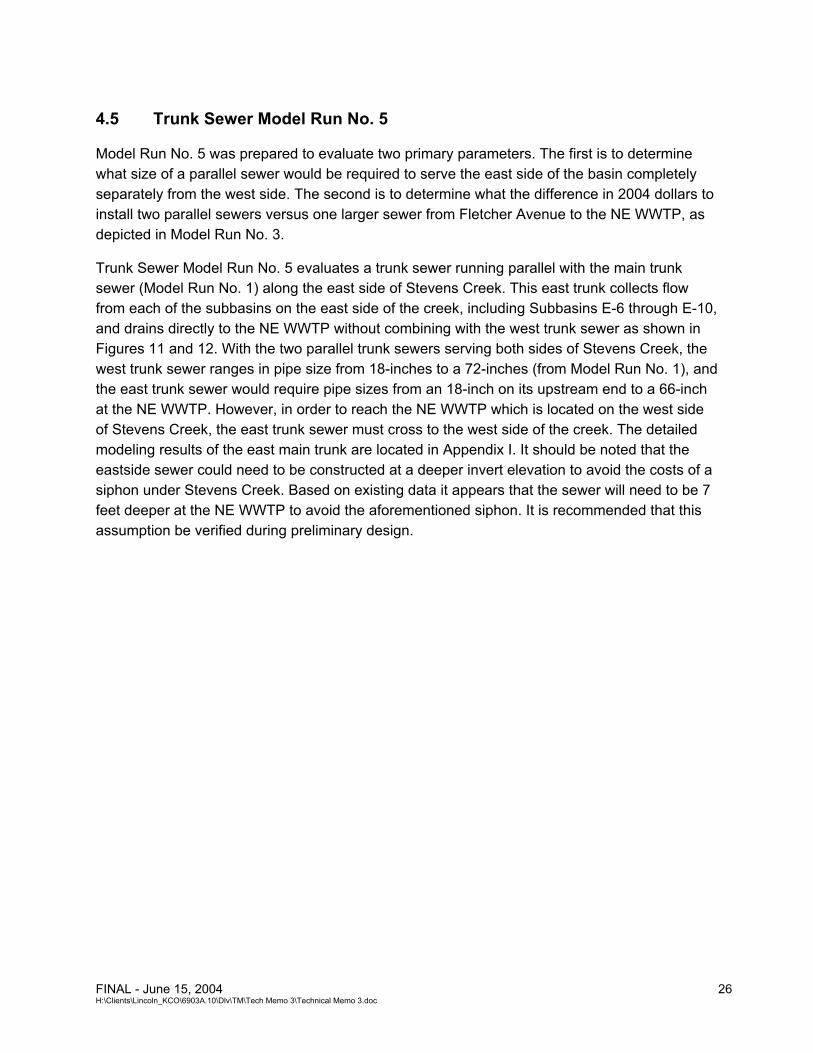
4.5 Trunk Sewer Model Run No. 5
Model Run No. 5 was prepared to evaluate two primary parameters. The first is to determine
what size of a parallel sewer would be required to serve the east side of the basin completely
separately from the west side. The second is to determine what the difference in 2004 dollars to
install two parallel sewers versus one larger sewer from Fletcher Avenue to the NE WWTP, as
depicted in Model Run No. 3.
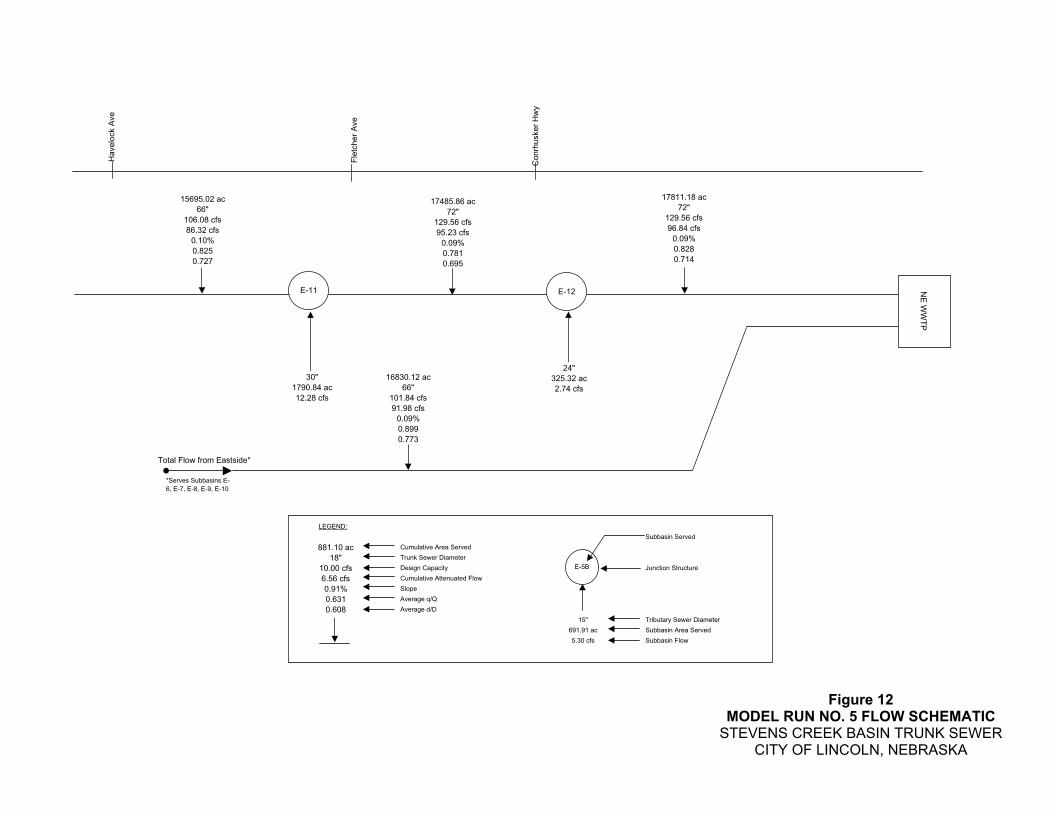
Trunk Sewer Model Run No. 5 evaluates a trunk sewer running parallel with the main trunk
sewer (Model Run No. 1) along the east side of Stevens Creek. This east trunk collects flow
from each of the subbasins on the east side of the creek, including Subbasins E-6 through E-10,
and drains directly to the NE WWTP without combining with the west trunk sewer as shown in
Figures 11 and 12. With the two parallel trunk sewers serving both sides of Stevens Creek, the
west trunk sewer ranges in pipe size from 18-inches to a 72-inches (from Model Run No. 1), and
the east trunk sewer would require pipe sizes from an 18-inch on its upstream end to a 66-inch
at the NE WWTP. However, in order to reach the NE WWTP which is located on the west side
of Stevens Creek, the east trunk sewer must cross to the west side of the creek. The detailed
modeling results of the east main trunk are located in Appendix I. It should be noted that the
eastside sewer could need to be constructed at a deeper invert elevation to avoid the costs of a
siphon under Stevens Creek. Based on existing data it appears that the sewer will need to be 7
feet deeper at the NE WWTP to avoid the aforementioned siphon. It is recommended that this
assumption be verified during preliminary design.

��
��
��
��
��
��
��
��
��
��
��
��
��
��
��
��
�����
�����
����� �
������ �
���� ��
������ ��
��� ��
� � ��
��� ���� ��
������ ����
��� ��! "�
��� #�� "�
$��� ���� "�
%&����� ����'�! �
()��
)���
)���
()��
��*��
�����
+� ����'�! ,
�
�����
����
�
���
�
���
�
����
�
����
�
���
�
��
�
���
�
���
�
����
��
�
����
���
�
���
�
����
%
���� � ���� ����� ����� ����� ����
Figure 11 MODEL RUN NO. 5 PLAN VIEW
STEVENS CREEK BASIN TRUNK SEWER CITY OF LINCOLN, NEBRASKA
LEGEND:
Subbasin Served
Cumulative Area Served
Trunk Sewer Diameter
Design Capacity Junction Structure
Cumulative Attenuated Flow
Slope
Average q/Q
Average d/D
15" Tributary Sewer Diameter
691.91 ac Subbasin Area Served
5.30 cfs Subbasin Flow
E-11 E-12 NE
WW
TP
Havelo
ck A
ve
Fle
tcher
Ave
Conrh
usker
Hw
y
Total Flow from Eastside*
30"
1790.84 ac
12.28 cfs
24"
325.32 ac
2.74 cfs
16830.12 ac
66"
101.84 cfs
91.98 cfs
0.09%
0.899
0.773
E-5B
881.10 ac
18"
10.00 cfs
6.56 cfs
0.91%
0.631
0.608
*Serves Subbasins E-
6, E-7, E-8, E-9, E-10
17811.18 ac
72"
129.56 cfs
96.84 cfs
0.09%
0.828
0.714
15695.02 ac
66"
106.08 cfs
86.32 cfs
0.10%
0.825
0.727
17485.86 ac
72"
129.56 cfs
95.23 cfs
0.09%
0.781
0.695
Figure 12 MODEL RUN NO. 5 FLOW SCHEMATIC
STEVENS CREEK BASIN TRUNK SEWER CITY OF LINCOLN, NEBRASKA

FINAL - June 15, 2004
H:\Clients\Lincoln_KCO\6903A.10\Dlv\TM\Tech Memo 3\Technical Memo 3.doc 29
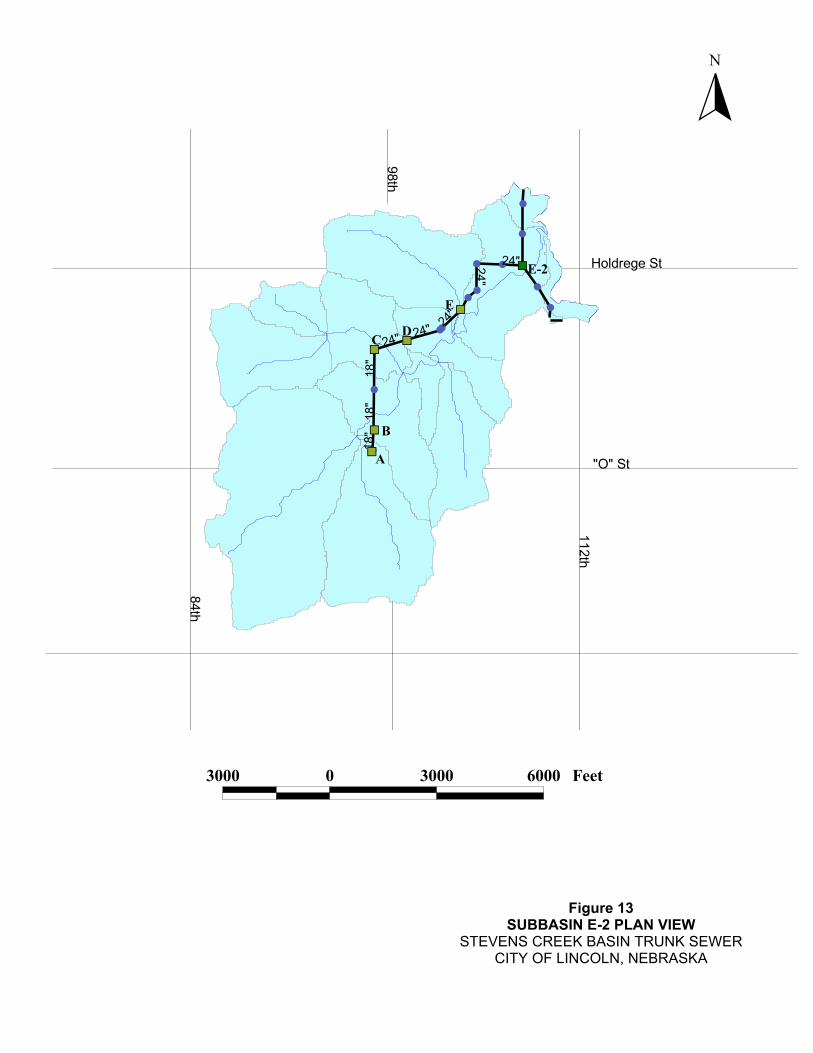
4.6 Subbasin E-2 Sewer Model Run
The LPSNRD has indicated that a dam and impoundment will be constructed on the Subbasin
E-2 tributary just upstream from Stevens Creek. The actual location and dimensions of the dam
and impoundment are unknown at this time. In addition to the dam and impoundments there are
plans to develop parts of this subbasin. The unknowns associated with both of these subjects
should be further defined prior to an actual alignment being selected.
For the purpose of selecting a preliminary pipe size the subbasin was modeled. This tributary
sewer generally proceeds from 98th Street and “O” Street to Junction Structure E-2. For the
purpose of sizing the proposed Subbasin E-2 sewer, thirteen sub-subbasins were delineated
within the subbasin boundary. The sub-subbasin areas ranged between 23 and 455 acres. The
total area of Subbasin E-2 is approximately 1,817 acres. The pipe sizes for this tributary sewer,
from Junction Structure A and Junction Structure E-2, are 18 and 24 inches. Four Junction
Structures A, B, C, D and E were placed along the main trunk within Subbasin E-2 at each point
where a tributary branch sewer intersected the main trunk. Table 9 lists each junction structure,
as well as the pipe size, inflow, and sub-subbasin area associated with each junction structure.
The detailed results of this model run are shown in Appendix K.
��
��
�
��
�
�
�
�
�
�
�
�
�
�
��
����
��
��
��
��� ��
������ ��
���
����
����
�
��
�
�
���
��
��
��
������
���
���
���
�
� � ���
Figure 13 SUBBASIN E-2 PLAN VIEW
STEVENS CREEK BASIN TRUNK SEWER CITY OF LINCOLN, NEBRASKA

H:\Clients\Lincoln_KCO\6903A.10\Dlv\TM\Tech Memo 3\Figures_06-08-04\Tbl 9_Model E-2.doc
Table 9 Model Run Subbasin E-2 Stevens Creek Basin Trunk Sewer City of Lincoln, Nebraska
Individual Sub Basins Trunk Sewer
Jct Box/ Manhole
Node #
Sub Basin Area
(acres) Sub Basin
Q (cfs)
Attenuated Sub Basin Q
(cfs)
Cum. Area Served (acres)
Cum. Attenuated
QIN (cfs) Velocity In (fps)
Cum. Attenuated QOUT (cfs)
Velocity Out (fps)
Pipe Dia. Out (in.)
A N12 685.3 5.26 6.56 685.30 5.26 - 5.26 5.88 18
B N11 150.09 1.40 1.00 835.39 5.26 5.88 6.26 5.88 18
C N9 312.09 2.64 2.02 1147.48 6.26 4.97 8.28 5.02 24
D N8 249.68 2.18 1.57 1397.16 8.28 5.02 9.86 5.54 24
E N5 419.79 3.42 2.58 1816.95 9.86 5.11 12.44 5.84 24
FINAL - June 15, 2004
H:\Clients\Lincoln_KCO\6903A.10\Dlv\TM\Tech Memo 3\Technical Memo 3.doc 32
4.7 Probable Opinion of Estimated Project Costs
The preliminary cost estimates developed in this technical memorandum represent an order of
magnitude cost estimate. All of the cost estimates presented are based on the first quarter of
the year 2004. An order of magnitude estimate is considered a reconnaissance level estimate.
The estimated costs are approximate because they are developed without detailed engineering
data. Order of magnitude costs may be estimated using cost-capacity curves, scaling factors,
ratios, and information from other projects
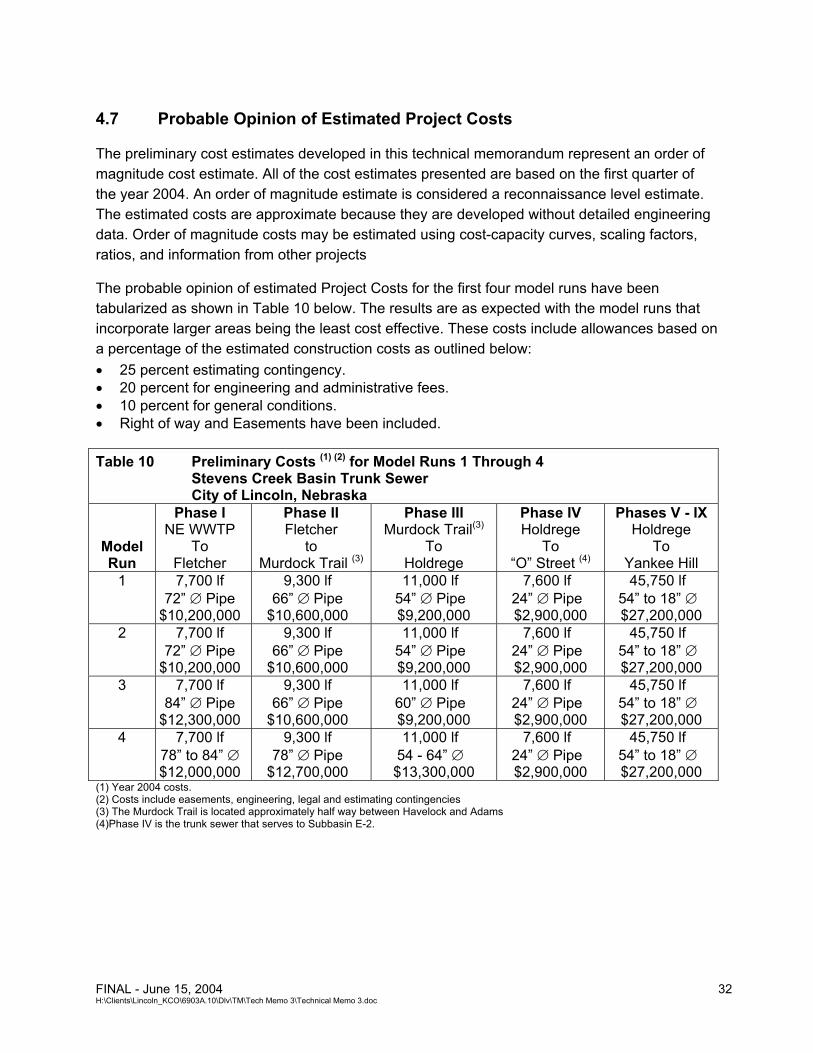
The probable opinion of estimated Project Costs for the first four model runs have been
tabularized as shown in Table 10 below. The results are as expected with the model runs that
incorporate larger areas being the least cost effective. These costs include allowances based on
a percentage of the estimated construction costs as outlined below:
25 percent estimating contingency. 20 percent for engineering and administrative fees. 10 percent for general conditions. Right of way and Easements have been included.
Table 10 Preliminary Costs (1) (2) for Model Runs 1 Through 4 Stevens Creek Basin Trunk Sewer City of Lincoln, Nebraska
Model Run
Phase I NE WWTP
To Fletcher
Phase II Fletcher
to Murdock Trail (3)
Phase III Murdock Trail(3)
To Holdrege
Phase IV Holdrege
To “O” Street (4)
Phases V - IX Holdrege
To Yankee Hill
1 7,700 lf 72” Pipe
$10,200,000
9,300 lf 66” Pipe
$10,600,000
11,000 lf 54” Pipe $9,200,000
7,600 lf 24” Pipe $2,900,000
45,750 lf 54” to 18” $27,200,000
2 7,700 lf 72” Pipe
$10,200,000
9,300 lf 66” Pipe
$10,600,000
11,000 lf 54” Pipe $9,200,000
7,600 lf 24” Pipe $2,900,000
45,750 lf 54” to 18” $27,200,000
3 7,700 lf 84” Pipe
$12,300,000
9,300 lf 66” Pipe
$10,600,000
11,000 lf 60” Pipe $9,200,000
7,600 lf 24” Pipe $2,900,000
45,750 lf 54” to 18” $27,200,000
4 7,700 lf 78” to 84” $12,000,000
9,300 lf 78” Pipe
$12,700,000
11,000 lf 54 - 64” $13,300,000
7,600 lf 24” Pipe $2,900,000
45,750 lf 54” to 18” $27,200,000
(1) Year 2004 costs. (2) Costs include easements, engineering, legal and estimating contingencies (3) The Murdock Trail is located approximately half way between Havelock and Adams (4)Phase IV is the trunk sewer that serves to Subbasin E-2.

FINAL - June 15, 2004
H:\Clients\Lincoln_KCO\6903A.10\Dlv\TM\Tech Memo 3\Technical Memo 3.doc 33
4.8 Summary of Modeling Results
4.8.1 Model Run No. 1
This model serves the Westside only and is the base that the other models build upon. The
probable opinion of estimated project costs associated with this model run is approximately
$60,000,000. These costs include the estimated construction costs for the Subbasin E-2 sewer
(Phase IV). A breakdown of the cost estimate is located in Appendix B.
4.8.2 Model Run No. 2
The probable opinion of estimated project costs for this model run is approximately
$60,000,000. These costs include the estimated construction costs for the Subbasin E-2 sewer
(Phase IV). The primary difference between Model Run No. 2 and Model Run No. 1 is the
additional flow from Subbasin E-6 that enters the trunk sewer near Fletcher Avenue. The 72-
inch diameter trunk, as determined in Model Run No.1, is shown to have enough available
capacity to handle the additional inflow from Subbasin E-6. This resulted in no increase in
estimated project costs over Model Run No. 1. A breakdown of the cost estimate is located in
Appendix D.
4.8.3 Model Run No. 3
The probable opinion of estimated project costs for Model Run No. 3 is approximately
$62,200,000. This revealed that the estimated costs to increase the Phase I pipe from a 72-inch
diameter (Model Runs No.1 and 2) to an 84-inch diameter is approximately $2,000,000. A
detailed breakdown of this cost estimate is presented in Appendix F.
4.8.4 Model Run No. 4
The probable opinion of estimated project costs for this model run is approximately
$68,100,000. The primary purpose for this model run was to determine the difference in pipe
size and associated costs with conveying the flows from the Tier III zones (subbasins E-7, E-8,
E-9, and E-10), into the west side trunk sewer farther upstream of the NE WWTP while
continuing to take the flows from Subbasin E-6 at Junction Structure E-11/E-6, near Fletcher
Avenue. This resulted in an increase in an additional cost of nearly $6,000,000 as compared to
the cost associated with Model Run No. 3. A breakdown of the cost estimate is located in
Appendix H.
4.8.5 Model Run No. 5
A cost estimate was performed on the downstream reach, between Fletcher Avenue and the NE
WWTP, of this model run and is listed with the cost for the same reach of sewer from Model
Run No. 3. The same contingencies and allowances have been used as for the previous model
runs. The probable opinion of estimated project costs for the two parallel sewers (between
Fletcher Avenue and the NE WWTP) is $18,900,000. Likewise, the same reach of sewer sized
to carry the total flow from both sides of the basin (Model Run No. 3) has an estimated costs of
FINAL - June 15, 2004
H:\Clients\Lincoln_KCO\6903A.10\Dlv\TM\Tech Memo 3\Technical Memo 3.doc 34
$12,300,000. Therefore, based on 2004 dollars, installing one single 84-inch diameter sewer
would be more cost effective than install two trunk sewers if they were both installed today. A
breakdown of the cost estimate is located in Appendix J.
4.8.6 Subbasin E-2 Model Run
The probable opinion of estimated project costs for this sewer is $2,900,000. A breakdown of
the cost estimate for this model run is located in Appendix L.
5.0 SELECTION OF THE PREFERRED TRUNK SEWER SIZE
5.1 Purpose of Modeling
The primary purpose of this modeling exercise is to select the areas that are to be served by the
trunk sewer. The areas to be served by the trunk sewer thereby defines the size of the sewer
that will eventually be installed. Two primary methods have been utilized to accomplish this. The
first is to select the model run which serves the areas defined in the Scope of Work (Tier I and
Tier II). The second method is to select the trunk sewer size based on the years of service that
the trunk sewer will provide regardless of the areas served. Each of these two methods is
discussed below.
5.2 Selecting the Trunk Sewer Size To Serve Tier I and Tier II
Selecting the size of the trunk sewer based on this method is simply selecting the model run
that serves the currently identified Tier I and Tier II planning zones. Using this methodology,
Model Run No. 2 would be the selected alternative. This model run reveals that a 72-inch
diameter pipe would be required for Phase I project as discussed previously.
5.3 Selecting the Trunk Sewer Size Based On Estimated Years of Service
For this method the size of the sewer, or model run will be determined based on estimating the
years of service that a particular size trunk sewer will have based on new growth in the Stevens
Creek Basin. To determine the growth in the basin the City population in the year 2001 was
projected at a growth rate of 1.5 % per year as identified in the Wastewater Facility Master Plan, October 2002. Since it is not logical that all of the new growth will occur in the Stevens Creek
Basin three different growth scenarios have been delineated. These growth scenarios are based
assuming a percentage of the new growth will locate in the basin. The three growth scenarios
that have been evaluated shown are:
30 percent of the new growth will reside in Stevens Creek Basin 50 percent of the new growth will reside in Stevens Creek Basin, and 75 percent of the new growth will reside in Stevens Creek Basin.
Based on the growth assumptions stated above a graphical representation of the wastewater
flows, pipe size capacity, and years of service has been prepared as shown in Figure 14. The
FINAL - June 15, 2004
H:\Clients\Lincoln_KCO\6903A.10\Dlv\TM\Tech Memo 3\Technical Memo 3.doc 35
two different Phase I pipe sizes shown in the figure are a 72-inch pipe (as identified in Model
Run Nos.1 and 2), and an 84-inch pipe (as identified in Model Run Nos. 3 and 4).

Notes: 1- Flow is based on 7.2 people per acre per City Planning 2- The City’s flow equation was used to calculate flows 3 - Pipe sizes were based on 5 ft/sec which generally correlates with the dynamic modeling results 4 - “Total Basin Buildout” includes both the west and east sides of the basin 5 - “West Side Basin Buildout” includes the area on the west side of the basin 6 - 30%, 50%, and 75% Population indicates the percentage of growth that locates to the Stevens Creek Basin 7 - Population growth rate used was 1.5% based on the Wastewater Facilities Plan Update, October 2002. 8- 66-inch diameter pipe is the smallest size pipe that can be used to maintain adequate cover (to be verified during prelim. design)
Figure 14 PROJECTED PEAK FLOWS VS
PHASE I PIPE SIZE STEVENS CREEK BASIN TRUNK SEWER
CITY OF LINCOLN, NEBRASKA
0
5 0
1 0 0
1 5 0
2 0 0
2 5 0
3 0 0
2 0 0 0 2 0 1 0 2 0 2 0 2 0 3 0 2 0 4 0 2 0 5 0 2 0 6 0 2 0 7 0 2 0 8 0 2 0 9 0
Y e a r
Pe
ak
Flo
w, c
fs
3 0 % P o p u la tio n
7 2 -in c h
8 4 -in c h
T o ta l B a s in B u ild o u t
9 6 -in c h
5 0 % P o p u la tio n7 5 % P o p u la tio n
W e s t S id e B a s in B u ild o u t
FINAL - June 15, 2004
H:\Clients\Lincoln_KCO\6903A.10\Dlv\TM\Tech Memo 3\Technical Memo 3.doc 37
These pipes are then compared to the projected basin buildout wastewater flows. These flows
are calculated using the projected population growth of 1.5 percent and a population density of
7.2 people per acre (provided by the City Planning Department).
This evaluation revealed that a 72-inch diameter sewer (the same size as selected by method 1
above) at the 75 percent growth curve would reach its capacity in approximately 2045. Likewise,
the same pipe would reach its capacity in approximately 2085 at the 30 percent growth rate. An
84-inch pipe has the capacity to serve the entire basin.
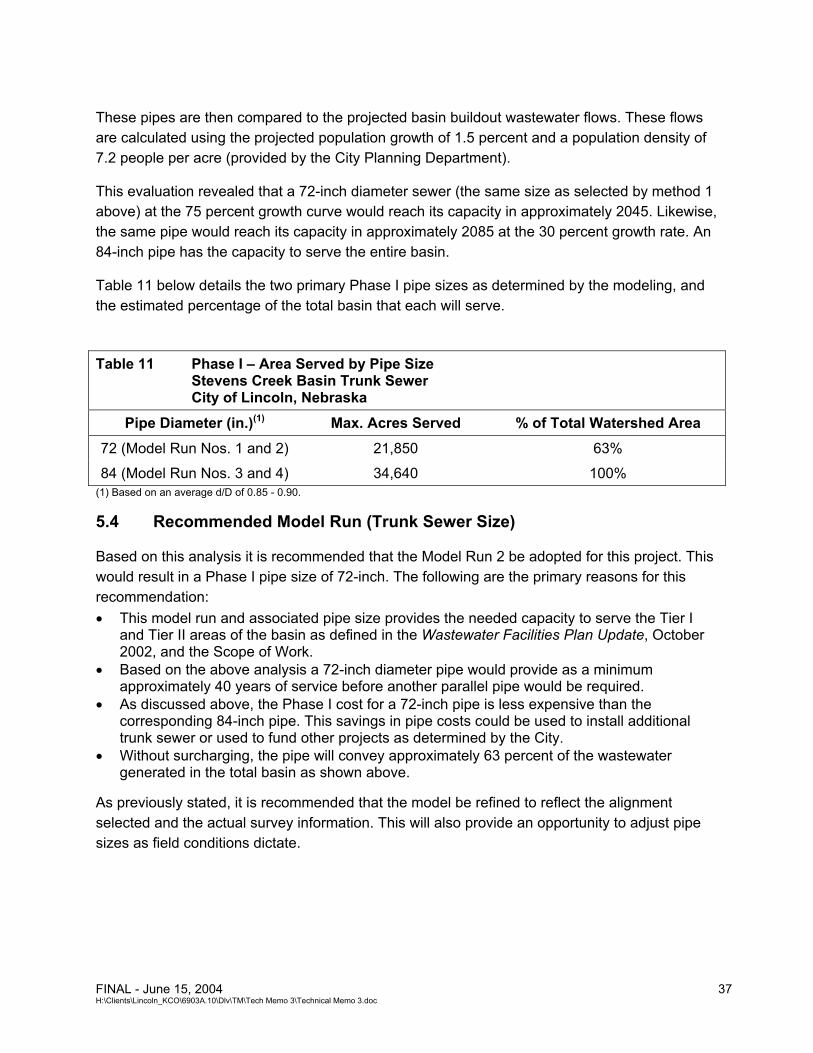
Table 11 below details the two primary Phase I pipe sizes as determined by the modeling, and
the estimated percentage of the total basin that each will serve.
Table 11 Phase I – Area Served by Pipe Size Stevens Creek Basin Trunk Sewer City of Lincoln, Nebraska
Pipe Diameter (in.)(1) Max. Acres Served % of Total Watershed Area
72 (Model Run Nos. 1 and 2) 21,850 63%
84 (Model Run Nos. 3 and 4) 34,640 100% (1) Based on an average d/D of 0.85 - 0.90.
5.4 Recommended Model Run (Trunk Sewer Size)
Based on this analysis it is recommended that the Model Run 2 be adopted for this project. This
would result in a Phase I pipe size of 72-inch. The following are the primary reasons for this
recommendation:
This model run and associated pipe size provides the needed capacity to serve the Tier I and Tier II areas of the basin as defined in the Wastewater Facilities Plan Update, October 2002, and the Scope of Work. Based on the above analysis a 72-inch diameter pipe would provide as a minimum approximately 40 years of service before another parallel pipe would be required. As discussed above, the Phase I cost for a 72-inch pipe is less expensive than the corresponding 84-inch pipe. This savings in pipe costs could be used to install additional trunk sewer or used to fund other projects as determined by the City. Without surcharging, the pipe will convey approximately 63 percent of the wastewater generated in the total basin as shown above.
As previously stated, it is recommended that the model be refined to reflect the alignment
selected and the actual survey information. This will also provide an opportunity to adjust pipe
sizes as field conditions dictate.

APPENDIX A
Model Run No. 1 Output
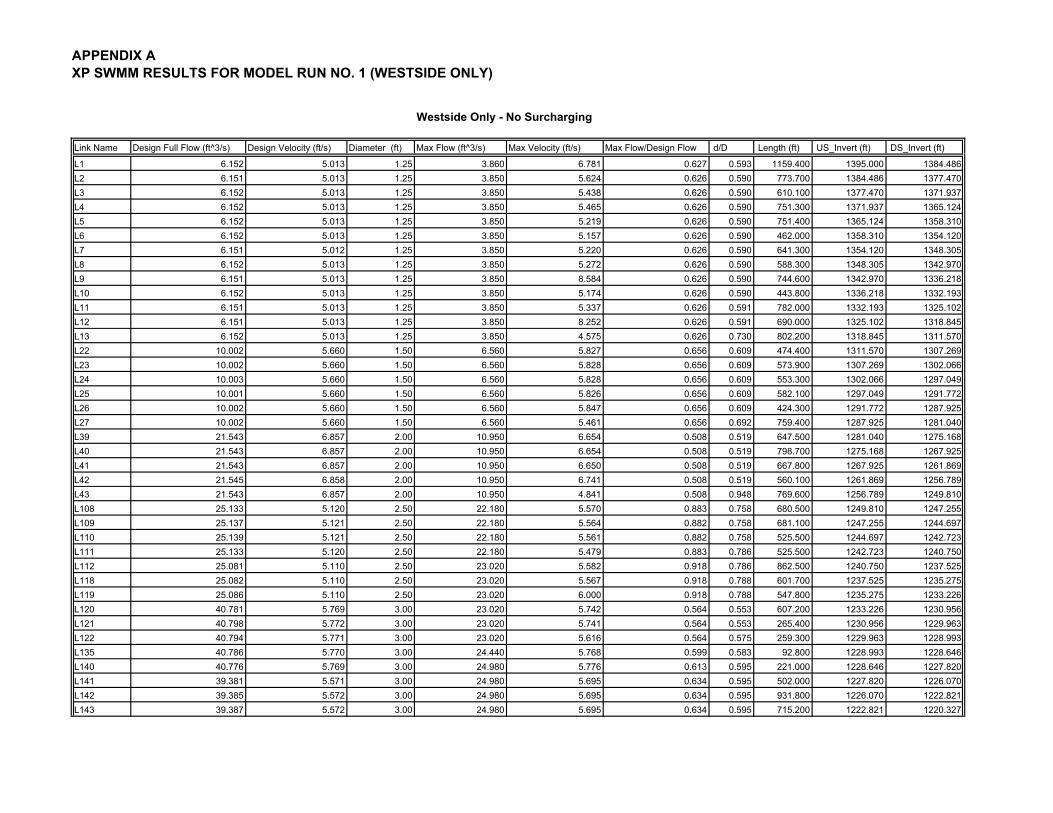
APPENDIX A
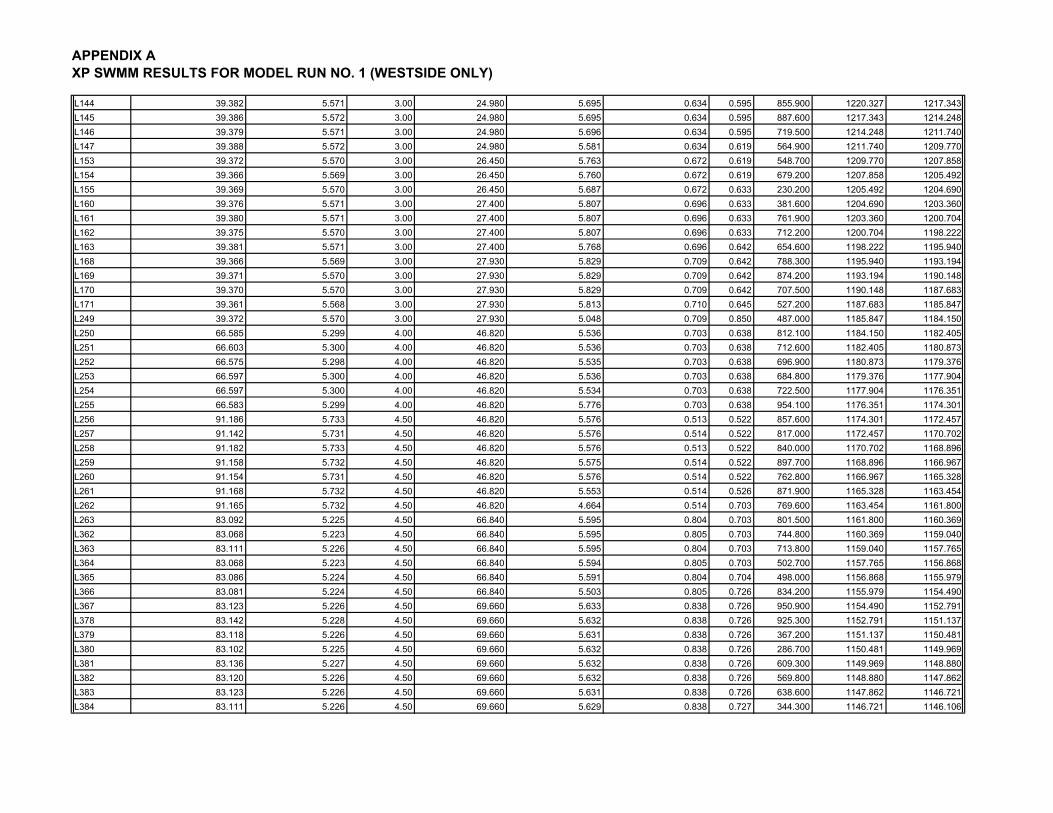
XP SWMM RESULTS FOR MODEL RUN NO. 1 (WESTSIDE ONLY)
Westside Only - No Surcharging
Link Name Design Full Flow (ft^3/s) Design Velocity (ft/s) Diameter (ft) Max Flow (ft^3/s) Max Velocity (ft/s) Max Flow/Design Flow d/D Length (ft) US_Invert (ft) DS_Invert (ft)
L1 6.152 5.013 1.25 3.860 6.781 0.627 0.593 1159.400 1395.000 1384.486
L2 6.151 5.013 1.25 3.850 5.624 0.626 0.590 773.700 1384.486 1377.470
L3 6.152 5.013 1.25 3.850 5.438 0.626 0.590 610.100 1377.470 1371.937
L4 6.152 5.013 1.25 3.850 5.465 0.626 0.590 751.300 1371.937 1365.124
L5 6.152 5.013 1.25 3.850 5.219 0.626 0.590 751.400 1365.124 1358.310
L6 6.152 5.013 1.25 3.850 5.157 0.626 0.590 462.000 1358.310 1354.120
L7 6.151 5.012 1.25 3.850 5.220 0.626 0.590 641.300 1354.120 1348.305
L8 6.152 5.013 1.25 3.850 5.272 0.626 0.590 588.300 1348.305 1342.970
L9 6.151 5.013 1.25 3.850 8.584 0.626 0.590 744.600 1342.970 1336.218
L10 6.152 5.013 1.25 3.850 5.174 0.626 0.590 443.800 1336.218 1332.193
L11 6.151 5.013 1.25 3.850 5.337 0.626 0.591 782.000 1332.193 1325.102
L12 6.151 5.013 1.25 3.850 8.252 0.626 0.591 690.000 1325.102 1318.845
L13 6.152 5.013 1.25 3.850 4.575 0.626 0.730 802.200 1318.845 1311.570
L22 10.002 5.660 1.50 6.560 5.827 0.656 0.609 474.400 1311.570 1307.269
L23 10.002 5.660 1.50 6.560 5.828 0.656 0.609 573.900 1307.269 1302.066
L24 10.003 5.660 1.50 6.560 5.828 0.656 0.609 553.300 1302.066 1297.049
L25 10.001 5.660 1.50 6.560 5.826 0.656 0.609 582.100 1297.049 1291.772
L26 10.002 5.660 1.50 6.560 5.847 0.656 0.609 424.300 1291.772 1287.925
L27 10.002 5.660 1.50 6.560 5.461 0.656 0.692 759.400 1287.925 1281.040
L39 21.543 6.857 2.00 10.950 6.654 0.508 0.519 647.500 1281.040 1275.168
L40 21.543 6.857 2.00 10.950 6.654 0.508 0.519 798.700 1275.168 1267.925
L41 21.543 6.857 2.00 10.950 6.650 0.508 0.519 667.800 1267.925 1261.869
L42 21.545 6.858 2.00 10.950 6.741 0.508 0.519 560.100 1261.869 1256.789
L43 21.543 6.857 2.00 10.950 4.841 0.508 0.948 769.600 1256.789 1249.810
L108 25.133 5.120 2.50 22.180 5.570 0.883 0.758 680.500 1249.810 1247.255
L109 25.137 5.121 2.50 22.180 5.564 0.882 0.758 681.100 1247.255 1244.697
L110 25.139 5.121 2.50 22.180 5.561 0.882 0.758 525.500 1244.697 1242.723
L111 25.133 5.120 2.50 22.180 5.479 0.883 0.786 525.500 1242.723 1240.750
L112 25.081 5.110 2.50 23.020 5.582 0.918 0.786 862.500 1240.750 1237.525
L118 25.082 5.110 2.50 23.020 5.567 0.918 0.788 601.700 1237.525 1235.275
L119 25.086 5.110 2.50 23.020 6.000 0.918 0.788 547.800 1235.275 1233.226
L120 40.781 5.769 3.00 23.020 5.742 0.564 0.553 607.200 1233.226 1230.956
L121 40.798 5.772 3.00 23.020 5.741 0.564 0.553 265.400 1230.956 1229.963
L122 40.794 5.771 3.00 23.020 5.616 0.564 0.575 259.300 1229.963 1228.993
L135 40.786 5.770 3.00 24.440 5.768 0.599 0.583 92.800 1228.993 1228.646
L140 40.776 5.769 3.00 24.980 5.776 0.613 0.595 221.000 1228.646 1227.820
L141 39.381 5.571 3.00 24.980 5.695 0.634 0.595 502.000 1227.820 1226.070
L142 39.385 5.572 3.00 24.980 5.695 0.634 0.595 931.800 1226.070 1222.821
L143 39.387 5.572 3.00 24.980 5.695 0.634 0.595 715.200 1222.821 1220.327
APPENDIX A
XP SWMM RESULTS FOR MODEL RUN NO. 1 (WESTSIDE ONLY)
L144 39.382 5.571 3.00 24.980 5.695 0.634 0.595 855.900 1220.327 1217.343
L145 39.386 5.572 3.00 24.980 5.695 0.634 0.595 887.600 1217.343 1214.248
L146 39.379 5.571 3.00 24.980 5.696 0.634 0.595 719.500 1214.248 1211.740
L147 39.388 5.572 3.00 24.980 5.581 0.634 0.619 564.900 1211.740 1209.770
L153 39.372 5.570 3.00 26.450 5.763 0.672 0.619 548.700 1209.770 1207.858
L154 39.366 5.569 3.00 26.450 5.760 0.672 0.619 679.200 1207.858 1205.492
L155 39.369 5.570 3.00 26.450 5.687 0.672 0.633 230.200 1205.492 1204.690
L160 39.376 5.571 3.00 27.400 5.807 0.696 0.633 381.600 1204.690 1203.360
L161 39.380 5.571 3.00 27.400 5.807 0.696 0.633 761.900 1203.360 1200.704
L162 39.375 5.570 3.00 27.400 5.807 0.696 0.633 712.200 1200.704 1198.222
L163 39.381 5.571 3.00 27.400 5.768 0.696 0.642 654.600 1198.222 1195.940
L168 39.366 5.569 3.00 27.930 5.829 0.709 0.642 788.300 1195.940 1193.194
L169 39.371 5.570 3.00 27.930 5.829 0.709 0.642 874.200 1193.194 1190.148
L170 39.370 5.570 3.00 27.930 5.829 0.709 0.642 707.500 1190.148 1187.683
L171 39.361 5.568 3.00 27.930 5.813 0.710 0.645 527.200 1187.683 1185.847
L249 39.372 5.570 3.00 27.930 5.048 0.709 0.850 487.000 1185.847 1184.150
L250 66.585 5.299 4.00 46.820 5.536 0.703 0.638 812.100 1184.150 1182.405
L251 66.603 5.300 4.00 46.820 5.536 0.703 0.638 712.600 1182.405 1180.873
L252 66.575 5.298 4.00 46.820 5.535 0.703 0.638 696.900 1180.873 1179.376
L253 66.597 5.300 4.00 46.820 5.536 0.703 0.638 684.800 1179.376 1177.904
L254 66.597 5.300 4.00 46.820 5.534 0.703 0.638 722.500 1177.904 1176.351
L255 66.583 5.299 4.00 46.820 5.776 0.703 0.638 954.100 1176.351 1174.301
L256 91.186 5.733 4.50 46.820 5.576 0.513 0.522 857.600 1174.301 1172.457
L257 91.142 5.731 4.50 46.820 5.576 0.514 0.522 817.000 1172.457 1170.702
L258 91.182 5.733 4.50 46.820 5.576 0.513 0.522 840.000 1170.702 1168.896
L259 91.158 5.732 4.50 46.820 5.575 0.514 0.522 897.700 1168.896 1166.967
L260 91.154 5.731 4.50 46.820 5.576 0.514 0.522 762.800 1166.967 1165.328
L261 91.168 5.732 4.50 46.820 5.553 0.514 0.526 871.900 1165.328 1163.454
L262 91.165 5.732 4.50 46.820 4.664 0.514 0.703 769.600 1163.454 1161.800
L263 83.092 5.225 4.50 66.840 5.595 0.804 0.703 801.500 1161.800 1160.369
L362 83.068 5.223 4.50 66.840 5.595 0.805 0.703 744.800 1160.369 1159.040
L363 83.111 5.226 4.50 66.840 5.595 0.804 0.703 713.800 1159.040 1157.765
L364 83.068 5.223 4.50 66.840 5.594 0.805 0.703 502.700 1157.765 1156.868
L365 83.086 5.224 4.50 66.840 5.591 0.804 0.704 498.000 1156.868 1155.979
L366 83.081 5.224 4.50 66.840 5.503 0.805 0.726 834.200 1155.979 1154.490
L367 83.123 5.226 4.50 69.660 5.633 0.838 0.726 950.900 1154.490 1152.791
L378 83.142 5.228 4.50 69.660 5.632 0.838 0.726 925.300 1152.791 1151.137
L379 83.118 5.226 4.50 69.660 5.631 0.838 0.726 367.200 1151.137 1150.481
L380 83.102 5.225 4.50 69.660 5.632 0.838 0.726 286.700 1150.481 1149.969
L381 83.136 5.227 4.50 69.660 5.632 0.838 0.726 609.300 1149.969 1148.880
L382 83.120 5.226 4.50 69.660 5.632 0.838 0.726 569.800 1148.880 1147.862
L383 83.123 5.226 4.50 69.660 5.631 0.838 0.726 638.600 1147.862 1146.721
L384 83.111 5.226 4.50 69.660 5.629 0.838 0.727 344.300 1146.721 1146.106
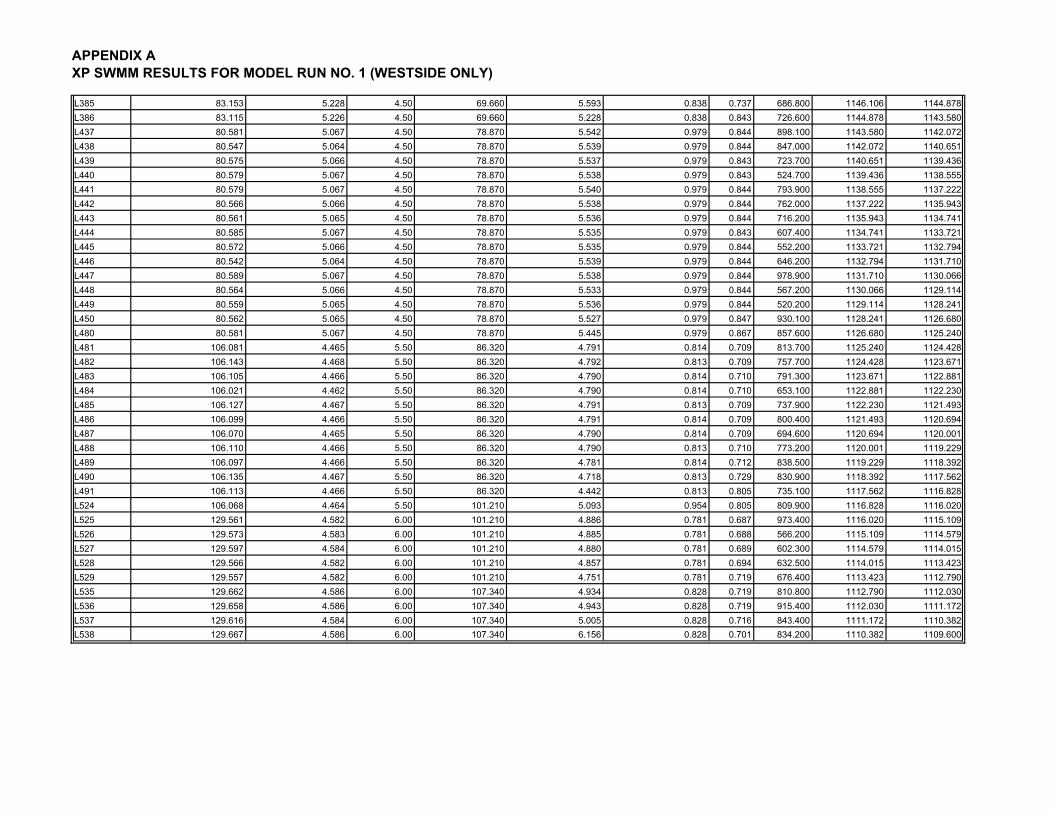
APPENDIX A
XP SWMM RESULTS FOR MODEL RUN NO. 1 (WESTSIDE ONLY)
L385 83.153 5.228 4.50 69.660 5.593 0.838 0.737 686.800 1146.106 1144.878
L386 83.115 5.226 4.50 69.660 5.228 0.838 0.843 726.600 1144.878 1143.580
L437 80.581 5.067 4.50 78.870 5.542 0.979 0.844 898.100 1143.580 1142.072
L438 80.547 5.064 4.50 78.870 5.539 0.979 0.844 847.000 1142.072 1140.651
L439 80.575 5.066 4.50 78.870 5.537 0.979 0.843 723.700 1140.651 1139.436
L440 80.579 5.067 4.50 78.870 5.538 0.979 0.843 524.700 1139.436 1138.555
L441 80.579 5.067 4.50 78.870 5.540 0.979 0.844 793.900 1138.555 1137.222
L442 80.566 5.066 4.50 78.870 5.538 0.979 0.844 762.000 1137.222 1135.943
L443 80.561 5.065 4.50 78.870 5.536 0.979 0.844 716.200 1135.943 1134.741
L444 80.585 5.067 4.50 78.870 5.535 0.979 0.843 607.400 1134.741 1133.721
L445 80.572 5.066 4.50 78.870 5.535 0.979 0.844 552.200 1133.721 1132.794
L446 80.542 5.064 4.50 78.870 5.539 0.979 0.844 646.200 1132.794 1131.710
L447 80.589 5.067 4.50 78.870 5.538 0.979 0.844 978.900 1131.710 1130.066
L448 80.564 5.066 4.50 78.870 5.533 0.979 0.844 567.200 1130.066 1129.114
L449 80.559 5.065 4.50 78.870 5.536 0.979 0.844 520.200 1129.114 1128.241
L450 80.562 5.065 4.50 78.870 5.527 0.979 0.847 930.100 1128.241 1126.680
L480 80.581 5.067 4.50 78.870 5.445 0.979 0.867 857.600 1126.680 1125.240
L481 106.081 4.465 5.50 86.320 4.791 0.814 0.709 813.700 1125.240 1124.428
L482 106.143 4.468 5.50 86.320 4.792 0.813 0.709 757.700 1124.428 1123.671
L483 106.105 4.466 5.50 86.320 4.790 0.814 0.710 791.300 1123.671 1122.881
L484 106.021 4.462 5.50 86.320 4.790 0.814 0.710 653.100 1122.881 1122.230
L485 106.127 4.467 5.50 86.320 4.791 0.813 0.709 737.900 1122.230 1121.493
L486 106.099 4.466 5.50 86.320 4.791 0.814 0.709 800.400 1121.493 1120.694
L487 106.070 4.465 5.50 86.320 4.790 0.814 0.709 694.600 1120.694 1120.001
L488 106.110 4.466 5.50 86.320 4.790 0.813 0.710 773.200 1120.001 1119.229
L489 106.097 4.466 5.50 86.320 4.781 0.814 0.712 838.500 1119.229 1118.392
L490 106.135 4.467 5.50 86.320 4.718 0.813 0.729 830.900 1118.392 1117.562
L491 106.113 4.466 5.50 86.320 4.442 0.813 0.805 735.100 1117.562 1116.828
L524 106.068 4.464 5.50 101.210 5.093 0.954 0.805 809.900 1116.828 1116.020
L525 129.561 4.582 6.00 101.210 4.886 0.781 0.687 973.400 1116.020 1115.109
L526 129.573 4.583 6.00 101.210 4.885 0.781 0.688 566.200 1115.109 1114.579
L527 129.597 4.584 6.00 101.210 4.880 0.781 0.689 602.300 1114.579 1114.015
L528 129.566 4.582 6.00 101.210 4.857 0.781 0.694 632.500 1114.015 1113.423
L529 129.557 4.582 6.00 101.210 4.751 0.781 0.719 676.400 1113.423 1112.790
L535 129.662 4.586 6.00 107.340 4.934 0.828 0.719 810.800 1112.790 1112.030
L536 129.658 4.586 6.00 107.340 4.943 0.828 0.719 915.400 1112.030 1111.172
L537 129.616 4.584 6.00 107.340 5.005 0.828 0.716 843.400 1111.172 1110.382
L538 129.667 4.586 6.00 107.340 6.156 0.828 0.701 834.200 1110.382 1109.600

APPENDIX B
Model Run No. 1 Estimated Cost Data
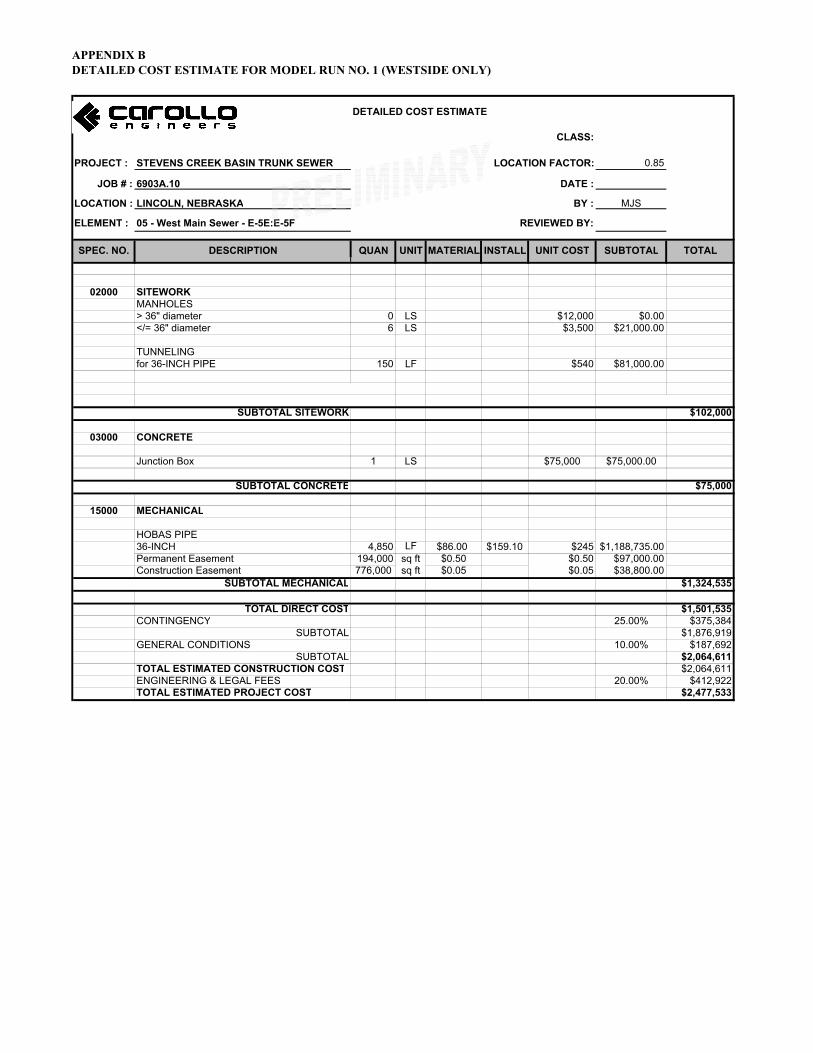
APPENDIX B
DETAILED COST ESTIMATE FOR MODEL RUN NO. 1 (WESTSIDE ONLY)
DETAILED COST ESTIMATE
CLASS:
PROJECT : STEVENS CREEK BASIN TRUNK SEWER LOCATION FACTOR: 0.85
JOB # : 6903A.10 DATE :
LOCATION : LINCOLN, NEBRASKA BY : MJS
ELEMENT : 05 - West Main Sewer - E-5E:E-5F REVIEWED BY:
SPEC. NO. DESCRIPTION QUAN UNIT MATERIAL INSTALL UNIT COST SUBTOTAL TOTAL
02000 SITEWORKMANHOLES> 36" diameter 0 LS $12,000 $0.00</= 36" diameter 6 LS $3,500 $21,000.00
TUNNELINGfor 36-INCH PIPE 150 LF $540 $81,000.00
$102,000
03000 CONCRETE
Junction Box 1 LS $75,000 $75,000.00
$75,000
15000 MECHANICAL
HOBAS PIPE36-INCH 4,850 LF $86.00 $159.10 $245 $1,188,735.00Permanent Easement 194,000 sq ft $0.50 $0.50 $97,000.00Construction Easement 776,000 sq ft $0.05 $0.05 $38,800.00
$1,324,535
TOTAL DIRECT COST $1,501,535CONTINGENCY 25.00% $375,384
SUBTOTAL $1,876,919GENERAL CONDITIONS 10.00% $187,692
SUBTOTAL $2,064,611TOTAL ESTIMATED CONSTRUCTION COST $2,064,611ENGINEERING & LEGAL FEES 20.00% $412,922TOTAL ESTIMATED PROJECT COST $2,477,533
SUBTOTAL CONCRETE
SUBTOTAL MECHANICAL
SUBTOTAL SITEWORK

APPENDIX C
Model Run No. 2 Output

APPENDIX C
XP SWMM RESULTS FOR MODEL RUN NO. 2 (WESTSIDE + SUBBASIN E-6)
Link Name Design Full Flow (ft^3/s) Design Velocity (ft/s) Diameter (ft) Max Flow (ft^3/s) Max Velocity (ft/s) Max Flow/Design Fl d/D Length (ft) US_Invert (ft) DS_Invert (ft)
L1 6.152 5.013 1.25 3.851 5.168 0.626 0.593 1159.400 1395.000 1384.486
L2 6.153 5.014 1.25 3.850 5.124 0.626 0.590 773.700 1384.490 1377.470
L3 6.152 5.013 1.25 3.850 5.105 0.626 0.593 610.100 1377.470 1371.937
L4 6.153 5.014 1.25 3.850 5.118 0.626 0.590 751.300 1371.940 1365.124
L5 6.152 5.013 1.25 3.850 5.110 0.626 0.590 751.400 1365.124 1358.310
L6 6.152 5.013 1.25 3.850 5.108 0.626 0.590 462.000 1358.310 1354.120
L7 6.151 5.012 1.25 3.850 5.108 0.626 0.590 641.300 1354.120 1348.306
L8 6.150 5.012 1.25 3.850 5.109 0.626 0.590 588.300 1348.306 1342.973
L9 6.150 5.012 1.25 3.850 5.108 0.626 0.590 744.600 1342.973 1336.223
L10 6.150 5.012 1.25 3.850 5.108 0.626 0.590 443.800 1336.223 1332.200
L11 6.153 5.014 1.25 3.850 5.110 0.626 0.590 782.000 1332.200 1325.106
L12 6.152 5.013 1.25 3.850 5.129 0.626 0.590 690.000 1325.106 1318.847
L13 6.154 5.015 1.25 3.850 4.578 0.626 0.730 802.200 1318.850 1311.570
L22 10.001 5.659 1.50 6.552 5.825 0.655 0.608 474.400 1311.570 1307.270
L23 10.003 5.660 1.50 6.552 5.826 0.655 0.608 573.900 1307.270 1302.066
L24 10.003 5.660 1.50 6.552 5.822 0.655 0.609 553.300 1302.066 1297.049
L25 10.002 5.660 1.50 6.552 5.825 0.655 0.608 582.100 1297.050 1291.772
L26 10.002 5.660 1.50 6.552 5.844 0.655 0.608 424.300 1291.772 1287.925
L27 10.002 5.660 1.50 6.552 5.458 0.655 0.691 759.400 1287.925 1281.040
L39 21.543 6.857 2.00 10.942 6.652 0.508 0.518 647.500 1281.040 1275.168
L40 21.543 6.857 2.00 10.942 6.652 0.508 0.518 798.700 1275.168 1267.925
L41 21.543 6.857 2.00 10.942 6.649 0.508 0.519 667.800 1267.925 1261.869
L42 21.545 6.858 2.00 10.942 6.736 0.508 0.519 560.100 1261.869 1256.789
L43 21.544 6.858 2.00 10.942 4.839 0.508 0.947 769.600 1256.790 1249.810
L108 25.133 5.120 2.50 22.172 5.557 0.882 0.758 680.500 1249.810 1247.255
L109 25.137 5.121 2.50 22.172 5.557 0.882 0.758 681.100 1247.255 1244.697
L110 25.139 5.121 2.50 22.172 5.556 0.882 0.758 525.500 1244.697 1242.723
L111 25.133 5.120 2.50 22.172 5.457 0.882 0.789 525.500 1242.723 1240.750
L112 25.140 5.121 2.50 23.167 5.583 0.922 0.789 862.500 1240.750 1237.510
L118 25.143 5.122 2.50 23.167 5.581 0.921 0.789 601.700 1237.510 1235.249
L119 25.147 5.123 2.50 23.167 5.580 0.921 0.790 547.800 1235.249 1233.190
L120 25.134 5.120 2.50 23.167 5.566 0.922 0.793 607.200 1233.190 1230.910
L121 24.899 5.072 2.50 23.167 5.996 0.930 0.793 265.400 1230.910 1229.932
L122 40.499 5.729 3.00 23.167 5.719 0.572 0.558 259.300 1229.932 1228.976
L135 40.491 5.728 3.00 23.167 5.710 0.572 0.559 92.800 1228.976 1228.634
L140 40.479 5.727 3.00 23.167 5.466 0.572 0.603 221.000 1228.634 1227.820
L141 39.358 5.568 3.00 25.447 5.717 0.647 0.603 502.000 1227.820 1226.072
L142 39.385 5.572 3.00 25.447 5.718 0.646 0.603 931.800 1226.072 1222.823
L143 39.379 5.571 3.00 25.447 5.719 0.646 0.603 715.200 1222.823 1220.330
L144 39.396 5.573 3.00 25.447 5.719 0.646 0.603 855.900 1220.330 1217.344

APPENDIX C
XP SWMM RESULTS FOR MODEL RUN NO. 2 (WESTSIDE + SUBBASIN E-6)
L145 39.379 5.571 3.00 25.447 5.718 0.646 0.603 887.600 1217.344 1214.250
L146 39.395 5.573 3.00 25.447 5.720 0.646 0.602 719.500 1214.250 1211.740
L147 39.388 5.572 3.00 25.447 5.642 0.646 0.618 564.900 1211.740 1209.770
L153 39.372 5.570 3.00 26.434 5.762 0.671 0.618 548.700 1209.770 1207.858
L154 39.366 5.569 3.00 26.434 5.759 0.671 0.619 679.200 1207.858 1205.492
L155 39.369 5.570 3.00 26.434 5.687 0.671 0.633 230.200 1205.492 1204.690
L160 39.376 5.571 3.00 27.384 5.806 0.695 0.633 381.600 1204.690 1203.360
L161 39.380 5.571 3.00 27.384 5.806 0.695 0.633 761.900 1203.360 1200.704
L162 39.375 5.570 3.00 27.384 5.807 0.695 0.633 712.200 1200.704 1198.222
L163 39.381 5.571 3.00 27.384 5.763 0.695 0.642 654.600 1198.222 1195.940
L168 39.323 5.563 3.00 27.934 5.827 0.710 0.642 788.300 1195.940 1193.200
L169 39.397 5.573 3.00 27.934 5.831 0.709 0.642 874.200 1193.200 1190.150
L170 39.370 5.570 3.00 27.934 5.821 0.710 0.644 707.500 1190.150 1187.685
L171 39.382 5.571 3.00 27.934 6.364 0.709 0.644 527.200 1187.685 1185.847
L249 84.793 6.748 4.00 27.934 4.709 0.329 0.568 487.000 1185.847 1184.150
L250 79.235 6.305 4.00 46.804 6.286 0.591 0.605 812.100 1184.150 1181.679
L251 72.133 5.740 4.00 46.804 6.422 0.649 0.605 712.600 1181.679 1179.882
L252 85.239 6.783 4.00 46.804 5.929 0.549 0.676 696.900 1178.882 1176.428
L253 61.321 4.880 4.00 46.804 5.138 0.763 0.687 684.800 1176.428 1175.180
L254 59.962 4.772 4.00 46.804 5.114 0.781 0.687 722.500 1175.180 1173.921
L255 60.776 4.836 4.00 46.804 5.146 0.770 0.680 954.100 1173.921 1172.213
L256 60.791 4.838 4.00 46.804 5.146 0.770 0.680 857.600 1172.213 1170.677
L257 60.764 4.835 4.00 46.804 5.145 0.770 0.680 817.000 1170.677 1169.215
L258 60.781 4.837 4.00 46.804 5.146 0.770 0.680 840.000 1169.215 1167.711
L259 60.775 4.836 4.00 46.804 5.145 0.770 0.680 897.700 1167.711 1166.104
L260 60.764 4.835 4.00 46.804 5.145 0.770 0.680 762.800 1166.104 1164.739
L261 60.779 4.837 4.00 46.804 5.124 0.770 0.685 871.900 1164.739 1163.178
L262 60.782 4.837 4.00 46.804 4.761 0.770 0.789 769.600 1163.178 1161.800
L263 83.063 5.223 4.50 66.574 5.591 0.801 0.701 801.500 1161.800 1160.370
L362 83.099 5.225 4.50 66.574 5.593 0.801 0.701 744.800 1160.370 1159.040
L363 83.111 5.226 4.50 66.574 5.592 0.801 0.701 713.800 1159.040 1157.765
L364 83.068 5.223 4.50 66.574 5.590 0.801 0.701 502.700 1157.765 1156.868
L365 83.086 5.224 4.50 66.574 5.586 0.801 0.702 498.000 1156.868 1155.979
L366 83.109 5.226 4.50 66.574 5.492 0.801 0.726 834.200 1155.980 1154.490
L367 83.123 5.226 4.50 69.644 5.632 0.838 0.726 950.900 1154.490 1152.791
L378 83.142 5.228 4.50 69.644 5.632 0.838 0.726 925.300 1152.791 1151.137
L379 83.118 5.226 4.50 69.644 5.631 0.838 0.726 367.200 1151.137 1150.481
L380 83.102 5.225 4.50 69.644 5.631 0.838 0.726 286.700 1150.481 1149.969
L381 83.136 5.227 4.50 69.644 5.632 0.838 0.726 609.300 1149.969 1148.880
L382 83.120 5.226 4.50 69.644 5.631 0.838 0.726 569.800 1148.880 1147.862
L383 83.123 5.226 4.50 69.644 5.631 0.838 0.726 638.600 1147.862 1146.721
L384 83.111 5.226 4.50 69.644 5.629 0.838 0.727 344.300 1146.721 1146.106
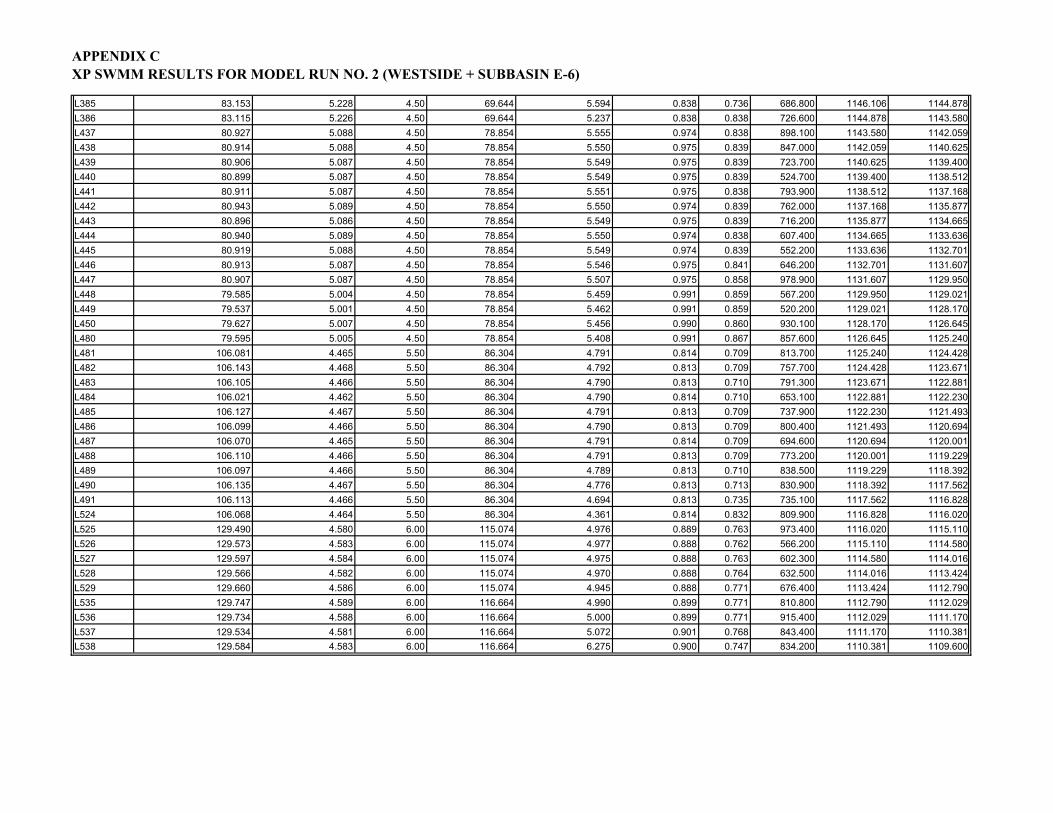
APPENDIX C
XP SWMM RESULTS FOR MODEL RUN NO. 2 (WESTSIDE + SUBBASIN E-6)
L385 83.153 5.228 4.50 69.644 5.594 0.838 0.736 686.800 1146.106 1144.878
L386 83.115 5.226 4.50 69.644 5.237 0.838 0.838 726.600 1144.878 1143.580
L437 80.927 5.088 4.50 78.854 5.555 0.974 0.838 898.100 1143.580 1142.059
L438 80.914 5.088 4.50 78.854 5.550 0.975 0.839 847.000 1142.059 1140.625
L439 80.906 5.087 4.50 78.854 5.549 0.975 0.839 723.700 1140.625 1139.400
L440 80.899 5.087 4.50 78.854 5.549 0.975 0.839 524.700 1139.400 1138.512
L441 80.911 5.087 4.50 78.854 5.551 0.975 0.838 793.900 1138.512 1137.168
L442 80.943 5.089 4.50 78.854 5.550 0.974 0.839 762.000 1137.168 1135.877
L443 80.896 5.086 4.50 78.854 5.549 0.975 0.839 716.200 1135.877 1134.665
L444 80.940 5.089 4.50 78.854 5.550 0.974 0.838 607.400 1134.665 1133.636
L445 80.919 5.088 4.50 78.854 5.549 0.974 0.839 552.200 1133.636 1132.701
L446 80.913 5.087 4.50 78.854 5.546 0.975 0.841 646.200 1132.701 1131.607
L447 80.907 5.087 4.50 78.854 5.507 0.975 0.858 978.900 1131.607 1129.950
L448 79.585 5.004 4.50 78.854 5.459 0.991 0.859 567.200 1129.950 1129.021
L449 79.537 5.001 4.50 78.854 5.462 0.991 0.859 520.200 1129.021 1128.170
L450 79.627 5.007 4.50 78.854 5.456 0.990 0.860 930.100 1128.170 1126.645
L480 79.595 5.005 4.50 78.854 5.408 0.991 0.867 857.600 1126.645 1125.240
L481 106.081 4.465 5.50 86.304 4.791 0.814 0.709 813.700 1125.240 1124.428
L482 106.143 4.468 5.50 86.304 4.792 0.813 0.709 757.700 1124.428 1123.671
L483 106.105 4.466 5.50 86.304 4.790 0.813 0.710 791.300 1123.671 1122.881
L484 106.021 4.462 5.50 86.304 4.790 0.814 0.710 653.100 1122.881 1122.230
L485 106.127 4.467 5.50 86.304 4.791 0.813 0.709 737.900 1122.230 1121.493
L486 106.099 4.466 5.50 86.304 4.790 0.813 0.709 800.400 1121.493 1120.694
L487 106.070 4.465 5.50 86.304 4.791 0.814 0.709 694.600 1120.694 1120.001
L488 106.110 4.466 5.50 86.304 4.791 0.813 0.709 773.200 1120.001 1119.229
L489 106.097 4.466 5.50 86.304 4.789 0.813 0.710 838.500 1119.229 1118.392
L490 106.135 4.467 5.50 86.304 4.776 0.813 0.713 830.900 1118.392 1117.562
L491 106.113 4.466 5.50 86.304 4.694 0.813 0.735 735.100 1117.562 1116.828
L524 106.068 4.464 5.50 86.304 4.361 0.814 0.832 809.900 1116.828 1116.020
L525 129.490 4.580 6.00 115.074 4.976 0.889 0.763 973.400 1116.020 1115.110
L526 129.573 4.583 6.00 115.074 4.977 0.888 0.762 566.200 1115.110 1114.580
L527 129.597 4.584 6.00 115.074 4.975 0.888 0.763 602.300 1114.580 1114.016
L528 129.566 4.582 6.00 115.074 4.970 0.888 0.764 632.500 1114.016 1113.424
L529 129.660 4.586 6.00 115.074 4.945 0.888 0.771 676.400 1113.424 1112.790
L535 129.747 4.589 6.00 116.664 4.990 0.899 0.771 810.800 1112.790 1112.029
L536 129.734 4.588 6.00 116.664 5.000 0.899 0.771 915.400 1112.029 1111.170
L537 129.534 4.581 6.00 116.664 5.072 0.901 0.768 843.400 1111.170 1110.381
L538 129.584 4.583 6.00 116.664 6.275 0.900 0.747 834.200 1110.381 1109.600

APPENDIX D
Model Run No. 2 Estimated Cost Data
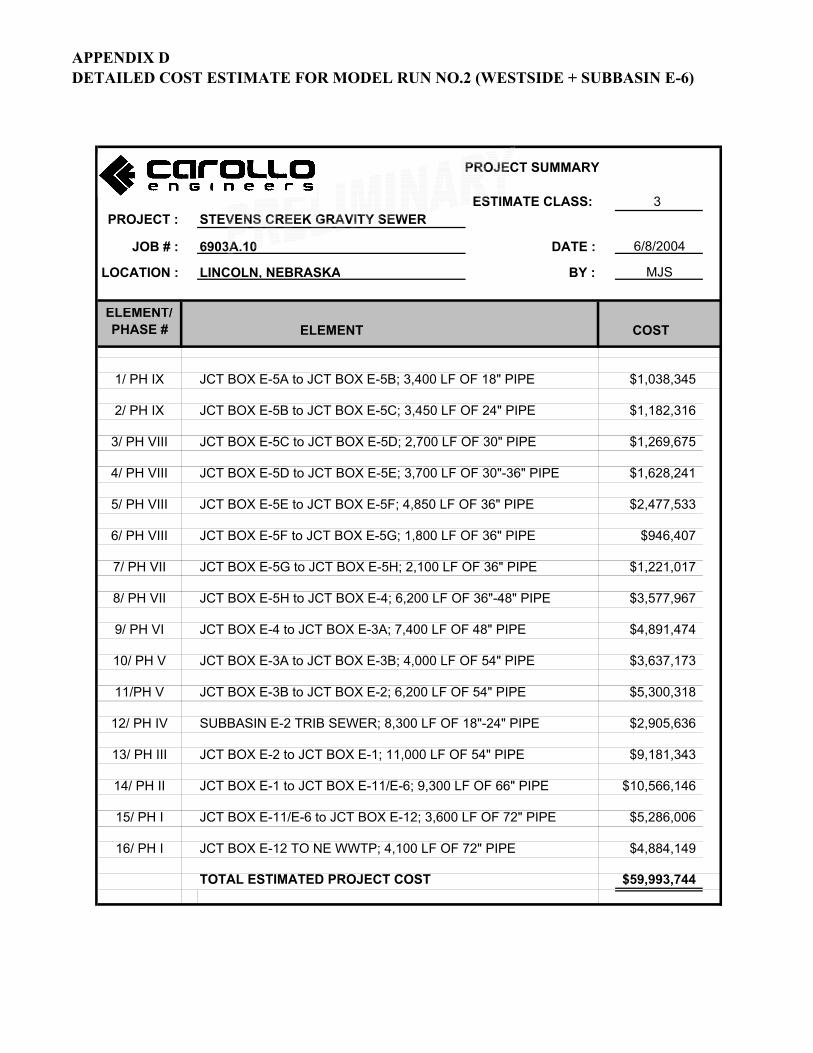
APPENDIX D
DETAILED COST ESTIMATE FOR MODEL RUN NO.2 (WESTSIDE + SUBBASIN E-6)
PROJECT SUMMARY
ESTIMATE CLASS: 3
PROJECT : STEVENS CREEK GRAVITY SEWER
JOB # : 6903A.10 DATE : 6/8/2004
LOCATION : LINCOLN, NEBRASKA BY : MJS
ELEMENT/
PHASE # ELEMENT COST
1/ PH IX JCT BOX E-5A to JCT BOX E-5B; 3,400 LF OF 18" PIPE $1,038,345
2/ PH IX JCT BOX E-5B to JCT BOX E-5C; 3,450 LF OF 24" PIPE $1,182,316
3/ PH VIII JCT BOX E-5C to JCT BOX E-5D; 2,700 LF OF 30" PIPE $1,269,675
4/ PH VIII JCT BOX E-5D to JCT BOX E-5E; 3,700 LF OF 30"-36" PIPE $1,628,241
5/ PH VIII JCT BOX E-5E to JCT BOX E-5F; 4,850 LF OF 36" PIPE $2,477,533
6/ PH VIII JCT BOX E-5F to JCT BOX E-5G; 1,800 LF OF 36" PIPE $946,407
7/ PH VII JCT BOX E-5G to JCT BOX E-5H; 2,100 LF OF 36" PIPE $1,221,017
8/ PH VII JCT BOX E-5H to JCT BOX E-4; 6,200 LF OF 36"-48" PIPE $3,577,967
9/ PH VI JCT BOX E-4 to JCT BOX E-3A; 7,400 LF OF 48" PIPE $4,891,474
10/ PH V JCT BOX E-3A to JCT BOX E-3B; 4,000 LF OF 54" PIPE $3,637,173
11/PH V JCT BOX E-3B to JCT BOX E-2; 6,200 LF OF 54" PIPE $5,300,318
12/ PH IV SUBBASIN E-2 TRIB SEWER; 8,300 LF OF 18"-24" PIPE $2,905,636
13/ PH III JCT BOX E-2 to JCT BOX E-1; 11,000 LF OF 54" PIPE $9,181,343
14/ PH II JCT BOX E-1 to JCT BOX E-11/E-6; 9,300 LF OF 66" PIPE $10,566,146
15/ PH I JCT BOX E-11/E-6 to JCT BOX E-12; 3,600 LF OF 72" PIPE $5,286,006
16/ PH I JCT BOX E-12 TO NE WWTP; 4,100 LF OF 72" PIPE $4,884,149
TOTAL ESTIMATED PROJECT COST $59,993,744

APPENDIX E
Model Run No. 3 Output
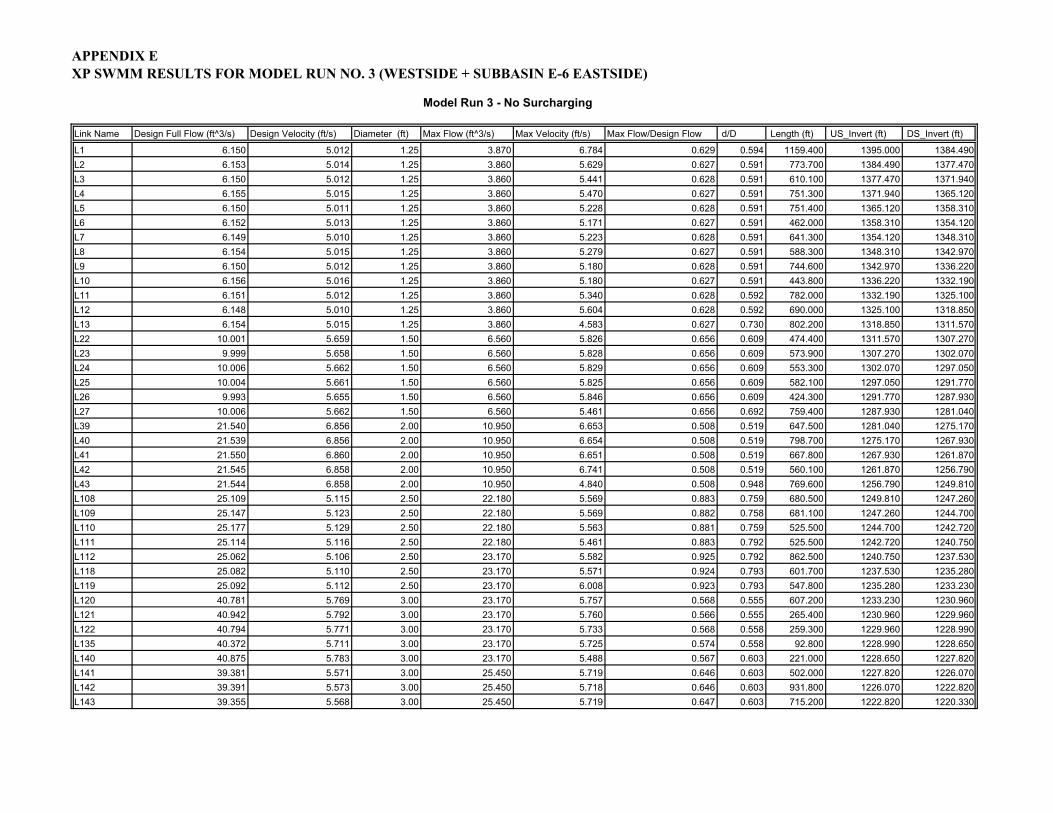
APPENDIX E
XP SWMM RESULTS FOR MODEL RUN NO. 3 (WESTSIDE + SUBBASIN E-6 EASTSIDE)
Model Run 3 - No Surcharging
Link Name Design Full Flow (ft^3/s) Design Velocity (ft/s) Diameter (ft) Max Flow (ft^3/s) Max Velocity (ft/s) Max Flow/Design Flow d/D Length (ft) US_Invert (ft) DS_Invert (ft)
L1 6.150 5.012 1.25 3.870 6.784 0.629 0.594 1159.400 1395.000 1384.490
L2 6.153 5.014 1.25 3.860 5.629 0.627 0.591 773.700 1384.490 1377.470
L3 6.150 5.012 1.25 3.860 5.441 0.628 0.591 610.100 1377.470 1371.940
L4 6.155 5.015 1.25 3.860 5.470 0.627 0.591 751.300 1371.940 1365.120
L5 6.150 5.011 1.25 3.860 5.228 0.628 0.591 751.400 1365.120 1358.310
L6 6.152 5.013 1.25 3.860 5.171 0.627 0.591 462.000 1358.310 1354.120
L7 6.149 5.010 1.25 3.860 5.223 0.628 0.591 641.300 1354.120 1348.310
L8 6.154 5.015 1.25 3.860 5.279 0.627 0.591 588.300 1348.310 1342.970
L9 6.150 5.012 1.25 3.860 5.180 0.628 0.591 744.600 1342.970 1336.220
L10 6.156 5.016 1.25 3.860 5.180 0.627 0.591 443.800 1336.220 1332.190
L11 6.151 5.012 1.25 3.860 5.340 0.628 0.592 782.000 1332.190 1325.100
L12 6.148 5.010 1.25 3.860 5.604 0.628 0.592 690.000 1325.100 1318.850
L13 6.154 5.015 1.25 3.860 4.583 0.627 0.730 802.200 1318.850 1311.570
L22 10.001 5.659 1.50 6.560 5.826 0.656 0.609 474.400 1311.570 1307.270
L23 9.999 5.658 1.50 6.560 5.828 0.656 0.609 573.900 1307.270 1302.070
L24 10.006 5.662 1.50 6.560 5.829 0.656 0.609 553.300 1302.070 1297.050
L25 10.004 5.661 1.50 6.560 5.825 0.656 0.609 582.100 1297.050 1291.770
L26 9.993 5.655 1.50 6.560 5.846 0.656 0.609 424.300 1291.770 1287.930
L27 10.006 5.662 1.50 6.560 5.461 0.656 0.692 759.400 1287.930 1281.040
L39 21.540 6.856 2.00 10.950 6.653 0.508 0.519 647.500 1281.040 1275.170
L40 21.539 6.856 2.00 10.950 6.654 0.508 0.519 798.700 1275.170 1267.930
L41 21.550 6.860 2.00 10.950 6.651 0.508 0.519 667.800 1267.930 1261.870
L42 21.545 6.858 2.00 10.950 6.741 0.508 0.519 560.100 1261.870 1256.790
L43 21.544 6.858 2.00 10.950 4.840 0.508 0.948 769.600 1256.790 1249.810
L108 25.109 5.115 2.50 22.180 5.569 0.883 0.759 680.500 1249.810 1247.260
L109 25.147 5.123 2.50 22.180 5.569 0.882 0.758 681.100 1247.260 1244.700
L110 25.177 5.129 2.50 22.180 5.563 0.881 0.759 525.500 1244.700 1242.720
L111 25.114 5.116 2.50 22.180 5.461 0.883 0.792 525.500 1242.720 1240.750
L112 25.062 5.106 2.50 23.170 5.582 0.925 0.792 862.500 1240.750 1237.530
L118 25.082 5.110 2.50 23.170 5.571 0.924 0.793 601.700 1237.530 1235.280
L119 25.092 5.112 2.50 23.170 6.008 0.923 0.793 547.800 1235.280 1233.230
L120 40.781 5.769 3.00 23.170 5.757 0.568 0.555 607.200 1233.230 1230.960
L121 40.942 5.792 3.00 23.170 5.760 0.566 0.555 265.400 1230.960 1229.960
L122 40.794 5.771 3.00 23.170 5.733 0.568 0.558 259.300 1229.960 1228.990
L135 40.372 5.711 3.00 23.170 5.725 0.574 0.558 92.800 1228.990 1228.650
L140 40.875 5.783 3.00 23.170 5.488 0.567 0.603 221.000 1228.650 1227.820
L141 39.381 5.571 3.00 25.450 5.719 0.646 0.603 502.000 1227.820 1226.070
L142 39.391 5.573 3.00 25.450 5.718 0.646 0.603 931.800 1226.070 1222.820
L143 39.355 5.568 3.00 25.450 5.719 0.647 0.603 715.200 1222.820 1220.330
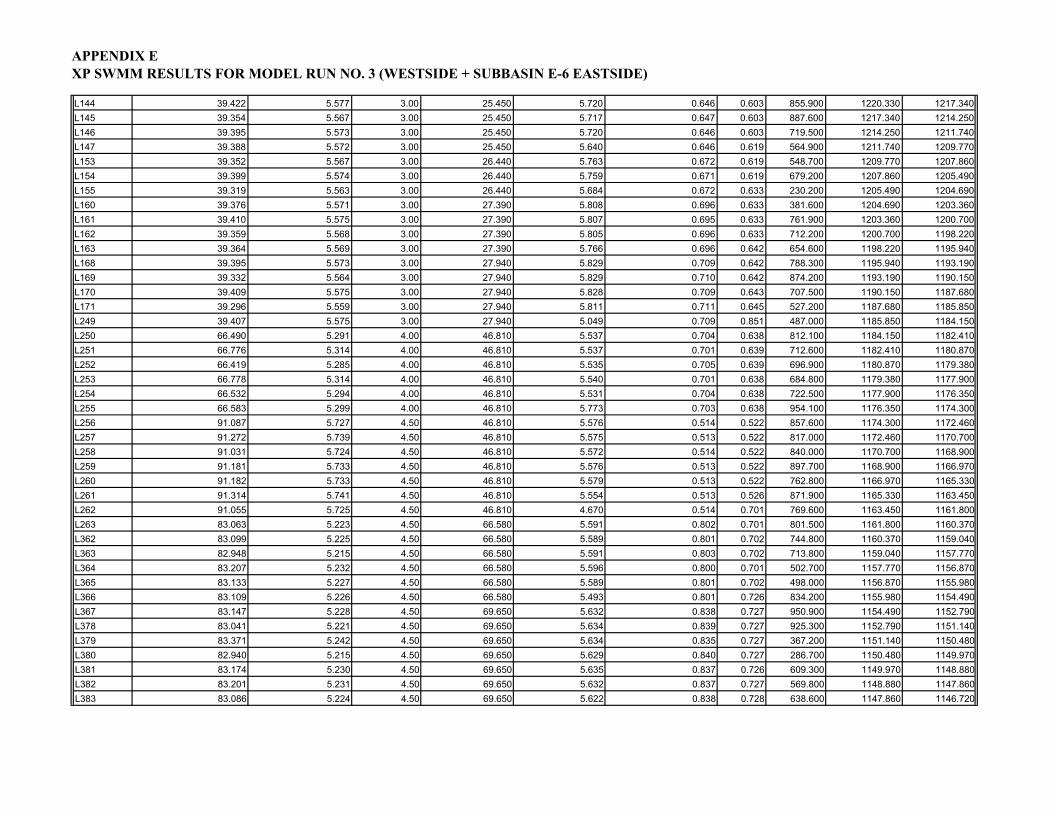
APPENDIX E
XP SWMM RESULTS FOR MODEL RUN NO. 3 (WESTSIDE + SUBBASIN E-6 EASTSIDE)
L144 39.422 5.577 3.00 25.450 5.720 0.646 0.603 855.900 1220.330 1217.340
L145 39.354 5.567 3.00 25.450 5.717 0.647 0.603 887.600 1217.340 1214.250
L146 39.395 5.573 3.00 25.450 5.720 0.646 0.603 719.500 1214.250 1211.740
L147 39.388 5.572 3.00 25.450 5.640 0.646 0.619 564.900 1211.740 1209.770
L153 39.352 5.567 3.00 26.440 5.763 0.672 0.619 548.700 1209.770 1207.860
L154 39.399 5.574 3.00 26.440 5.759 0.671 0.619 679.200 1207.860 1205.490
L155 39.319 5.563 3.00 26.440 5.684 0.672 0.633 230.200 1205.490 1204.690
L160 39.376 5.571 3.00 27.390 5.808 0.696 0.633 381.600 1204.690 1203.360
L161 39.410 5.575 3.00 27.390 5.807 0.695 0.633 761.900 1203.360 1200.700
L162 39.359 5.568 3.00 27.390 5.805 0.696 0.633 712.200 1200.700 1198.220
L163 39.364 5.569 3.00 27.390 5.766 0.696 0.642 654.600 1198.220 1195.940
L168 39.395 5.573 3.00 27.940 5.829 0.709 0.642 788.300 1195.940 1193.190
L169 39.332 5.564 3.00 27.940 5.829 0.710 0.642 874.200 1193.190 1190.150
L170 39.409 5.575 3.00 27.940 5.828 0.709 0.643 707.500 1190.150 1187.680
L171 39.296 5.559 3.00 27.940 5.811 0.711 0.645 527.200 1187.680 1185.850
L249 39.407 5.575 3.00 27.940 5.049 0.709 0.851 487.000 1185.850 1184.150
L250 66.490 5.291 4.00 46.810 5.537 0.704 0.638 812.100 1184.150 1182.410
L251 66.776 5.314 4.00 46.810 5.537 0.701 0.639 712.600 1182.410 1180.870
L252 66.419 5.285 4.00 46.810 5.535 0.705 0.639 696.900 1180.870 1179.380
L253 66.778 5.314 4.00 46.810 5.540 0.701 0.638 684.800 1179.380 1177.900
L254 66.532 5.294 4.00 46.810 5.531 0.704 0.638 722.500 1177.900 1176.350
L255 66.583 5.299 4.00 46.810 5.773 0.703 0.638 954.100 1176.350 1174.300
L256 91.087 5.727 4.50 46.810 5.576 0.514 0.522 857.600 1174.300 1172.460
L257 91.272 5.739 4.50 46.810 5.575 0.513 0.522 817.000 1172.460 1170.700
L258 91.031 5.724 4.50 46.810 5.572 0.514 0.522 840.000 1170.700 1168.900
L259 91.181 5.733 4.50 46.810 5.576 0.513 0.522 897.700 1168.900 1166.970
L260 91.182 5.733 4.50 46.810 5.579 0.513 0.522 762.800 1166.970 1165.330
L261 91.314 5.741 4.50 46.810 5.554 0.513 0.526 871.900 1165.330 1163.450
L262 91.055 5.725 4.50 46.810 4.670 0.514 0.701 769.600 1163.450 1161.800
L263 83.063 5.223 4.50 66.580 5.591 0.802 0.701 801.500 1161.800 1160.370
L362 83.099 5.225 4.50 66.580 5.589 0.801 0.702 744.800 1160.370 1159.040
L363 82.948 5.215 4.50 66.580 5.591 0.803 0.702 713.800 1159.040 1157.770
L364 83.207 5.232 4.50 66.580 5.596 0.800 0.701 502.700 1157.770 1156.870
L365 83.133 5.227 4.50 66.580 5.589 0.801 0.702 498.000 1156.870 1155.980
L366 83.109 5.226 4.50 66.580 5.493 0.801 0.726 834.200 1155.980 1154.490
L367 83.147 5.228 4.50 69.650 5.632 0.838 0.727 950.900 1154.490 1152.790
L378 83.041 5.221 4.50 69.650 5.634 0.839 0.727 925.300 1152.790 1151.140
L379 83.371 5.242 4.50 69.650 5.634 0.835 0.727 367.200 1151.140 1150.480
L380 82.940 5.215 4.50 69.650 5.629 0.840 0.727 286.700 1150.480 1149.970
L381 83.174 5.230 4.50 69.650 5.635 0.837 0.726 609.300 1149.970 1148.880
L382 83.201 5.231 4.50 69.650 5.632 0.837 0.727 569.800 1148.880 1147.860
L383 83.086 5.224 4.50 69.650 5.622 0.838 0.728 638.600 1147.860 1146.720
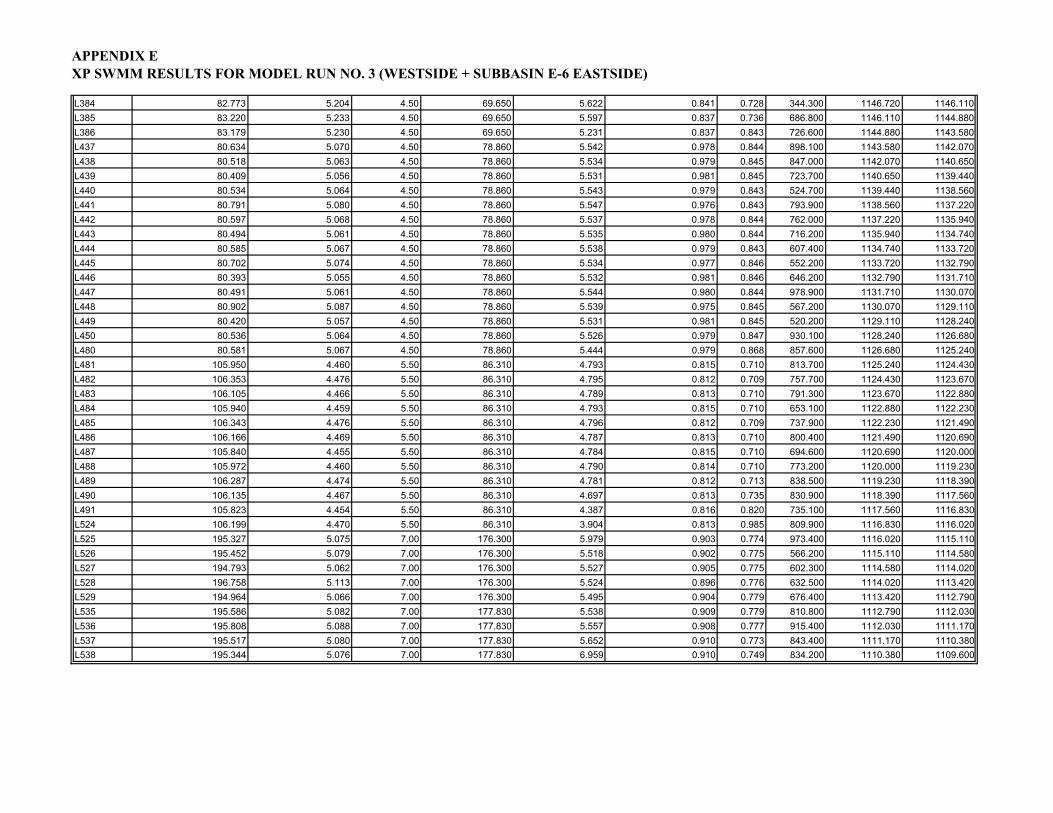
APPENDIX E
XP SWMM RESULTS FOR MODEL RUN NO. 3 (WESTSIDE + SUBBASIN E-6 EASTSIDE)
L384 82.773 5.204 4.50 69.650 5.622 0.841 0.728 344.300 1146.720 1146.110
L385 83.220 5.233 4.50 69.650 5.597 0.837 0.736 686.800 1146.110 1144.880
L386 83.179 5.230 4.50 69.650 5.231 0.837 0.843 726.600 1144.880 1143.580
L437 80.634 5.070 4.50 78.860 5.542 0.978 0.844 898.100 1143.580 1142.070
L438 80.518 5.063 4.50 78.860 5.534 0.979 0.845 847.000 1142.070 1140.650
L439 80.409 5.056 4.50 78.860 5.531 0.981 0.845 723.700 1140.650 1139.440
L440 80.534 5.064 4.50 78.860 5.543 0.979 0.843 524.700 1139.440 1138.560
L441 80.791 5.080 4.50 78.860 5.547 0.976 0.843 793.900 1138.560 1137.220
L442 80.597 5.068 4.50 78.860 5.537 0.978 0.844 762.000 1137.220 1135.940
L443 80.494 5.061 4.50 78.860 5.535 0.980 0.844 716.200 1135.940 1134.740
L444 80.585 5.067 4.50 78.860 5.538 0.979 0.843 607.400 1134.740 1133.720
L445 80.702 5.074 4.50 78.860 5.534 0.977 0.846 552.200 1133.720 1132.790
L446 80.393 5.055 4.50 78.860 5.532 0.981 0.846 646.200 1132.790 1131.710
L447 80.491 5.061 4.50 78.860 5.544 0.980 0.844 978.900 1131.710 1130.070
L448 80.902 5.087 4.50 78.860 5.539 0.975 0.845 567.200 1130.070 1129.110
L449 80.420 5.057 4.50 78.860 5.531 0.981 0.845 520.200 1129.110 1128.240
L450 80.536 5.064 4.50 78.860 5.526 0.979 0.847 930.100 1128.240 1126.680
L480 80.581 5.067 4.50 78.860 5.444 0.979 0.868 857.600 1126.680 1125.240
L481 105.950 4.460 5.50 86.310 4.793 0.815 0.710 813.700 1125.240 1124.430
L482 106.353 4.476 5.50 86.310 4.795 0.812 0.709 757.700 1124.430 1123.670
L483 106.105 4.466 5.50 86.310 4.789 0.813 0.710 791.300 1123.670 1122.880
L484 105.940 4.459 5.50 86.310 4.793 0.815 0.710 653.100 1122.880 1122.230
L485 106.343 4.476 5.50 86.310 4.796 0.812 0.709 737.900 1122.230 1121.490
L486 106.166 4.469 5.50 86.310 4.787 0.813 0.710 800.400 1121.490 1120.690
L487 105.840 4.455 5.50 86.310 4.784 0.815 0.710 694.600 1120.690 1120.000
L488 105.972 4.460 5.50 86.310 4.790 0.814 0.710 773.200 1120.000 1119.230
L489 106.287 4.474 5.50 86.310 4.781 0.812 0.713 838.500 1119.230 1118.390
L490 106.135 4.467 5.50 86.310 4.697 0.813 0.735 830.900 1118.390 1117.560
L491 105.823 4.454 5.50 86.310 4.387 0.816 0.820 735.100 1117.560 1116.830
L524 106.199 4.470 5.50 86.310 3.904 0.813 0.985 809.900 1116.830 1116.020
L525 195.327 5.075 7.00 176.300 5.979 0.903 0.774 973.400 1116.020 1115.110
L526 195.452 5.079 7.00 176.300 5.518 0.902 0.775 566.200 1115.110 1114.580
L527 194.793 5.062 7.00 176.300 5.527 0.905 0.775 602.300 1114.580 1114.020
L528 196.758 5.113 7.00 176.300 5.524 0.896 0.776 632.500 1114.020 1113.420
L529 194.964 5.066 7.00 176.300 5.495 0.904 0.779 676.400 1113.420 1112.790
L535 195.586 5.082 7.00 177.830 5.538 0.909 0.779 810.800 1112.790 1112.030
L536 195.808 5.088 7.00 177.830 5.557 0.908 0.777 915.400 1112.030 1111.170
L537 195.517 5.080 7.00 177.830 5.652 0.910 0.773 843.400 1111.170 1110.380
L538 195.344 5.076 7.00 177.830 6.959 0.910 0.749 834.200 1110.380 1109.600

APPENDIX F
Model Run No. 3 Estimated Cost Data

DETAILED COST ESTIMATE
CLASS:PROJECT : STEVENS CREEK BASIN TRUNK SEWER LOCATION FACTOR: 0.85
JOB # : 6903A.10 DATE :
LOCATION : LINCOLN, NEBRASKA BY : MJS
ELEMENT : 03 - SEGMENT 3 - E-5C:E-5D REVIEWED BY:
SPEC. NO. DESCRIPTION QUAN UNIT MATERIAL INSTALL UNIT COST SUBTOTAL TOTAL
02000 SITEWORKMANHOLES> 36" diameter 0 LS $12,000 $0.00</= 36" diameter 3 LS $3,500 $10,500.00
TUNNELINGfor 30-INCH PIPE 155 LF $450 $69,750.00
$80,250
03000 CONCRETE
Junction Box 1 LS $75,000 $75,000.00
$75,000
15000 MECHANICAL
HOBAS PIPE30-INCH 2,700 LF $70.00 $129.50 $200 $538,650.00Permanent Easement 108,000 sq ft $0.50 $0.50 $54,000.00Construction Easement 432,000 sq ft $0.05 $0.05 $21,600.00
$614,250
TOTAL DIRECT COST $769,500CONTINGENCY 25.00% $192,375
SUBTOTAL $961,875GENERAL CONDITIONS 10.00% $96,188
SUBTOTAL $1,058,063TOTAL ESTIMATED CONSTRUCTION COST $1,058,063ENGINEERING & LEGAL FEES 20.00% $211,613TOTAL ESTIMATED PROJECT COST $1,269,675
SUBTOTAL CONCRETE
SUBTOTAL SITEWORK
SUBTOTAL MECHANICAL

DETAILED COST ESTIMATE
CLASS:PROJECT : STEVENS CREEK BASIN TRUNK SEWER LOCATION FACTOR: 0.85
JOB # : 6903A.10 DATE :
LOCATION : LINCOLN, NEBRASKA BY : MJS
ELEMENT : 04 - SEGMENT 4 - E-5D:E-5E REVIEWED BY:
SPEC. NO. DESCRIPTION QUAN UNIT MATERIAL INSTALL UNIT COST SUBTOTAL TOTAL
02000 SITEWORKMANHOLES> 36" diameter 0 LS $12,000 $0.00</= 36" diameter 7 LS $3,500 $24,500.00
TUNNELING
$24,500
03000 CONCRETE
Junction Box 1 LS $75,000 $75,000.00
$75,000
15000 MECHANICAL
HOBAS PIPE30-INCH 3,150 LF $70.00 $129.50 $200 $628,425.0036-INCH 625 LF $86.00 $159.10 $245 $153,187.50Permanent Easement 151,000 sq ft $0.50 $0.50 $75,500.00Construction Easement 604,000 sq ft $0.05 $0.05 $30,200.00
$887,313
TOTAL DIRECT COST $986,813CONTINGENCY 25.00% $246,703
SUBTOTAL $1,233,516GENERAL CONDITIONS 10.00% $123,352
SUBTOTAL $1,356,867TOTAL ESTIMATED CONSTRUCTION COST $1,356,867ENGINEERING & LEGAL FEES 20.00% $271,373
SUBTOTAL CONCRETE
SUBTOTAL MECHANICAL
SUBTOTAL SITEWORK

TOTAL ESTIMATED PROJECT COST $1,628,241

DETAILED COST ESTIMATE
CLASS:PROJECT : STEVENS CREEK BASIN TRUNK SEWER LOCATION FACTOR: 0.85
JOB # : 6903A.10 DATE :
LOCATION : LINCOLN, NEBRASKA BY : MJS
ELEMENT : 05 - SEGMENT 5 - E-5E:E-5F REVIEWED BY:
SPEC. NO. DESCRIPTION QUAN UNIT MATERIAL INSTALL UNIT COST SUBTOTAL TOTAL
02000 SITEWORKMANHOLES> 36" diameter 0 LS $12,000 $0.00</= 36" diameter 6 LS $3,500 $21,000.00
TUNNELINGfor 36-INCH PIPE 150 LF $540 $81,000.00
$102,000
03000 CONCRETE
Junction Box 1 LS $75,000 $75,000.00
$75,000
15000 MECHANICAL
HOBAS PIPE36-INCH 4,850 LF $86.00 $159.10 $245 $1,188,735.00Permanent Easement 194,000 sq ft $0.50 $0.50 $97,000.00Construction Easement 776,000 sq ft $0.05 $0.05 $38,800.00
$1,324,535
TOTAL DIRECT COST $1,501,535CONTINGENCY 25.00% $375,384
SUBTOTAL $1,876,919GENERAL CONDITIONS 10.00% $187,692
SUBTOTAL $2,064,611TOTAL ESTIMATED CONSTRUCTION COST $2,064,611ENGINEERING & LEGAL FEES 20.00% $412,922TOTAL ESTIMATED PROJECT COST $2,477,533
SUBTOTAL CONCRETE
SUBTOTAL MECHANICAL
SUBTOTAL SITEWORK

DETAILED COST ESTIMATE
CLASS:PROJECT : STEVENS CREEK BASIN TRUNK SEWER LOCATION FACTOR: 0.85
JOB # : 6903A.10 DATE :
LOCATION : LINCOLN, NEBRASKA BY : MJS
ELEMENT : 06 - SEGMENT 6 - E-5F:E-5G REVIEWED BY:
SPEC. NO. DESCRIPTION QUAN UNIT MATERIAL INSTALL UNIT COST SUBTOTAL TOTAL
02000 SITEWORKMANHOLES> 36" diameter 0 LS $12,000 $0.00</= 36" diameter 2 LS $3,500 $7,000.00
TUNNELING
$7,000
03000 CONCRETE
Junction Box 1 LS $75,000 $75,000.00
$75,000
15000 MECHANICAL
HOBAS PIPE36-INCH 1,800 LF $86.00 $159.10 $245 $441,180.00Permanent Easement 72,000 sq ft $0.50 $0.50 $36,000.00Construction Easement 288,000 sq ft $0.05 $0.05 $14,400.00
$491,580
TOTAL DIRECT COST $573,580CONTINGENCY 25.00% $143,395
SUBTOTAL $716,975GENERAL CONDITIONS 10.00% $71,698
SUBTOTAL $788,673TOTAL ESTIMATED CONSTRUCTION COST $788,673ENGINEERING & LEGAL FEES 20.00% $157,735TOTAL ESTIMATED PROJECT COST $946,407
SUBTOTAL CONCRETE
SUBTOTAL MECHANICAL
SUBTOTAL SITEWORK

DETAILED COST ESTIMATE
CLASS:PROJECT : STEVENS CREEK BASIN TRUNK SEWER LOCATION FACTOR: 0.85
JOB # : 6903A.10 DATE :
LOCATION : LINCOLN, NEBRASKA BY : MJS
ELEMENT : 07 - SEGMENT 7 - E-5G:E-5H REVIEWED BY:
SPEC. NO. DESCRIPTION QUAN UNIT MATERIAL INSTALL UNIT COST SUBTOTAL TOTAL
02000 SITEWORKMANHOLES> 36" diameter 0 LS $12,000 $0.00</= 36" diameter 3 LS $3,500 $10,500.00
TUNNELINGfor 36-INCH PIPE 150 LF $540 $81,000.00
$91,500
03000 CONCRETE
Junction Box 1 LS $75,000 $75,000.00
$75,000
15000 MECHANICAL
HOBAS PIPE36-INCH 2,100 LF $86.00 $159.10 $245 $514,710.00Permanent Easement 84,000 sq ft $0.50 $0.50 $42,000.00Construction Easement 336,000 sq ft $0.05 $0.05 $16,800.00
$573,510
TOTAL DIRECT COST $740,010CONTINGENCY 25.00% $185,003
SUBTOTAL $925,013GENERAL CONDITIONS 10.00% $92,501
SUBTOTAL $1,017,514TOTAL ESTIMATED CONSTRUCTION COST $1,017,514ENGINEERING & LEGAL FEES 20.00% $203,503TOTAL ESTIMATED PROJECT COST $1,221,017
SUBTOTAL CONCRETE
SUBTOTAL MECHANICAL
SUBTOTAL SITEWORK
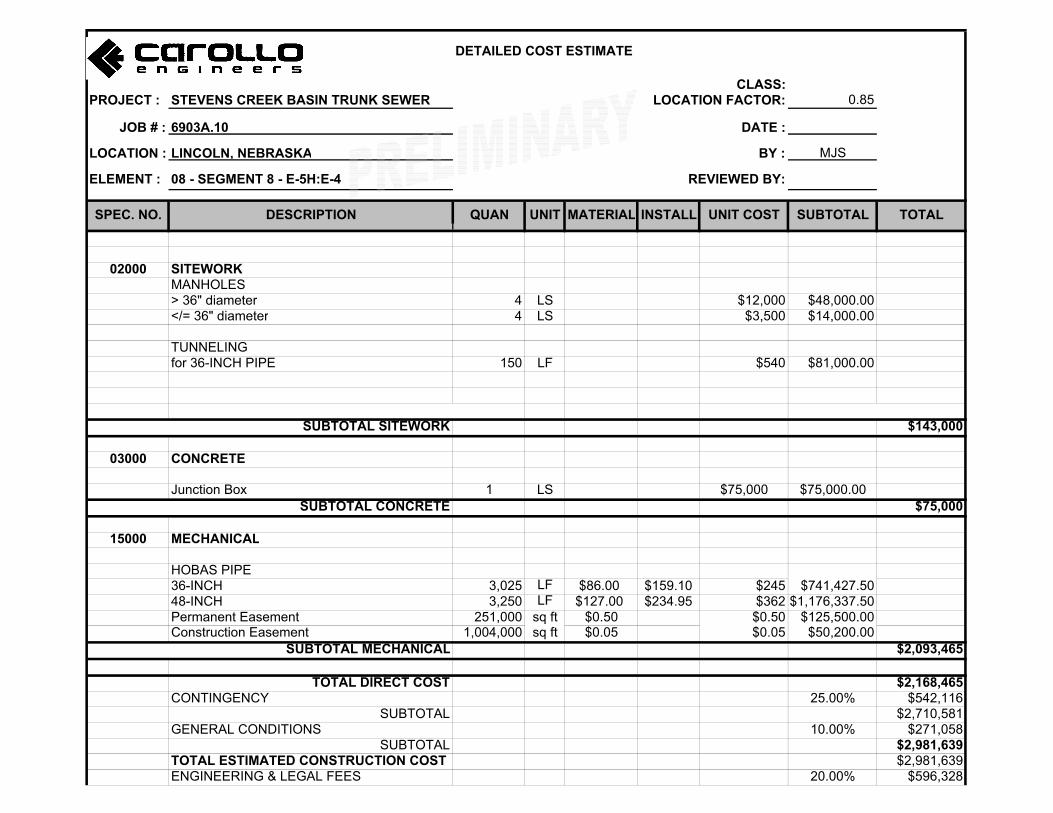
DETAILED COST ESTIMATE
CLASS:PROJECT : STEVENS CREEK BASIN TRUNK SEWER LOCATION FACTOR: 0.85
JOB # : 6903A.10 DATE :
LOCATION : LINCOLN, NEBRASKA BY : MJS
ELEMENT : 08 - SEGMENT 8 - E-5H:E-4 REVIEWED BY:
SPEC. NO. DESCRIPTION QUAN UNIT MATERIAL INSTALL UNIT COST SUBTOTAL TOTAL
02000 SITEWORKMANHOLES> 36" diameter 4 LS $12,000 $48,000.00</= 36" diameter 4 LS $3,500 $14,000.00
TUNNELINGfor 36-INCH PIPE 150 LF $540 $81,000.00
$143,000
03000 CONCRETE
Junction Box 1 LS $75,000 $75,000.00
$75,000
15000 MECHANICAL
HOBAS PIPE36-INCH 3,025 LF $86.00 $159.10 $245 $741,427.5048-INCH 3,250 LF $127.00 $234.95 $362 $1,176,337.50Permanent Easement 251,000 sq ft $0.50 $0.50 $125,500.00Construction Easement 1,004,000 sq ft $0.05 $0.05 $50,200.00
$2,093,465
TOTAL DIRECT COST $2,168,465CONTINGENCY 25.00% $542,116
SUBTOTAL $2,710,581GENERAL CONDITIONS 10.00% $271,058
SUBTOTAL $2,981,639TOTAL ESTIMATED CONSTRUCTION COST $2,981,639ENGINEERING & LEGAL FEES 20.00% $596,328
SUBTOTAL CONCRETE
SUBTOTAL SITEWORK
SUBTOTAL MECHANICAL
TOTAL ESTIMATED PROJECT COST $3,577,967

DETAILED COST ESTIMATE
CLASS:PROJECT : STEVENS CREEK BASIN TRUNK SEWER LOCATION FACTOR: 0.85
JOB # : 6903A.10 DATE :
LOCATION : LINCOLN, NEBRASKA BY : MJS
ELEMENT : 09 - SEGMENT 9 - E-4:E-3A REVIEWED BY:
SPEC. NO. DESCRIPTION QUAN UNIT MATERIAL INSTALL UNIT COST SUBTOTAL TOTAL
02000 SITEWORKMANHOLES> 36" diameter 8 LS $12,000 $96,000.00</= 36" diameter 0 LS $3,500 $0.00
TUNNELINGfor 48-INCH PIPE 350 LF $720 $252,000.00
$348,000
03000 CONCRETE
Junction Box 1 LS $75,000 $75,000.00
$75,000
15000 MECHANICAL
HOBAS PIPE48-INCH 7,410 LF $127.00 $234.95 $362 $2,682,049.50Permanent Easement 296,400 sq ft $0.50 $0.50 $148,200.00Construction Easement 1,185,600 sq ft $0.05 $0.05 $59,280.00
$2,889,530
TOTAL DIRECT COST $2,964,530CONTINGENCY 25.00% $741,132
SUBTOTAL $3,705,662GENERAL CONDITIONS 10.00% $370,566
SUBTOTAL $4,076,228TOTAL ESTIMATED CONSTRUCTION COST $4,076,228ENGINEERING & LEGAL FEES 20.00% $815,246TOTAL ESTIMATED PROJECT COST $4,891,474
SUBTOTAL CONCRETE
SUBTOTAL SITEWORK
SUBTOTAL MECHANICAL
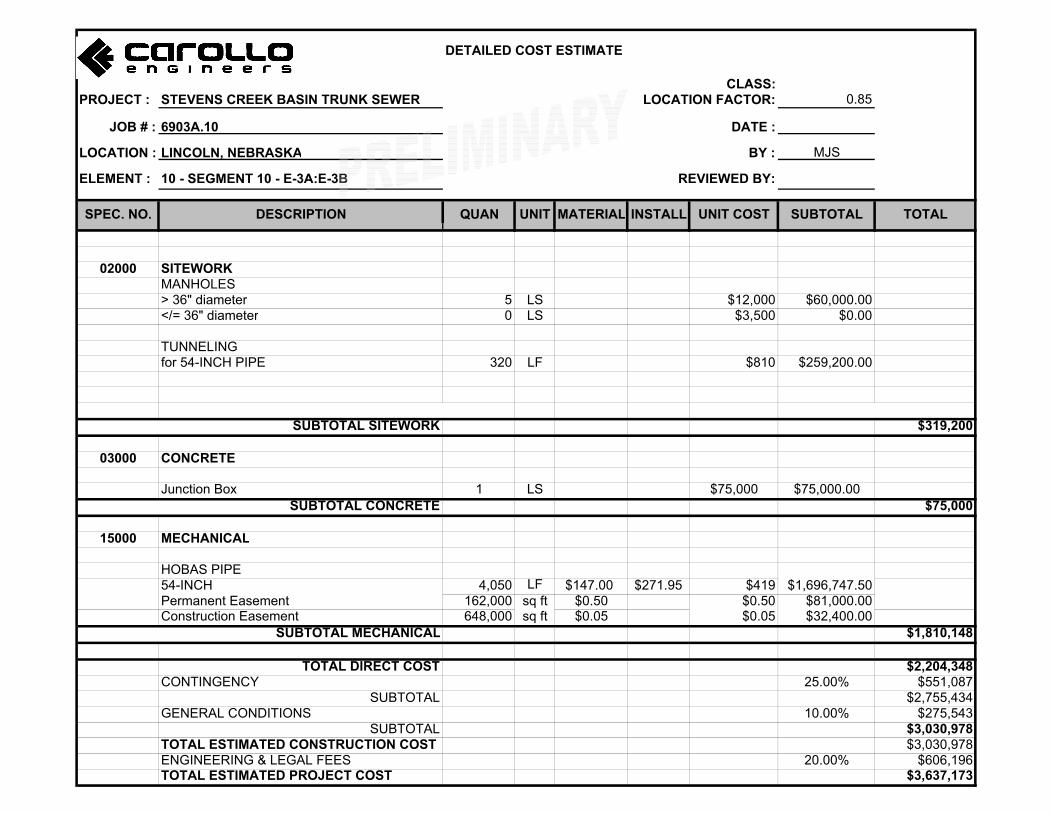
DETAILED COST ESTIMATE
CLASS:PROJECT : STEVENS CREEK BASIN TRUNK SEWER LOCATION FACTOR: 0.85
JOB # : 6903A.10 DATE :
LOCATION : LINCOLN, NEBRASKA BY : MJS
ELEMENT : 10 - SEGMENT 10 - E-3A:E-3B REVIEWED BY:
SPEC. NO. DESCRIPTION QUAN UNIT MATERIAL INSTALL UNIT COST SUBTOTAL TOTAL
02000 SITEWORKMANHOLES> 36" diameter 5 LS $12,000 $60,000.00</= 36" diameter 0 LS $3,500 $0.00
TUNNELINGfor 54-INCH PIPE 320 LF $810 $259,200.00
$319,200
03000 CONCRETE
Junction Box 1 LS $75,000 $75,000.00
$75,000
15000 MECHANICAL
HOBAS PIPE54-INCH 4,050 LF $147.00 $271.95 $419 $1,696,747.50Permanent Easement 162,000 sq ft $0.50 $0.50 $81,000.00Construction Easement 648,000 sq ft $0.05 $0.05 $32,400.00
$1,810,148
TOTAL DIRECT COST $2,204,348CONTINGENCY 25.00% $551,087
SUBTOTAL $2,755,434GENERAL CONDITIONS 10.00% $275,543
SUBTOTAL $3,030,978TOTAL ESTIMATED CONSTRUCTION COST $3,030,978ENGINEERING & LEGAL FEES 20.00% $606,196TOTAL ESTIMATED PROJECT COST $3,637,173
SUBTOTAL CONCRETE
SUBTOTAL SITEWORK
SUBTOTAL MECHANICAL

DETAILED COST ESTIMATE
CLASS:PROJECT : STEVENS CREEK BASIN TRUNK SEWER LOCATION FACTOR: 0.85
JOB # : 6903A.10 DATE :
LOCATION : LINCOLN, NEBRASKA BY : MJS
ELEMENT : 11 - SEGMENT 11 - E-3B:E-2 REVIEWED BY:
SPEC. NO. DESCRIPTION QUAN UNIT MATERIAL INSTALL UNIT COST SUBTOTAL TOTAL
02000 SITEWORKMANHOLES> 36" diameter 9 LS $12,000 $108,000.00</= 36" diameter 0 LS $3,500 $0.00
TUNNELINGfor 54-INCH PIPE 305 LF $810 $247,050.00
$355,050
03000 CONCRETE
Junction Box 1 LS $75,000 $75,000.00
$75,000
15000 MECHANICAL
HOBAS PIPE54-INCH 6,225 LF $147.00 $271.95 $419 $2,607,963.75Permanent Easement 249,000 sq ft $0.50 $0.50 $124,500.00Construction Easement 996,000 sq ft $0.05 $0.05 $49,800.00
$2,782,264
TOTAL DIRECT COST $3,212,314CONTINGENCY 25.00% $803,078
SUBTOTAL $4,015,392GENERAL CONDITIONS 10.00% $401,539
SUBTOTAL $4,416,931TOTAL ESTIMATED CONSTRUCTION COST $4,416,931ENGINEERING & LEGAL FEES 20.00% $883,386TOTAL ESTIMATED PROJECT COST $5,300,318
SUBTOTAL CONCRETE
SUBTOTAL SITEWORK
SUBTOTAL MECHANICAL
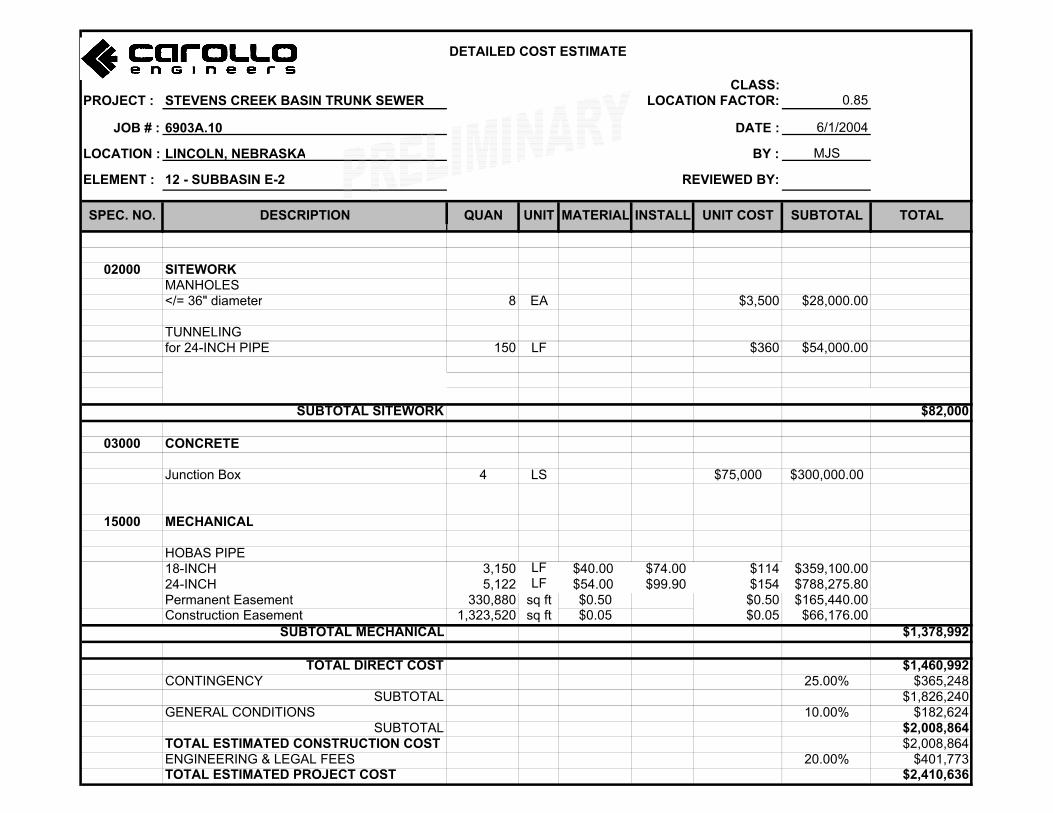
DETAILED COST ESTIMATE
CLASS:PROJECT : STEVENS CREEK BASIN TRUNK SEWER LOCATION FACTOR: 0.85
JOB # : 6903A.10 DATE : 6/1/2004
LOCATION : LINCOLN, NEBRASKA BY : MJS
ELEMENT : 12 - SUBBASIN E-2 REVIEWED BY:
SPEC. NO. DESCRIPTION QUAN UNIT MATERIAL INSTALL UNIT COST SUBTOTAL TOTAL
02000 SITEWORKMANHOLES</= 36" diameter 8 EA $3,500 $28,000.00
TUNNELINGfor 24-INCH PIPE 150 LF $360 $54,000.00
$82,000
03000 CONCRETE
Junction Box 4 LS $75,000 $300,000.00
15000 MECHANICAL
HOBAS PIPE18-INCH 3,150 LF $40.00 $74.00 $114 $359,100.0024-INCH 5,122 LF $54.00 $99.90 $154 $788,275.80Permanent Easement 330,880 sq ft $0.50 $0.50 $165,440.00Construction Easement 1,323,520 sq ft $0.05 $0.05 $66,176.00
$1,378,992
TOTAL DIRECT COST $1,460,992CONTINGENCY 25.00% $365,248
SUBTOTAL $1,826,240GENERAL CONDITIONS 10.00% $182,624
SUBTOTAL $2,008,864TOTAL ESTIMATED CONSTRUCTION COST $2,008,864ENGINEERING & LEGAL FEES 20.00% $401,773TOTAL ESTIMATED PROJECT COST $2,410,636
SUBTOTAL SITEWORK
SUBTOTAL MECHANICAL
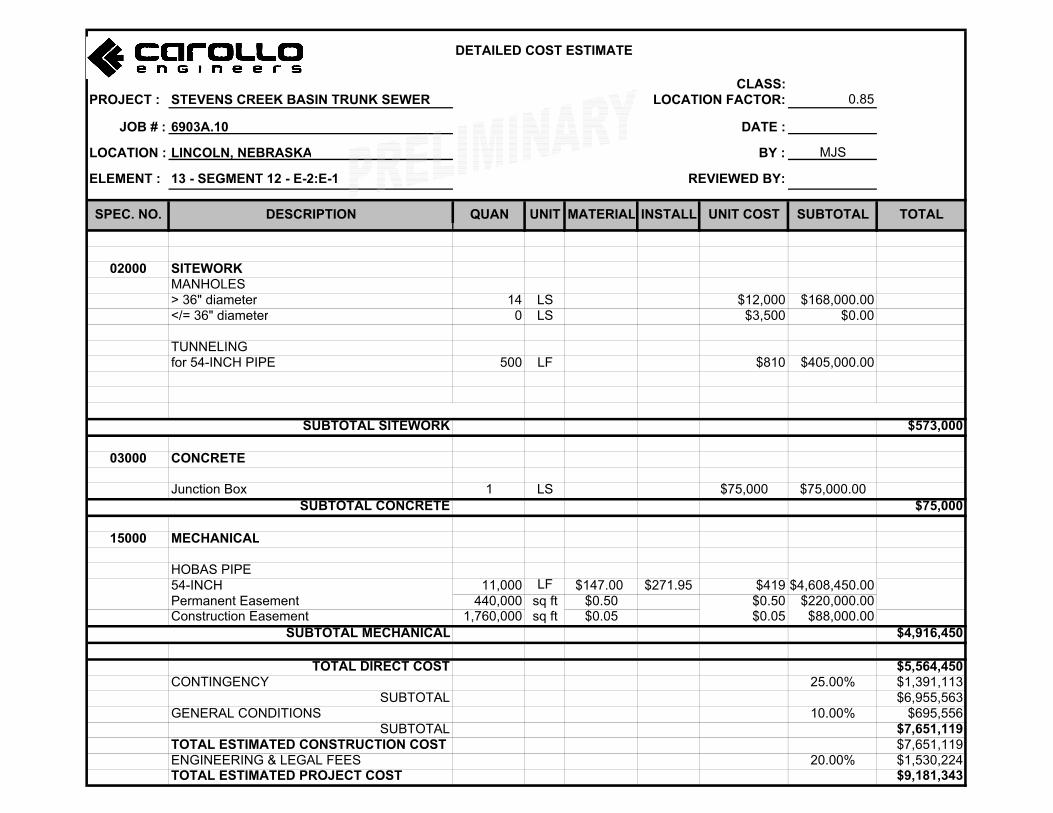
DETAILED COST ESTIMATE
CLASS:PROJECT : STEVENS CREEK BASIN TRUNK SEWER LOCATION FACTOR: 0.85
JOB # : 6903A.10 DATE :
LOCATION : LINCOLN, NEBRASKA BY : MJS
ELEMENT : 13 - SEGMENT 12 - E-2:E-1 REVIEWED BY:
SPEC. NO. DESCRIPTION QUAN UNIT MATERIAL INSTALL UNIT COST SUBTOTAL TOTAL
02000 SITEWORKMANHOLES> 36" diameter 14 LS $12,000 $168,000.00</= 36" diameter 0 LS $3,500 $0.00
TUNNELINGfor 54-INCH PIPE 500 LF $810 $405,000.00
$573,000
03000 CONCRETE
Junction Box 1 LS $75,000 $75,000.00
$75,000
15000 MECHANICAL
HOBAS PIPE54-INCH 11,000 LF $147.00 $271.95 $419 $4,608,450.00Permanent Easement 440,000 sq ft $0.50 $0.50 $220,000.00Construction Easement 1,760,000 sq ft $0.05 $0.05 $88,000.00
$4,916,450
TOTAL DIRECT COST $5,564,450CONTINGENCY 25.00% $1,391,113
SUBTOTAL $6,955,563GENERAL CONDITIONS 10.00% $695,556
SUBTOTAL $7,651,119TOTAL ESTIMATED CONSTRUCTION COST $7,651,119ENGINEERING & LEGAL FEES 20.00% $1,530,224TOTAL ESTIMATED PROJECT COST $9,181,343
SUBTOTAL CONCRETE
SUBTOTAL SITEWORK
SUBTOTAL MECHANICAL

DETAILED COST ESTIMATE
CLASS:PROJECT : STEVENS CREEK BASIN TRUNK SEWER LOCATION FACTOR: 0.85
JOB # : 6903A.10 DATE :
LOCATION : LINCOLN, NEBRASKA BY : MJS
ELEMENT : 14 - SEGMENT 13 - E-1:E-11/E-6 REVIEWED BY:
SPEC. NO. DESCRIPTION QUAN UNIT MATERIAL INSTALL UNIT COST SUBTOTAL TOTAL
02000 SITEWORKMANHOLES> 36" diameter 10 LS $12,000 $120,000.00</= 36" diameter 0 LS $3,500 $0.00
TUNNELINGfor 66-INCH PIPE 520 LF $990 $514,800.00
$634,800
03000 CONCRETE
Junction Box 1 LS $75,000 $75,000.00
$75,000
15000 MECHANICAL
HOBAS PIPE66-INCH 9,300 LF $205.00 $379.25 $584 $5,433,525.00Permanent Easement 372,000 sq ft $0.50 $0.50 $186,000.00Construction Easement 1,488,000 sq ft $0.05 $0.05 $74,400.00
$5,693,925
TOTAL DIRECT COST $6,403,725CONTINGENCY 25.00% $1,600,931
SUBTOTAL $8,004,656GENERAL CONDITIONS 10.00% $800,466
SUBTOTAL $8,805,122TOTAL ESTIMATED CONSTRUCTION COST $8,805,122ENGINEERING & LEGAL FEES 20.00% $1,761,024TOTAL ESTIMATED PROJECT COST $10,566,146
SUBTOTAL CONCRETE
SUBTOTAL SITEWORK
SUBTOTAL MECHANICAL

DETAILED COST ESTIMATE
CLASS:PROJECT : STEVENS CREEK BASIN TRUNK SEWER LOCATION FACTOR: 0.85
JOB # : 6903A.10 DATE :
LOCATION : LINCOLN, NEBRASKA BY : MJS
ELEMENT : 16 - SEGMENT 15 - E-11/E-6:E-12 REVIEWED BY:
SPEC. NO. DESCRIPTION QUAN UNIT MATERIAL INSTALL UNIT COST SUBTOTAL TOTAL
02000 SITEWORKMANHOLES> 36" diameter 4 LS $12,000 $48,000.00</= 36" diameter 0 LS $3,500 $0.00
TUNNELINGfor 84-INCH PIPE 525 LF $1,260 $661,500.00
$709,500
03000 CONCRETE
Junction Box 1 LS $75,000 $75,000.00
$75,000
15000 MECHANICAL
HOBAS PIPE84-INCH 3,600 LF $289.00 $534.65 $824 $2,965,140.00Permanent Easement 144,000 sq ft $0.50 $0.50 $72,000.00Construction Easement 576,000 sq ft $0.05 $0.05 $28,800.00
$3,065,940
TOTAL DIRECT COST $3,850,440CONTINGENCY 25.00% $962,610
SUBTOTAL $4,813,050GENERAL CONDITIONS 10.00% $481,305
SUBTOTAL $5,294,355TOTAL ESTIMATED CONSTRUCTION COST $5,294,355ENGINEERING & LEGAL FEES 20.00% $1,058,871TOTAL ESTIMATED PROJECT COST $6,353,226
SUBTOTAL CONCRETE
SUBTOTAL SITEWORK
SUBTOTAL MECHANICAL
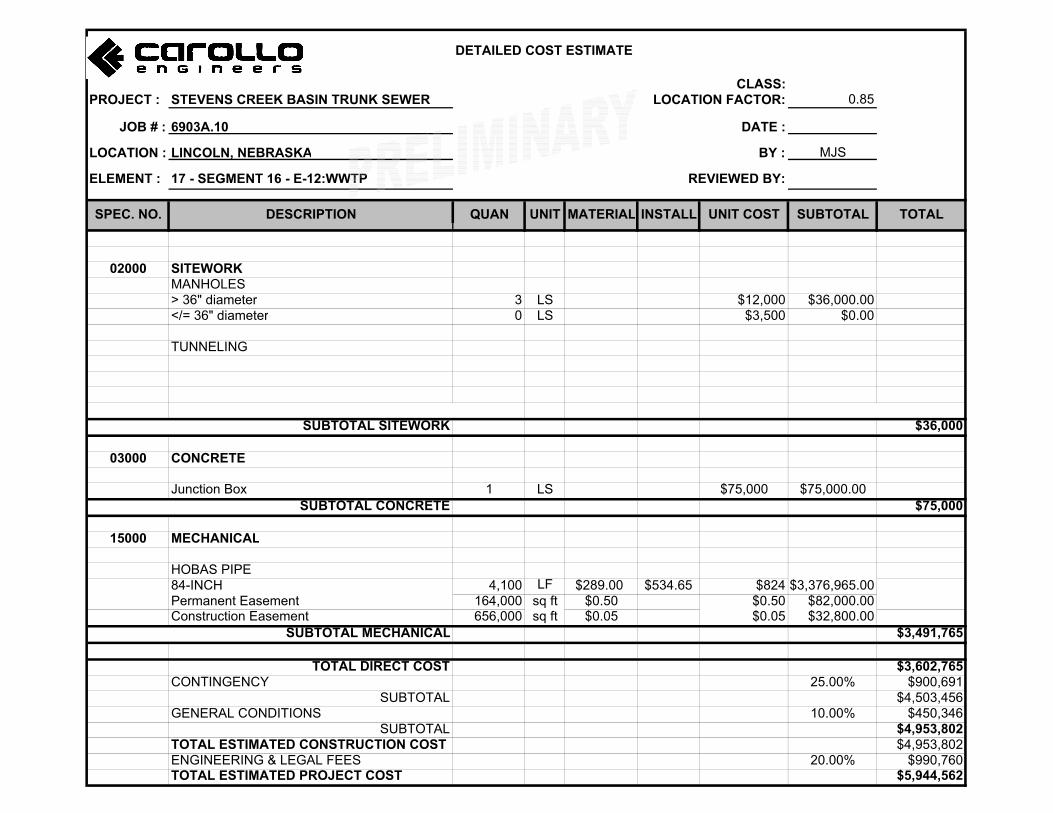
DETAILED COST ESTIMATE
CLASS:PROJECT : STEVENS CREEK BASIN TRUNK SEWER LOCATION FACTOR: 0.85
JOB # : 6903A.10 DATE :
LOCATION : LINCOLN, NEBRASKA BY : MJS
ELEMENT : 17 - SEGMENT 16 - E-12:WWTP REVIEWED BY:
SPEC. NO. DESCRIPTION QUAN UNIT MATERIAL INSTALL UNIT COST SUBTOTAL TOTAL
02000 SITEWORKMANHOLES> 36" diameter 3 LS $12,000 $36,000.00</= 36" diameter 0 LS $3,500 $0.00
TUNNELING
$36,000
03000 CONCRETE
Junction Box 1 LS $75,000 $75,000.00
$75,000
15000 MECHANICAL
HOBAS PIPE84-INCH 4,100 LF $289.00 $534.65 $824 $3,376,965.00Permanent Easement 164,000 sq ft $0.50 $0.50 $82,000.00Construction Easement 656,000 sq ft $0.05 $0.05 $32,800.00
$3,491,765
TOTAL DIRECT COST $3,602,765CONTINGENCY 25.00% $900,691
SUBTOTAL $4,503,456GENERAL CONDITIONS 10.00% $450,346
SUBTOTAL $4,953,802TOTAL ESTIMATED CONSTRUCTION COST $4,953,802ENGINEERING & LEGAL FEES 20.00% $990,760TOTAL ESTIMATED PROJECT COST $5,944,562
SUBTOTAL CONCRETE
SUBTOTAL SITEWORK
SUBTOTAL MECHANICAL

APPENDIX G
Model Run No. 4 Output
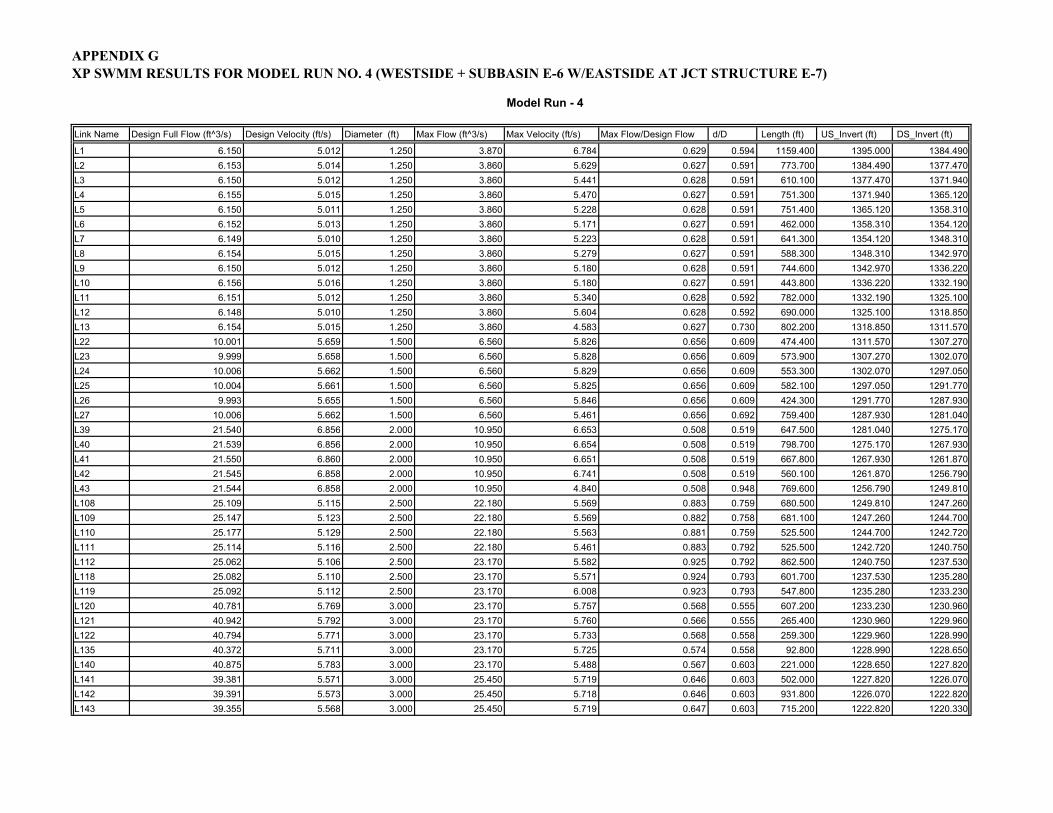
APPENDIX G
XP SWMM RESULTS FOR MODEL RUN NO. 4 (WESTSIDE + SUBBASIN E-6 W/EASTSIDE AT JCT STRUCTURE E-7)
Model Run - 4
Link Name Design Full Flow (ft^3/s) Design Velocity (ft/s) Diameter (ft) Max Flow (ft^3/s) Max Velocity (ft/s) Max Flow/Design Flow d/D Length (ft) US_Invert (ft) DS_Invert (ft)
L1 6.150 5.012 1.250 3.870 6.784 0.629 0.594 1159.400 1395.000 1384.490
L2 6.153 5.014 1.250 3.860 5.629 0.627 0.591 773.700 1384.490 1377.470
L3 6.150 5.012 1.250 3.860 5.441 0.628 0.591 610.100 1377.470 1371.940
L4 6.155 5.015 1.250 3.860 5.470 0.627 0.591 751.300 1371.940 1365.120
L5 6.150 5.011 1.250 3.860 5.228 0.628 0.591 751.400 1365.120 1358.310
L6 6.152 5.013 1.250 3.860 5.171 0.627 0.591 462.000 1358.310 1354.120
L7 6.149 5.010 1.250 3.860 5.223 0.628 0.591 641.300 1354.120 1348.310
L8 6.154 5.015 1.250 3.860 5.279 0.627 0.591 588.300 1348.310 1342.970
L9 6.150 5.012 1.250 3.860 5.180 0.628 0.591 744.600 1342.970 1336.220
L10 6.156 5.016 1.250 3.860 5.180 0.627 0.591 443.800 1336.220 1332.190
L11 6.151 5.012 1.250 3.860 5.340 0.628 0.592 782.000 1332.190 1325.100
L12 6.148 5.010 1.250 3.860 5.604 0.628 0.592 690.000 1325.100 1318.850
L13 6.154 5.015 1.250 3.860 4.583 0.627 0.730 802.200 1318.850 1311.570
L22 10.001 5.659 1.500 6.560 5.826 0.656 0.609 474.400 1311.570 1307.270
L23 9.999 5.658 1.500 6.560 5.828 0.656 0.609 573.900 1307.270 1302.070
L24 10.006 5.662 1.500 6.560 5.829 0.656 0.609 553.300 1302.070 1297.050
L25 10.004 5.661 1.500 6.560 5.825 0.656 0.609 582.100 1297.050 1291.770
L26 9.993 5.655 1.500 6.560 5.846 0.656 0.609 424.300 1291.770 1287.930
L27 10.006 5.662 1.500 6.560 5.461 0.656 0.692 759.400 1287.930 1281.040
L39 21.540 6.856 2.000 10.950 6.653 0.508 0.519 647.500 1281.040 1275.170
L40 21.539 6.856 2.000 10.950 6.654 0.508 0.519 798.700 1275.170 1267.930
L41 21.550 6.860 2.000 10.950 6.651 0.508 0.519 667.800 1267.930 1261.870
L42 21.545 6.858 2.000 10.950 6.741 0.508 0.519 560.100 1261.870 1256.790
L43 21.544 6.858 2.000 10.950 4.840 0.508 0.948 769.600 1256.790 1249.810
L108 25.109 5.115 2.500 22.180 5.569 0.883 0.759 680.500 1249.810 1247.260
L109 25.147 5.123 2.500 22.180 5.569 0.882 0.758 681.100 1247.260 1244.700
L110 25.177 5.129 2.500 22.180 5.563 0.881 0.759 525.500 1244.700 1242.720
L111 25.114 5.116 2.500 22.180 5.461 0.883 0.792 525.500 1242.720 1240.750
L112 25.062 5.106 2.500 23.170 5.582 0.925 0.792 862.500 1240.750 1237.530
L118 25.082 5.110 2.500 23.170 5.571 0.924 0.793 601.700 1237.530 1235.280
L119 25.092 5.112 2.500 23.170 6.008 0.923 0.793 547.800 1235.280 1233.230
L120 40.781 5.769 3.000 23.170 5.757 0.568 0.555 607.200 1233.230 1230.960
L121 40.942 5.792 3.000 23.170 5.760 0.566 0.555 265.400 1230.960 1229.960
L122 40.794 5.771 3.000 23.170 5.733 0.568 0.558 259.300 1229.960 1228.990
L135 40.372 5.711 3.000 23.170 5.725 0.574 0.558 92.800 1228.990 1228.650
L140 40.875 5.783 3.000 23.170 5.488 0.567 0.603 221.000 1228.650 1227.820
L141 39.381 5.571 3.000 25.450 5.719 0.646 0.603 502.000 1227.820 1226.070
L142 39.391 5.573 3.000 25.450 5.718 0.646 0.603 931.800 1226.070 1222.820
L143 39.355 5.568 3.000 25.450 5.719 0.647 0.603 715.200 1222.820 1220.330
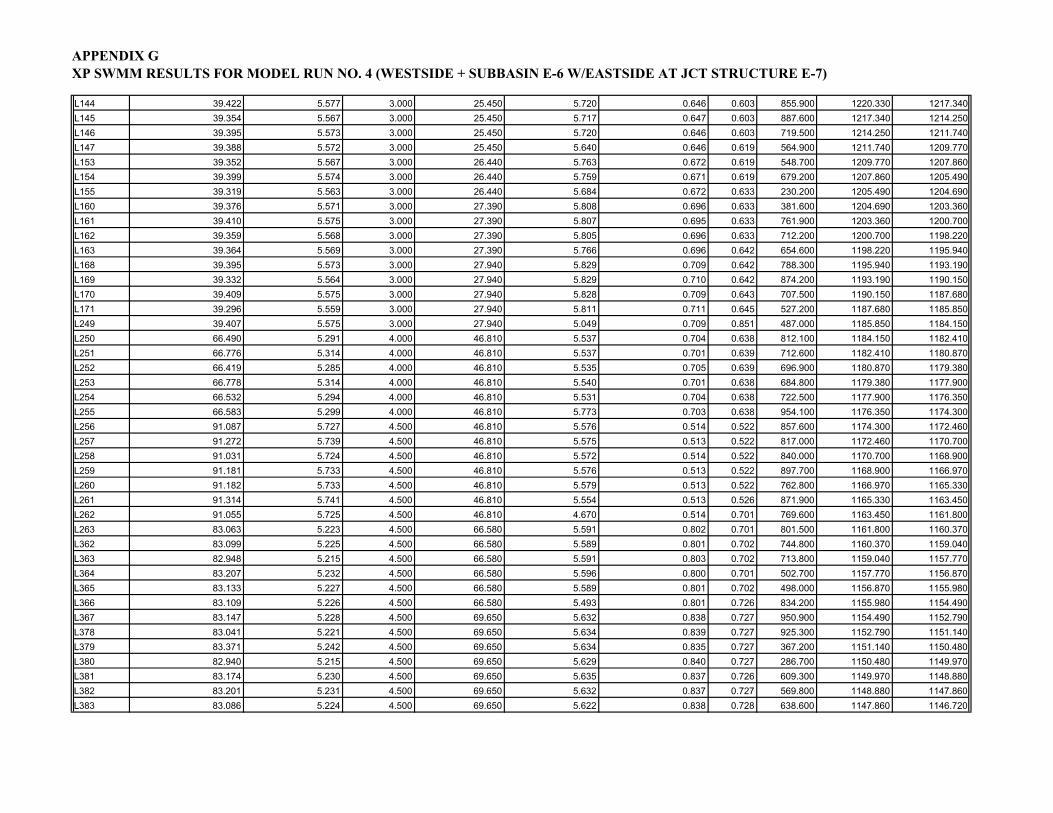
APPENDIX G
XP SWMM RESULTS FOR MODEL RUN NO. 4 (WESTSIDE + SUBBASIN E-6 W/EASTSIDE AT JCT STRUCTURE E-7)
L144 39.422 5.577 3.000 25.450 5.720 0.646 0.603 855.900 1220.330 1217.340
L145 39.354 5.567 3.000 25.450 5.717 0.647 0.603 887.600 1217.340 1214.250
L146 39.395 5.573 3.000 25.450 5.720 0.646 0.603 719.500 1214.250 1211.740
L147 39.388 5.572 3.000 25.450 5.640 0.646 0.619 564.900 1211.740 1209.770
L153 39.352 5.567 3.000 26.440 5.763 0.672 0.619 548.700 1209.770 1207.860
L154 39.399 5.574 3.000 26.440 5.759 0.671 0.619 679.200 1207.860 1205.490
L155 39.319 5.563 3.000 26.440 5.684 0.672 0.633 230.200 1205.490 1204.690
L160 39.376 5.571 3.000 27.390 5.808 0.696 0.633 381.600 1204.690 1203.360
L161 39.410 5.575 3.000 27.390 5.807 0.695 0.633 761.900 1203.360 1200.700
L162 39.359 5.568 3.000 27.390 5.805 0.696 0.633 712.200 1200.700 1198.220
L163 39.364 5.569 3.000 27.390 5.766 0.696 0.642 654.600 1198.220 1195.940
L168 39.395 5.573 3.000 27.940 5.829 0.709 0.642 788.300 1195.940 1193.190
L169 39.332 5.564 3.000 27.940 5.829 0.710 0.642 874.200 1193.190 1190.150
L170 39.409 5.575 3.000 27.940 5.828 0.709 0.643 707.500 1190.150 1187.680
L171 39.296 5.559 3.000 27.940 5.811 0.711 0.645 527.200 1187.680 1185.850
L249 39.407 5.575 3.000 27.940 5.049 0.709 0.851 487.000 1185.850 1184.150
L250 66.490 5.291 4.000 46.810 5.537 0.704 0.638 812.100 1184.150 1182.410
L251 66.776 5.314 4.000 46.810 5.537 0.701 0.639 712.600 1182.410 1180.870
L252 66.419 5.285 4.000 46.810 5.535 0.705 0.639 696.900 1180.870 1179.380
L253 66.778 5.314 4.000 46.810 5.540 0.701 0.638 684.800 1179.380 1177.900
L254 66.532 5.294 4.000 46.810 5.531 0.704 0.638 722.500 1177.900 1176.350
L255 66.583 5.299 4.000 46.810 5.773 0.703 0.638 954.100 1176.350 1174.300
L256 91.087 5.727 4.500 46.810 5.576 0.514 0.522 857.600 1174.300 1172.460
L257 91.272 5.739 4.500 46.810 5.575 0.513 0.522 817.000 1172.460 1170.700
L258 91.031 5.724 4.500 46.810 5.572 0.514 0.522 840.000 1170.700 1168.900
L259 91.181 5.733 4.500 46.810 5.576 0.513 0.522 897.700 1168.900 1166.970
L260 91.182 5.733 4.500 46.810 5.579 0.513 0.522 762.800 1166.970 1165.330
L261 91.314 5.741 4.500 46.810 5.554 0.513 0.526 871.900 1165.330 1163.450
L262 91.055 5.725 4.500 46.810 4.670 0.514 0.701 769.600 1163.450 1161.800
L263 83.063 5.223 4.500 66.580 5.591 0.802 0.701 801.500 1161.800 1160.370
L362 83.099 5.225 4.500 66.580 5.589 0.801 0.702 744.800 1160.370 1159.040
L363 82.948 5.215 4.500 66.580 5.591 0.803 0.702 713.800 1159.040 1157.770
L364 83.207 5.232 4.500 66.580 5.596 0.800 0.701 502.700 1157.770 1156.870
L365 83.133 5.227 4.500 66.580 5.589 0.801 0.702 498.000 1156.870 1155.980
L366 83.109 5.226 4.500 66.580 5.493 0.801 0.726 834.200 1155.980 1154.490
L367 83.147 5.228 4.500 69.650 5.632 0.838 0.727 950.900 1154.490 1152.790
L378 83.041 5.221 4.500 69.650 5.634 0.839 0.727 925.300 1152.790 1151.140
L379 83.371 5.242 4.500 69.650 5.634 0.835 0.727 367.200 1151.140 1150.480
L380 82.940 5.215 4.500 69.650 5.629 0.840 0.727 286.700 1150.480 1149.970
L381 83.174 5.230 4.500 69.650 5.635 0.837 0.726 609.300 1149.970 1148.880
L382 83.201 5.231 4.500 69.650 5.632 0.837 0.727 569.800 1148.880 1147.860
L383 83.086 5.224 4.500 69.650 5.622 0.838 0.728 638.600 1147.860 1146.720
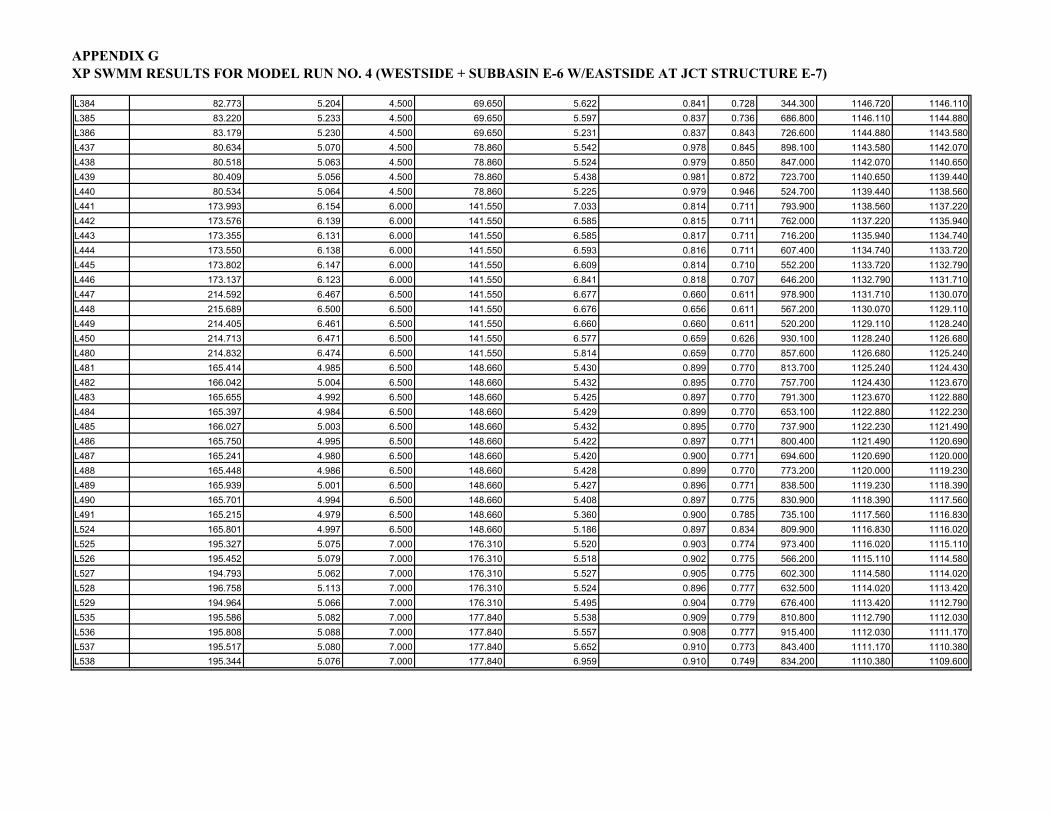
APPENDIX G
XP SWMM RESULTS FOR MODEL RUN NO. 4 (WESTSIDE + SUBBASIN E-6 W/EASTSIDE AT JCT STRUCTURE E-7)
L384 82.773 5.204 4.500 69.650 5.622 0.841 0.728 344.300 1146.720 1146.110
L385 83.220 5.233 4.500 69.650 5.597 0.837 0.736 686.800 1146.110 1144.880
L386 83.179 5.230 4.500 69.650 5.231 0.837 0.843 726.600 1144.880 1143.580
L437 80.634 5.070 4.500 78.860 5.542 0.978 0.845 898.100 1143.580 1142.070
L438 80.518 5.063 4.500 78.860 5.524 0.979 0.850 847.000 1142.070 1140.650
L439 80.409 5.056 4.500 78.860 5.438 0.981 0.872 723.700 1140.650 1139.440
L440 80.534 5.064 4.500 78.860 5.225 0.979 0.946 524.700 1139.440 1138.560
L441 173.993 6.154 6.000 141.550 7.033 0.814 0.711 793.900 1138.560 1137.220
L442 173.576 6.139 6.000 141.550 6.585 0.815 0.711 762.000 1137.220 1135.940
L443 173.355 6.131 6.000 141.550 6.585 0.817 0.711 716.200 1135.940 1134.740
L444 173.550 6.138 6.000 141.550 6.593 0.816 0.711 607.400 1134.740 1133.720
L445 173.802 6.147 6.000 141.550 6.609 0.814 0.710 552.200 1133.720 1132.790
L446 173.137 6.123 6.000 141.550 6.841 0.818 0.707 646.200 1132.790 1131.710
L447 214.592 6.467 6.500 141.550 6.677 0.660 0.611 978.900 1131.710 1130.070
L448 215.689 6.500 6.500 141.550 6.676 0.656 0.611 567.200 1130.070 1129.110
L449 214.405 6.461 6.500 141.550 6.660 0.660 0.611 520.200 1129.110 1128.240
L450 214.713 6.471 6.500 141.550 6.577 0.659 0.626 930.100 1128.240 1126.680
L480 214.832 6.474 6.500 141.550 5.814 0.659 0.770 857.600 1126.680 1125.240
L481 165.414 4.985 6.500 148.660 5.430 0.899 0.770 813.700 1125.240 1124.430
L482 166.042 5.004 6.500 148.660 5.432 0.895 0.770 757.700 1124.430 1123.670
L483 165.655 4.992 6.500 148.660 5.425 0.897 0.770 791.300 1123.670 1122.880
L484 165.397 4.984 6.500 148.660 5.429 0.899 0.770 653.100 1122.880 1122.230
L485 166.027 5.003 6.500 148.660 5.432 0.895 0.770 737.900 1122.230 1121.490
L486 165.750 4.995 6.500 148.660 5.422 0.897 0.771 800.400 1121.490 1120.690
L487 165.241 4.980 6.500 148.660 5.420 0.900 0.771 694.600 1120.690 1120.000
L488 165.448 4.986 6.500 148.660 5.428 0.899 0.770 773.200 1120.000 1119.230
L489 165.939 5.001 6.500 148.660 5.427 0.896 0.771 838.500 1119.230 1118.390
L490 165.701 4.994 6.500 148.660 5.408 0.897 0.775 830.900 1118.390 1117.560
L491 165.215 4.979 6.500 148.660 5.360 0.900 0.785 735.100 1117.560 1116.830
L524 165.801 4.997 6.500 148.660 5.186 0.897 0.834 809.900 1116.830 1116.020
L525 195.327 5.075 7.000 176.310 5.520 0.903 0.774 973.400 1116.020 1115.110
L526 195.452 5.079 7.000 176.310 5.518 0.902 0.775 566.200 1115.110 1114.580
L527 194.793 5.062 7.000 176.310 5.527 0.905 0.775 602.300 1114.580 1114.020
L528 196.758 5.113 7.000 176.310 5.524 0.896 0.777 632.500 1114.020 1113.420
L529 194.964 5.066 7.000 176.310 5.495 0.904 0.779 676.400 1113.420 1112.790
L535 195.586 5.082 7.000 177.840 5.538 0.909 0.779 810.800 1112.790 1112.030
L536 195.808 5.088 7.000 177.840 5.557 0.908 0.777 915.400 1112.030 1111.170
L537 195.517 5.080 7.000 177.840 5.652 0.910 0.773 843.400 1111.170 1110.380
L538 195.344 5.076 7.000 177.840 6.959 0.910 0.749 834.200 1110.380 1109.600

APPENDIX H
Model Run No. 4 Estimated Cost Dat
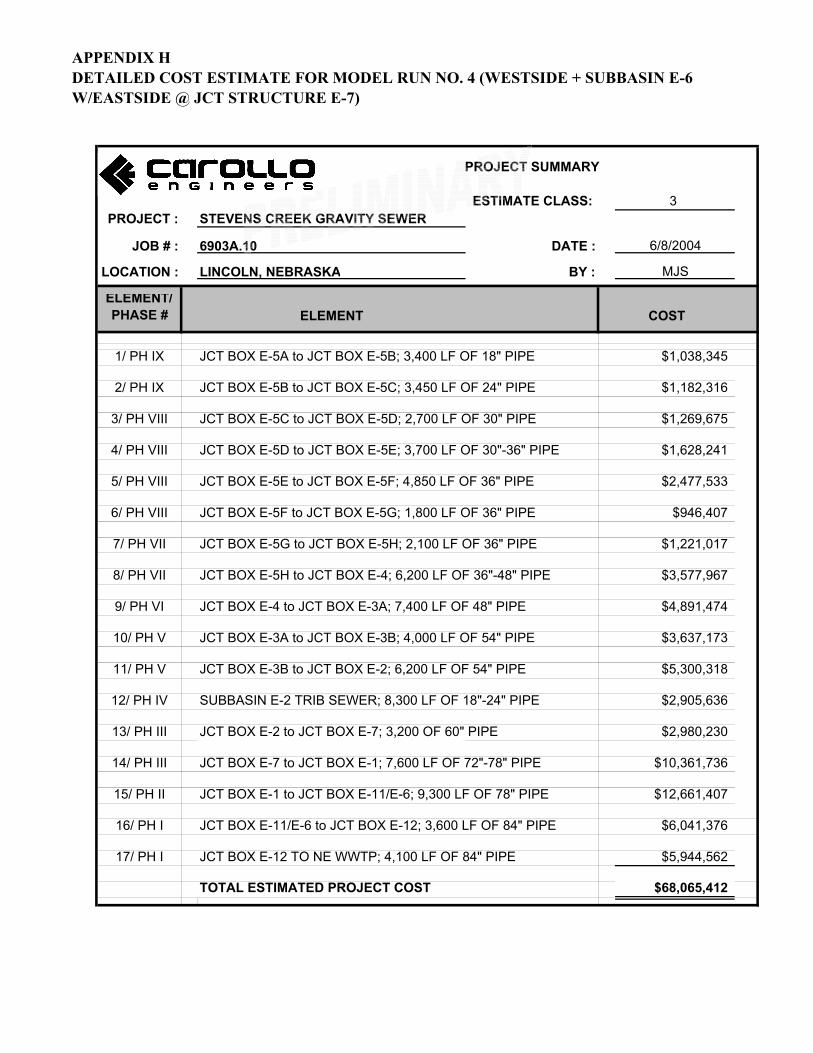
APPENDIX H
DETAILED COST ESTIMATE FOR MODEL RUN NO. 4 (WESTSIDE + SUBBASIN E-6
W/EASTSIDE @ JCT STRUCTURE E-7)
PROJECT SUMMARY
ESTIMATE CLASS: 3
PROJECT : STEVENS CREEK GRAVITY SEWER
JOB # : 6903A.10 DATE : 6/8/2004
LOCATION : LINCOLN, NEBRASKA BY : MJS
ELEMENT/
PHASE # ELEMENT COST
1/ PH IX JCT BOX E-5A to JCT BOX E-5B; 3,400 LF OF 18" PIPE $1,038,345
2/ PH IX JCT BOX E-5B to JCT BOX E-5C; 3,450 LF OF 24" PIPE $1,182,316
3/ PH VIII JCT BOX E-5C to JCT BOX E-5D; 2,700 LF OF 30" PIPE $1,269,675
4/ PH VIII JCT BOX E-5D to JCT BOX E-5E; 3,700 LF OF 30"-36" PIPE $1,628,241
5/ PH VIII JCT BOX E-5E to JCT BOX E-5F; 4,850 LF OF 36" PIPE $2,477,533
6/ PH VIII JCT BOX E-5F to JCT BOX E-5G; 1,800 LF OF 36" PIPE $946,407
7/ PH VII JCT BOX E-5G to JCT BOX E-5H; 2,100 LF OF 36" PIPE $1,221,017
8/ PH VII JCT BOX E-5H to JCT BOX E-4; 6,200 LF OF 36"-48" PIPE $3,577,967
9/ PH VI JCT BOX E-4 to JCT BOX E-3A; 7,400 LF OF 48" PIPE $4,891,474
10/ PH V JCT BOX E-3A to JCT BOX E-3B; 4,000 LF OF 54" PIPE $3,637,173
11/ PH V JCT BOX E-3B to JCT BOX E-2; 6,200 LF OF 54" PIPE $5,300,318
12/ PH IV SUBBASIN E-2 TRIB SEWER; 8,300 LF OF 18"-24" PIPE $2,905,636
13/ PH III JCT BOX E-2 to JCT BOX E-7; 3,200 OF 60" PIPE $2,980,230
14/ PH III JCT BOX E-7 to JCT BOX E-1; 7,600 LF OF 72"-78" PIPE $10,361,736
15/ PH II JCT BOX E-1 to JCT BOX E-11/E-6; 9,300 LF OF 78" PIPE $12,661,407
16/ PH I JCT BOX E-11/E-6 to JCT BOX E-12; 3,600 LF OF 84" PIPE $6,041,376
17/ PH I JCT BOX E-12 TO NE WWTP; 4,100 LF OF 84" PIPE $5,944,562
TOTAL ESTIMATED PROJECT COST $68,065,412

APPENDIX I
Model Run No. 5 Output
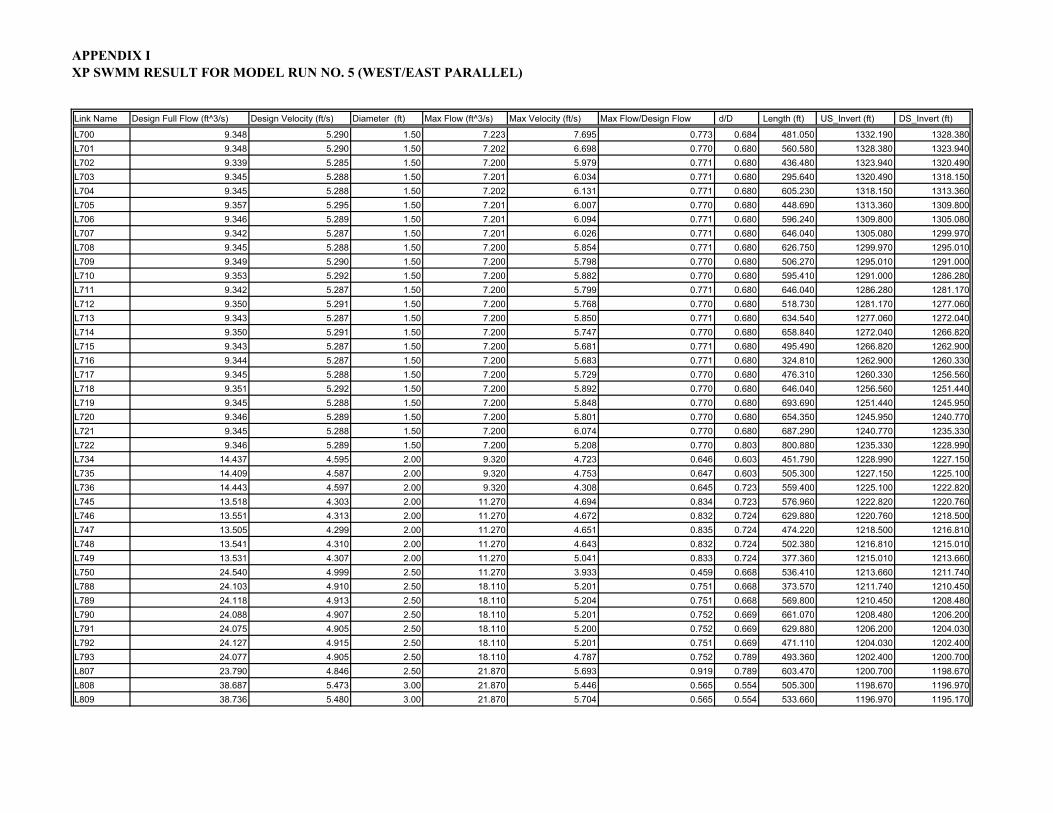
APPENDIX I
XP SWMM RESULT FOR MODEL RUN NO. 5 (WEST/EAST PARALLEL)
Link Name Design Full Flow (ft^3/s) Design Velocity (ft/s) Diameter (ft) Max Flow (ft^3/s) Max Velocity (ft/s) Max Flow/Design Flow d/D Length (ft) US_Invert (ft) DS_Invert (ft)
L700 9.348 5.290 1.50 7.223 7.695 0.773 0.684 481.050 1332.190 1328.380
L701 9.348 5.290 1.50 7.202 6.698 0.770 0.680 560.580 1328.380 1323.940
L702 9.339 5.285 1.50 7.200 5.979 0.771 0.680 436.480 1323.940 1320.490
L703 9.345 5.288 1.50 7.201 6.034 0.771 0.680 295.640 1320.490 1318.150
L704 9.345 5.288 1.50 7.202 6.131 0.771 0.680 605.230 1318.150 1313.360
L705 9.357 5.295 1.50 7.201 6.007 0.770 0.680 448.690 1313.360 1309.800
L706 9.346 5.289 1.50 7.201 6.094 0.771 0.680 596.240 1309.800 1305.080
L707 9.342 5.287 1.50 7.201 6.026 0.771 0.680 646.040 1305.080 1299.970
L708 9.345 5.288 1.50 7.200 5.854 0.771 0.680 626.750 1299.970 1295.010
L709 9.349 5.290 1.50 7.200 5.798 0.770 0.680 506.270 1295.010 1291.000
L710 9.353 5.292 1.50 7.200 5.882 0.770 0.680 595.410 1291.000 1286.280
L711 9.342 5.287 1.50 7.200 5.799 0.771 0.680 646.040 1286.280 1281.170
L712 9.350 5.291 1.50 7.200 5.768 0.770 0.680 518.730 1281.170 1277.060
L713 9.343 5.287 1.50 7.200 5.850 0.771 0.680 634.540 1277.060 1272.040
L714 9.350 5.291 1.50 7.200 5.747 0.770 0.680 658.840 1272.040 1266.820
L715 9.343 5.287 1.50 7.200 5.681 0.771 0.680 495.490 1266.820 1262.900
L716 9.344 5.287 1.50 7.200 5.683 0.771 0.680 324.810 1262.900 1260.330
L717 9.345 5.288 1.50 7.200 5.729 0.770 0.680 476.310 1260.330 1256.560
L718 9.351 5.292 1.50 7.200 5.892 0.770 0.680 646.040 1256.560 1251.440
L719 9.345 5.288 1.50 7.200 5.848 0.770 0.680 693.690 1251.440 1245.950
L720 9.346 5.289 1.50 7.200 5.801 0.770 0.680 654.350 1245.950 1240.770
L721 9.345 5.288 1.50 7.200 6.074 0.770 0.680 687.290 1240.770 1235.330
L722 9.346 5.289 1.50 7.200 5.208 0.770 0.803 800.880 1235.330 1228.990
L734 14.437 4.595 2.00 9.320 4.723 0.646 0.603 451.790 1228.990 1227.150
L735 14.409 4.587 2.00 9.320 4.753 0.647 0.603 505.300 1227.150 1225.100
L736 14.443 4.597 2.00 9.320 4.308 0.645 0.723 559.400 1225.100 1222.820
L745 13.518 4.303 2.00 11.270 4.694 0.834 0.723 576.960 1222.820 1220.760
L746 13.551 4.313 2.00 11.270 4.672 0.832 0.724 629.880 1220.760 1218.500
L747 13.505 4.299 2.00 11.270 4.651 0.835 0.724 474.220 1218.500 1216.810
L748 13.541 4.310 2.00 11.270 4.643 0.832 0.724 502.380 1216.810 1215.010
L749 13.531 4.307 2.00 11.270 5.041 0.833 0.724 377.360 1215.010 1213.660
L750 24.540 4.999 2.50 11.270 3.933 0.459 0.668 536.410 1213.660 1211.740
L788 24.103 4.910 2.50 18.110 5.201 0.751 0.668 373.570 1211.740 1210.450
L789 24.118 4.913 2.50 18.110 5.204 0.751 0.668 569.800 1210.450 1208.480
L790 24.088 4.907 2.50 18.110 5.201 0.752 0.669 661.070 1208.480 1206.200
L791 24.075 4.905 2.50 18.110 5.200 0.752 0.669 629.880 1206.200 1204.030
L792 24.127 4.915 2.50 18.110 5.201 0.751 0.669 471.110 1204.030 1202.400
L793 24.077 4.905 2.50 18.110 4.787 0.752 0.789 493.360 1202.400 1200.700
L807 23.790 4.846 2.50 21.870 5.693 0.919 0.789 603.470 1200.700 1198.670
L808 38.687 5.473 3.00 21.870 5.446 0.565 0.554 505.300 1198.670 1196.970
L809 38.736 5.480 3.00 21.870 5.704 0.565 0.554 533.660 1196.970 1195.170
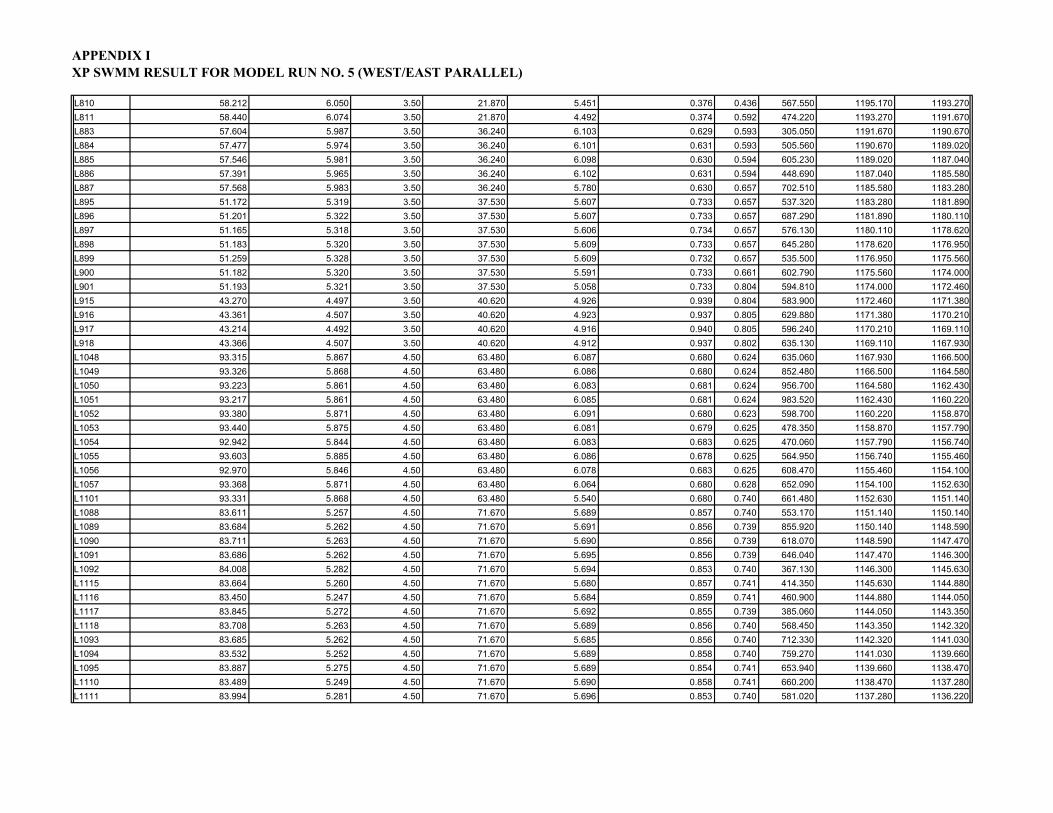
APPENDIX I
XP SWMM RESULT FOR MODEL RUN NO. 5 (WEST/EAST PARALLEL)
L810 58.212 6.050 3.50 21.870 5.451 0.376 0.436 567.550 1195.170 1193.270
L811 58.440 6.074 3.50 21.870 4.492 0.374 0.592 474.220 1193.270 1191.670
L883 57.604 5.987 3.50 36.240 6.103 0.629 0.593 305.050 1191.670 1190.670
L884 57.477 5.974 3.50 36.240 6.101 0.631 0.593 505.560 1190.670 1189.020
L885 57.546 5.981 3.50 36.240 6.098 0.630 0.594 605.230 1189.020 1187.040
L886 57.391 5.965 3.50 36.240 6.102 0.631 0.594 448.690 1187.040 1185.580
L887 57.568 5.983 3.50 36.240 5.780 0.630 0.657 702.510 1185.580 1183.280
L895 51.172 5.319 3.50 37.530 5.607 0.733 0.657 537.320 1183.280 1181.890
L896 51.201 5.322 3.50 37.530 5.607 0.733 0.657 687.290 1181.890 1180.110
L897 51.165 5.318 3.50 37.530 5.606 0.734 0.657 576.130 1180.110 1178.620
L898 51.183 5.320 3.50 37.530 5.609 0.733 0.657 645.280 1178.620 1176.950
L899 51.259 5.328 3.50 37.530 5.609 0.732 0.657 535.500 1176.950 1175.560
L900 51.182 5.320 3.50 37.530 5.591 0.733 0.661 602.790 1175.560 1174.000
L901 51.193 5.321 3.50 37.530 5.058 0.733 0.804 594.810 1174.000 1172.460
L915 43.270 4.497 3.50 40.620 4.926 0.939 0.804 583.900 1172.460 1171.380
L916 43.361 4.507 3.50 40.620 4.923 0.937 0.805 629.880 1171.380 1170.210
L917 43.214 4.492 3.50 40.620 4.916 0.940 0.805 596.240 1170.210 1169.110
L918 43.366 4.507 3.50 40.620 4.912 0.937 0.802 635.130 1169.110 1167.930
L1048 93.315 5.867 4.50 63.480 6.087 0.680 0.624 635.060 1167.930 1166.500
L1049 93.326 5.868 4.50 63.480 6.086 0.680 0.624 852.480 1166.500 1164.580
L1050 93.223 5.861 4.50 63.480 6.083 0.681 0.624 956.700 1164.580 1162.430
L1051 93.217 5.861 4.50 63.480 6.085 0.681 0.624 983.520 1162.430 1160.220
L1052 93.380 5.871 4.50 63.480 6.091 0.680 0.623 598.700 1160.220 1158.870
L1053 93.440 5.875 4.50 63.480 6.081 0.679 0.625 478.350 1158.870 1157.790
L1054 92.942 5.844 4.50 63.480 6.083 0.683 0.625 470.060 1157.790 1156.740
L1055 93.603 5.885 4.50 63.480 6.086 0.678 0.625 564.950 1156.740 1155.460
L1056 92.970 5.846 4.50 63.480 6.078 0.683 0.625 608.470 1155.460 1154.100
L1057 93.368 5.871 4.50 63.480 6.064 0.680 0.628 652.090 1154.100 1152.630
L1101 93.331 5.868 4.50 63.480 5.540 0.680 0.740 661.480 1152.630 1151.140
L1088 83.611 5.257 4.50 71.670 5.689 0.857 0.740 553.170 1151.140 1150.140
L1089 83.684 5.262 4.50 71.670 5.691 0.856 0.739 855.920 1150.140 1148.590
L1090 83.711 5.263 4.50 71.670 5.690 0.856 0.739 618.070 1148.590 1147.470
L1091 83.686 5.262 4.50 71.670 5.695 0.856 0.739 646.040 1147.470 1146.300
L1092 84.008 5.282 4.50 71.670 5.694 0.853 0.740 367.130 1146.300 1145.630
L1115 83.664 5.260 4.50 71.670 5.680 0.857 0.741 414.350 1145.630 1144.880
L1116 83.450 5.247 4.50 71.670 5.684 0.859 0.741 460.900 1144.880 1144.050
L1117 83.845 5.272 4.50 71.670 5.692 0.855 0.739 385.060 1144.050 1143.350
L1118 83.708 5.263 4.50 71.670 5.689 0.856 0.740 568.450 1143.350 1142.320
L1093 83.685 5.262 4.50 71.670 5.685 0.856 0.740 712.330 1142.320 1141.030
L1094 83.532 5.252 4.50 71.670 5.689 0.858 0.740 759.270 1141.030 1139.660
L1095 83.887 5.275 4.50 71.670 5.689 0.854 0.741 653.940 1139.660 1138.470
L1110 83.489 5.249 4.50 71.670 5.690 0.858 0.741 660.200 1138.470 1137.280
L1111 83.994 5.281 4.50 71.670 5.696 0.853 0.740 581.020 1137.280 1136.220
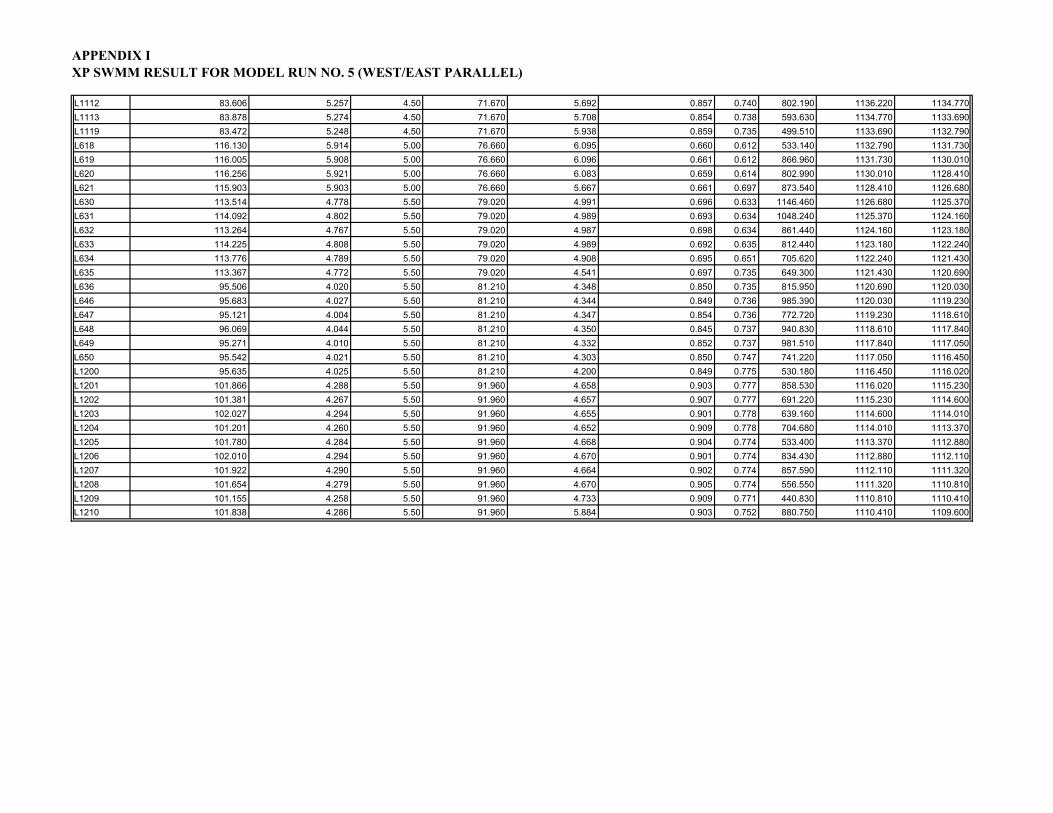
APPENDIX I
XP SWMM RESULT FOR MODEL RUN NO. 5 (WEST/EAST PARALLEL)
L1112 83.606 5.257 4.50 71.670 5.692 0.857 0.740 802.190 1136.220 1134.770
L1113 83.878 5.274 4.50 71.670 5.708 0.854 0.738 593.630 1134.770 1133.690
L1119 83.472 5.248 4.50 71.670 5.938 0.859 0.735 499.510 1133.690 1132.790
L618 116.130 5.914 5.00 76.660 6.095 0.660 0.612 533.140 1132.790 1131.730
L619 116.005 5.908 5.00 76.660 6.096 0.661 0.612 866.960 1131.730 1130.010
L620 116.256 5.921 5.00 76.660 6.083 0.659 0.614 802.990 1130.010 1128.410
L621 115.903 5.903 5.00 76.660 5.667 0.661 0.697 873.540 1128.410 1126.680
L630 113.514 4.778 5.50 79.020 4.991 0.696 0.633 1146.460 1126.680 1125.370
L631 114.092 4.802 5.50 79.020 4.989 0.693 0.634 1048.240 1125.370 1124.160
L632 113.264 4.767 5.50 79.020 4.987 0.698 0.634 861.440 1124.160 1123.180
L633 114.225 4.808 5.50 79.020 4.989 0.692 0.635 812.440 1123.180 1122.240
L634 113.776 4.789 5.50 79.020 4.908 0.695 0.651 705.620 1122.240 1121.430
L635 113.367 4.772 5.50 79.020 4.541 0.697 0.735 649.300 1121.430 1120.690
L636 95.506 4.020 5.50 81.210 4.348 0.850 0.735 815.950 1120.690 1120.030
L646 95.683 4.027 5.50 81.210 4.344 0.849 0.736 985.390 1120.030 1119.230
L647 95.121 4.004 5.50 81.210 4.347 0.854 0.736 772.720 1119.230 1118.610
L648 96.069 4.044 5.50 81.210 4.350 0.845 0.737 940.830 1118.610 1117.840
L649 95.271 4.010 5.50 81.210 4.332 0.852 0.737 981.510 1117.840 1117.050
L650 95.542 4.021 5.50 81.210 4.303 0.850 0.747 741.220 1117.050 1116.450
L1200 95.635 4.025 5.50 81.210 4.200 0.849 0.775 530.180 1116.450 1116.020
L1201 101.866 4.288 5.50 91.960 4.658 0.903 0.777 858.530 1116.020 1115.230
L1202 101.381 4.267 5.50 91.960 4.657 0.907 0.777 691.220 1115.230 1114.600
L1203 102.027 4.294 5.50 91.960 4.655 0.901 0.778 639.160 1114.600 1114.010
L1204 101.201 4.260 5.50 91.960 4.652 0.909 0.778 704.680 1114.010 1113.370
L1205 101.780 4.284 5.50 91.960 4.668 0.904 0.774 533.400 1113.370 1112.880
L1206 102.010 4.294 5.50 91.960 4.670 0.901 0.774 834.430 1112.880 1112.110
L1207 101.922 4.290 5.50 91.960 4.664 0.902 0.774 857.590 1112.110 1111.320
L1208 101.654 4.279 5.50 91.960 4.670 0.905 0.774 556.550 1111.320 1110.810
L1209 101.155 4.258 5.50 91.960 4.733 0.909 0.771 440.830 1110.810 1110.410
L1210 101.838 4.286 5.50 91.960 5.884 0.903 0.752 880.750 1110.410 1109.600

APPENDIX J
Model Run No. 5 Estimated Cost Data
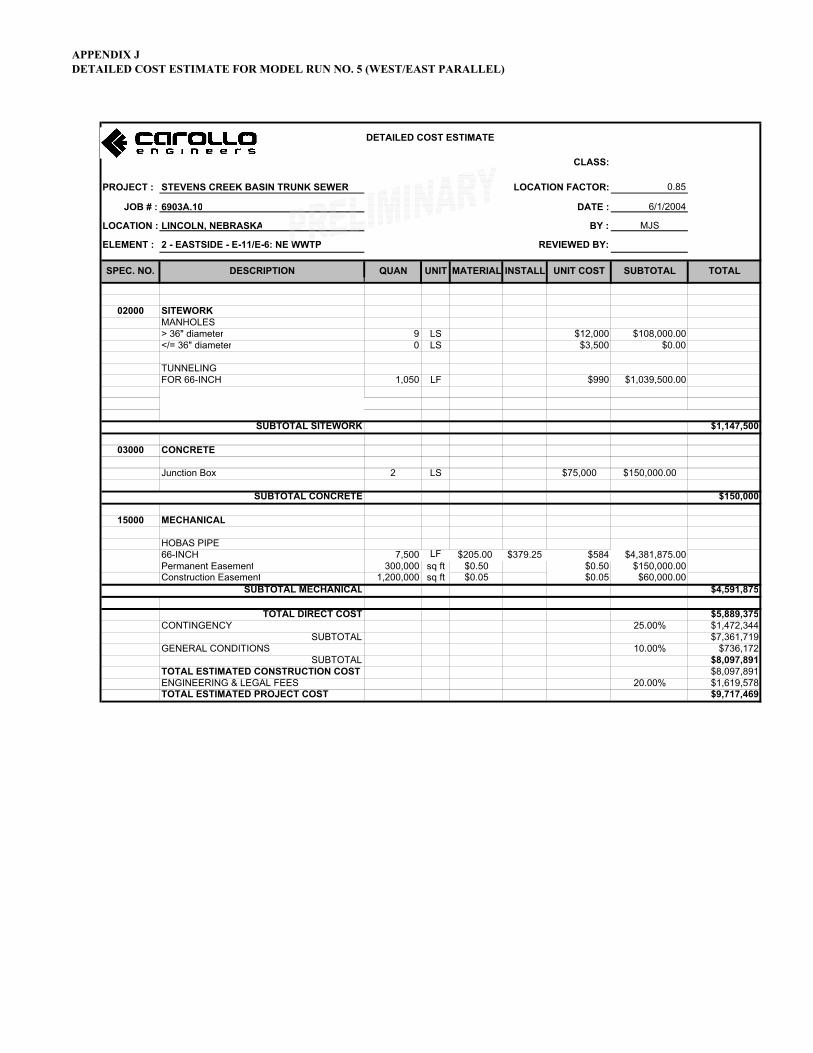
APPENDIX J
DETAILED COST ESTIMATE FOR MODEL RUN NO. 5 (WEST/EAST PARALLEL)
DETAILED COST ESTIMATE
CLASS:
PROJECT : STEVENS CREEK BASIN TRUNK SEWER LOCATION FACTOR: 0.85
JOB # : 6903A.10 DATE : 6/1/2004
LOCATION : LINCOLN, NEBRASKA BY : MJS
ELEMENT : 2 - EASTSIDE - E-11/E-6: NE WWTP REVIEWED BY:
SPEC. NO. DESCRIPTION QUAN UNIT MATERIAL INSTALL UNIT COST SUBTOTAL TOTAL
02000 SITEWORKMANHOLES> 36" diameter 9 LS $12,000 $108,000.00</= 36" diameter 0 LS $3,500 $0.00
TUNNELINGFOR 66-INCH 1,050 LF $990 $1,039,500.00
$1,147,500
03000 CONCRETE
Junction Box 2 LS $75,000 $150,000.00
$150,000
15000 MECHANICAL
HOBAS PIPE66-INCH 7,500 LF $205.00 $379.25 $584 $4,381,875.00Permanent Easement 300,000 sq ft $0.50 $0.50 $150,000.00Construction Easement 1,200,000 sq ft $0.05 $0.05 $60,000.00
$4,591,875
TOTAL DIRECT COST $5,889,375CONTINGENCY 25.00% $1,472,344
SUBTOTAL $7,361,719GENERAL CONDITIONS 10.00% $736,172
SUBTOTAL $8,097,891TOTAL ESTIMATED CONSTRUCTION COST $8,097,891ENGINEERING & LEGAL FEES 20.00% $1,619,578TOTAL ESTIMATED PROJECT COST $9,717,469
SUBTOTAL CONCRETE
SUBTOTAL SITEWORK
SUBTOTAL MECHANICAL

APPENDIX K
Subbasin E-2 Model Output
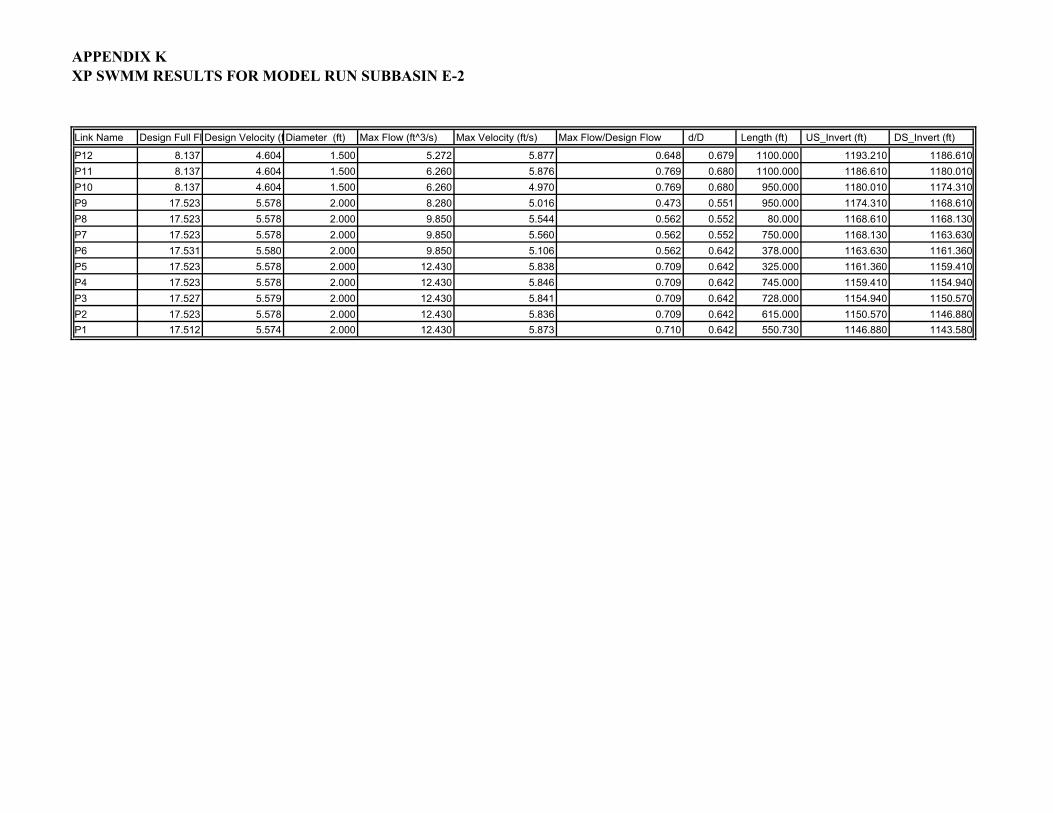
APPENDIX K
XP SWMM RESULTS FOR MODEL RUN SUBBASIN E-2
Link Name Design Full Fl Design Velocity (f Diameter (ft) Max Flow (ft^3/s) Max Velocity (ft/s) Max Flow/Design Flow d/D Length (ft) US_Invert (ft) DS_Invert (ft)
P12 8.137 4.604 1.500 5.272 5.877 0.648 0.679 1100.000 1193.210 1186.610
P11 8.137 4.604 1.500 6.260 5.876 0.769 0.680 1100.000 1186.610 1180.010
P10 8.137 4.604 1.500 6.260 4.970 0.769 0.680 950.000 1180.010 1174.310
P9 17.523 5.578 2.000 8.280 5.016 0.473 0.551 950.000 1174.310 1168.610
P8 17.523 5.578 2.000 9.850 5.544 0.562 0.552 80.000 1168.610 1168.130
P7 17.523 5.578 2.000 9.850 5.560 0.562 0.552 750.000 1168.130 1163.630
P6 17.531 5.580 2.000 9.850 5.106 0.562 0.642 378.000 1163.630 1161.360
P5 17.523 5.578 2.000 12.430 5.838 0.709 0.642 325.000 1161.360 1159.410
P4 17.523 5.578 2.000 12.430 5.846 0.709 0.642 745.000 1159.410 1154.940
P3 17.527 5.579 2.000 12.430 5.841 0.709 0.642 728.000 1154.940 1150.570
P2 17.523 5.578 2.000 12.430 5.836 0.709 0.642 615.000 1150.570 1146.880
P1 17.512 5.574 2.000 12.430 5.873 0.710 0.642 550.730 1146.880 1143.580

APPENDIX L
Subbasins E-2 Model Estimated Cost Data
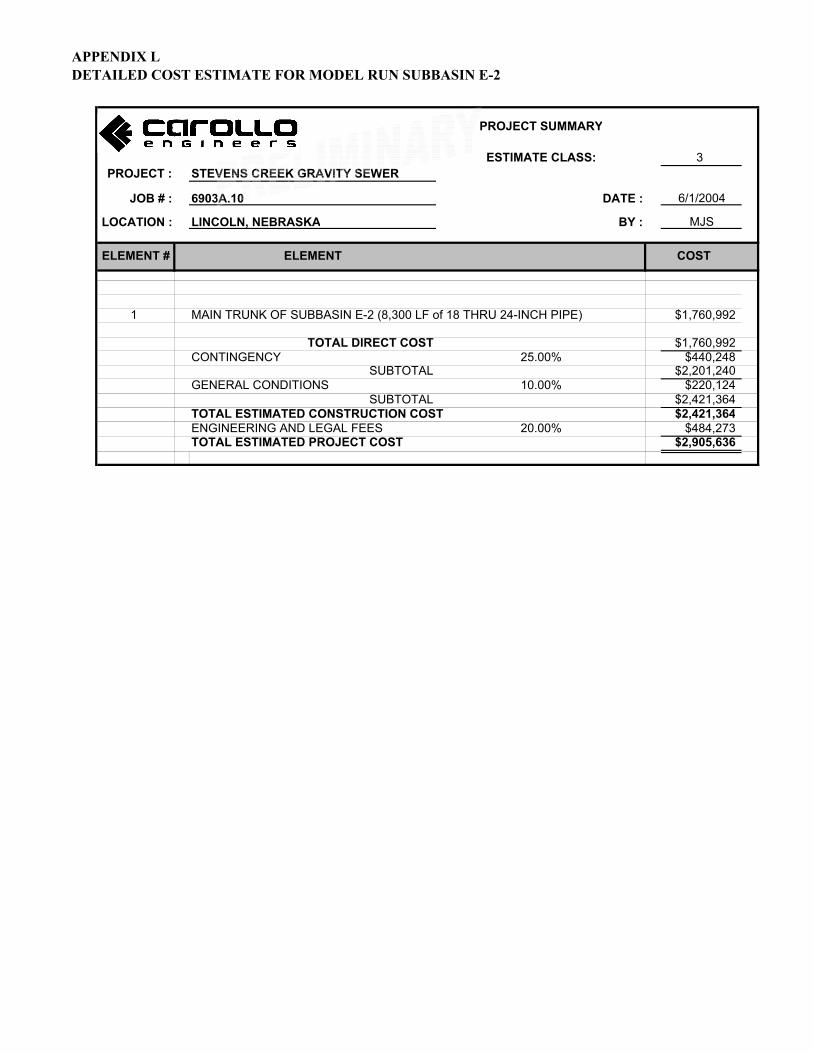
APPENDIX L
DETAILED COST ESTIMATE FOR MODEL RUN SUBBASIN E-2
PROJECT SUMMARY
ESTIMATE CLASS: 3
PROJECT : STEVENS CREEK GRAVITY SEWER
JOB # : 6903A.10 DATE : 6/1/2004
LOCATION : LINCOLN, NEBRASKA BY : MJS
ELEMENT # ELEMENT COST
1 MAIN TRUNK OF SUBBASIN E-2 (8,300 LF of 18 THRU 24-INCH PIPE) $1,760,992
TOTAL DIRECT COST $1,760,992CONTINGENCY 25.00% $440,248
SUBTOTAL $2,201,240GENERAL CONDITIONS 10.00% $220,124
SUBTOTAL $2,421,364TOTAL ESTIMATED CONSTRUCTION COST $2,421,364ENGINEERING AND LEGAL FEES 20.00% $484,273TOTAL ESTIMATED PROJECT COST $2,905,636
Recommended