Childhood ImmunizationHow Far We’ve Come
And How Far We Have to Go
Alan R. Hinman, MD, MPH
Indiana Immunization Conference
October 16-17, 2007
Outline of presentation
• Current status of childhood immunization in the US
• How immunizations are financed in the US• Inequities in financing
– Causes– Possible solutions
• Further issues with adult immunization
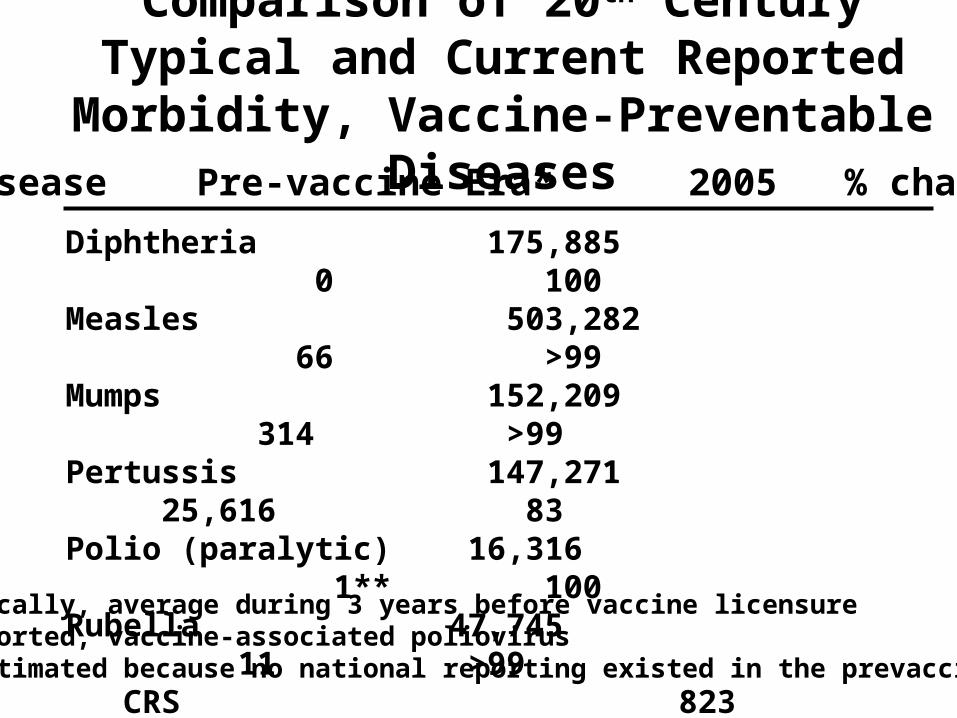
Diphtheria 175,885 0 100Measles 503,282 66 >99Mumps 152,209 314 >99Pertussis 147,271 25,616 83Polio (paralytic) 16,316 1** 100Rubella 47,745 11 >99 CRS 823 1 >99 Tetanus 1,314 27 98Hib/unk (<5 yrs) 20,000+ 226 99
Disease Pre-vaccine Era* 2005 % change
*Typically, average during 3 years before vaccine licensure**Imported, vaccine-associated poliovirus+ Estimated because no national reporting existed in the prevaccine era
Comparison of 20th Century Typical and Current Reported Morbidity, Vaccine-Preventable Diseases
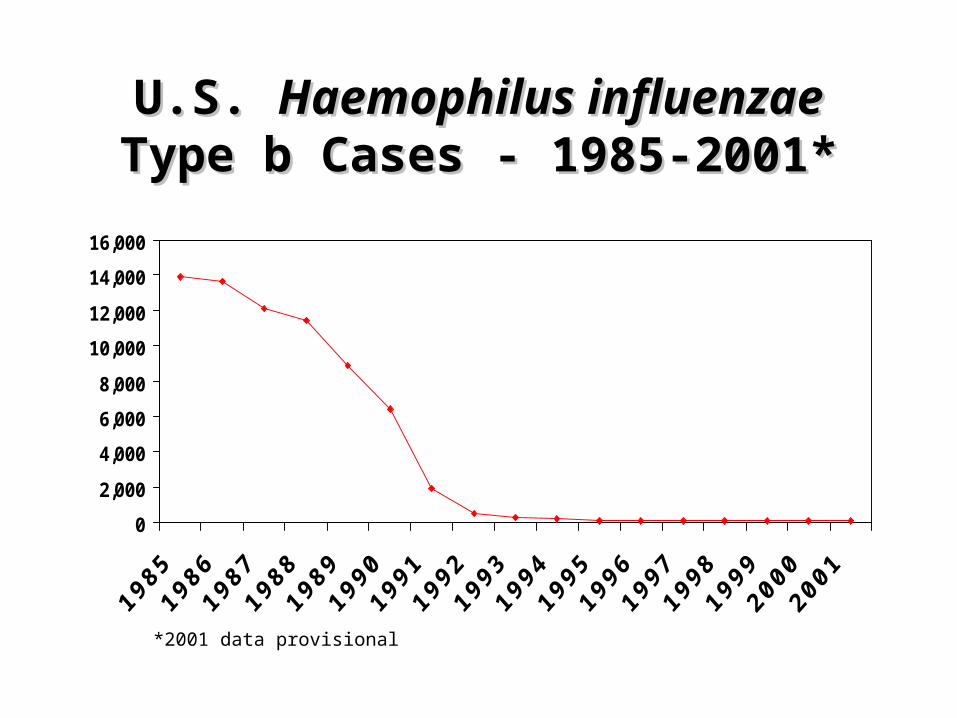
U.S. U.S. Haemophilus influenzaeHaemophilus influenzae Type Type b Cases - 1985-2001*b Cases - 1985-2001*
0
2,000
4,000
6,000
8,000
10,000
12,000
14,000
16,000
*2001 data provisional

Impact of PCV7 Vaccine on Racial Impact of PCV7 Vaccine on Racial Disparities in Invasive Strep Disparities in Invasive Strep
pneumoniae Infectionpneumoniae Infection
Flannery et al. JAMA 2004; 291: 2197 - 2203

Herd Effect in Adults 65+ YearsPCV7 types v. 16 types only in PPV
ABCs 1998/99 average vs. 2003
Serotype Cases/100,000 pop Percent change
95% CI
Baseline 2003
Vaccine 34 12 -65 -69, -59
Nonvaccine 27 30 +13 +1, +25
16 types only in PPV*
17 19 +17 +2, +33
*PPV= 23 valent pneumococcal polysaccharide vaccine

0.00
2.00
4.00
6.00
8.00
10.00
12.00
14.00
1994 1995 1996 1997 1998 1999 2000 2001 2002
Year
Rat
e (p
er 1
00,0
00 p
op
ula
tio
n)
<10 yrs
10-19 yrs
20-49 yrs
0-49 yrs
*Varicella as the primary diagnosis code
Varicella-related Hospitalization Rates*, 1994-2002
Zhou F, et al. JAMA 2005

rate per 100,000 0-4 5-9 10-19>=20
DC
NYC
Hepatitis A Incidence by County, 1987-97 and 2005
Rate per 100,000
0-4
5-9
10-19
20+
1987-1997
2005

0.0
10.0
20.0
30.0
40.0
50.0
60.0
Year
Cases/1
00,0
00
No RecommendationVaccine ConsideredVaccine RecommendedAll States
0.0
5.0
10.0
15.0
20.0
25.0
30.0
19941995
19961997
19981999
20002001
20022003
20042005
2006
Year
Ca
se
s/1
00
,00
0
Incidence of hepatitis A per 100,000 population, by vaccination recommendation status, 1966-2006*
Vaccination recommended in high-risk groups
Vaccination recommended in high-risk areas
Source: NNDSS * 2006 data provisional
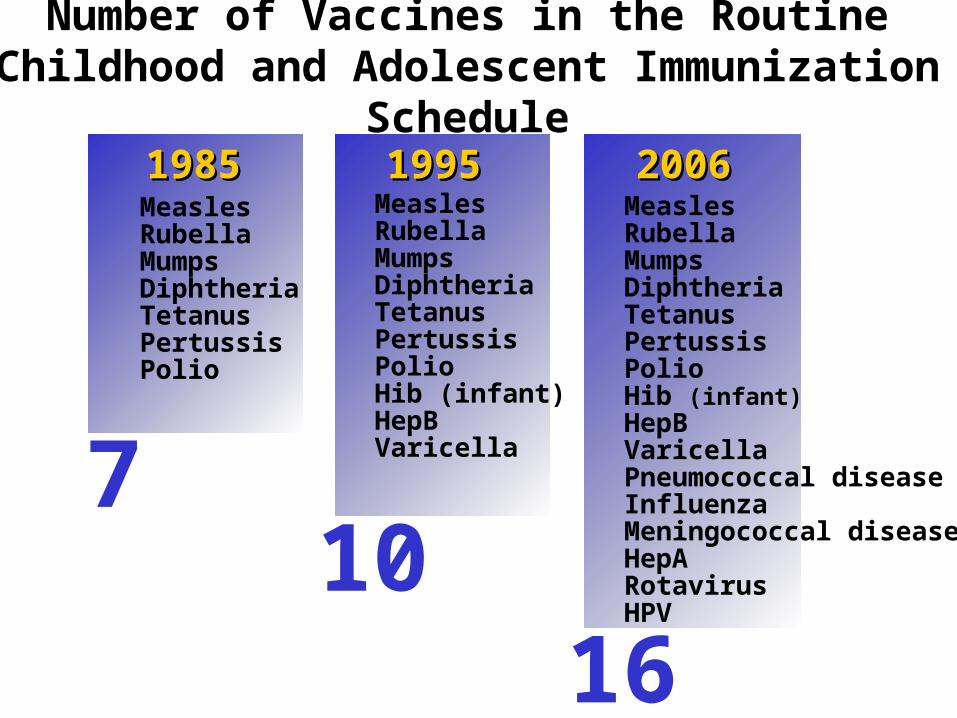
Number of Vaccines in the Routine Childhood and Adolescent Immunization Schedule
19851985 19951995 20062006MeaslesRubellaMumpsDiphtheriaTetanusPertussisPolioHib (infant) HepBVaricellaPneumococcal diseaseInfluenzaMeningococcal diseaseHepARotavirusHPV
MeaslesRubellaMumpsDiphtheriaTetanusPertussisPolioHib (infant) HepBVaricella
MeaslesRubellaMumpsDiphtheriaTetanusPertussisPolio
710
16
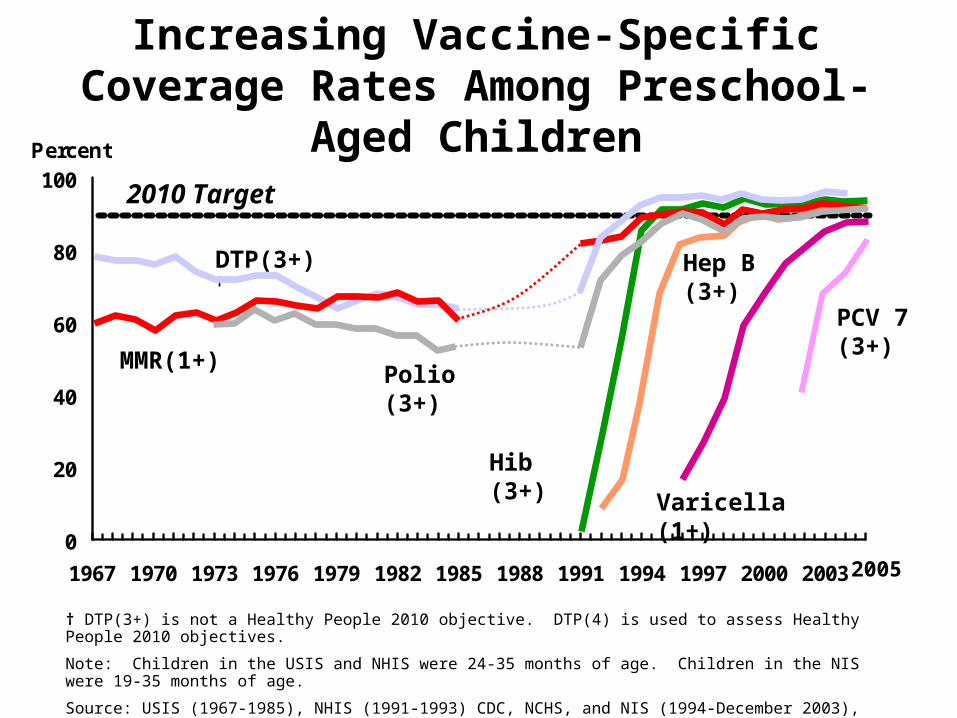
0
20
40
60
80
100
1967 1970 1973 1976 1979 1982 1985 1988 1991 1994 1997 2000 2003
Percent
Increasing Vaccine-Specific Coverage Rates Among Preschool-Aged Children
† DTP(3+) is not a Healthy People 2010 objective. DTP(4) is used to assess Healthy People 2010 objectives.
Note: Children in the USIS and NHIS were 24-35 months of age. Children in the NIS were 19-35 months of age.
Source: USIS (1967-1985), NHIS (1991-1993) CDC, NCHS, and NIS (1994-December 2003), CDC, NIP and NCHS; No data from 1986-1990 due to cancellation of USIS because of budget reductions.
DTP(3+)†
MMR(1+)
Hib (3+)
2010 Target
Hep B (3+)
Polio (3+)
Varicella (1+)
PCV 7 (3+)
2005

Vaccination coverage among children 19-35 months of age, 2006
Vaccine USA IN
DTP/DTaP 4+ 85.2% 84.5%
Polio 3+ 92.9% 92.4%
MMR 1+ 92.4% 89.5%
Hib 3+ 93.4% 90.7%
Hep B 3+ 93.4% 92.1%
Varicella 1+ 89.3% 88.0%
PCV 3+ 87.0% 87.3%
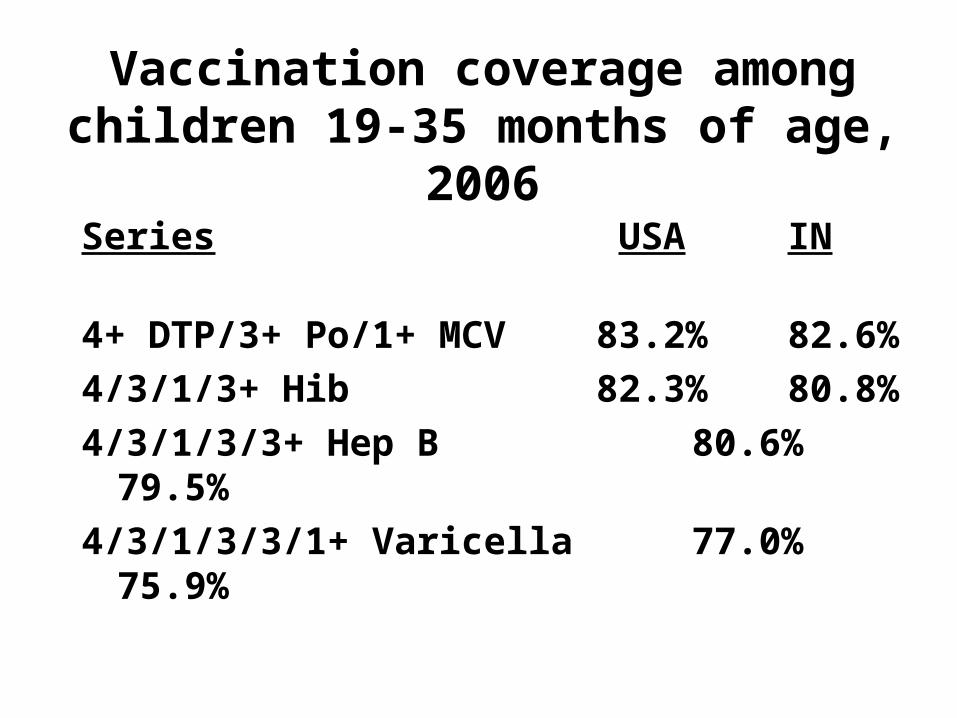
Vaccination coverage among children 19-35 months of age, 2006
Series USA IN
4+ DTP/3+ Po/1+ MCV 83.2% 82.6%
4/3/1/3+ Hib 82.3% 80.8%
4/3/1/3/3+ Hep B 80.6% 79.5%
4/3/1/3/3/1+ Varicella 77.0% 75.9%

Estimated Vaccination Coverage Among Children Enrolled in Kindergarten - United
States, 2006-2007 School Year††
>3 Polio 96.3%
>4 DTP 96.0%
>1 MMR 95.6%
>3 Hep B 96.8%
>1 Var † 96.5%
† or history of varicella disease
†† CDC, MMWR 2007; 56:819-821
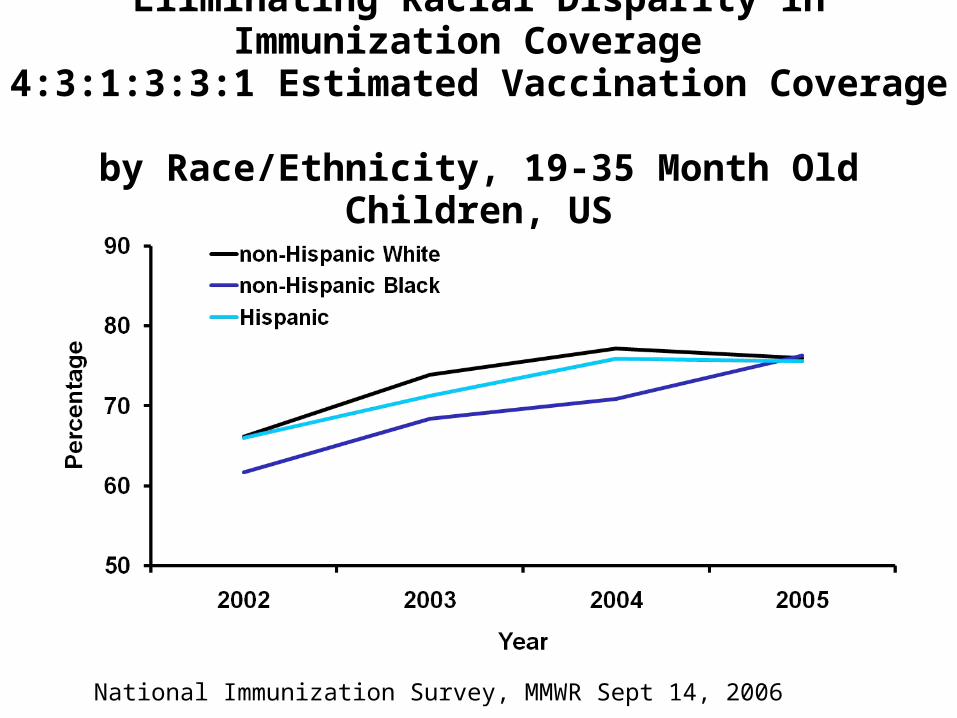
Eliminating Racial Disparity in Immunization Coverage
4:3:1:3:3:1 Estimated Vaccination Coverage by Race/Ethnicity, 19-35 Month Old Children, US
National Immunization Survey, MMWR Sept 14, 2006
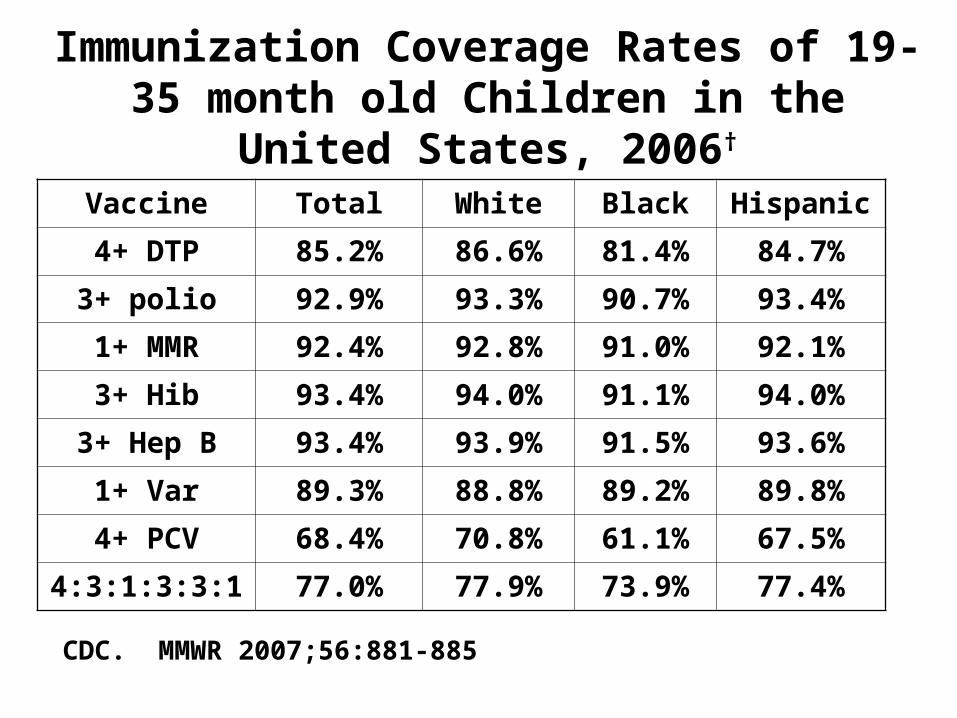
Immunization Coverage Rates of 19-35 month old Children in the United States,
2006†
Vaccine Total White Black Hispanic
4+ DTP 85.2% 86.6% 81.4% 84.7%
3+ polio 92.9% 93.3% 90.7% 93.4%
1+ MMR 92.4% 92.8% 91.0% 92.1%
3+ Hib 93.4% 94.0% 91.1% 94.0%
3+ Hep B 93.4% 93.9% 91.5% 93.6%
1+ Var 89.3% 88.8% 89.2% 89.8%
4+ PCV 68.4% 70.8% 61.1% 67.5%
4:3:1:3:3:1 77.0% 77.9% 73.9% 77.4%
CDC. MMWR 2007;56:881-885
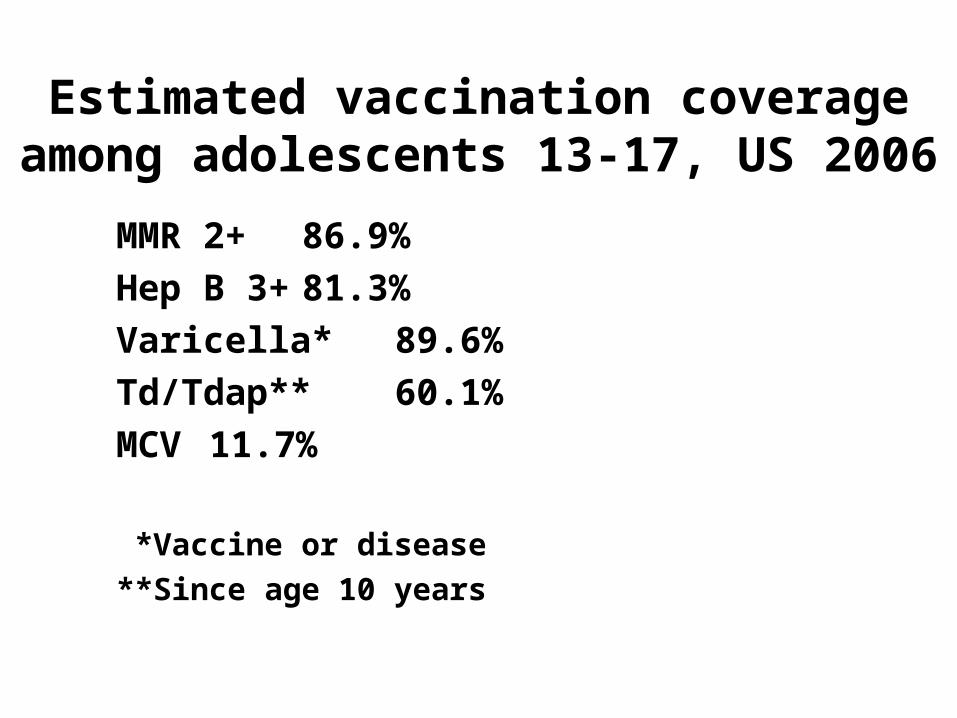
Estimated vaccination coverage among adolescents 13-17, US 2006
MMR 2+ 86.9%
Hep B 3+ 81.3%
Varicella* 89.6%
Td/Tdap** 60.1%
MCV 11.7%
*Vaccine or disease
**Since age 10 years
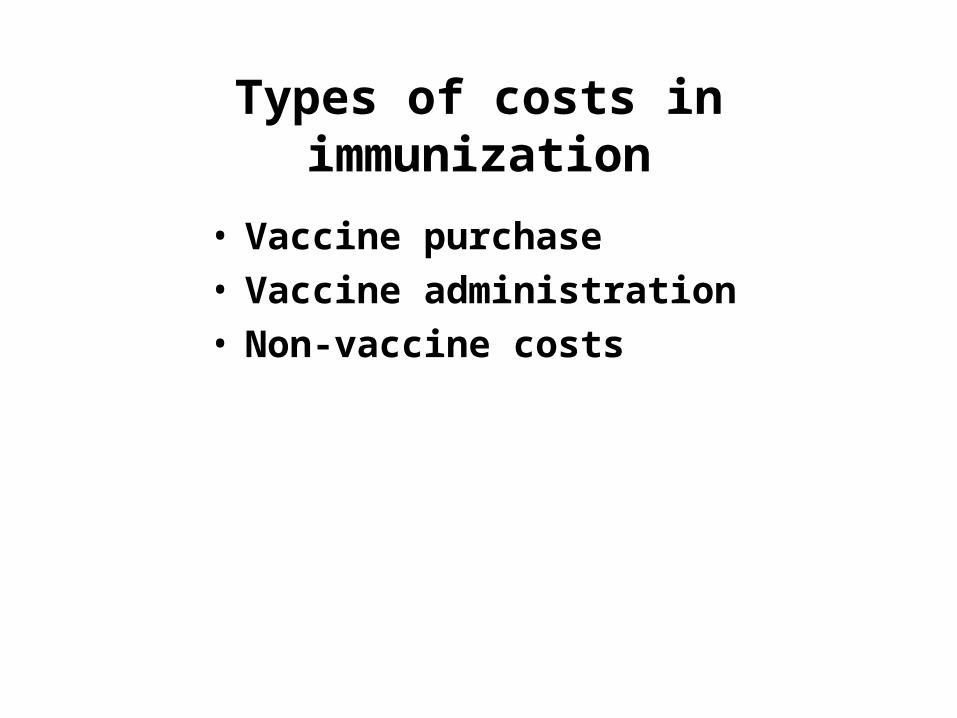
Types of costs in immunization
• Vaccine purchase• Vaccine administration• Non-vaccine costs
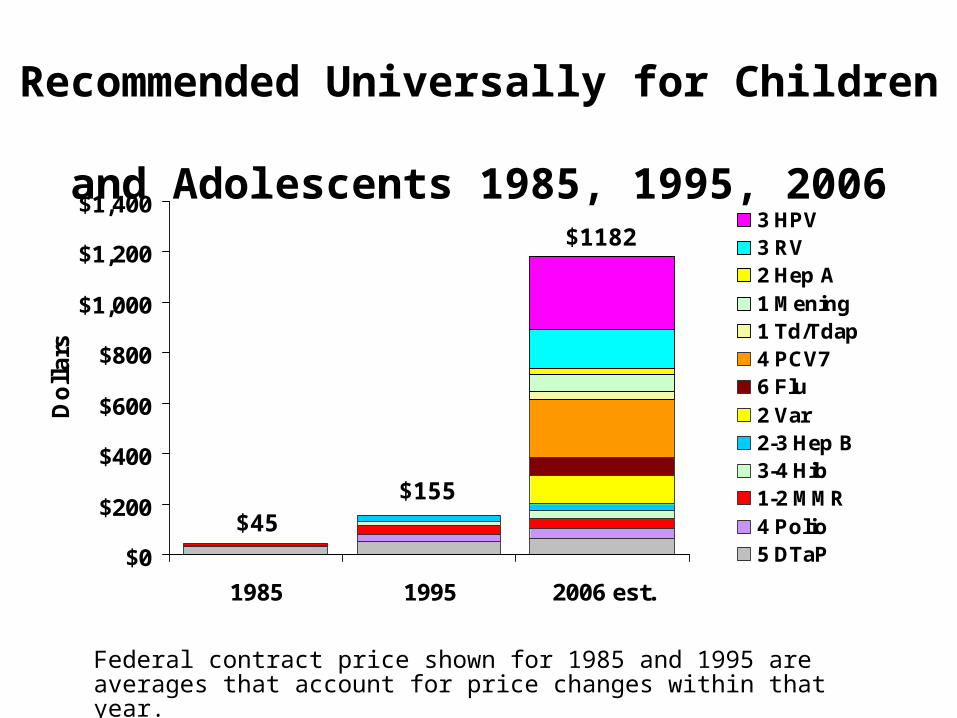
Federal Contract Prices for Vaccines Recommended Universally for Children
and Adolescents 1985, 1995, 2006
$0
$200
$400
$600
$800
$1,000
$1,200
$1,400
1985 1995 2006 est.
Do
llars
3 HPV3 RV2 Hep A1 Mening1 Td/Tdap4 PCV76 Flu2 Var2-3 Hep B3-4 Hib1-2 MMR4 Polio5 DTaP
Federal contract price shown for 1985 and 1995 are averages that account for price changes within that year.
$45$155
$1182

Sources of financing childhood immunizations
• Government– Federal– State/local
• Insurance– Private– Public
• Out-of-pocket

317 Immunization Program
317 grants support:
• Purchase of vaccine for free administration at local health departments
• Immunization delivery• Surveillance• Communication• Education
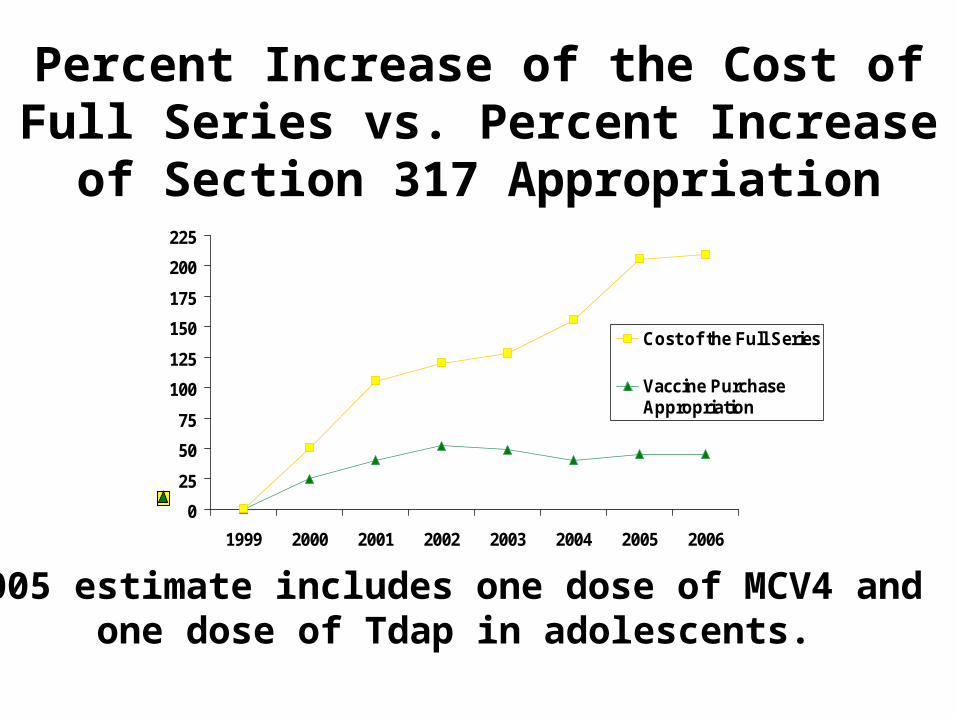
Percent Increase of the Cost of Full Series vs. Percent Increase of Section
317 Appropriation
0
25
50
75
100
125
150
175
200
225
1999 2000 2001 2002 2003 2004 2005 2006
Cost of the Full Series
Vaccine PurchaseAppropriation
2005 estimate includes one dose of MCV4 and one dose of Tdap in adolescents.
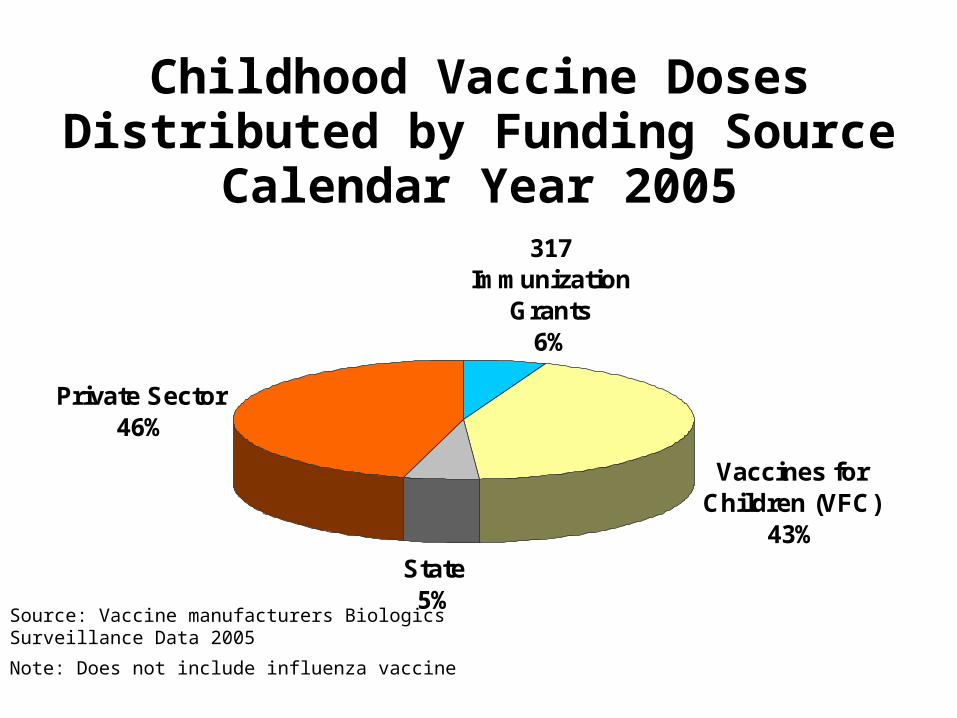
317 Immunization
Grants 6%
Vaccines for Children (VFC)
43%State
5%
Private Sector46%
Childhood Vaccine Doses Distributed by Funding SourceCalendar Year 2005
Source: Vaccine manufacturers Biologics Surveillance Data 2005
Note: Does not include influenza vaccine
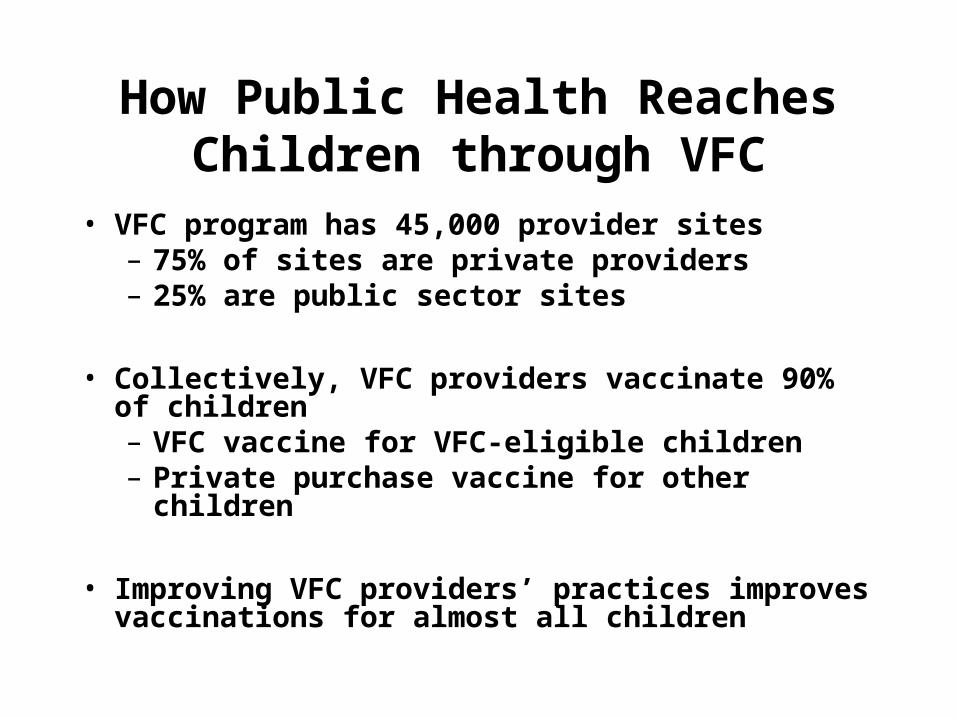
How Public Health Reaches Children through VFC
• VFC program has 45,000 provider sites– 75% of sites are private providers– 25% are public sector sites
• Collectively, VFC providers vaccinate 90% of children– VFC vaccine for VFC-eligible children– Private purchase vaccine for other children
• Improving VFC providers’ practices improves vaccinations for almost all children

Contrasts Between317 and VFC Funding Sources
AttributesAttributes 317317 VFCVFC
Source Discretionary annual appropriation Mandatory
Eligibility Not restricted
Medicaid-enrolled; Uninsured; Native American, Alaska Native; Underinsured*
Stability Significant fluctuations possible Stable funding stream
* Underinsured only at Federally Qualified Health Centers and Rural Health Clinics

VFC and Section 317 Vaccine Funding to Immunization
Programs
$0
$200,000,000
$400,000,000
$600,000,000
$800,000,000
$1,000,000,000
$1,200,000,000
$1,400,000,000
$1,600,000,000
$1,800,000,000
$2,000,000,000
1990
1991
1992
1993
1994
1995
1996
1997
1998
1999
2000
2001
2002
2003
2004
2005
2006
2007
PB
Section 317
VFC

Two-Tiered State Vaccination Policies at Local Health Departments
• Traditionally, health department clinics vaccinated any child brought for vaccination
• Underinsured children ineligible for VFC vaccine except at FQHCs and RHCs (~3,000 clinics)– VFC designated FQHCs and RHCs as safety-net providers for
underinsured children– State and 317 funding used for underinsured– Due to inadequate state/317 funding, many states cannot
purchase vaccine for underinsured children• Result is a two-tiered policy
– Government purchased vaccine not available to underinsured at health department clinics
– Access to new vaccines for some based on insurance– Ethical tension for public health officials and providers

Two-Tiered States: 2005
• Invasive pneumococcal disease– 13 states did not purchase PCV7
vaccine for underinsured children in health department clinics
• Invasive meningococcal disease– 31 states did not purchase MCV4
vaccine for underinsured children in health department clinics
• These states do not have a public health department safety net to vaccinate children against these diseases
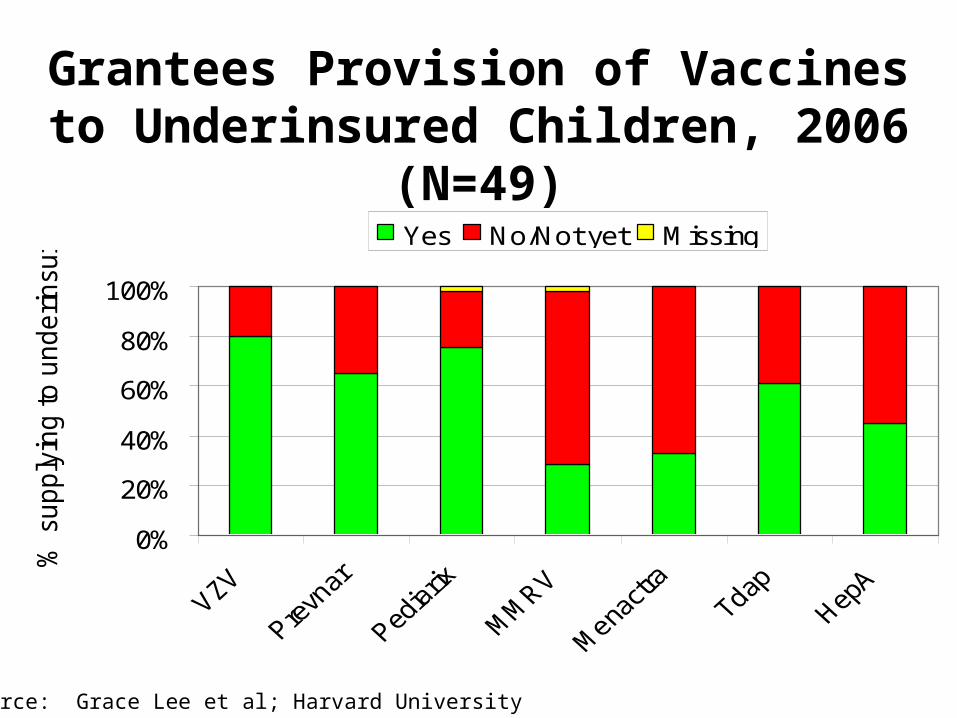
Grantees Provision of Vaccines to Underinsured Children, 2006 (N=49)
0%
20%
40%
60%
80%
100%
% s
upply
ing to u
nderinsu
red Yes No/Not yet Missing
Source: Grace Lee et al; Harvard University
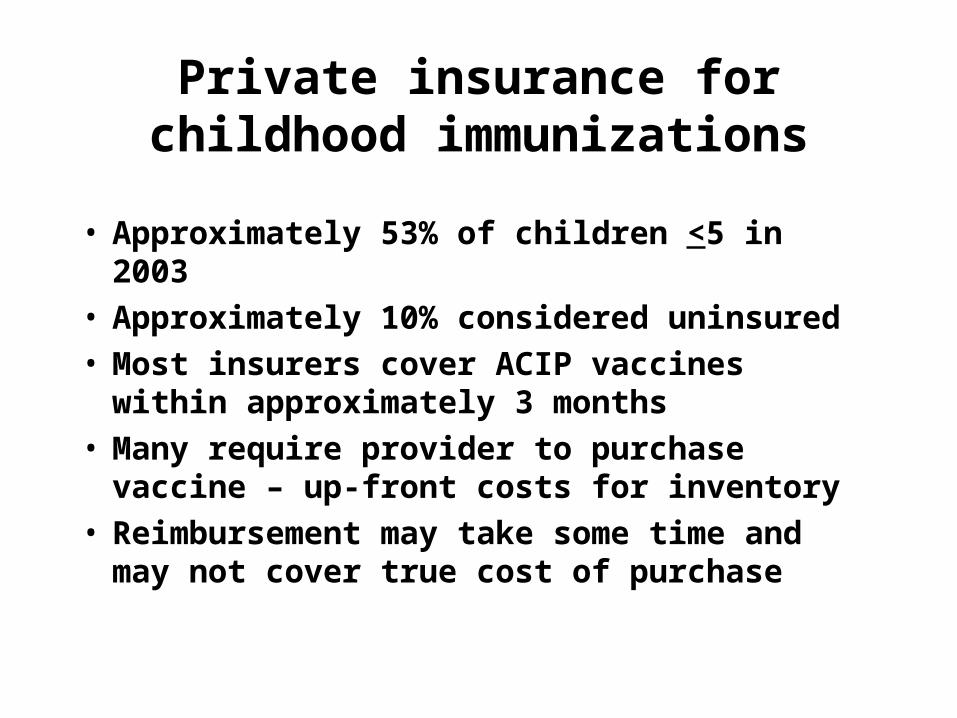
Private insurance for childhood immunizations
• Approximately 53% of children <5 in 2003• Approximately 10% considered uninsured• Most insurers cover ACIP vaccines within
approximately 3 months• Many require provider to purchase
vaccine – up-front costs for inventory• Reimbursement may take some time and
may not cover true cost of purchase

Public insurance for childhood immunizations
• Medicare• Medicaid• CHIP
– Medicaid enhancement– S-CHIP

Out-of-pocket expenses for childhood immunizations
• Primarily with underinsured children• Providers may refer to health departments• Exacerbated by costs of newer vaccines• May be further exacerbated by efforts to
make HPV mandatory without assuring that all children have access to vaccine in public sector
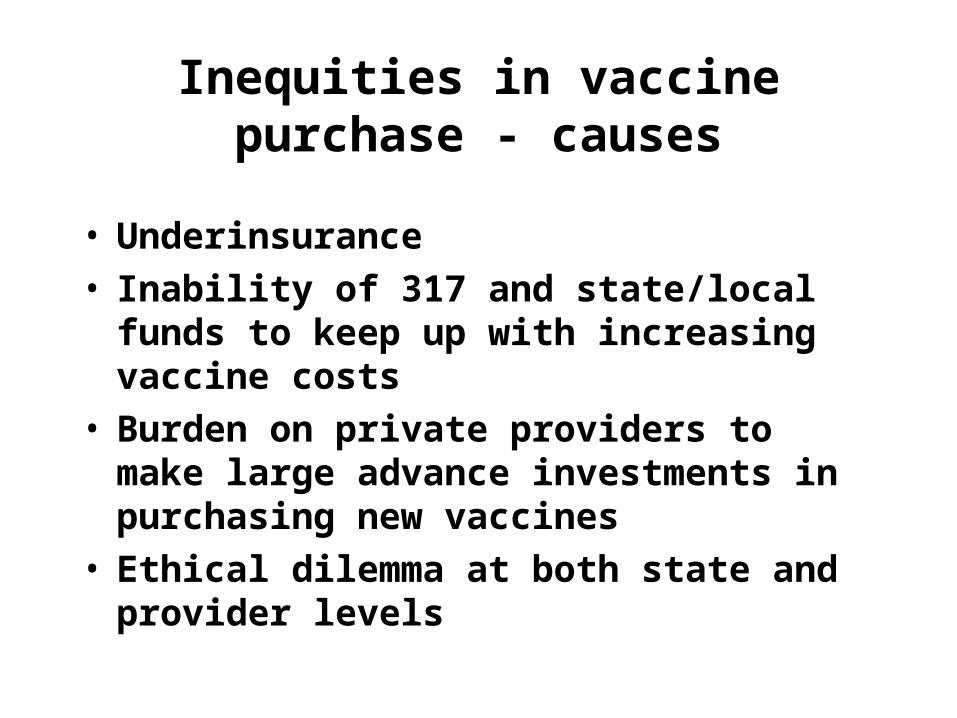
Inequities in vaccine purchase - causes
• Underinsurance• Inability of 317 and state/local funds to
keep up with increasing vaccine costs• Burden on private providers to make large
advance investments in purchasing new vaccines
• Ethical dilemma at both state and provider levels
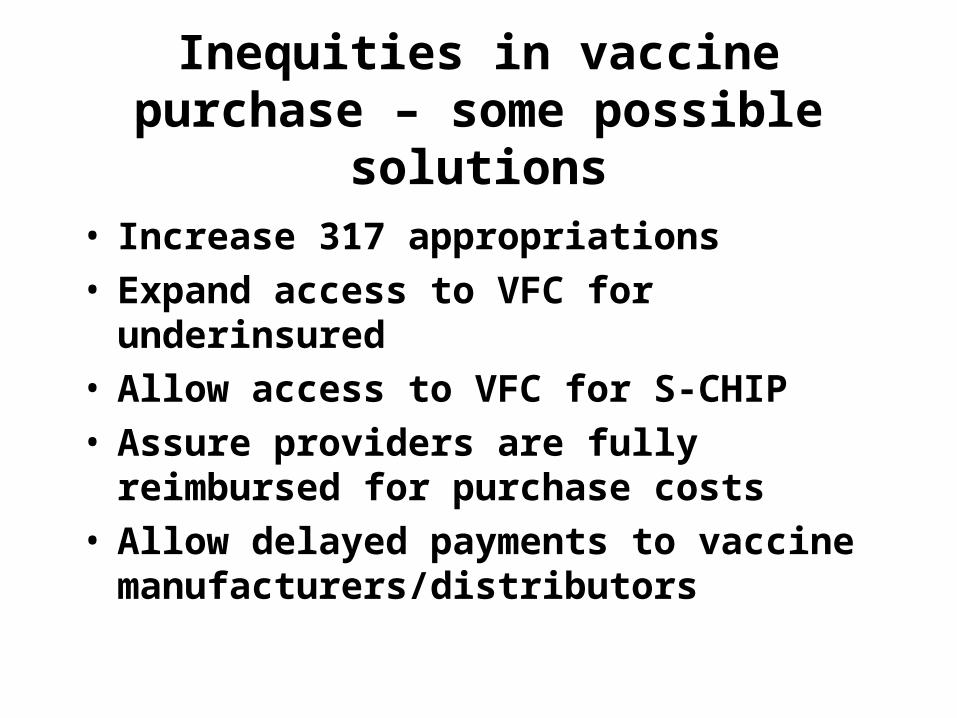
Inequities in vaccine purchase – some possible solutions
• Increase 317 appropriations• Expand access to VFC for underinsured• Allow access to VFC for S-CHIP• Assure providers are fully reimbursed for
purchase costs• Allow delayed payments to vaccine
manufacturers/distributors
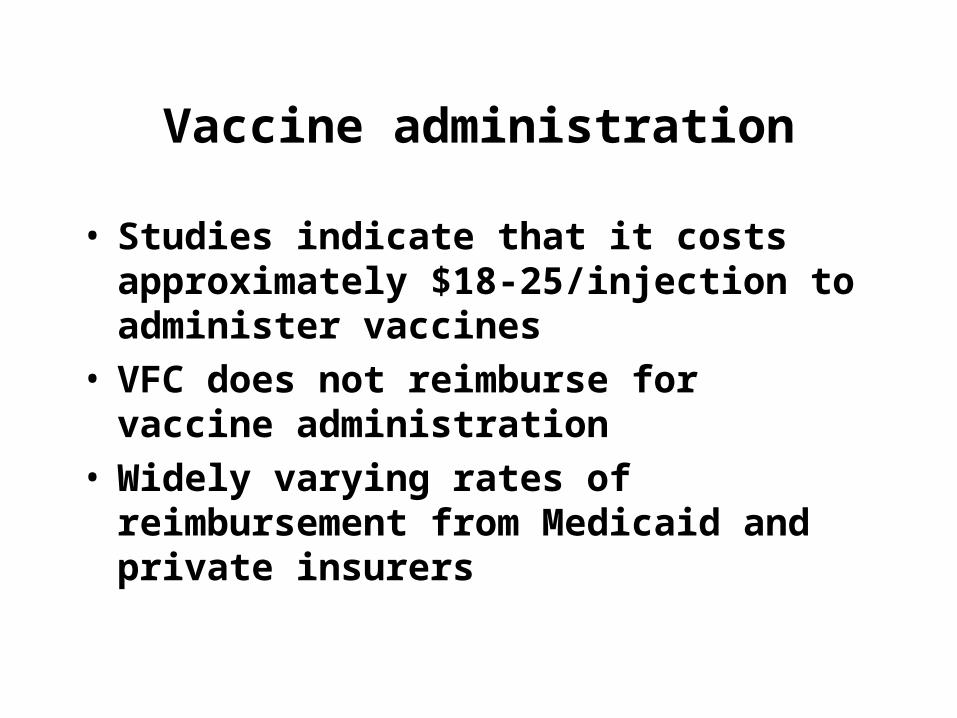
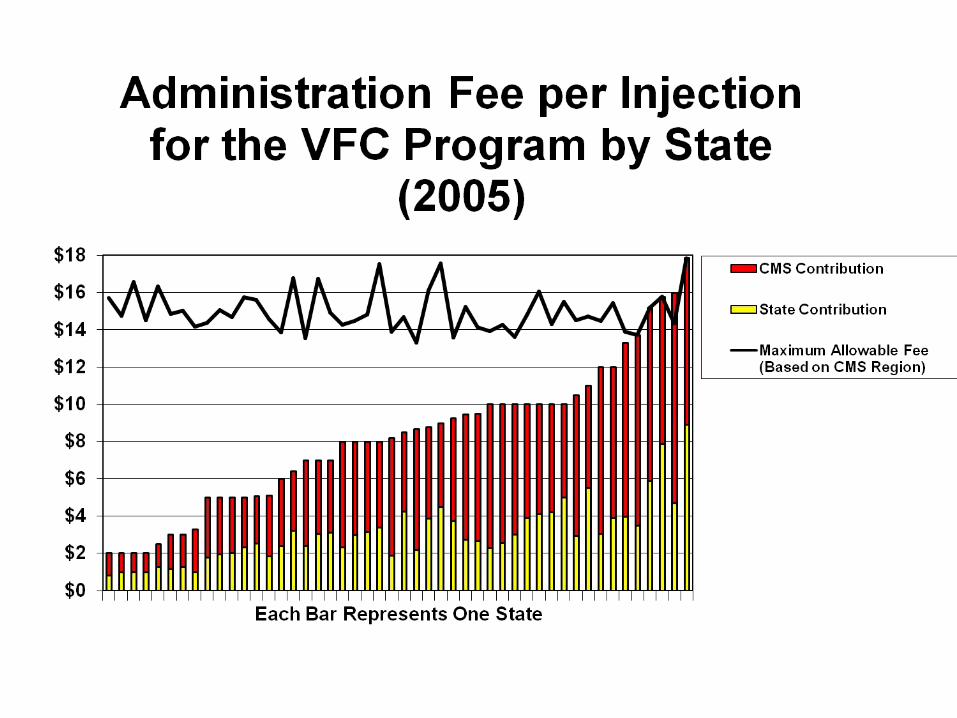
Vaccine administration
• Studies indicate that it costs approximately $18-25/injection to administer vaccines
• VFC does not reimburse for vaccine administration
• Widely varying rates of reimbursement from Medicaid and private insurers

Inequities in vaccine administration reimbursement
• Some possible solutions– Reimbursement from VFC– Minimum/recommended reimbursement
rate from CMS– Negotiation with private insurers
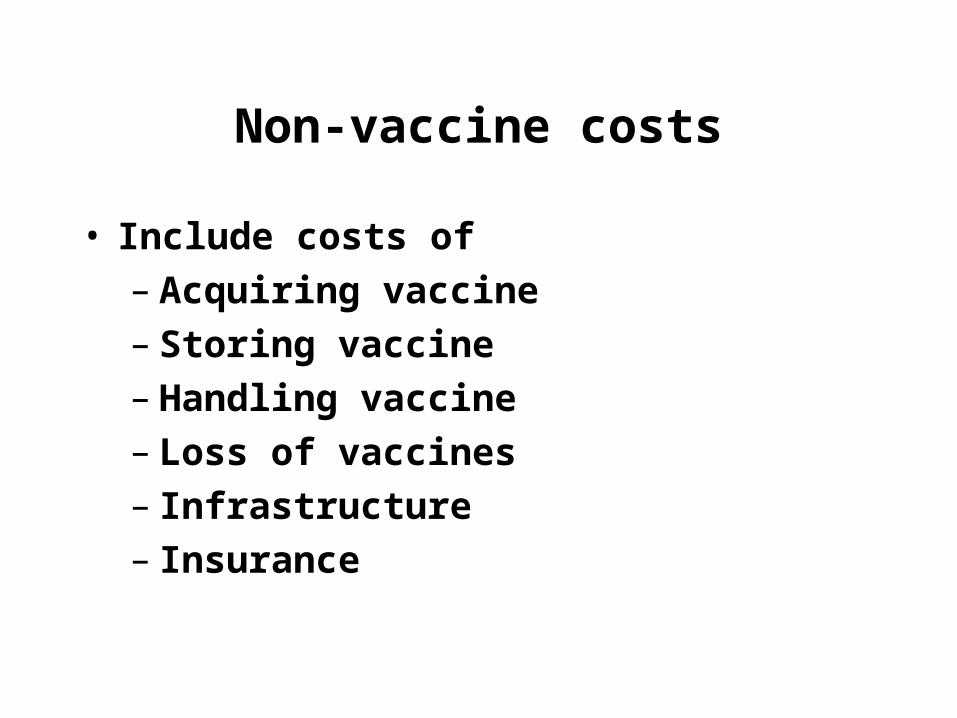
Non-vaccine costs
• Include costs of– Acquiring vaccine– Storing vaccine– Handling vaccine– Loss of vaccines– Infrastructure– Insurance
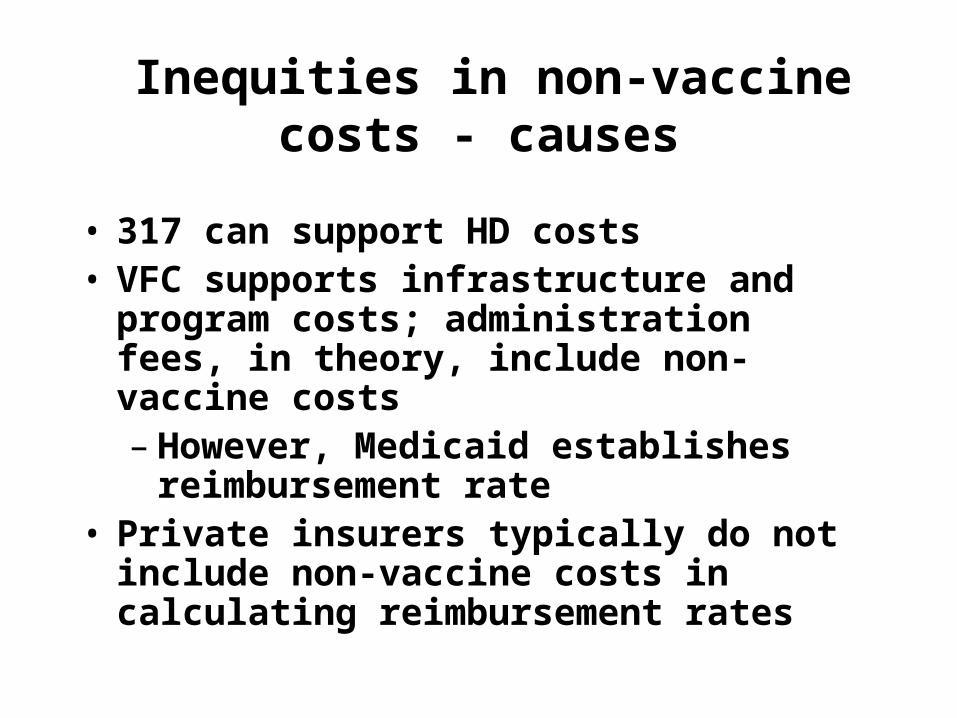
Inequities in non-vaccine costs - causes
• 317 can support HD costs• VFC supports infrastructure and program
costs; administration fees, in theory, include non-vaccine costs– However, Medicaid establishes
reimbursement rate• Private insurers typically do not include
non-vaccine costs in calculating reimbursement rates
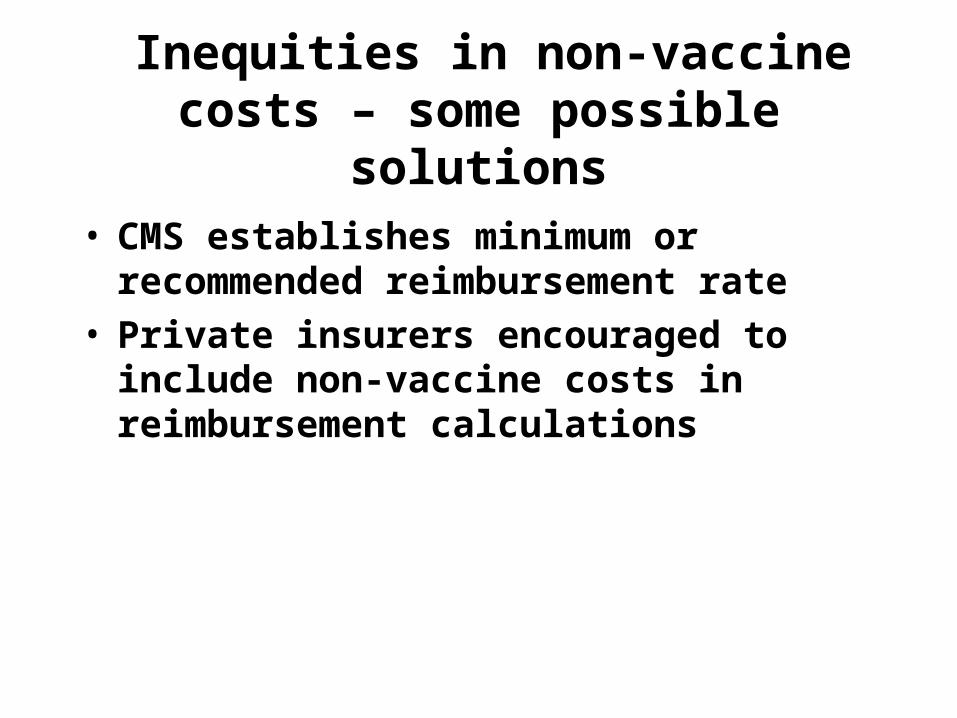
Inequities in non-vaccine costs – some possible solutions
• CMS establishes minimum or recommended reimbursement rate
• Private insurers encouraged to include non-vaccine costs in reimbursement calculations

What is being done
• AAP Task Force on Immunization• NVAC Financing Work Group• IDSA workgroup on adult and adolescent
immunization• AMA/AAP/IDSA National Immunization
Congress
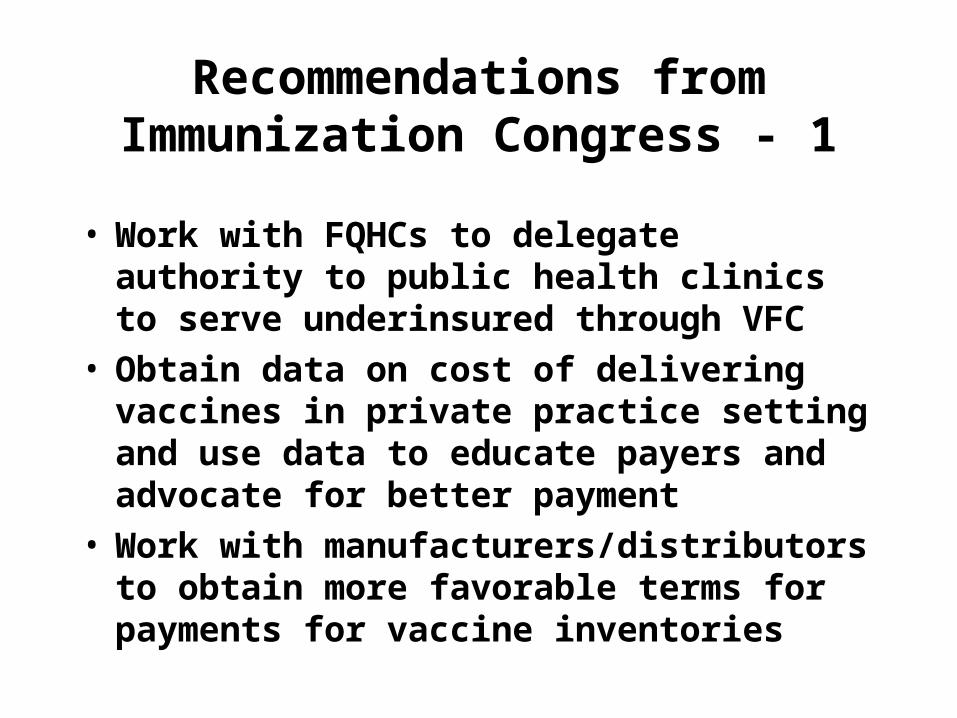
Recommendations from Immunization Congress - 1
• Work with FQHCs to delegate authority to public health clinics to serve underinsured through VFC
• Obtain data on cost of delivering vaccines in private practice setting and use data to educate payers and advocate for better payment
• Work with manufacturers/distributors to obtain more favorable terms for payments for vaccine inventories
Recommendations from Immunization Congress - 2
• Better define components of CPT codes for immunization administration
• Examine potential role of tax credits for insurers or employers in eliminating underinsurance
• Create working group to explore possibility of federal vaccine purchase or funding mechanism
Recommendations from Immunization Congress - 3
• Obtain from CMS the data that led to current Medicare administration fee and use data to advocate at state level for enhanced payment
• Collect data on true cost of obtaining/delivering combination vaccines as opposed to individual vaccines
• Disseminate information on best business practices to minimize vaccine and administration costs

0
20
40
60
80
100
1967 1970 1973 1976 1979 1982 1985 1988 1991 1994 1997 2000 2003
Percent
Increasing Vaccine-Specific Coverage Rates Among Preschool-Aged Children
† DTP(3+) is not a Healthy People 2010 objective. DTP(4) is used to assess Healthy People 2010 objectives.
Note: Children in the USIS and NHIS were 24-35 months of age. Children in the NIS were 19-35 months of age.
Source: USIS (1967-1985), NHIS (1991-1993) CDC, NCHS, and NIS (1994-December 2003), CDC, NIP and NCHS; No data from 1986-1990 due to cancellation of USIS because of budget reductions.
DTP(3+)†
MMR(1+)
Hib (3+)
2010 Target
Hep B (3+)
Polio (3+)
Varicella (1+)
PCV 7 (3+)
2005
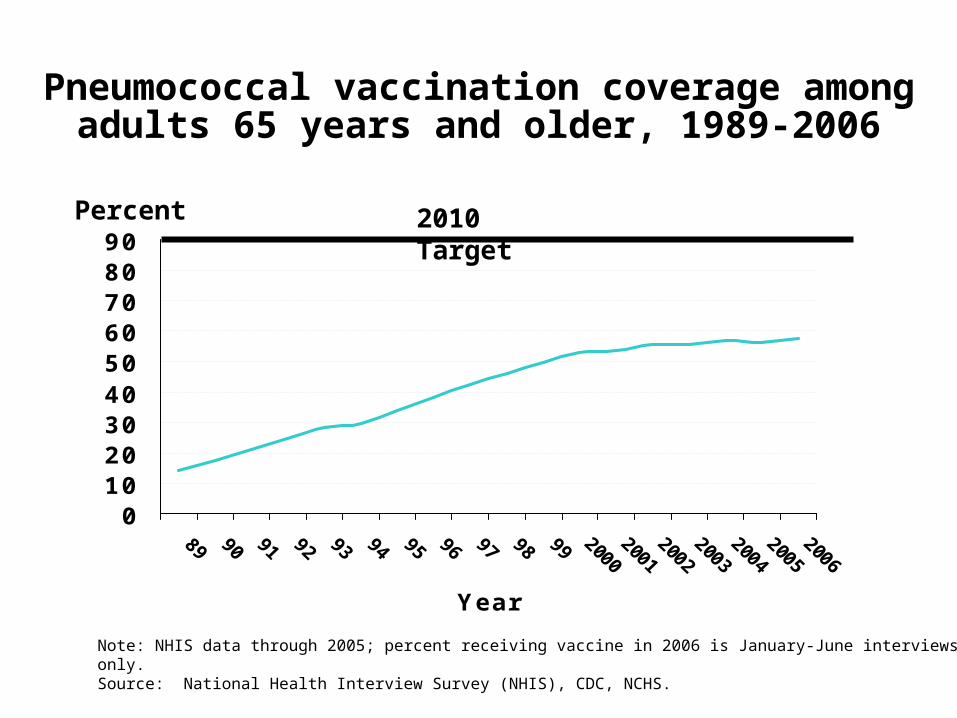
Pneumococcal vaccination coverage among adults 65 years and older, 1989-2006
0102030405060708090
Year
Note: NHIS data through 2005; percent receiving vaccine in 2006 is January-June interviews only. Source: National Health Interview Survey (NHIS), CDC, NCHS.
2010 TargetPercent
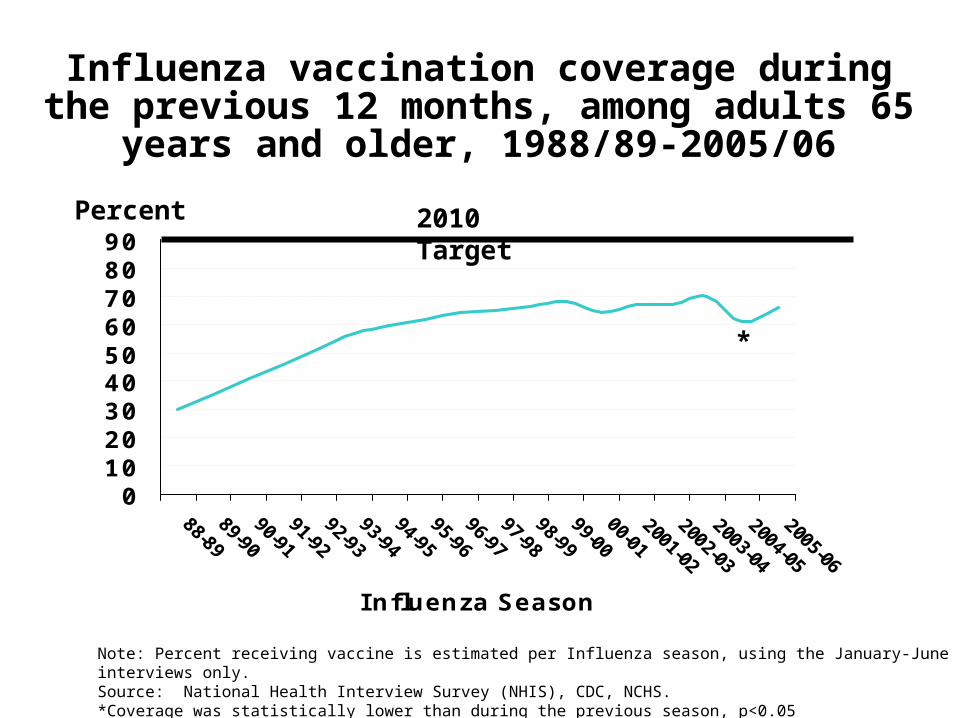
Influenza vaccination coverage during the previous 12 months, among adults 65 years and
older, 1988/89-2005/06
0102030405060708090
Influenza Season
Note: Percent receiving vaccine is estimated per Influenza season, using the January-June interviews only. Source: National Health Interview Survey (NHIS), CDC, NCHS.*Coverage was statistically lower than during the previous season, p<0.05
2010 TargetPercent
*

Influenza vaccination coverage during the previous 12 months among adults 65 years and
older, by race/ethnicity, 1988/89-2004/05
0102030405060708090
88-8989-90
90-9191-92
92-9393-94
94-9595-96
96-9797-98
98-9999-00
2000-01
2001-02
2002-03
2003-04
2004-05
I nfluenza Season
2010 Target
*Can be of any race. Note: Percent receiving vaccine is estimated per influenza season, using the January-June interviews only. Source: National Health Interview Survey (NHIS), CDC, NCHS.
White, Not Hispanic
Hispanic*
Black, Not Hispanic
Percent
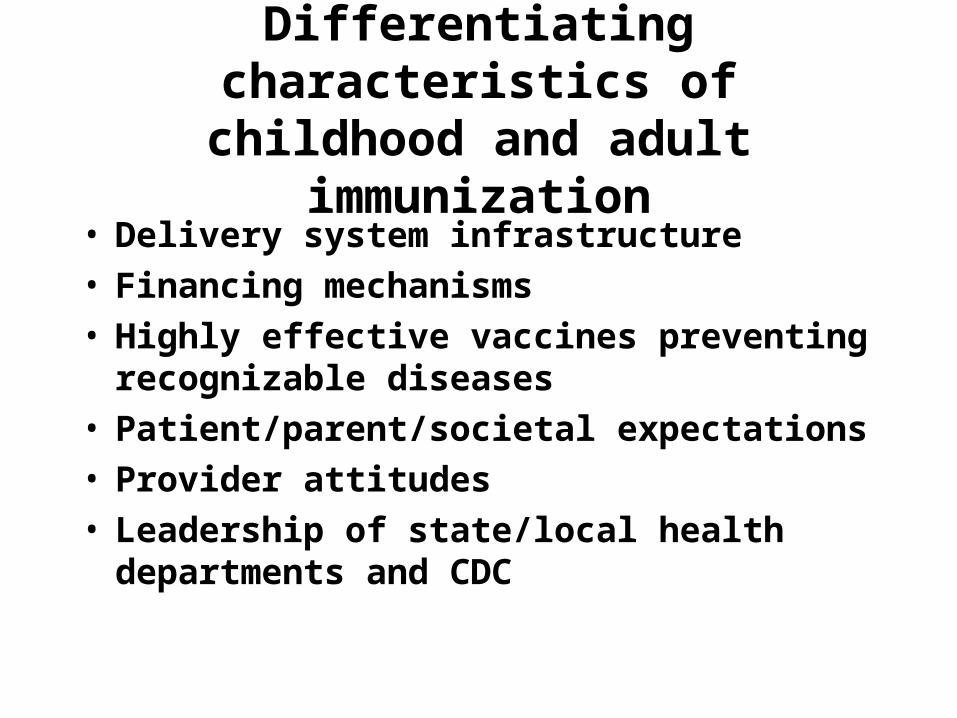
Differentiating characteristics of childhood and adult immunization
• Delivery system infrastructure• Financing mechanisms• Highly effective vaccines preventing
recognizable diseases• Patient/parent/societal expectations• Provider attitudes• Leadership of state/local health
departments and CDC

Delivery system infrastructure
• Both children and adults receive most immunizations in private sector
• Health departments a safety net for children, not so much for adults
• VFC provides strong ties between health departments and private providers; nothing comparable for adults
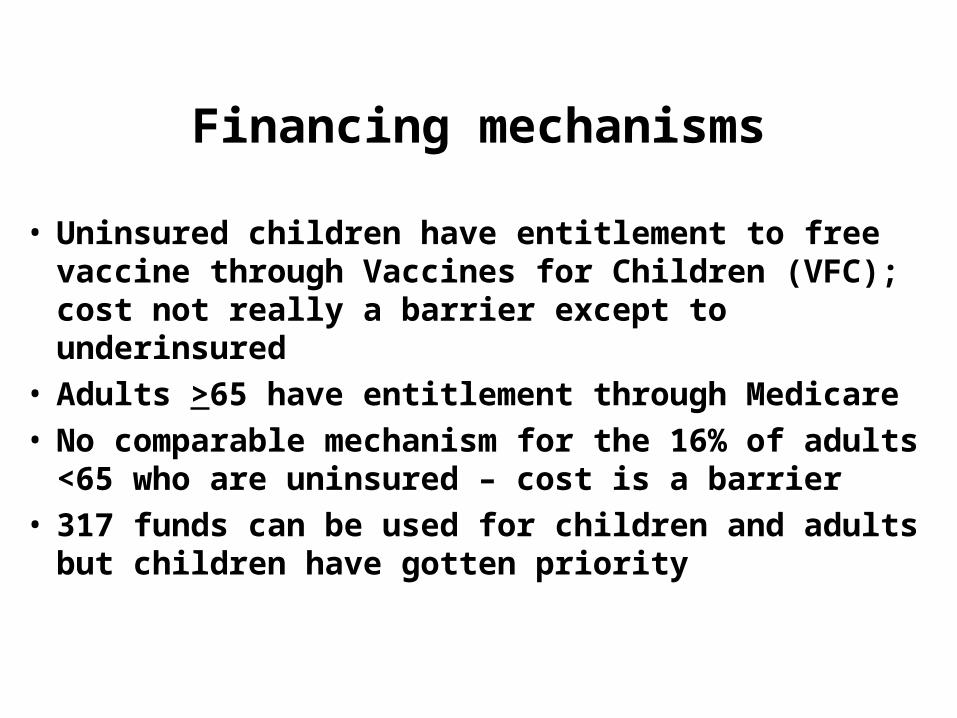
Financing mechanisms
• Uninsured children have entitlement to free vaccine through Vaccines for Children (VFC); cost not really a barrier except to underinsured
• Adults >65 have entitlement through Medicare• No comparable mechanism for the 16% of adults
<65 who are uninsured – cost is a barrier• 317 funds can be used for children and adults
but children have gotten priority

Patient/parent/societal expectations
• School immunization requirements for children
• National vaccine injury compensation program for children
• Nothing comparable for adults

Provider attitudes
• Physician is the most trusted source of information about immunization
• Immunization/well visits a major part of clinical care for children; less so for clinical care of adults
• Pneumococcal and influenza vaccines not as effective as childhood vaccines; may be less perceived benefit to provider
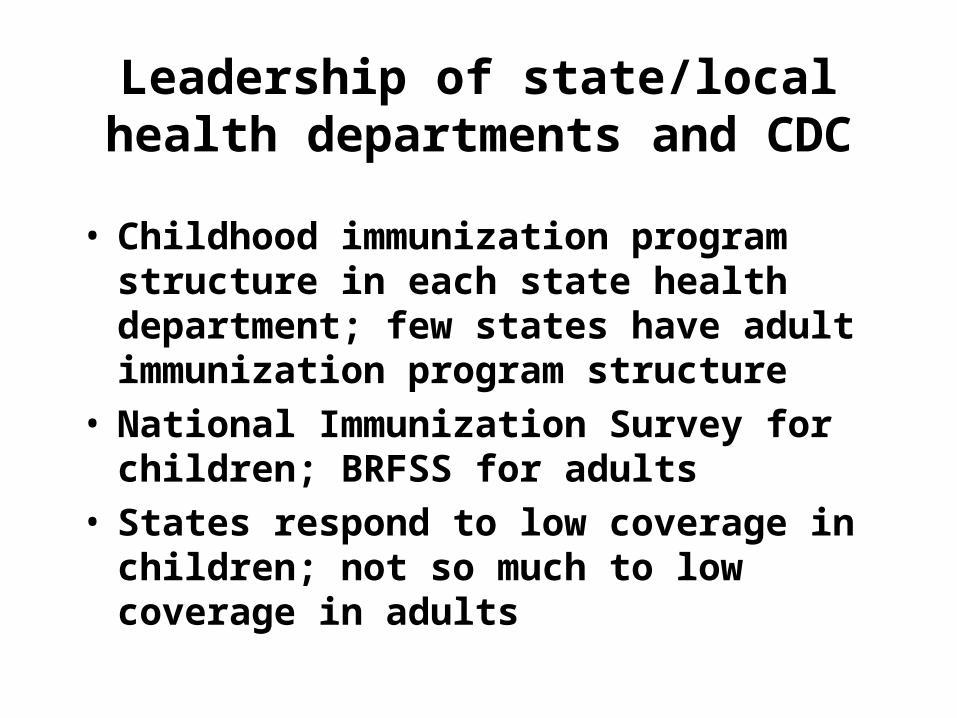
Leadership of state/local health departments and CDC
• Childhood immunization program structure in each state health department; few states have adult immunization program structure
• National Immunization Survey for children; BRFSS for adults
• States respond to low coverage in children; not so much to low coverage in adults

NVAC 2005 recommendations
• Expanded funding through Section 317 to support adolescent and adult immunization programs
• Promotion of “first-dollar” insurance coverage• Assurance of adequate reimbursement for
administration of vaccines• Expanded discussion about the need,
desirability, and feasibility of a variety of approaches to ensure that adults have access to vaccines, even if they do not have insurance
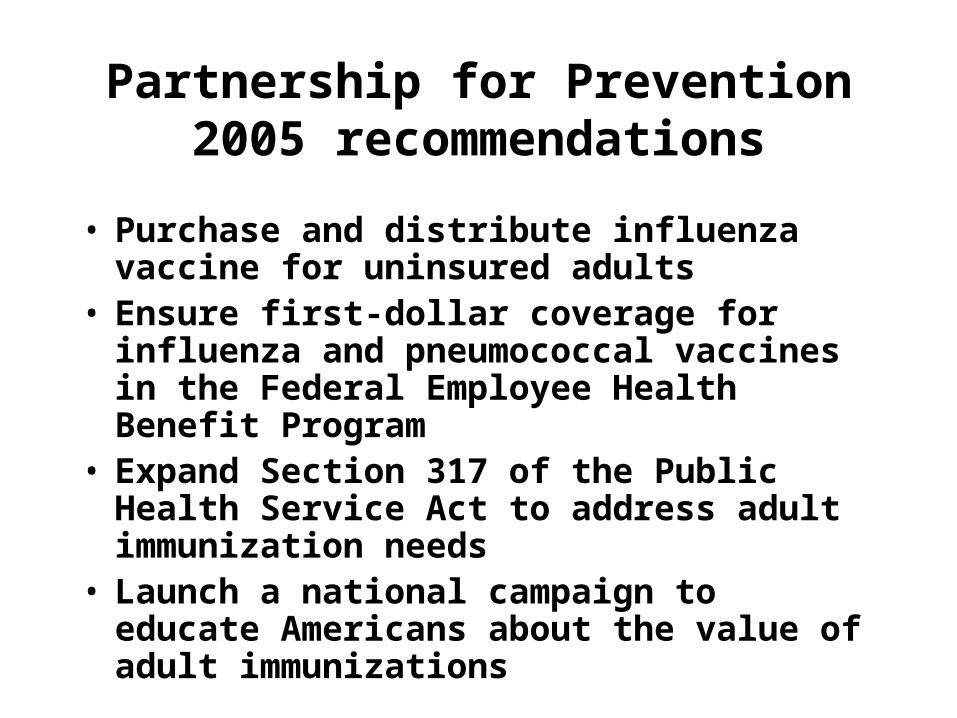
Partnership for Prevention 2005 recommendations
• Purchase and distribute influenza vaccine for uninsured adults
• Ensure first-dollar coverage for influenza and pneumococcal vaccines in the Federal Employee Health Benefit Program
• Expand Section 317 of the Public Health Service Act to address adult immunization needs
• Launch a national campaign to educate Americans about the value of adult immunizations
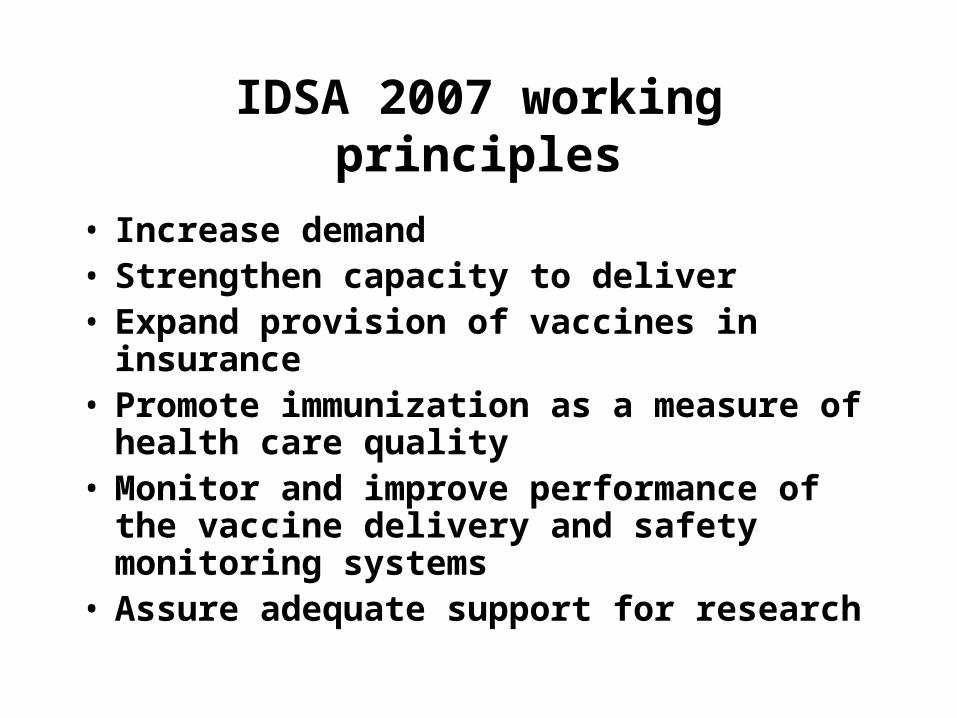
IDSA 2007 working principles
• Increase demand• Strengthen capacity to deliver• Expand provision of vaccines in insurance• Promote immunization as a measure of
health care quality• Monitor and improve performance of the
vaccine delivery and safety monitoring systems
• Assure adequate support for research

What are the minimum actions we should take?
• Increase 317 appropriations with an earmark for adult immunizations
• Establish an infrastructure for promoting/coordinating adult immunizations
• Ensure adequate reimbursement for vaccine administration
• Establish a culture of immunization in those who provide care to adults
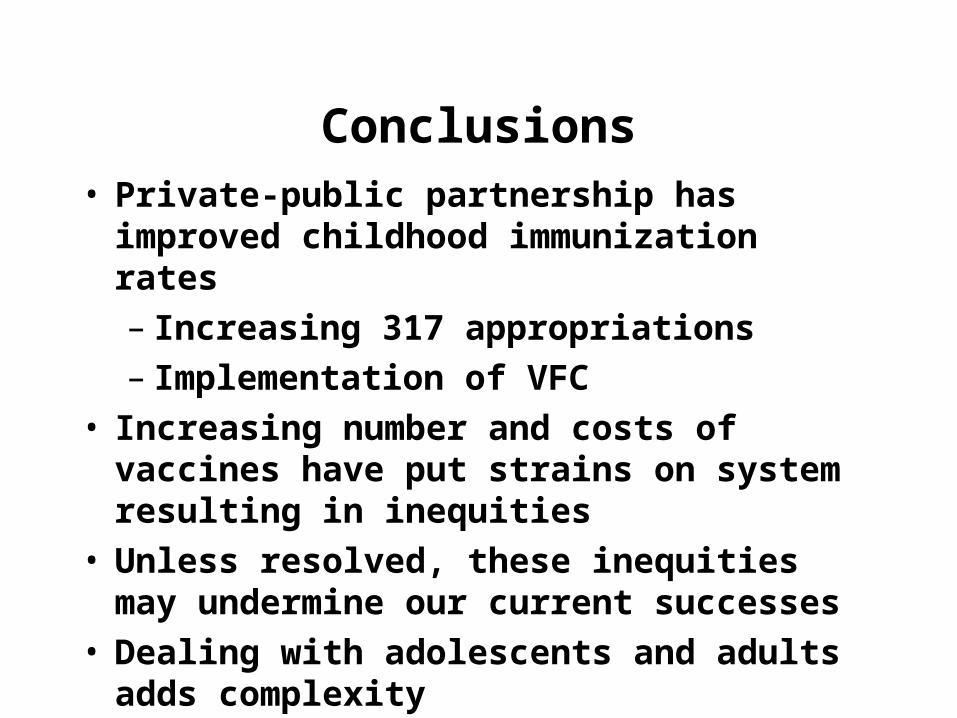
Conclusions• Private-public partnership has improved
childhood immunization rates– Increasing 317 appropriations– Implementation of VFC
• Increasing number and costs of vaccines have put strains on system resulting in inequities
• Unless resolved, these inequities may undermine our current successes
• Dealing with adolescents and adults adds complexity
Recommended