0
Charting the Course for Change: Industry Update
Doug Long VP Industry Relations IMS Health
Perform RX
April 2016

1
-5%
0%
5%
10%
15%
20%
0
50
100
150
200
250
300
350
400
450
% G
row
th
Sa
les (
$B
n)
Spending increased 12.3% to $411Bn in MAT Sept 2015
Growth is 12.2% year to date
Source: IMS Health, National Sales Perspectives, Sept 2015

2
-15%
-10%
-5%
0%
5%
10%
15%
20%
2010 2015 2020
US
$ G
RO
WT
H
Protected Brands Volume Protected Brands Price New Brands
Generics Volume Generics Price Loss of Exclusivity
Total Growth
U.S. Spending Growth, 2010-2020
Source: IMS Health Market Prognosis, IMS Institute for Healthcare Informatics, October 2015
United States
• 2020 Spending:
$560-590Bn
• 2016-20 Growth:
+146Bn
• CAGR 2016-20: 5-8%
• Increase over 2015:
+34%
• 2020 Brand Share of
spending: 67%;
unchanged since
2015
• 2020 Specialty Share
of spending: 34% +
0.4pts; 34% of
increase since 2015

3 US TRx Market Outlook IMS Health Confidential
Historic and Forecast Prescription Growth
Historical Rx growth has been between 1% and 3.5%, (it was much lower during
the economic crisis) and is expected to be between 1.5% and 2.5% through 2020
1.0%
3.6%
2.5%
2.3%
1.2%
1.8% 1.9%
2.2% 2.3% 2.4%
2011 2012 2013 2014 2015 2016 2017 2018 2019 2020

4
HYCD/APAP fell precipitously after rescheduling
The DEA’s August 22, 2014 ruling dramatically affected sales
10,681,268
7,656,651
6,000,000
7,000,000
8,000,000
9,000,000
10,000,000
11,000,000
12,000,000
Jan-1
3
Fe
b-1
3
Ma
r-1
3
Apr-
13
Ma
y-1
3
Jun-1
3
Jul-1
3
Aug-1
3
Sep-1
3
Oct-
13
No
v-1
3
De
c-1
3
Jan-1
4
Feb
-14
Ma
r-1
4
Apr-
14
Ma
y-1
4
Jun-1
4
Jul-1
4
Aug-1
4
Sep-1
4
Oct-
14
No
v-1
4
De
c-1
4
Jan-1
5
Feb
-15
Ma
r-1
5
Apr-
15
Ma
y-1
5
Jun-1
5
Jul-1
5
HYCD/APAP

5
-10%
-5%
0%
5%
10%
15%
20%
25%
30%
0
50
100
150
200
250
300
2010 2011 2012 2013 2014 MATSept 2015
YTDSept 2015
Specialty Medicines Traditonal Medicines
Specialty Growth Traditional Growth
Total Market Growth
Specialty sales growth outpaces that of traditional medicines
Specialty growth rate is 23% compared to traditional growth at 8% YTD
Source: IMS Health, National Sales Perspectives, Sept 2015
Contribution to Growth by Segment

6
Few prescribers/ centers
Low inventory important
Processing of pre-approval essential
and competitive skill
Requires patient training to administer
Support to achieve adherence needed
Cold chain when needed
No need for supplying all pharmacies
through all warehouses
IMS Health definition of Specialty Products
• Initiated only by a specialist
• High expense
• Requires reimbursement assistance
• Generally not oral
• Warrants intensive patient counseling
• Require special handling
• Unique distribution
Medicines that treat specific, complex chronic diseases
with the min 4 of the 7 following attributes:

7
Specialty pharmaceuticals differ from common therapies in a variety of aspects
Common Specialty
Type of Condition Common Acute Common Chronic Complex Chronic Rare Disease
U.S. Patient Population
Millions Affects >50 million Affects ~ 2 million Affects ~ 20K
Duration of Therapy
About 10 days/ episode
Ongoing (maintenance)
Lifelong Lifelong
Cost of Therapy ~ $100/episode $1,000+/year $14,000+/year $250,000/year
Medication Anti-infective Lipitor® HUMIRA ® Cerezyme ®
Indication Acute bacterial infection
Cholesterol reduction
Rheumatoid arthritis Gaucher’s disease
Handling Requirements
No special requirements
No special requirements
Refrigeration training
Refrigeration/ mixing/pumps/ central line training
Typical Distribution Channel
Retail Retail and mail service
Specialty pharmacy, infusion clinics, doctor’s office, home with advanced clinical services
Specialty pharmacy, infusion clinics, doctor’s office, home with advanced clinical services

8
$8.7
$8.6
$5.9
$5.8
$2.5
$2.2
$1.9
$1.4
$1.4
-$1.3
-$1.5
-4 -2 0 2 4 6 8 10
Viral Hepatitis
Antidiabetics
Oncologics
Autoimmune
Multiple Sclerosis
HIV Antivirals
Respiratory
Nervous System
Anticoagulants
Anti-Ulcerants
Mental Health
Antihypertensives
Patent Expiries Protected Brands New Brands Generics
Hepatitis, diabetes, oncology drive spending growth
Non-discounted spending on HCV increased by $8.7Bn in last 12 months
Therapy Class Growth by Segment ($BN) MAT Sept 2015
Source: IMS Health, National Sales Perspectives, Sept 2015

9
New brand spending increased by $19.4B in last 12 months
Drivers: Harvoni, Triumeq, Viekira, Imbruvica, Tecfidera, Ibrance, Opdivo
1.6 3.1 2.5 1.7 2.1
2.9 3.1
2.4 1.7
2.3 0.9 1.2
1.4 1.3
1.6 2.1
1.8 0.8
10.0 9.3
6.7
4.6 6.1 5.8 6.3
19.2 19.4
14.6
2010 2011 2012 2013 2014 MAT Sept2015
YTD Sept2015
Diabetes Other Traditional Multiple Sclerosis Oncology
Autoimmune HIV Antivirals Viral Hepatitis Other Specialty
Source: IMS Health, National Sales Perspectives, Sept 2015
New Brand Spending Growth ($B)

10
Slide auto layout
FOR REFERENCE ONLY
A minority of patients account for the vast majority
of healthcare costs
Percent of Health Plan Members Ranked by Healthcare Spending ($)
Source: IMS PharMetrics, Jun 2012
Top 1%
(≥$48,735)

11
Prevalance Cost Per Year Total Cost to Treat
Alzheimers 5.4 million $35,000 $181 Billion
Cancer 14 Million >$100,000 $1.4 Trillion
High Cholesterol 71 Million >$14,000 $994 Billion
Hep C 3.2 Million <$50,000 $160 Billion
Costly, high use drugs can drive up spend

12
Most notable things about 2015
• Changes at CMS and FDA
• Supreme Court upholds Obamacare
• Hep C exclusive launches and price
wars
• Zarxio Biosimilar Neupogen from
Sandoz launches
• Controlled Substances rescheduled
• Generic Nexium finally arrives
• Flonase OTC
• Abilify, Copaxone and Namenda
• Watch for PD1s and PCSK9s
• Turing and Valeant
• Merger Mania
• Endo & Par
• Teva & Actavis
• Hikma and Roxane
• Lupin and Gavis
• Lannett and Kremers Urban
• Pfizer & Hospira
• Abbvie & Pharma Cyclics
• Valeant & Dendreon
• Valeant & Salix
• Optum and Catamaran
• Anthem and Cigna
• Aetna and Humana
• CVS & Omnicare
• CVS buys Target pharmacies
• Walgreens and Rite Aid
13
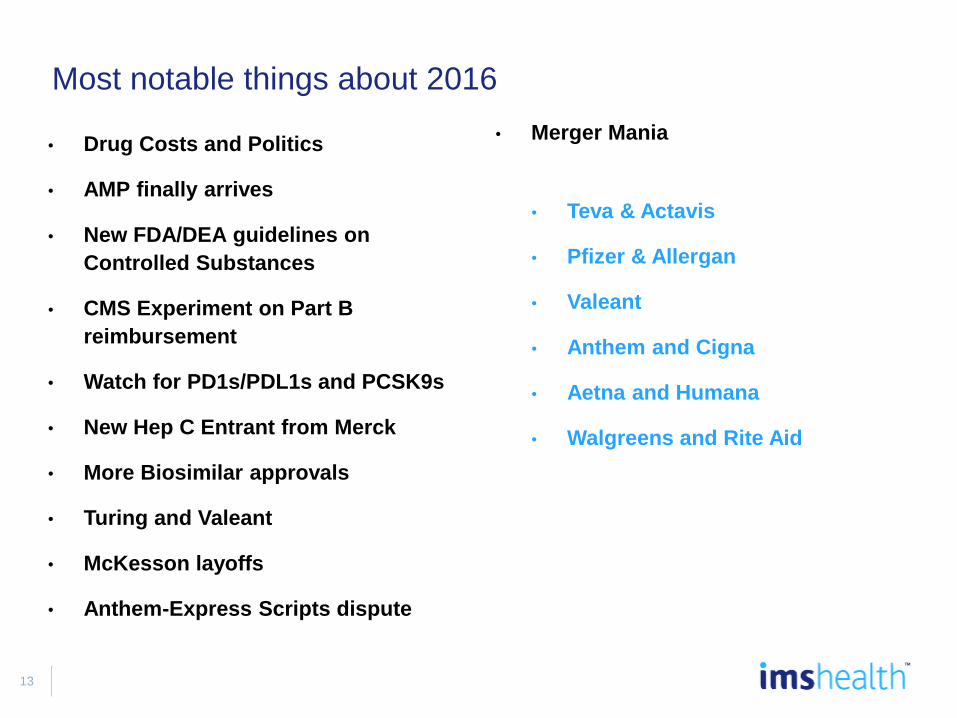
Most notable things about 2016
• Drug Costs and Politics
• AMP finally arrives
• New FDA/DEA guidelines on
Controlled Substances
• CMS Experiment on Part B
reimbursement
• Watch for PD1s/PDL1s and PCSK9s
• New Hep C Entrant from Merck
• More Biosimilar approvals
• Turing and Valeant
• McKesson layoffs
• Anthem-Express Scripts dispute
• Merger Mania
• Teva & Actavis
• Pfizer & Allergan
• Valeant
• Anthem and Cigna
• Aetna and Humana
• Walgreens and Rite Aid

14
Channels US$Bn% Market
Share% Growth
Retail 71.2 62.5 29.0
Chain/Mass 11.2 9.9 15.0
Mail service 49.6 43.5 33.1
Independents 8.7 7.7 30.4
Food stores 1.6 1.4 11.8
Institutional 42.8 37.5 12.0
Clinics 25.6 22.4 11.9
Hospitals 10.7 9.4 7.5
Long-term care 2.3 2.0 17.4
Home health care 2.3 2.1 10.9
HMO 1.4 1.3 49.0
Others 0.4 0.3 24.3
Total 114.0 100.0 22.1
MAT Sep 2015
Specialty Pharmaceuticals growth is 22.1%
Source: IMS Health, National Sales Perspectives, MAT Sep 2015

15
Channels US$Bn% Market
Share% Growth
Retail 224.4 75.1 7.8
Chain/Mass 119.3 39.9 6.3
Mail service 44.4 14.9 8.4
Independents 37.9 12.7 11.4
Food stores 22.9 7.7 8.6
Institutional 74.3 24.9 12.8
Clinics 29.2 9.8 18.5
Hospitals 25.1 8.4 11.0
Long-term care 14.4 4.8 4.1
Home health care 1.5 0.5 19.9
HMO 3.2 1.1 17.9
Others 0.7 0.3 8.7
Total 298.7 100.0 9.0
MAT Sep 2015
Traditional Pharmaceuticals growth is 9.0%
Source: IMS Health, National Sales Perspectives, MAT Sep 2015

16
Generics share of sales growth
2011
Brands
58%
42%
MAT Sep 2015
Brands
91%
Generics
9%
Source: IMS Health, National Sales Perspectives, Branded generics disaggregated, Sep 2015
AC = +$45bn AC = +$13bn
% Contribution to growth US$
Branded Generics Disaggregated

17
• Savings from generics reach $5
billion/week (Nexium and Abilify)
• Teva buys Actavis; will control one-fifth of
Gx market
• Mylan-Perrigo deal fails
• First biosimilar is launched
• Glatopa competes with Copaxone
• Congress and DOJ begins deep dive into
generic pricing
• Generic price inflation ebbs
• Biosimilars Council is launched
• Signs of GDUFA progress despite growing
backlog
• House passes 21st Century Cures
• Industry loses bid to overturn drug take-
back ordinance
• Generics become “pay-for” with CPI rebate
penalty
• Labeling rule stalled but still coming
• New track-and-trace requirements for
supply chain
• Provigil consent decree impacts settlement
paradigm
Notable Generic events in 2015

18
87% 86% 83% 83% 83% 83%
30% 27% 22% 19% 18% 17%
13% 14% 17% 17% 17% 17%
70% 73% 78% 81% 82% 83%
2010 2011 2012 2013 2014 Sept2015
2010 2011 2012 2013 2014 2015
Dollars (%) Prescriptions (%)
Brands Generics
83% of prescriptions are dispensed as generics
Generics account for 17% of spending
Source: IMS Health, National Sales Perspectives, Sept 2015, National Prescription Audit, Dec 2015
Branded Generics Disaggregated

19
• HEP C Innovation, PD1s,
PCSK9s, & Orphan Drugs and
Pricing
• Patient as a Payer
– Specialty tiers in exchanges
• Growing demand for value driven
metrics (CE and RWE)/adoption
of guidelines
• Copaxone ® 3X weekly and
Copaxone ® generic/Glatopa
• Specialty space gets more
crowded with new entrants and
more orals are coming
• The first Biosimilar launch
• More Co Pay programs
cooperation by payers
Top Specialty events in 2015!

20
0
200
400
600
800
1,000
1,200
1,400
1,600
1,800
2005 2006 2007 2008 2009 2010 2011 2012 2013 2014
Older Generics Newer Generics$1,683Bn
$638Bn
$1,045Bn
The U.S. healthcare system has saved $1.7 trillion in the last ten years due to the availability of low cost generics
Savings from generics launched 2005-14 total $638Bn over last 10 years
Source: IMS Health, MIDAS, Q2 2015
Cumulative Ten Year Savings from Older and Newer Generics ($BN)
Launched Pre-2005 Launched 2005-14

21
$15.7 $16.5
$32.7
$9.6 $9.3
$23.0 $22.2 $21.4
$23.4
$9.0
0
5
10
15
20
25
30
35
2010 2011 2012 2013 2014 2015* 2016* 2017* 2018* 2019*
Brands facing LOE in the next 5 years are valued at $99Bn
2015: Abilify, Nexium, Namenda; 2016: Crestor, Gleevec, maybe Advair?
U.S. Small Molecule Patent Expiry Exposure
$99.1Bn at Risk in Next 5 Years
Sales in year prior to expiry used for years 2009-15; sales in MAT Sept 2015 used for years 2016-19
Source: IMS Health, National Sales Perspectives, Sept 2015
22
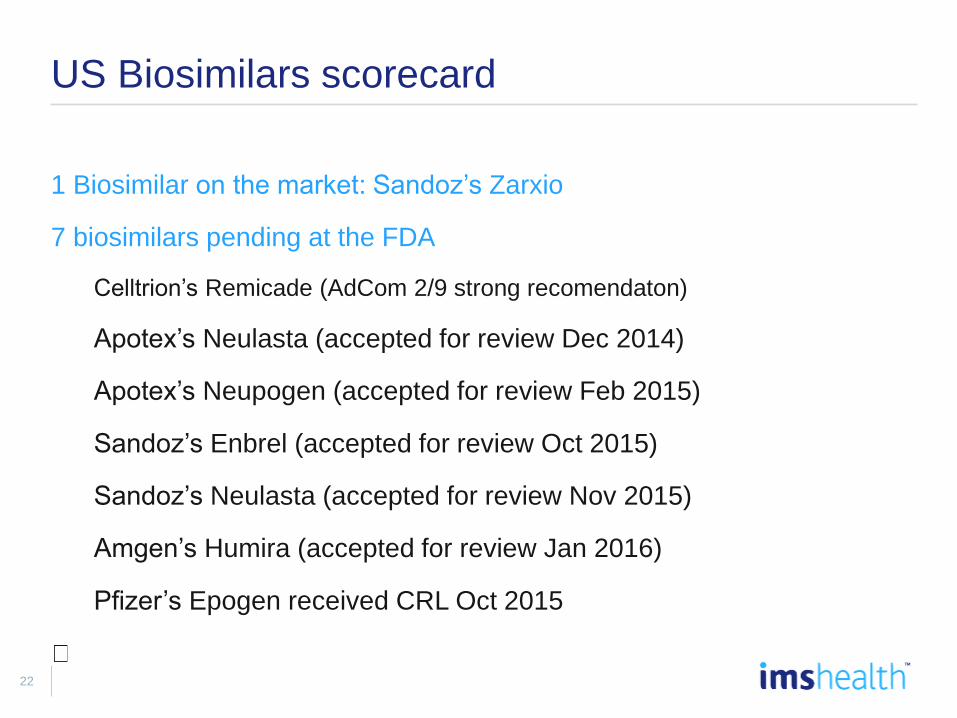
1 Biosimilar on the market: Sandoz’s Zarxio
7 biosimilars pending at the FDA
Celltrion’s Remicade (AdCom 2/9 strong recomendaton)
Apotex’s Neulasta (accepted for review Dec 2014)
Apotex’s Neupogen (accepted for review Feb 2015)
Sandoz’s Enbrel (accepted for review Oct 2015)
Sandoz’s Neulasta (accepted for review Nov 2015)
Amgen’s Humira (accepted for review Jan 2016)
Pfizer’s Epogen received CRL Oct 2015
US Biosimilars scorecard
23
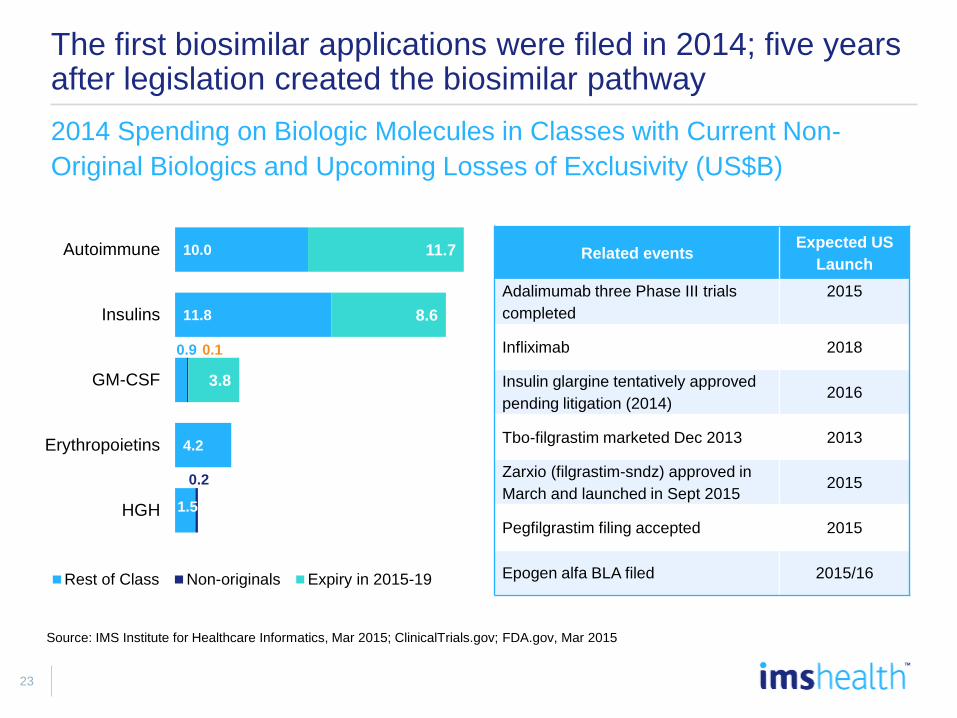
The first biosimilar applications were filed in 2014; five years after legislation created the biosimilar pathway
2014 Spending on Biologic Molecules in Classes with Current Non-
Original Biologics and Upcoming Losses of Exclusivity (US$B)
1.5
4.2
0.9
11.8
10.0
0.2
0.1
3.8
8.6
11.7
HGH
Erythropoietins
GM-CSF
Insulins
Autoimmune
Rest of Class Non-originals Expiry in 2015-19
Source: IMS Institute for Healthcare Informatics, Mar 2015; ClinicalTrials.gov; FDA.gov, Mar 2015
Related events Expected US
Launch
Adalimumab three Phase III trials
completed
2015
Infliximab 2018
Insulin glargine tentatively approved
pending litigation (2014) 2016
Tbo-filgrastim marketed Dec 2013 2013
Zarxio (filgrastim-sndz) approved in
March and launched in Sept 2015 2015
Pegfilgrastim filing accepted 2015
Epogen alfa BLA filed 2015/16

24
In contrast to small molecule GX, biosimilar development and marketing pose serious challenges for aspiring players
Biosimilars vs.
Generics – a
different
game?
CLINICAL DEVELOPMENT
Average cost is around 200M$, with a
significant range of variation (from 40 to
375 M$) vs. 1 to 4M$ for a generic drug
MANUFACTURING COSTS
Difficulties in rationalizing
manufacturing costs due to limited
scale, at least in the short term
REGULATORY AND MARKET
ACCESS
Uncertain regulatory framework (aside
from Europe), price competition less
relevant compared to generics
SALES AND MARKETING
CAPABILITIES
Need to adopt
a branded mentality to win stakeholder
trust

25
Reasons for Generic Price Inflation
Regulatory/Quality – with the increased scrutiny from the FDA,
manufacturers need to invest more into their quality systems and
when a quality / supply issue arises due to 483s, it creates the
opportunity to increase prices to recoup part of their investment
Customer consolidation – with the increased purchasing power of
the customers, manufacturers need to make up value on products
where they can
Fewer new product launches – generic manufacturers make money
by launching new products, reducing CGS, M&A activity and raising
prices; with fewer launches, it puts more pressure on the “in-line”
product portfolio which again is a driver to increase prices

26
• Use of medicines in 2020 will include 943 New Active Substances introduced in the prior
25 years, new medicines in recent years will be weighted to specialty and biologics
• Patients will have greater access to breakthrough therapies, clusters of innovation around
hepatitis C, autoimmune diseases, heart disease, orphan diseases and others by 2020
• Cancer treatments represent the largest category of the 225 new medicines expected to
be introduced within the next five years
• Technology will enable changes to treatment protocols, shift patient engagement,
accountability and patient-provider interaction accelerating the adoption of behavior
changes proven to improve patient adherence to treatments
• By 2020, over 470 drugs will be available to treat orphan diseases for the 7,000 rare
diseases with no or limited treatments available
• While global medicine spending on orphan is expected to be 1-2%, it will be as much as
10% in developed markets such as the U.S.
Transformation in Disease Treatments
Innovation drives transformation of disease treatments in 2020

27
FDA Approval Numbers over the years…
Year Total Approvals Specialty Percentage
2005 19 8 42.1%
2006 20 10 50.0%
2007 18 11 61.1%
2008 26 11 42.3%
2009 28 13 46.4%
2010 22 14 63.6%
2011 32 17 53.1%
2012 40 24 60.0%
2013 29 18 62.1%
2014 50 26 52.0%
as of 9/17/2015 27 15 55.6%
Total 311 167
Avg. 2005-2014 28.4 15.2 53.5%
Avg. 2010-2015 33 19 57%
28
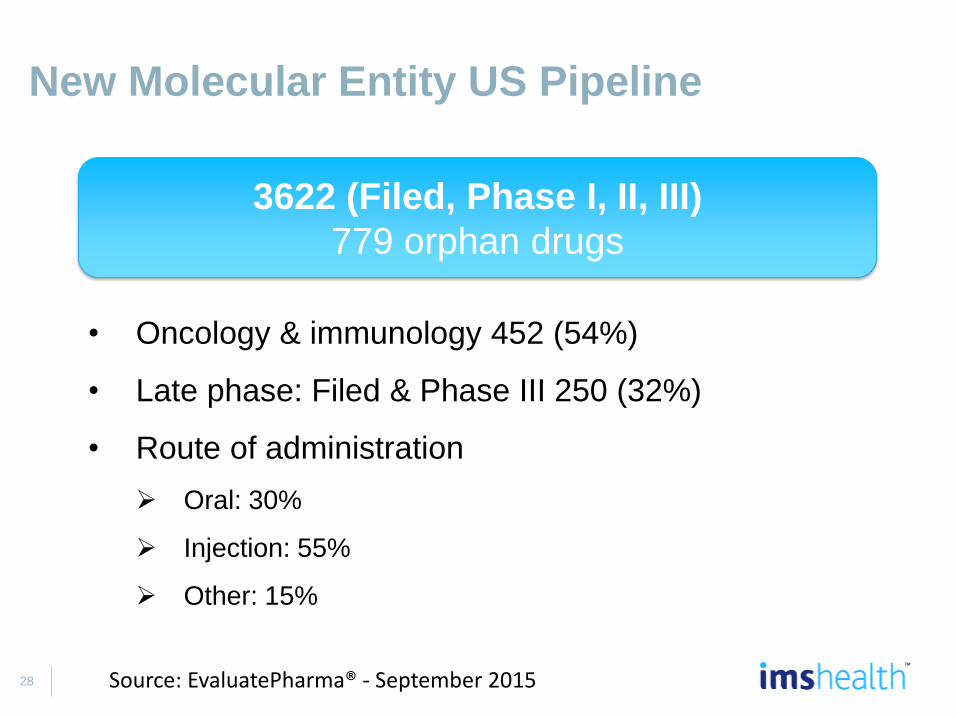
New Molecular Entity US Pipeline
Source: EvaluatePharma® - September 2015
• Oncology & immunology 452 (54%)
• Late phase: Filed & Phase III 250 (32%)
• Route of administration
Oral: 30%
Injection: 55%
Other: 15%
3622 (Filed, Phase I, II, III)
779 orphan drugs
29
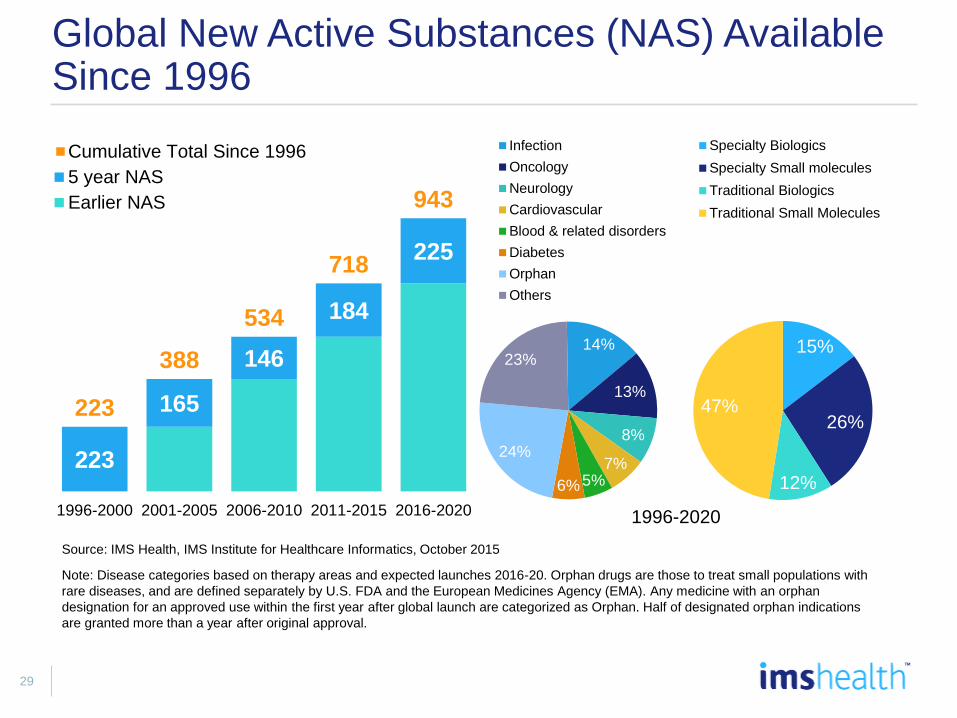
14%
13%
8%
7% 5% 6%
24%
23%
Infection
Oncology
Neurology
Cardiovascular
Blood & related disorders
Diabetes
Orphan
Others
223
165
146
184
225
223
388
534
718
943
1996-2000 2001-2005 2006-2010 2011-2015 2016-2020
Cumulative Total Since 1996
5 year NAS
Earlier NAS
Global New Active Substances (NAS) Available Since 1996
Source: IMS Health, IMS Institute for Healthcare Informatics, October 2015
15%
26%
12%
47%
Specialty Biologics
Specialty Small molecules
Traditional Biologics
Traditional Small Molecules
Note: Disease categories based on therapy areas and expected launches 2016-20. Orphan drugs are those to treat small populations with
rare diseases, and are defined separately by U.S. FDA and the European Medicines Agency (EMA). Any medicine with an orphan
designation for an approved use within the first year after global launch are categorized as Orphan. Half of designated orphan indications
are granted more than a year after original approval.
1996-2020

30
2016-2020 Oncologic NAS by Mechanism
Targeted
Cytotoxics
Hormonals
Radiopharmaceuticals
2016-2020 Oncologic NAS by Type of Targeting
No Biomarker
Biomarker
Novel Active Substances (NAS) for Cancer by Mechanism, Targeting Type and Patient Population
2016-2020 Oncologic NAS by Patient Population
Non-Orphan
Orphan
Source: IMS Health Market Prognosis, IMS Institute for Healthcare Informatics, October 2015
91% 33% 33%

31
0
5
10
15
20
25
30
35
40
2011 2012 2013 2014 2015 2016 2017 2018 2019 2020
Developed Pharmerging
Global Estimated Treated Patients and Spending on Viral Hepatitis through 2020; Estimated 180 Million Infected
Source: IMS Health Market Prognosis, IMS Institute for Healthcare Informatics, October 2015
Share of
Spending on
Hepatitis C in
2020; US$
CU
MU
LA
TIV
E T
RE
AT
ED
PA
TIE
NT
S M
N
Developed markets will begin to exhaust
warehoused patients and begin treating
less severely affected patients before 2020
Pharmerging markets will have treated
fewer than one-fifth of their infected
populations by 2020
36 Mn
3 Mn
$6Bn
$30Bn

32
Hepatitis, diabetes, autoimmune are fastest growing classes
Spending increased in 7 of the top 10 therapy areas
Rank MAT Sept 2015 Sales ($Bn) Share (%) Growth (%) 2011-15 CAGR
Total U.S. Market 411.0 100.0 12.3 5.7
1 Antidiabetes 39.1 9.5 28.9 16.9
2 Oncology 37.4 9.1 18.2 10.8
3 Autoimmune 28.0 6.8 27.3 20.9
4 Respiratory 23.5 5.7 9.4 3.7
5 Mental Health 21.8 5.3 -8.0 -6.6
6 Pain 20.0 4.9 -1.0 2.7
7 Viral Hepatitis 17.7 4.3 90.0 76.4
8 Multiple Sclerosis 16.6 4.0 17.6 23.6
9 HIV Antivirals 16.0 3.9 16.0 12.0
10 Lipid Regulators 13.5 3.3 -3.3 -7.2
Top 10 233.5 56.8 16.5 8.7
1
2
2
1
1
6
Source: IMS Health, National Sales Perspectives, Sept 2015
1
1

33
Sales of anti-ulcerants fell 13.6% following the Nexium expiry
Top twenty therapy classes represent 79% of total spending
Rank MAT Sept 2015 Sales ($Bn) Share (%) Growth (%) 2011-15 CAGR
11 Antihypertensives 10.8 2.6 -12.7 -7.4
12 Nervous System 10.7 2.6 15.8 8.8
13 ADHD 10.6 2.6 6.3 7.1
14 Dermatologicals 10.5 2.6 14.4 11.1
15 Anticoagulants 9.4 2.3 16.7 -4.9
16 Antibacterials 8.4 2.0 -5.3 -4.1
17 Anti-Ulcerants 8.2 2.0 -13.6 -8.2
18 Vaccines excl flu 8.1 2.0 25.3 12.4
19 Other Cardiovasculars 7.1 1.7 15.8 15.7
20 GI Products 6.7 1.6 23.3 15.2
Top 20 324.0 78.8 13.4 6.4
1
2
2
1
Source: IMS Health, National Sales Perspectives, Sept 2015
2
5
1
2

34
Medicines to treat chronic diseases drive script growth
Prescriptions for diabetes meds rose 5.1% in the last 12 months
Rank MAT Sept 2015 TRx (Mn) Share (%) Growth (%)
Total U.S. Market 4,363 100.0 1.5
1 Antihypertensives 705 16.2 0.1
2 Mental Health 545 12.5 2.1
3 Pain 471 10.8 -3.0
4 Antibacterials 271 6.2 2.6
5 Lipid Regulators 261 6.0 -1.1
6 Antidiabetes 209 4.8 5.1
7 Nervous System Disorders 186 4.3 5.6
8 Respiratory 175 4.0 4.9
9 Anti-Ulcerants 172 3.9 1.2
10 Antithyroid 133 3.0 1.5
Top 10 3,127 71.7 1.1
Source: IMS Health, National Prescription Audit, Sept 2015

35
The 10 most commonly dispensed medicines of 2015
MAT Dec 2015
Rank MAT Dec 2015 TRx Share (%) Growth (%)
Total U.S. Market 4,368 100.0 1.0
1 levothyroxine 121 2.8 0.6
2 lisinopril 106 2.4 2.0
3 acetaminophen-hydrocodone 97 2.2 -18.3
4 atorvastatin 93 2.1 15.2
5 metoprolol 86 2.0 1.0
6 amlodipine 82 1.9 4.1
7 metformin 80 1.8 4.5
8 omeprazole 77 1.8 2.3
9 albuterol 70 1.6 4.0
10 simvastatin 66 1.5 -9.7
Top 10 877 20.1 -0.2
Source: IMS Health, National Prescription Audit, Dec 2015

36
Products Company US$mn% Market
Share% Growth
US Industry 411,049 100.0 12.3
1 Harvoni® GS- 12,841 3.1
2 Humira® AV1 9,279 2.3 36.0
3 Enbrel® AAI 6,333 1.5 14.0
4 Crestor® AZN 6,248 1.5 7.8
5 Abilify® OTS 5,912 1.4 -21.6
6 Lantus Solostar® S.A 5,215 1.3 24.8
7 Remicade® JAN 4,801 1.2 7.5
8 Advair Diskus® GSK 4,800 1.2 -3.1
9 Copaxone® TVN 4,388 1.1 12.8
10 Nexium® AZN 4,102 1.0 -33.2
Top 10 63,918 15.6 29.5
MAT Sep 2015
Sales of leading products
Source: IMS Health, National Sales Perspectives, Sep 2015
37
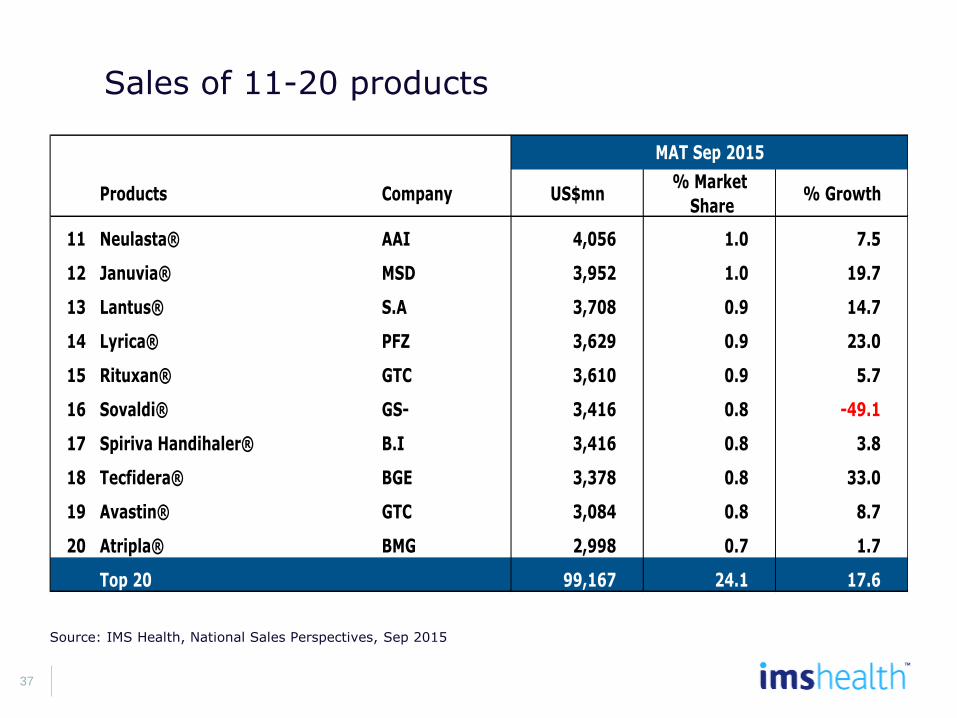
Products Company US$mn% Market
Share% Growth
11 Neulasta® AAI 4,056 1.0 7.5
12 Januvia® MSD 3,952 1.0 19.7
13 Lantus® S.A 3,708 0.9 14.7
14 Lyrica® PFZ 3,629 0.9 23.0
15 Rituxan® GTC 3,610 0.9 5.7
16 Sovaldi® GS- 3,416 0.8 -49.1
17 Spiriva Handihaler® B.I 3,416 0.8 3.8
18 Tecfidera® BGE 3,378 0.8 33.0
19 Avastin® GTC 3,084 0.8 8.7
20 Atripla® BMG 2,998 0.7 1.7
Top 20 99,167 24.1 17.6
MAT Sep 2015
Sales of 11-20 products
Source: IMS Health, National Sales Perspectives, Sep 2015

38
DollarsAC
US$mnTotal Rx Dispensed
AC
TRxsmn
Harvoni® (Gs-) 12841 atorvastatin ca (atx) 9.1
Humira® (Av1) 2458 lisinopril (lu.) 6.7
Levemir Flextouch® (N-N) 2326 lisinopril (a6d) 6.7
Prevnar 13® (Pfz) 1273 amoxicillin (tev) 6.4
Lantus Solostar® (S.A) 1038 levothyroxine (sdz) 6.3
Invokana® (Jan) 965 fluticasone prop (atx) 5.9
Tecfidera® (Bge) 839 furosemide (myn) 5.5
esomeprazole mag (tev) 818 lorazepam (atv) 5.4
Eliquis® (Bmp) 812 atorvastatin ca (myn) 5.1
Xarelto® (Jan) 792 gabapentin (cm7) 4.8
Largest absolute growth by leading products, Sales & TRx (MAT)
Source: IMS Health, National Sales Perspectives, Sep 2015, National Prescription Audit, Sep 2015

39
Dollars AC US$BN TRx AC TRx mn
Gilead Sciences,In 11.2 Accord Healthcare 23.7
Abbvie Inc 2.7 Apotex Corp 15.3
Novo Nordisk 2.5 Torrent Pharma 13.4
Sanofi Aventis 2.5 Lupin Pharma 13.2
Johnson & Johnson 2.4 Aurobindo Pharma 11.7
Merck & Co 2 Glenmark Pharma 9.2
Teva 2 Camber Pharma 8.6
Amgen Corporation 1.7 Unidentified 7.8
Valeant Corp 1.6 Bluepoint Labs 7.6
Biogen Idec Corp 1.5 Solco Healthcare 7.5
Largest absolute growth by leading corporations, Sales & TRx (MAT)
Source: IMS Health, National Sales Perspectives, Sep 2015, National Prescription Audit, Sep 2015

40
US$mn% Market
Share% Growth
US Industry 411,049 100.0 12.3
1 Gilead Sciences 26,557 6.5 73.2
2 Johnson & Johnson 20,557 5.0 13.1
3 Merck & Co 20,478 5.0 10.7
4 Novartis (incl Sandoz) 20,073 4.9 -2.2
5 Astrazeneca 19,291 4.7 -1.7
6 Teva 19,120 4.7 11.5
7 Pfizer (incl Greenstone) 18,969 4.6 6.1
8 Amgen Corporation 18,045 4.4 10.7
9 Genentech 17,752 4.3 4.8
10 Allergan, Inc 16,791 4.1 1.1
Top 10 197,634 48.1 11.6
MAT Sep 2015
Leading corporations
Sales of leading corps
Source: IMS Health, National Sales Perspectives, Sep 2015

41
Company Dollar
Share
1 Teva/Actavis 21.6
2 Mylan 10.6
3 Sandoz 7.5
4 Endo/Par 6.1
5 Sun 3.7
6 Dr. Reddy’s 2.6
7 Hospira 2.5
8 Lupin 2.4
9 Apotex 2.2
10 Greenstone 2.2
Company TRX Share
1 Teva/Actavis 18.9
2 Mylan 9.2
3 Sandoz 7.2
4 Endo/Par 6.2
5 Lupin 5.6
6 Amneal 4.1
7 Sun 3.4
8 Zydus 3.3
9 Aurobindo 3.3
10 Apotex 2.9
The top 10- post mergers (MAT Sept 2015)
Top 10 Dollars is 61.9% Top 10 TRX is 64.4%

42
Cost Containment Opportunities
Sources: 1. Jencks SF, Williams MV, Coleman EA. Rehospitalizations among Patients in the Medicare Fee-for-Service Program. New England Journal of Med. 2009;360(14):1418–28 2. MedPAC. Report to Congress: Promoting Greater Efficiency in Medicare, Oct 2008 3. David Blumenthal, MD, “More focus on high-cost patients could save $300B,” Healthcare Finance News, Apr. 2012 4. IMS Institute, Advancing the Responsible Uses of Medicines, October 2012 5. Lars Osterberg and Terrence Blaschke, “Adherence to Medication,” New England Journal of Medicine, 2005
Coordination of Care
Treating 60% of high-cost chronic condition patients
yields $300B in savings over 10 years3
1.1% of global total health expenditure or 62B worldwide, can be avoided
with timely treatment4
$62B
$300B
Pharmacy
Prescriptions not taken as directed5 drive $260B in additional care costs4
8% of total health expenditure = $500B globally can be avoided with
optimized use of medicines4
$500B
50%
Readmissions
1 in 5 Medicare FFS patients readmit within 30 days
of discharge1
13.4% or 21,000 AMI Medicare admissions readmit within
15 days, at a cost of $136M2
20%
AMI
readmissions
21K

43
The focus of study was limited to six areas where there is opportunity to increase the value of medicines
Medicine access and pricing were not addressed
Medication nonadherence
Delayed evidence-based
treatment
Medication errors
Suboptimal generics use
Mismanaged polypharmacy
Antibiotic misuse
Improvement in
health
outcomes
Decline in
healthcare
costs
Increase in
medicines
value
44
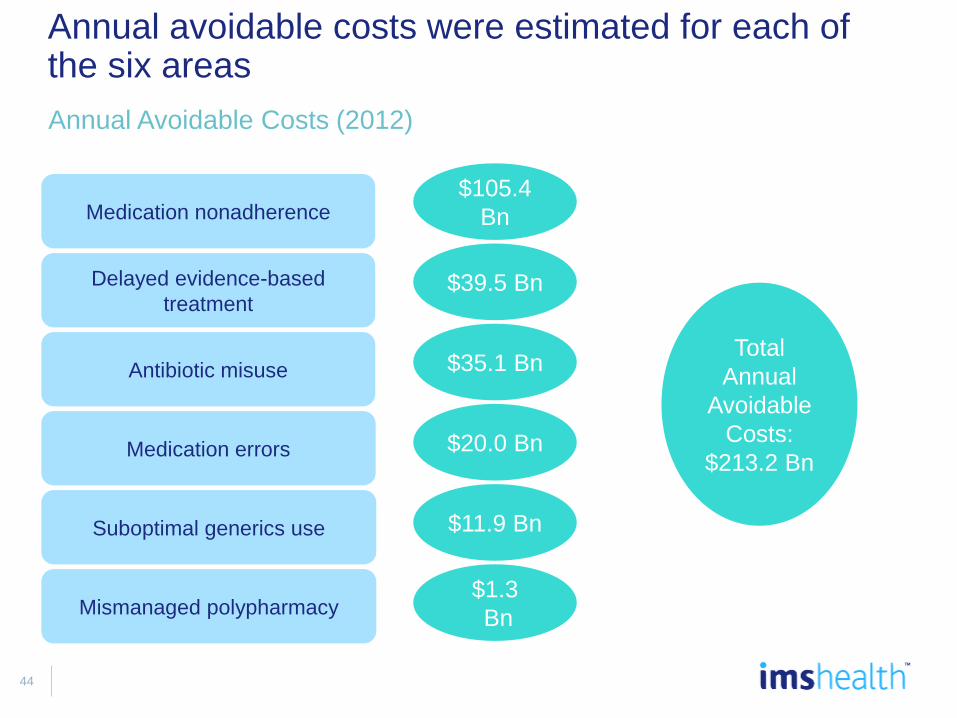
Annual avoidable costs were estimated for each of the six areas
Medication nonadherence
Delayed evidence-based
treatment
Medication errors
Suboptimal generics use
Mismanaged polypharmacy
Antibiotic misuse
$105.4
Bn
Annual Avoidable Costs (2012)
$39.5 Bn
$35.1 Bn
$20.0 Bn
$11.9 Bn
$1.3
Bn
Total
Annual
Avoidable
Costs:
$213.2 Bn

45
These costs represent avoidable healthcare services utilized by millions of patients
14045
22
6
10 million hospitalizations
78 million outpatient visits
246 million prescriptions
4 million emergency room visits
Source: Avoidable Costs in U.S. Healthcare Study
Millions of lives affected $213 Bn
Avoidable Costs, US
($Bn)
Utilization

46
Insurance coverage has been shifting to higher deductibles and to capping out-of-pocket costs over the past decade
Percentage of Employer-Based Insurance 2006-2014
3%
18%
4%
20% 22%
7%
2006 2007 2008 2009 2010 2011 2012 2013 2014
% with Deductibe >$2,000 HDHP/SO % with OOP-Max >$6,350 or no Max
Source: Kaiser Family Foundation, Kaiser Employer Health Benefits: 2014 Annual Survey, Jan 2015

47
Deductibles have had a proven negative effect on patient adherence particularly when out-of-pocket costs are over $125 per prescription
Average Continuing Adherence for Patients Changing Insurance Type
(DPP-IVs)
Source: IMS Health, Formulary Impact Analyzer, Dec 2014, IMS Health Analysis
224
143 198
158
-
50
100
150
200
250
300
$0.00 - $9.99 $10.00 - $19.99 $20.00 - $29.99 $30.00 - $39.99 $40.00 - $49.99 $50.00 - $74.99 $75.00 - $124.99 $125.00 -$250.00
$250.01+
Ad
he
ren
ce
(A
ve
rag
e D
ays o
f T
hera
py/Y
ear)
OOP Cost
Standard to Standard Standard to Deductible

48
• Politics
• CMS rules on Part B
Reimbursement
• HEP C Innovation, PD1s, PCSK9,
& Orphan Drugs and Pricing
• Patient is a Payer
• Growing demand for value driven
metrics (CE and RWE)/adoption
of guidelines
• Specialty space gets more
crowded with new entrants and
more orals are coming
• More Biosimilar launches
• More Co Pay programs
cooperation by payers
• Possible 340B changes
• Gene Therapies & Orphan drugs
price discussions
Top Specialty events to watch for in 2016!
49
• The very significant AMP final rule from
CMS came out in January
• GDUFA II / BsUFA II negotiations should
be completed and the package sent to
Congress to reauthorize the program
• What happens to the Gx backlog?
• FDA said it will release final guidance for
industry on approval standards for generic
versions of tamper-resistant opioids
• Patent reform and IPR likely could be big
issues in Congress
• Does Generic inflation stay down?
• FDA should release guidance on biosimilar
interchangeability and maybe final
guidance on naming
• Teva/Actavis merger consumated and what
else?
• Impact of Global Purchasing alliances
• Crestor, Gleevec, Benicar, Zytiga patent
expiries
• Advair Diskus?
• More Biosimilars to come
• What will Senate do with 21st Century
Cures?
What to look out for in 2016 in Generics

50
What are people thinking about?
• Pharmacies
• Purchasing Alliances
• Controlled Substances abuse
• Access to Specialty Drugs
• Generic Price Inflation
• Track and Trace
• Wholesalers
• Purchasing Alliances
• Controlled Substances abuse
• Access to Specialty Drugs
• Generic Price Inflation
• Track and Trace
• Payers
• Exploding costs of Specialty Drugs
• Rising Oncology costs
• Formularies blocks and exclusive launches
• Generic Price Inflation
• Generic Manufacturers
• Purchasing Alliances
• Price increase backlash
• Portfolio Optimization
• Brand /niche drugs
• Proposed labeling changes
• Tax Inversion
• Brand/Specialty Manufacturers
• Price backlash
• Becoming more specialized
• Oral Specialty
• Orphan Drugs
• Tax Inversion
• Consumers
• Rising costs
• Specialty Tiers
• Losing Insurance

51
It may seem like we’ve been here before …
Tomorrow’s models will be built on alignment and cooperation
Hospitals
Physicians
Payers
FFS Model
Prescribing
Marketing
Sales
Payers
Hospitals
Physicians
HMO Model
Prescribing
Reimbursement
Marketing
Sales
Contracting
Payers
Hospitals
Physicians
Patients
Early IDN
Model
Reimbursement
Prescribing
Contracting
Marketing
Sales
HEOR/RWE
Payers
Hospitals
Physicians
Patients
Advanced
IDN Model
B2B
Outcomes
Contracting
Acct. Mgmt.
Marketing
HEOR/RWE
Payers
Hospitals
Physicians
Patients
Population
Mgmt.
Outcomes
=Income
HEOR/RWE
Acct. Mgmt.
Contracting
Marketing
INCREASING INTEGRATION OVER TIME
Pre-1980s 1980s-90s 2000-2010 2011-2020 Post 2020
Objectives
Methods
Pharma
Approach

52
• Specialty spending is on the rise and will continue to rise thru 2020
– 35% of dollars and 1-2% of prescriptions
– Fastest growing areas are Hep C, Oncology, Diabetes and Orphan Drugs
– The new Hep C drugs are our first specialty cures!
– Innovation and more patients treated are the major drivers of the this trend.
• Near term payer focus is on Hep C, PCSK9s, PD1s, and Orphan Drugs.
• Clusters of innovation around hepatitis C, autoimmune diseases, heart disease, orphan
diseases and others by 2020
• Management Tools: (Right Patient, Right Drug, & Right Setting)
– Generics
– Biosimilars
– Appropriate patient populations
– Exclusive Contracts and more price negotiations
– Appropriate use of Medicines will save money
Closing thoughts

53
-15%
-10%
-5%
0%
5%
10%
15%
20%
2010 2015 2020
US
$ G
RO
WT
H
Protected Brands Volume Protected Brands Price New Brands
Generics Volume Generics Price Loss of Exclusivity
Total Growth
U.S. Spending Growth, 2010-2020
Source: IMS Health Market Prognosis, IMS Institute for Healthcare Informatics, October 2015
United States
• 2020 Spending:
$560-590Bn
• 2016-20 Growth:
+146Bn
• CAGR 2016-20: 5-8%
• Increase over 2015:
+34%
• 2020 Brand Share of
spending: 67%;
unchanged since
2015
• 2020 Specialty Share
of spending: 34% +
0.4pts; 34% of
increase since 2015

54
Thank you
Doug Long, VP Industry Relations
Disclaimer :
• The analyses, their interpretation, and related
information contained herein are made and provided
subject to the assumptions, methodologies, caveats,
and variables described in this report and are based
on third party sources and data reasonably believed to
be reliable. No warranty is made as to the
completeness or accuracy of such third party sources
or data.
• As with any attempt to estimate future events, the
forecasts, projections, conclusions, and other
information included herein are subject to certain risks
and uncertainties, and are not to be considered
guarantees of any particular outcome.
• All reproduction rights, quotations, broadcasting,
publications reserved. No part of this presentation
may be reproduced or transmitted in any form or by
any means, electronic or mechanical, including
photocopy, recording, or any information storage and
retrieval system, without express written consent of
IMS HEALTH.
• ©2015 IMS Health Incorporated and its affiliates. All
rights reserved. Trademarks are registered in the
United States and in various other countries.
Recommended


![Community Services Industry (Portable Long Service …...[s 11] Community Services Industry (Portable Long Service Leave) Bill 2019 Part 3 Community Services Industry (Portable Long](https://img.dokumen.tips/doc/110x75/5f3f690e70d8062e9676eb33/community-services-industry-portable-long-service-s-11-community-services.jpg)