Characterization of ultrashort laser pulses employing self-phasemodulation dispersion-scan technique
Sharba, A. B., Chekhlov, O., Wyatt, A. S., Pattathill, R., Borghesi, M., & Sarri, G. (2018). Characterization ofultrashort laser pulses employing self-phase modulation dispersion-scan technique. Journal of Optics (UnitedKingdom), 20(3), [035502]. https://doi.org/10.1088/2040-8986/aaa9e9
Published in:Journal of Optics (United Kingdom)
Document Version:Peer reviewed version
Queen's University Belfast - Research Portal:Link to publication record in Queen's University Belfast Research Portal
Publisher rights© 2018 IOP Publishing Ltd.This work is made available online in accordance with the publisher’s policies. Please refer to any applicable terms of use of the publisher.
General rightsCopyright for the publications made accessible via the Queen's University Belfast Research Portal is retained by the author(s) and / or othercopyright owners and it is a condition of accessing these publications that users recognise and abide by the legal requirements associatedwith these rights.
Take down policyThe Research Portal is Queen's institutional repository that provides access to Queen's research output. Every effort has been made toensure that content in the Research Portal does not infringe any person's rights, or applicable UK laws. If you discover content in theResearch Portal that you believe breaches copyright or violates any law, please contact [email protected].
Download date:27. Feb. 2022

Characterization of ultrashort laser pulses
employing self-phase modulation dispersion-scan
technique
A. B. Sharba 1,2, O. Chekhlov3, A. S. Wyatt3,4, R. Pattathil3,
M. Borghesi2, and G. Sarri2
1 University of Babylon, College of Science for Women, Department of Laser Physics,
Babylon, Iraq2 Centre for Plasma Physics, School of Mathematics and Physics, Queen’s University
Belfast, Belfast BT7 1NN, UK3 Central Laser Facility, STFC Rutherford Appleton Laboratory, Harwell OX11 0QX,
UK4 Clarendon Laboratory, Department of Physics, University of Oxford, Oxford OX1
3PU, UK
E-mail: [email protected]
Abstract. We present a new phase characterization technique for ultrashort laser
pulses that employs self-phase modulation in the dispersion scan approach. The
method can be implemented by recording a set of non-linearly modulated spectra
generated with a set of known chirp values. The unknown phase of the pulse is
retrieved by linking the recorded spectra to the initial spectrum of the pulse via a
phase function guessed by a function minimization iterative algorithm. This technique
has many advantages over the dispersion scan techniques that use frequency conversion
processes. Mainly, the use of self-phase modulation cancels out the phase and group
velocity mismatch errors and dramatically widens the spectral acceptance of the non-
linear medium and the range of working wavelength. The robustness of the technique
is demonstrated with smooth and complex phase retrievals using numerical examples.
The method is shown to be not affected by the spatial distribution of the beam or the
presence of non-linear absorption process. In addition, we present an efficient method
for phase representation based on a summation of a set of Gaussian functions. The
independence of the functions from each other prevents phase coupling of any kind and
facilitates a flexible phase representation.
1. Introduction
The confinement of electromagnetic radiation within ultrashort pulse durations has
enabled a large number of exciting investigations in physics, chemistry and biology,
e.g. [1, 2, 3, 4]. Most of the applications and studies that utilize short laser pulses
require a complete characterization of the electric field of the pulse, which includes
characterizing the amplitude and phase of the field. In addition, the characterization of
the electric field is essential for the generation and amplification processes of laser pulses.

Characterization of ultrashort laser pulses employing self-phase modulation dispersion-scan technique2
Therefore, a large number of characterization techniques have been developed alongside
with the development of short pulse laser systems, e.g. interferometric autocorrelation
[5], time-to-frequency imaging [6], FROG [7], SPIDER [8] and MIIPS [9]. A detailed
study reviewing a large number of phase characterization techniques can be found in
[10].
Recently, an efficient phase characterization technique has been proposed and used
for characterizing ultrashort pulses by M. Miranda et al [11, 12]. In this technique, the
dispersion-scan or d-scan, the pulse is chirped with a set of chirp values and used to
pump a second harmonic generation process (SHG). The phase of the pulse is estimated
by linking the output of the SHG to an independent spectral measurement of the input
pulse. The phase function that minimizes the difference between the measured SHG
spectra and simulated spectra is the phase of the input pulse. The phase function
is guessed by using a multi-dimension function minimization iterative algorithm. The
simulated spectra, on the other hand, are obtained by assuming an ideal SHG process.
The deviation of the SHG process from the ideal case, in terms of the spectral acceptance
of the conversion crystal and the achromatic response of the optics used, is compensated
for by using a filter function [11, 12].
The d-scan technique has the advantage of using a single beam. Therefore, the
measurement can be implemented with minimal alignment requirements without the
need for splitting or recombining the beam. In addition, since no delay-line is required,
the approach is free from any mechanical fluctuations. The chirping phase can be
provided by a pair of wedges and a translation stage for characterizing sub 10 fs pulses
[11, 12]. For longer duration pulses, a grating compressor or a pulse shaper can be used
[13].
In this study we present a new variant of the d-scan technique employing self-phase
modulation (SPM) as the non-linear effect. In this method, which will be referred to as
SPM-d-scan, the impact of the initial phase of the pulse on the SPM-induced spectral
modulation is used to recover the phase of the pulse. The method can be implemented by
recording the non-linearly modulated spectra as the pulse is being chirped by different
chirp values. The non-linear phase shift can be obtained by propagating the pulse
through a thin piece of any transparent material having instantaneous non-linearity.
Figure 1 depicts a simple layout of the experimental arrangement. The phase of the pulse
can be retrieved by finding the phase function that minimizes the difference between
the measured and simulated spectra. The simulated spectra are obtained by assuming
that the pulse is experiencing only SPM into the medium.
Apart from the need for a higher intensity, the SPM-d-scan has many advantages
over the d-scan variants that use SHG [11, 12] and third harmonic generation [14, 15].
Firstly, since the technique does not relay on a frequency conversion process it is
applicable over a wide range of pulses regardless of the wavelength and the availability
of the conversion medium. Secondly, since the SPM process involves a single pulse, the
measurement is free from any phase or group velocity mismatch effects. This feature
makes the SPM-d-scan a powerful tool for characterizing broadband pulses without

Characterization of ultrashort laser pulses employing self-phase modulation dispersion-scan technique3
Chirping element
Focusing element
Spectrometer
PC
Glass
Collimating element
Figure 1. A simple layout of the experimental setup for the SPM-d-scan technique.
The chirping element can be a pair of wedges with chirp mirrors, a pulse shaper, or a
grating compressor depending on the bandwidth of the pulse to be characterized. The
focusing and collimating elements can be lenses or mirrors.
being limited by the spectral acceptance of the conversion crystal. In addition, this
feature cancels out the need for any calibration filter that corrects the deviation of
the process from the ideal performance. This simplifies the method and minimizes
the associated errors. A calibration filter may be needed in the case of characterizing
ultra-broadband pulses when the non-linear refractive index cannot be considered as a
constant. Thirdly, since the spectra of the pulse before and after encountering SPM
are in the same spectral region, the technique is not affected by the spectral response
of the optics. Fourthly, the implementation of the method does not require separating
any harmonics. Finally, the initial spectrum of the pulse can be recorded with the
same experimental setup but with a high value of the applied chirp. This increases the
accuracy of the technique since no independent measurement is required.
SPM, as a nonlinear process, has been used for phase recovering by E. T. J.
Nibbering et al [16]. Their method is based on recovering the phase from two spectral
measurements of the pulse before and after a non-linear propagation. The phase is
retrieved by using an iterative algorithm that is based on the propagation of the pulse
back and forth into the non-linear medium with a repeated substitution of the measured
spectra into the algorithm and a fine adjustment of the pulse’s energy after every
iteration. The difference between the measured and reconstructed spectra is used to
indicate the convergence of the algorithm.
This method requires an independent energy measurement of the pulse for the
purpose of intensity calculation. In addition, the method is not efficient at recovering
the phase of significantly modulated spectra and/or complex phase functions. E. T. J.
Nibbering et al [16] noticed that combining several spectrum measurements using non-
linear samples of different thicknesses does not improve the accuracy of the technique.
They suggested that the phase retrieval accuracy could be improved by adding a second-
order autocorrelation measurement of the pulse profile to the algorithm as an additional

Characterization of ultrashort laser pulses employing self-phase modulation dispersion-scan technique4
constraint to fulfil.
However, these limitations are much improved in the case of using the SPM-d-scan
technique. The improvements are achieved from the inherent redundancy of data in the
2D traces. In other words, the availability of a larger number of constraints in the same
trace drives the algorithm to a better estimate of the phase. In addition, knowing the
intensity of the pulse and the nonlinear refractive index of the medium is not required
for recovering the phase by using the SPM-d-scan technique. In fact, they can be found
in addition to the phase of the pulse, as will be shown in a follow-up paper. Therefore,
using the SPM-d-scan approach can ensure characterization of the laser source and the
material of the sample used with high accuracy.
In this work, the theoretical basics of the SPM-d-scan are presented in section
2. In section 3 a new phase representation method based on the summation of a set
of Gaussian functions is presented. The robustness of the SPM-d-scan technique at
recovering smooth and complex phase functions is demonstrated in section 4. The
effects of the spatial distribution of the beam, and the pulse self-steepness phenomenon
are discussed in details in section 5 and 6 respectively. A discussion about the presence of
two-photon absorption processes and a method for including this effect in the theoretical
understanding of the technique are discussed in section 7. Finally, the conclusion of the
work is drawn in section 8.
2. Theory
For light waves having an optical intensity in the range of 10-100 GW/cm2, the
intensity-dependent effects that can be experienced by a single beam, such as SPM
and self-focusing, arise from the nonlinear refractive index of materials [16]. When
the propagation distance of an intense pulse into material is short, the effect of group
velocity dispersion (GVD) and diffraction can be neglected. The propagation distance
is measured relative to the dispersion length of the pulse (LD = T 2/ |β|) and Rayleigh
range of the beam (πr2◦n◦/λ). In this case: T = T◦/2
√2, T◦, β, r◦, n◦, and λ are the full
width at half maximum (FWHM) of the pulse, the second order dispersion parameter,
the width of the waist of the beam, the linear refractive index of the medium, and the
wavelength of the beam respectively.
Neglecting GVD and diffraction effects facilitates the analysis of the resulting
spectrum by considering the nonlinear effects only. In the case of a pulse propagating
along the z-direction and experiencing SPM, the total nonlinear phase shift at a certain
point in the beam and a certain moment of time can be estimated from [17].
∆Φ(r, t) =2π
λ
∫ L
0
n2I(r, t)dz (1)
where L, n2, t, r, and I are the thickness of the non-linear medium, the non-linear
refractive index of the medium, the time, the transverse spatial coordinate, and intensity
of the beam respectively.

Characterization of ultrashort laser pulses employing self-phase modulation dispersion-scan technique5
In a nonlinear medium the refractive index of the material is:
n = n◦ + n2I◦ (2)
The peak value of Eq. 1 is known as the B-integral. At the end of the non-linear
medium the cumulated phase shift will be:
∆Φ(r, t) =2π
λn2I(r, t)L =
n2ω◦c
I(r, t)L (3)
where ω◦ is the angular frequency of the beam.
In the case where the medium can be considered dispersion-less, the electric field
of the pulse in the time domain across the beam will be:
E(r, t) = E◦(r, t) ei∆Φ(r,t) (4)
where E◦(r, t) is the electric field at the front face of the medium.
In the case of a low B-integral value, where the spatial variation of the beam,
focusing or defocusing, within the sample can be neglected and when the transverse
distribution of the beam can be considered as a constant, the spatial dependence can
be dropped from Eq. 4. Therefore, it becomes:
E(t) = E◦(t) e(i∆Φ(t)) (5)
The spectral profile of the pulse after undertaking non-linear phase shift can be
obtained by performing a Fourier transformation of Eq. 5. Since the non-linear shift
experienced by the pulse depends on the pulse’s shape, any initial spectral phase that
can induce a temporal modification can influence the shape of the non-linear phase shift.
In other words, information about the initial phase of the pulse is encoded in the final
shape of the pulse’s spectrum after undertaking non-linear phase shift. Therefore, by
analysing the spectrum of the pulse after a non-linear propagation the initial phase of
the pulse can be extracted.
Performing the d-scan approach, i.e. recording the spectra of the pulse after having
non-linear phase shift with different initial chirp values, results in the generation of a
2D map having axes that are the wavelength and the dispersion values. The spectral
distribution in such a map can be represented by:
S(ω, φ) ∝ |FT[E(t, φ)]|2 (6)
where φ is the additional applied spectral phase, i.e. the scanning phase, and FT denotes
the Fourier transformation of the following term.
Figure 2 presents some examples of SPM traces generated from pulses having a 30
nm FWHM Gaussian spectrum with different initial phase forms. The amount of the
non-linear phase shift in all the traces corresponds to B-integral of a maximum value at
the peak of the pulse of 1.
The process of finding the initial phase of the pulse from an SPM-d-scan trace is,
therefore, a 2D fit problem, i.e. similar to that with the SHG-d-scan, and also in the
Characterization of ultrashort laser pulses employing self-phase modulation dispersion-scan technique6
(a) (b)
(c) (d)
(e) (f)
Figure 2. SPM traces generated from a pulse having a 30 nm FWHM Gaussian
spectrum centred around 800 nm using linear chirp scan with different initial phases.
(a), (c) and (e) are with 500 fs2 GDD, 15 k fs3 TOD and 500 k fs4 FOD, where GDD,
TOD, and FOD are the group delay dispersion, the third and fourth order dispersion
respectively. (b), (d) and (f) are with same phase parameter as the corresponding ones
but with an opposite sign. The dashed lines are the initial phase functions. The amount
of the non-linear phase shift in all traces corresponds to B-integral of a maximum value
at the peak of the pulse=1.
FROG technique. The phase that is most likely to be the initial phase of the pulse is the
phase that minimizes a distance error between the measured and the simulated maps as
Error =
√1
NiNj
∑i,j
[Smeas(ωi, φj)− Ssimu(ωi, φj)]2 (7)
where Ni and Nj are the sampling number of the spectrum and the number of the
recorded SPM spectra, Smeas, Ssimu are the measured and simulated SPM traces
respectively.
It is important to note that, in the limit where n2 can be considered as a constant,
no spectral filter or spectral response calibration are required to match the measured

Characterization of ultrashort laser pulses employing self-phase modulation dispersion-scan technique7
and the simulated spectra, i.e. in contrast to that when using the SHG-d-scan and
in FROG. The simulated trace in the case of SPM-d-scan should directly match the
measured one. The minimizing algorithm used in the this work is based on the downhill
simplex algorithm [18], similar to that used in [11, 12]. However, the algorithm of the
SPM-d-scan has the B-integral value as an additional adjusting parameter, which does
not present in the d-scan approaches that use frequency conversion processes. The
algorithm in the present case finds the phase function and the value of the B-integral
that minimize the value of Eq. 7. This, in addition to extracting the phase, enables
finding either the intensity of the laser or the value of n2 of the material, as will be
discussed in a follow-up study.
3. Phase representation
The spectral phase can be defined in many forms. However, the accuracy and the
speed of any phase recovering device depend significantly on the method of phase
representation. The method of defining a phase value for each spectral component has
been used in retrieving the phase from FROG traces using a genetic algorithm [19] and
other algorithms [20, 21]. As the spectral phases are completely separate values there
will be no coupling of any kind between them, such as the coupling between the terms
of Taylor series. However, the large number of variables makes the search process very
slow because the search space will have a number of dimensions equal to the number of
the variables.
Another method for representing the phase, used by M. Miranda et al [11, 12], is
to use a Fourier series of multiple-terms. The number of the terms used depends on
the complexity of the phase to be retrieved. However, representing the spectral phase
in this way is not enough in certain cases where the algorithm can get fixed at a local
rather than the global minimum of the error function. M. Miranda et al [12] have dealt
with this situation using two procedures. First, the base of representing the phase is
switched to another one whenever the algorithm gets fixed in a local minimum. The
need of switching can be checked by assessing the convergence of the algorithm. The
other approach is similar to that used with the PICASO algorithm [22, 23]. The phase
is represented by a smooth function formed by spline interpolation in between phase
values defined at specific frequencies. The resolution of the function is then increased
whenever the algorithm converges by defining more points on the function [12].
In this work, we use a different approach to represent the spectral phase. At
the start of the phase-retrieval algorithm, the first guess of the phase is formed by
summing some Gaussian functions that span the whole spectral range under study.
Every Gaussian function has three optimization parameters: the amplitude, the width
and the position in the spectral range. Figure 3 (a) shows an example of some Gaussian
functions having the same frequency bandwidth and the amplitude separated equally
by their FWHM. The summation of theses Gaussian functions is presented in Fig. 3
(b) and the summation of similar functions but having amplitudes of alternative signs

Characterization of ultrashort laser pulses employing self-phase modulation dispersion-scan technique8
is drawn in frame (c) of the figure.
0
1
-0.2 -0.15 -0.1 -0.05 0 0.05 0.1 0.15 0.2
Ph
ase
(rad
)
(ω-ωo) rad/fs
(a)
0
1
2
-0.2 -0.1 0 0.1 0.2
Ph
ase
(rad
)
(ω-ωo) rad/fs
(b)
-0.4
-0.2
0
0.2
0.4
-0.2 -0.1 0 0.1 0.2
Ph
ase
(rad
)
(ω-ωo) rad/fs
(c)
Figure 3. The procedure of representing the spectral phase by using a summation of
several Gaussian functions. (a) Some Gaussian functions having the same frequency
bandwidth and the same amplitude separated equally by their FWHM, (b) the
summation of the Gaussian functions in frame (a), (c) the summation of Gaussian
functions of the same distribution in frame (a) but having amplitudes of alternative
signs ±.
It has been justified in this work, as will be shown in the next section, that
using Gaussian functions is an efficient and flexible method for representing the phase,
especially when using alternative-sign amplitudes (Fig.3 c). Since the functions are
independent, coupling of any kind and having the algorithm fixed at a local minimum
are unlikely to occur. The required number of the Gaussian functions to span the
spectral range depends on the complexity of the phase to be retrieved. The phase-
retrieval algorithm is initiated with a minimum number of the functions and then, if
required, the resolution of the phase is enhanced by adding more functions. Using
this approach guarantees that all the features of the phase will be retrieved efficiently
whatever their shapes are as long as they induce a detectable change in the SPM trace.
These advantages of the phase-representing-base are accompanied with an excellent
speed of the algorithm since only a few Gaussian functions are required to cover the
whole spectral range.
Finally, a significant improvement can be achieved when the retrieval algorithm is
initiated with a guess of the phase that is represented by a few-term Taylor series. This
step is implemented just to capture the main trend of the phase, then a Gaussian

Characterization of ultrashort laser pulses employing self-phase modulation dispersion-scan technique9
representation is used to retrieve the more detailed phase map. This technique is
effective when the pulse is significantly longer than the transform-limit, i.e. having
a large dispersion value. This case usually exists at the first optimization stages of a
laser system.
4. Phase retrieval
Assessing the accuracy of a technique by using a purely theoretical noise-free data helps
checking the algorithm itself and exploring the effect of any systematic or random error
[24]. To assess the accuracy of phase retrieval we used the examples shown in Fig. 4.
The fundamental spectrum is assumed to be an asymmetric experimentally measured
spectrum presenting some small scale modulations. The spectrum has 1024 sampling
points over the whole spectral range. The retrieval is carried out for four forms of the
phase function. First, a pulse with a flat phase function is considered. The pulse in
this case has a duration of 20 fs (FWHM). The second example is a pulse having a
phase function that is well described by a fourth-order Taylor series having coefficients
GDD=200 fs2, TOD=10k fs3 and FOD=300k fs4, where GDD, TOD, and FOD are the
group delay dispersion, the third and fourth order dispersion respectively. The third
example considered in this study is a complex kind of phase, as shown in Fig.4 (c). The
phase function is modelled by the summation of a third order Taylor series, two Gaussian
functions having opposite amplitudes and separated by the double of their FWHM and
a tanh function of the form tanh (10ω/∆ω). Finally, the case of a spectrum having a
zero spectral amplitude region near its centre is considered for the accuracy assessment,
as shown in Fig. 4 (d). The accuracy of the technique in the presence of noise and
ultra-high intensity levels will be investigated in a follow-up paper.
As shown, in all cases the algorithm retrieves the applied phases smoothly and
accurately. The phase-retrieval is obtained over the whole spectrum, i.e. at the high
and low spectral region, and at the wings of the spectrum. In the case of a complex
phase function, results with the same accuracy have been obtained by considering other
forms of phase with different shapes and phase jumps. The total phase error between the
reconstructed and actual phase functions is 2×10⁻⁵, 8×10⁻⁴, 0.012, and 0.02 rad for the
cases in frames a-d of Fig. 4 respectively. Such a level of accuracy demonstrates some
important results: first, the algorithm is free from any kind of systematic or random
errors. Second, the Gaussian representation of the phase is flexible and efficient for
reconstructing smooth and complex phase functions.
The retrievals in Fig. 4, especially those in frames (c) and (d), demonstrate the
robustness of the technique. Keeping in mind that the phase retrievals are obtained
only by analysing SPM-induced spectral modifications, such a level of robustness can
be achieved for lasers having wavelengths in ranges where the frequency conversion
processes are difficult.

Characterization of ultrashort laser pulses employing self-phase modulation dispersion-scan technique10
-8
-6
-4
-2
0
2
4
6
8
0
1
750 800 850
Ph
ase
(ra
d)
Norm
ali
zed
Sp
ectr
al
Inte
nsi
ty
Wavelength (nm)
SpectrumRetrieved PhaseActual Phase
(b)
-2
-1
0
1
2
3
4
5
6
7
0
1
750 800 850
Ph
ase
(ra
d)
Norm
ali
zed
Sp
ectr
al
Inte
nsi
ty
Wavelength (nm)
SpectrumRetrieved PhaseActual Phase
(c)
-2
-1
0
1
2
3
4
5
6
7
0
1
750 800 850
Ph
ase
(ra
d)
Norm
ali
zed
Sp
ectr
al
Inte
nsi
ty
Wavelength (nm)
Spectrum
Retrieved Phase
Actual Phase
(d)
-4
-3
-2
-1
0
1
2
3
4
0
1
750 800 850
Ph
ase
(ra
d)
Norm
ali
zed
Sp
ectr
al
Inte
nsi
ty
Wavelength (nm)
Spectrum
Retrieved Phase
Actual Phase
(a)
Figure 4. Examples of phase retrieval with different initial phase functions: (a) flat
phase, (b) a phase function described by a Taylor series with GDD=200 fs2, TOD=–
10k fs3 and FOD=–300k fs4, (c) a complex phase formed by a Taylor series of third
order, two Gaussian functions of opposite amplitudes separated by double of their
FWHM and a tanh function of the form tanh (10ω/∆ω), (d) the same as (c) but with
a spectrum that has a 6 nm wide gap of zero spectral amplitude.
5. The effect of the spatial distribution of the beam on the accuracy of
phase retrieval
In the calculations above the intensity of the laser beam has been assumed as constant
across the transverse dimension of the beam. In reality, this can be the case only when
the beam has a rectangular or a high order super Gaussian shape. Since these specific
shapes cannot be guaranteed for all laser beams, the influence of the spatial distribution
of the beam on the accuracy of the SPM-d-scan technique has to be quantified.
Generally, the spatial distribution of the beam is an effective parameter in the phase
measurement techniques where the spectral amplitude is an important parameter for
the phase-retrieval algorithm. This includes, in addition to the SPM-d-scan, techniques
such as FROG, MIIPS, and SHG-d-scan. However, the significance of the effect depends
on the type of the non-linear process that the particular technique employs, and the
intensity of the pulse that is to be characterized. In relatively low-intensity-based
techniques, such as those using SHG, the effect of the spatial distribution of the beam
appears mainly at high input intensities, where saturation and non-linear phase shift
start affecting the pattern of the trace. This is because the intensity of the fundamental
pulse does not affect the pattern of the trace as long as it is lower than the level that
can saturate the conversion process.

Characterization of ultrashort laser pulses employing self-phase modulation dispersion-scan technique11
On the other hand, in the case of the SPM-d-scan the lateral distribution of the
beam is effective in all the working intensity levels of the technique. This is because the
pattern of the SPM trace, for a particular pulse, is uniquely associated with a certain
intensity level, as can be seen from Eq. 3. Therefore, the spatial distribution of the beam
is supposed to increase the error in the phase retrieval process because the algorithm
assumes that the trace is generated with single intensity value. However, this is not the
case as will be shown in the following.
To evaluate the effect of the beam profile on the accuracy of the SPM-d-scan
technique, we use a test pulse with a complex phase and spectrum (Fig. 4 c). The
phase-retrieval is investigated for beams having a Gaussian, a hyperbolic secant squared,
a Lorentzian, and a double-peak spatial distributions.
Interestingly, the retrieval results show that the intensity distribution across the
beam does not introduce any noticeable systematic error to the phase retrieval using
the SPM-d-scan approach. This can be understood by considering the fact that an SPM
trace generated from a non-rectangular beam with a particular B-integral value can be
approximated by a rectangular-beam-trace that belongs to the same initial pulse but
generated with a lower B-integral value. This approximation is fairly true because, in
fact, the resulting SPM trace is an average of several traces generated with different
intensity levels the contribution of each one of them to the final trace is weighted by the
associated local intensity in the beam. Therefore, since the intensity is one of the fitting
parameters in the algorithm of the SPM-d-scan, the algorithm will readily find the phase
of the pulse but with a different B-integral value. The relation between the recovered
value of the B-integral and the shape of the beam is to be discussed in a follow-up
paper. Figure 5 shows an example of an SPM trace generated from a Gaussian beam
with a B-integral of 1 and a trace generated from a rectangular beam but with a lower
B-integral value, determined by the shape of the beam. Both traces belong to the same
Gaussian pulse which has a flat phase function.
(a) (b)
Figure 5. SPM maps for a 30 fs Gaussian pulse having a flat phase generated from (a)
a Gaussian beam with a B-integral of 1 and (b) a rectangular beam with a B-integral
of 1/√
2.
Since the traces are identical, the algorithm can efficiently retrieve the phase of

Characterization of ultrashort laser pulses employing self-phase modulation dispersion-scan technique12
the pulse from either trace regardless of the shape of the beam. Figure (6) presents
examples for the actual and retrieved phases in the case of input beams having different
spatial distributions.
-2
2
6
750 800 850
Ph
ase
(ra
d)
Wavelength (nm)
Lorentzian
-2
2
6
750 800 850
Ph
ase
(ra
d)
Wavelength (nm)
Double-peak
-2
2
6
Ph
ase
(ra
d) Gaussian
-2
2
6
Ph
ase
(ra
d) Sech2
Figure 6. The actual (solid red) and the reconstructed (blue dotes) phase in case of
beams having different shapes. The SPM traces in all of the cases are generated with
maximum B-integral=1.
The small discrepancies at the wings of the spectrum, besides the negligible values,
they correspond to low or zero spectral regions and therefore they are of negligible affects
on the accuracy of pulse reconstruction.
6. The influence of self-steepening of the pulse on the accuracy of phase
retrieval
It is long-known that the temporal profile of a short light pulse propagating in a nonlinear
medium can be modified due to the intensity-dependent GVD property of the material.
In this case the group velocity of the pulse is intensity dependent, where higher intensities
will propagate slower. After a long propagation distance, this leads to a sharpening of
the pulse from the trailing side because the wings of the pulse travel faster than the
peak [25].
This phenomenon has been explained by extending the theory of SPM through the
addition of a correction term to the nonlinear Schrodinger equation. This term is the
time derivative of the pulse envelope [26]. For a pulse having a complex envelope A and
propagating along the z-direction, the wave equation nonlinear Schrodinger equation
relative to an observer moving with the group velocity of the central wavelength of the
pulse is [27]:
i∂A
∂z− β
2
∂2A
∂τ 2+ ψ |A|2A+ iϑ
∂
∂τ
(|A|2A
)= 0 (8)

Characterization of ultrashort laser pulses employing self-phase modulation dispersion-scan technique13
where ϑ = 2n2ε◦/n, τ = t − z/vg, vg is the group velocity at ω = ω◦, ψ = n2 ω◦ε◦/n,
n is the refractive index,ε◦ is the permittivity of free space, and β is the second order
dispersion parameter.
The last term on the left hand side of Eq. 8 becomes important for short pulses
that propagate in nonlinear media for long distances. It causes asymmetry in the SPM-
induced spectral modulation [25].
However, this effect is only noticeable in the case of very long nonlinear propagation
distances, which is not the case with the samples of the SPM-d-scan approach. This can
be demonstrated by quantifying the length over which the self-steepening occurs in the
pulse. The distance at which the derivation of the trailing edge of the pulse becomes
infinity, can be calculated from [28]:
Zs = ω◦ T◦ LsNL (9)
where LsNL = λ/(2π n2 I◦), and I◦ = 1/2n◦c◦ε◦ |E◦|2 is the peak intensity of the pulse.
Figure 7 displays the value of Zs as a function of the maximum B-integral value
and the FWHM duration of the pulse in fused Silica.
Figure 7. The distance of steep trailing edge formation as a function of the maximum
B-integral and the FWHM duration of the pulse in Fused Silica.
As shown, the effect of self-steepening, or broadening asymmetry, occurs at
distances that are significantly longer than any sample that can be used in the SPM-d-
scan, even in the case of ultra-high B-integral values and/or ultrashort pulse. Therefore,
the phenomenon of self-steepening is unlikely to introduce any kind of error in the phase
measurement when using the SPM-d-scan approach.
7. The effect of non-linear absorption
For some materials, high intensity field can induce some intensity-dependent absorption
processes. Generally, with such a non-linearity, the accuracy of any phase retrieval
will be affected. The significance of the effect depends on the level of the non-linear

Characterization of ultrashort laser pulses employing self-phase modulation dispersion-scan technique14
absorption process, and the complexity of the spectrum and phase of the pulse. This is
because the non-linear absorption processes, two-photon absorption (TPA) for instance,
modify the information encoded in the measured trace. At a relatively high level of
non-linear absorption the changes can be seen directly on the pattern of the trace, as
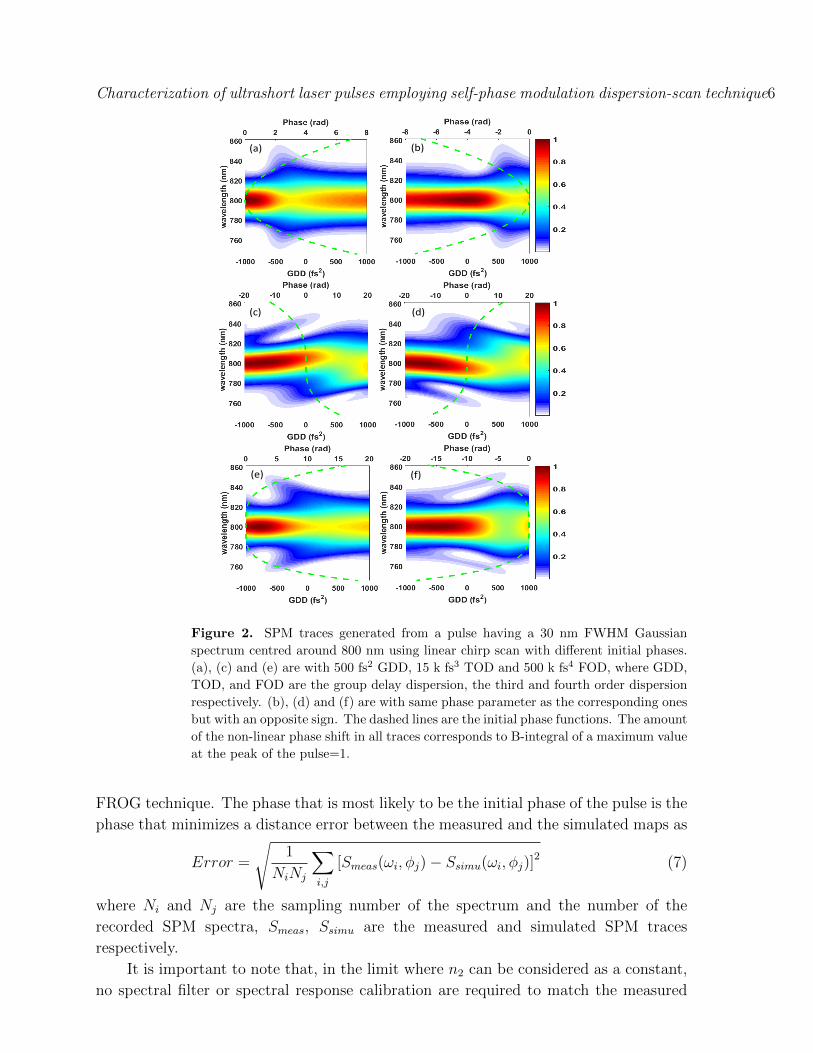
can be seen from the comparison between frames (a) and (b) in Fig. 8. However,
the direct measurement of the pulse energy as a function of the applied chirp can
reveal the presence of the non-linear processes more precisely, as shown in frame (c)
of the figure.The traces in frames (a) and (b) in Fig. 8 are generated using the Fourier
transformation of Eq. 11.
(b) (a)
0.5
0.7
0.9
-1500 -500 500 1500
No
rm
ali
zed
sp
ectr
al
energ
y
GDD (fs2)
Without Nonlinear Abs.
With Nonlinear Abs.
(c)
0.55
0.6
0.65
0.7
-1500 -500 500 1500
No
rma
lize
d s
pec
tra
l en
erg
y
GDD (fs2)
(d)
Figure 8. The effect of non-linear absorption on the SPM-d-scan technique. (a) and
(b) are SPM traces generated with and without the effect of the TPA respectively.
Both traces are generated from a Gaussian pulse having duration of 30 fs and a flat
phase function with and without the effect of the TPA respectively. (c) and (d) The
normalized spectral energy of the pulse as a function of the applied chirp for a Gaussian
pulse having a flat and a complex phase functions respectively.
For the convenience of the work, we show that all the required information about
the presence of any intensity-dependent absorption process can be extracted from the
SPM traces without a need for another independent measurement. Indications of the
presence of any kind of intensity-dependent absorption process can be deduced from the
spectral integration of the SPM trace, i.e. the spectral energy as:
E(φ) ∝∫ ∞−∞
S(ω, φ)dω (10)
where E is the spectral energy.

Characterization of ultrashort laser pulses employing self-phase modulation dispersion-scan technique15
Figure 8 (c) indicates that a non-linear multi-photon absorption process is
dominantly present into the sample. In the case of SPM-d-scan, the curve of spectral
energy as a function of the linear chirp is symmetric around the point of zero applied
chirp for pulses with flat phase functions, as shown in Fig. 8 (c). However, the curve
is asymmetric when the pulse has a non-flat phase, as shown in frame (d) of the figure.
This is because the optical intensity of a pulse that initially has a non-flat spectral phase
will change asymmetrically with the applied linear chirp.
In either case, the presence of the non-linear absorption affects the accuracy of
phase-retrieval. An easy solution to overcome this problem is to reduce the intensity
of the pulse as much as possible. A flattening in the spectral energy curve can be an
indication that the technique is operating at the safe intensity level.
Alternatively, we show that in the case of an SPM-d-scan the effect of TPA can
be taken into account in the phase recovering algorithm. In the case of the presence of
TPA the electric field of the pulse at the exit surface of the sample will be [29]:
E(t) = E◦(t)e−αL/2(1 + q(t))(i2πn2/λα−1/2) (11)
where:
q(t) = αI(t)Leff (12)
Leff =1− e−αL
α(13)
α and α are the linear absorption and TPA coefficients of the sample material
respectively.
The TPA process can be considered by using Eq. 11 as the base of the phase-
retrieval algorithm instead of Eq. 5. More interestingly, giving that the intensity of the
pulse is known, the absolute values of the TPA coefficient of the sample can be recovered.
The value of this coefficient can be recovered by using it as a fitting parameter into the
phase-retrieval algorithm. This feature, therefore, can be considered as an additional
advantage of the SPM-d-scan technique.
8. Conclusion
We describe a new variant of the dispersion-scan technique employing self-phase mod-
ulation (SPM). The technique recovers the phase of the pulse via its impact on the
spectral modulation that the pulse experiences during non-linear propagation. The
phase is retrieved using a function minimization iterative algorithm. The method has
many advantages over the dispersion scan approaches that use frequency conversion
processes. Since the technique does not rely on a frequency conversion process, it is free
from any errors that arise from phase or group velocity mismatch, is applicable for a
wide range of wavelengths, is not affected by the spectral response of the optics, and is
not limited by the acceptance of the non- linear medium. In addition, in the limit where
the nonlinear refractive index can be considered constant, the technique does not require

Characterization of ultrashort laser pulses employing self-phase modulation dispersion-scan technique16
a calibration filter or the separation of any harmonics. Furthermore, no independent
fundamental spectrum measurement is required. On the other hand, the performance of
SPM-dispersion-scan is much improved relative to the technique that uses a single SPM
spectrum measurement. The improvement is obtained from the redundancy of data
in the SPM 2D trace. The robustness of the technique is demonstrated with smooth
and complex phase retrievals using numerical examples. In addition, we show that the
accuracy of the technique is not affected by the spatial distribution of the beam or the
self-steepness process. In the case of the presence of two-photon absorption process, the
process can be taken into account without affecting the accuracy of the phase retrieval.
Finally, we demonstrated an efficient phase representation method that uses a summa-
tion of a set of Gaussian functions. The independence of the functions prevent coupling
of any kind as that in the case of using a Taylor series. The method is shown to be
flexible to represent smooth and complex phase forms without affecting the speed of the
retrieval algorithm.
Acknowledgements
We gratefully acknowledge financial support from EPSRC (grant numbers
EP/I029206/1 and EP/L013975/1) and the Iraqi Ministry of Higher Education and
Scientific Research. We also acknowledge the assistance of the Central Laser Facility at
Rutherford Appleton Laboratory.
9. References
[1] Zewail A H 2000 Angewandte Chemie International Edition 39 2586–2631
[2] Drescher M, Hentschel M, Klenberger R, Ulberacker M et al. 2002 Nature 419 802
[3] Kling M F and Vrakking M J 2008 Annu. Rev. Phys. Chem. 59 463–492
[4] Goulielmakis E, Loh Z H, Wirth A, Santra R, Rohringer N, Yakovlev V S, Zherebtsov S, Pfeifer
T, Azzeer A M, Kling M F et al. 2010 Nature 466 739
[5] Diels J C M, Fontaine J J, McMichael I C and Simoni F 1985 Applied Optics 24 1270–1282
[6] Kolner B H 1994 IEEE Journal of Quantum Electronics 30 1951–1963
[7] Kane D J and Trebino R 1993 IEEE Journal of Quantum Electronics 29 571–579
[8] Iaconis C and Walmsley I A 1998 Optics letters 23 792–794
[9] Lozovoy V V, Xu B, Coello Y and Dantus M 2008 Optics express 16 592–597
[10] Walmsley I A and Dorrer C 2009 Advances in Optics and Photonics 1 308–437
[11] Miranda M, Fordell T, Arnold C, L’ Huillier A and Crespo H 2012 Optics express 20 688–697
[12] Miranda M, Arnold C L, Fordell T, Silva F, Alonso B, Weigand R, L ’ Huillier A and Crespo H
2012 Optics express 20 18732–18743
[13] Loriot V, Gitzinger G and Forget N 2013 Optics express 21 24879–24893
[14] Silva F, Miranda M, Teichmann S, Baudisch M, Massicotte M, Koppens F, Biegert J and Crespo H
2013 Pulse measurement from near to mid-ir using third harmonic generation dispersion scan in
multilayer graphene International Quantum Electronics Conference (Optical Society of America)
p CFIE 3 5
[15] Hoffmann M, Nagy T, Willemsen T, Jupe M, Ristau D and Morgner U 2014 Optics express 22
5234–5240

Characterization of ultrashort laser pulses employing self-phase modulation dispersion-scan technique17
[16] Nibbering E, Franco M, Prade B, Grillon G, Chambaret J P and Mysyrowicz A 1996 JOSA B 13
317–329
[17] Perry M D, Ditmire T and Stuart B 1994 Optics letters 19 2149–2151
[18] Nelder J A and Mead R 1965 The computer journal 7 308–313
[19] Nicholson J, Omenetto F, Funk D and Taylor A 1999 Optics letters 24 490–492
[20] DeLong K W and Trebino R 1994 JOSA A 11 2429–2437
[21] Trebino R and Kane D J 1993 JOSA A 10 1101–1111
[22] Nicholson J and Rudolph W 2002 JOSA B 19 330–339
[23] Yakovlev V, Dombi P, Tempea G, Lemell C, Burgdorfer J, Udem T and Apolonski A 2003 Applied
Physics B: Lasers and Optics 76 329–332
[24] Dorrer C and Walmsley I A 2002 JOSA B 19 1019–1029
[25] DeMartini F, Townes C, Gustafson T and Kelley P 1967 Physical Review 164 312
[26] Tzoar N and Jain M 1981 Physical Review A 23 1266
[27] Anderson D and Lisak M 1983 Physical Review A 27 1393
[28] Agrawal G P 2007 Nonlinear fiber optics (Academic press)
[29] Van Stryland E W and Sheik-Bahae M 1998 Characterization techniques and tabulations for organic
nonlinear materials 18 655–692
Recommended