Instructions for use
Title Characterization of phase-II conjugation reaction of polycyclic aromatic hydrocarbons in fish species : Unique pyrenemetabolism and species specificity observed in fish species
Author(s) Ikenaka, Yoshinori; Oguri, Mami; Saengtienchai, Aksorn; Nakayama, Shouta M. M.; Ijiri, Shigeho; Ishizuka, Mayumi
Citation Environmental Toxicology and Pharmacology, 36(2), 567-578https://doi.org/10.1016/j.etap.2013.05.018
Issue Date 2013-09
Doc URL http://hdl.handle.net/2115/53434
Type article (author version)
File Information 130527_Reviced manuscript.pdf
Hokkaido University Collection of Scholarly and Academic Papers : HUSCAP

Characterization of Phase-II conjugation reaction of polycyclic aromatic
hydrocarbons in fish species: unique pyrene metabolism and species specificity
observed in fish species
Yoshinori Ikenaka a, 1
, Mami Oguri a, 1
, Aksorn Saengtienchai a, Shouta M.M.
Nakayama a, Shigeho Ijiri
b, Mayumi Ishizuka
a
a Laboratory of Toxicology, Department of Environmental Veterinary Sciences,
Graduate School of Veterinary Medicine, Hokkaido University, Kita 18, Nishi 9,
Kita-ku, Sapporo 060-0818, Japan
b Division of Marine Life Sciences, Graduate School of Fisheries Sciences, Hokkaido
University, Hakodate, Hokkaido 041-8611, Japan.
1 The first two authors contributed equally to this work and they are the co-first authors.
Corresponding author: Yoshinori Ikenaka
Laboratory of Toxicology, Department of Environmental Veterinary Sciences, Graduate
School of Veterinary Medicine, Hokkaido University, Kita 18, Nishi 9, Kita-ku,
Sapporo 060-0818, Japan
Tel: +81-11-706-5102
Fax: +81-11-706-5105
E-mail: [email protected]
Abstract
Metabolic activity, particularly conjugation, was examined in fish by analyzing pyrene (a
four-ring, polycyclic aromatic hydrocarbon) metabolites using high-performance liquid
chromatography (HPLC) with fluorescence detector (FD), a mass spectrometry (MS) system,
and kinetic analysis of conjugation enzymes. Fourteen fresh water fish species, including Danio
rerio and Orizias latipes, were exposed to aqueous pyrene, and the resulting metabolites were
collected. Identification of pyrene metabolites by HPLC/FD and ion-trap MS indicated that the
major metabolites were pyrene glucuronide and pyrene sulfate in all 14 species. Differences
were observed in pyrene glucuronide:pyrene sulfate ratio and in the total amount of pyrene
conjugates excreted between fish species. Furthermore, a correlation was found between the
amount of pyrene glucuronide present and the total amount of the pyrene metabolite eliminated.
Kinetic analysis of conjugation by hepatic microsomes in vitro indicated that the differences in
excreted metabolites reflected the differences in enzymatic activities.
Keywords: Fish, pyrene, conjugation, polycyclic aromatic hydrocarbons (PAHs), metabolism,
inter-species difference
1. Introduction
Organisms vary greatly in their ability to metabolize xenobiotics (Guerrero et al., 2002).
This variation is due to differences in the patterns of xenobiotic bioaccumulation amongst
organisms, which influences their xenobiotic tolerance. Therefore, it is important to understand
the mechanisms of xenobiotic metabolism and to elucidate the physiological functions involved
in this process in each organism.
A number of studies have examined the metabolism of xenobiotics in aquatic organisms,
including fish. It is known that aquatic organisms living in chemically polluted environments
absorb lipophilic organic pollutants (Gobas et al., 2000) and metabolize xenobiotics. Generally,
metabolism is divided into three phases. Xenobiotics usually undergo biotransformation in
animals through phase-I (functionalization: i.e., oxidation, reduction, etc.), phase-II
(conjugation) reactions producing more polar derivatives, which are more readily excreted than
the parent compound (Oost et al., 2003), and phase-III involving excretion of metabolites from
cells by membrane proteins, such as ATP-binding cassette (ABC) transporters (Cole and Deeley,
1998). Several studies on metabolism of aryl-compounds show that fish can oxidize these
compounds and further transform them into glucuronide conjugates, sulfate conjugates, and
mercapturic acid. Glucoside conjugates can also be formed, although these are minor conjugates
in aquatic species (James, 1987; Willett et al., 2000; Luthe et al., 2002). Oxidation by
cytochrome P450 (CYP) and conjugation by enzymes such as UDP-glucuronosyltransferase
(UGT), sulfotransferases (SULT), and glutathione S-transferase (GST) participate in the
metabolism of aryl-compounds.
Polycyclic aromatic compounds, which include polycyclic aromatic hydrocarbons (PAHs),
are a widely studied class of contaminants. They are pervasive contaminants in rivers, lakes, and
nearshore marine habitats, and the largest fraction enters marine waters as land-based runoff or

atmospheric deposition. Many polycyclic aromatic compounds are toxic to humans and other
organisms. Extensive literature persists describing the effects of PAHs on animals, including
fish (Monteiro et al., 2000; Incardona et al., 2004; 2006). Endocrine disruption is one of these
effects. Monteiro et al. (2000) reported that PAHs inhibit ovarian steroidogenesis in flounders
by strongly blocking the activity of CYP 17, 20 lyase (Monterio et al., 2000). However, the
most well-known attribute of PAHs is their toxicity. Due to the production of high molecular
weight reactive intermediates by CYP1A, PAHs are carcinogenic and their toxicity is probably
mediated through this metabolic pathway. Therefore, it is important to know the metabolic
pathways that are affected by PAHs, including the conjugation and excretion of activated
phase-I metabolites.
There is currently limited information about xenobiotic metabolism in different fish
species. Despite this, fish are often used as environmental indicators and have been used in
various ecotoxicological studies. In the Organization for Economic Cooperation and
Development (OECD) test guidelines, species such as D. rerio (zebrafish) and O. latipes
(Japanese medaka) are used as standard test organisms in “the fish acute toxicity test,” “the
young fish development toxicity test,” and “the fish prolongation toxicity test.” For example, in
“the fish prolongation toxicity test,” no observed effect concentration (NOEC), death, and other
infections can be caused within 14–28 days of chemical exposure. Due to the widespread usage
of fish in these studies, it is important to elucidate the mechanisms and physiological functions
involved in xenobiotic metabolism in these species. It is also necessary to categorize
inter-species variation in these physiological functions.
This report describes differences in the metabolism of PAHs in 14 freshwater fish species.
Pyrene was chosen as a model compound for PAHs because it is one of the most abundant
PAHs in the environment (Vives et al., 2005). Moreover, several studies on biotransformation
have already used pyrene as a model substance (Luthe et al., 2002; Akkanen and Kukkonen,
2003; Stroomberg et al., 2004; Ikenaka et al., 2006, 2007; Ueda et al., 2011). In this study,
metabolites of pyrene excreted from fish in vivo and the kinetic parameters of pyrene
metabolism in phase-I (CYP) and phase-II (UGT and SULT) reactions in vitro were profiled.
Our results revealed new information about pyrene metabolism in different fish species,
including standard OECD test species.

2. Materials and Methods
2.1. Chemicals
Pyrene and sodium cholate were obtained from Kanto Chemical Co. Inc. (Tokyo, Japan).
1-Hydroxypyrene, sulfatase (from keyhole limpets, Type V; 34 units/mg), β-glucuronidase
(from bovine liver, Type B-1; 1240 units/mg), β-glucosidase (from almonds; 3.4 units/mg), and
bovine serum albumin and 3′-phosphoadenosine 5′-phosphosulfate (PAPS) were obtained from
Sigma-Aldrich (St. Louis, MO, USA). UDP-glucuronic acid (UDP-GA) was purchased from
Wako (Osaka, Japan). All chemicals used for high-performance liquid chromatography (HPLC)
and mass spectrometry (MS) were HPLC or MS grade and were obtained from Kanto Chemical
Co. Inc.
2.2. Animals
Fourteen fish species were used. Their common name, scientific name, and body weight
(g, mean ± SD) of the 14 fish species are listed in Table 1 (taken from Nelson, 2006). The
phylogenetic tree is illustrated in Figure 1. Fish species chosen included the OECD standard test
species and others fish species selected on the basis of the phylogenetic tree. Fish were
purchased from local pet shops (Sapporo, Japan). Animals were reared in aged tap water (i.e.,
tap water kept in the tank under air bubbling for at least 3 days; pH 8) at room temperature
(26°C) under a 14/10 h light/dark photoperiod. They were fed once daily. Treatment of all
animals was in accordance with the policies of the Institutional Animal Care and Use
Committee of Hokkaido University. All fish were held for a minimum of one week before use.
2.3. Pyrene exposure
To avoid the bacterial deconjugation effect, fish (n = 3) were food-deprived for 1 day and
washed three times with tap water purified by filtration through an ion exchange cartridge and a
0.2-µm membrane filter. Fish were then put in purified tap water for 3 h for acclimatization.
Once treatment was completed, animals were exposed to pyrene for 24 h at room temperature
(26°C). Exposure medium was prepared by adding 20 μl of pyrene (500 ppm; dissolved in
ethanol) to 150 ml of purified tap water to yield a final concentration of 67 ppb. Final
concentration used was half of the degree of physicochemical parameter of pyrene water
solubility (145 ppb). Two control sets were used: (1) fish in purified tap water without pyrene
and (2) pyrene in purified tap water without fish.
To determine whether there was any bacterial deconjugation effect, a glucuronide
conjugate purified from O. latipes (methanol solution) was added in place of pyrene to both
control sets and analyzed at 0 and 24 h..
2.4. Analysis of pyrene metabolites in exposure medium/water
To analyze the metabolites, 1 ml of purified tap water was centrifuged (5000 ×g, 3 min)
without any extraction in a 1.5-ml Eppendorf tube and was analyzed. Pyrene metabolites were
identified using HPLC by fluorescence detector (FD) equipped with an Inertsil ODS-3 column
(2.1 mm × 150 mm; GL Sciences, Inc.). HPLC was performed according to the method of Ueda
et al. (2011) with slight modification. In brief, mobile phase A consisted of 10 mM ammonium
acetate buffer (pH 5.0) and mobile phase B was methanol:acetonitrile:water (38:57:5, v/v/v).
Solvent gradient was 29 min in length, with 20% B from 0 to 3 min, followed by a linear
gradient to 88% B from 3 to 22 min then increasing to 98% B with a 4 min hold. Injection
volume of 10 μl, flow rate of 0.3 ml/min, and column temperature of 45°C were used

throughout. Excitation (Ex) and Emission (Em) wavelengths for FD were 343 and 385 nm,
respectively.
2.5. Enzymatic deconjugation for identification of pyrene metabolites formed by fish
Deconjugation was performed using the method described by Ikenaka et al. (2007).
Briefly, sulfatase, β-glucuronidase, and β-glucosidase were dissolved in 0.1 M sodium acetate
buffer (pH 5.0) to final concentrations of 10, 4000, and 17 units/ml respectively. Pyrene
metabolites in 30 µl of methanol solution were diluted by adding 270 µl of 0.1M sodium acetate
buffer (pH 5.0) and 200 μl of each deconjugation enzyme. In the control treatment, 200 μl of
bovine serum albumin (1 mg/ml) was added in place of the deconjugation enzyme. After
incubation for 8 h at 37°C in a water bath, 500 µl of methanol was added to stop the reaction.
After centrifugation (12,000 ×g for 10 min), the supernatant was analyzed using HPLC/FD
(10-µl injection).
For quality control (QC) and quality assurance (QA) of the deconjugation experiment, we
prepared the purified standard solution of pyrene glucuronide and pyrene sulfate (methanol
solution) from O. latipes. In each experiment, deconjugation enzymatic activities were
confirmed by using the purified standard solution as a positive control. We confirmed that all
positive control samples were deconjugated to 1-hydroxypyrene. Purified standard solution of
each conjugated pyrene in methanol was stable for at least 2 years when stored at −20°C.
2.6. MS condition for identification of pyrene metabolites formed by fish
HPLC with electrospray ionization ion-trap mass spectrometry (ESI/ion-trap/MS, LTQ
Orbitrap; Thermo Fisher Scientific, MA, USA) was used to identify pyrene metabolites
produced by fish. ESI conditions were full scan [mass-to-charge ratio (m/z) 80 to 800] and
negative mode, with an ion source voltage of −5.0 kV and an ion source temperature of 300°C.
Methanol solution, containing pyrene metabolites, was concentrated under a gentle stream of
nitrogen. HPLC conditions were as mentioned in section 2.4.
2.7. Quantitative determination of pyrene metabolites
Pyrene glucuronide and pyrene sulfate were deconjugated to 1-hydroxypyrene, and the
transformed ratios were 0.21 ± 0.007 and 0.29 ± 0.03, respectively.
Each pyrene metabolite was corrected to the 1-hydroxypyrene intensity using the
transformed ratio. Then, it was calculated to its amount (ppb) by the standard curve of
1-hydroxypyrene, and these amounts were concentrated (pmol). The concentration (pmol) was
corrected using biomass and liver weight of each fish (Table 1). Liver weight of four fish
species were 2.36 ± 0.58 (mean ± SD) for D. rerio, 1.73 ± 0.40 for O. latipes, 2.53 ± 0.58 for F.
gardneri, and 5.17 ± 1.22 for C. labiosa.
2.8. Preparation of microsomes from liver
Livers were collected from four fish species (D. rerio, O. latipes, F. gardneri, C. labiosa)
for analysis of enzyme activities. Microsomes were prepared using the method described by
Kawahara et al. (2009) with a slight modification. In brief, samples consisting of 3–6 pooled
livers were used. Livers were homogenized in 400 μl of buffer (0.1 M potassium phosphate,
0.25 M sucrose, 1.0 mM EDTA, and 0.5 mM PMSF; pH 7.4). Microsomal and cytosolic
fractions were prepared at 4°C by differential centrifugation. Supernatant of the first
centrifugation at 9,000 ×g for 10 min was further centrifuged at 100,000 ×g for 70 min to obtain
the cytosolic and microsomal fractions. Microsomal pellets were re-suspended in 150 μl of
buffer and were used to determine UGT activities. Protein concentration in each fraction was
measured using the BCA protein assay reagent kit (PIERCE, Rockford, Illinois, USA).
2.9. Ethoxyresorufin-O-deethylase activity
Ethoxyresorufin-O-deethylase (EROD) activity reaction was performed in a 100-μl
volume, which contained 10 mM G6P, 10 mM MgCl2, 400 μg microsomal protein, and varying
ethoxyresorufin concentrations (10, 5, 2.5, 1.25, 0.63, and 0.31 μM) in 100 mM potassium
phosphate buffer (pH 7.4). Reaction mixtures were pre-incubated for 5 min at 26°C, and the
reaction was initiated by adding a mixture of 10 mM NADPH and 200 U G6PDH, and the
mixtures were then incubated for 10 min at 26°C. The reaction was stopped with 200 μl of
ice-cold methanol, and samples were centrifuged at 3,000 rpm for 5 min. Supernatant was then
injected into the HPLC/FD system. HPLC was performed according to the method of
Pikkarainen (2006) with slight modification. Mobile phase A consisted of 10 mM ammonium
acetate buffer (pH 5.0) and phase B consisted of 100% acetonitrile. Solvent gradient was 13 min
in length with 20% phase B from 0 to 2 min, followed by linear gradient to 88% phase B from 2
to 10 min, then decreased to 20% phase B. Injection volume of 20 μl, flow rate of 0.2 ml/min,
and column temperature of 30°C were used throughout. Ex and Em wavelengths for FD were
545 and 588 nm, respectively. Kinetics parameters, including maximal velocity (Vmax),
Michaelis–Menten constant (Km), and Vmax/Km ratio were determined by the Michaelis–Menten
equation using Sigmaplot 11.2 software (Systat Software, Inc., San Jose, CA, USA).
2.10. UGT dependent 1-hydroxypyrene glucuronidation (HPyG) activity
UGT activity of 1-hydroxypyrene was assessed using the method described by Ueda et al.
(2011) with slight modification. Initially, 15 μl of hepatic microsome solution was mixed with
42 μl of 0.1 M phosphate buffer (pH 7.4). Microsome preparation was then mixed with 3 μl of 1%
sodium cholate solution and incubated on ice for 30 min. After this treatment, 50 μl of
microsome solution was mixed with 41.5 μl of 0.1 M phosphate buffer (pH 7.4), 5 μl of 50 mM
MgCl2, and 1 μl of 1-hydroxypyrene. Samples were then pre-incubated at 26°C for 5 min.
Reaction was initiated by adding 2.5 μl of UDP-GA (final concentrations were 100, 50, 25, 12.5,
and 6.25 μM) in a final volume of 100 μl. After incubation at 26°C for 10 min, reaction was
stopped by adding 400 μl of ice-cold methanol. Reaction samples were then placed on ice for 5
min before centrifugation at 2000 rpm for 10 min. The resultant supernatant was injected into
the HPLC system. Mobile phase A consisted of 10 mM ammonium acetate buffer (pH 5.0) and
phase B of methanol:acetonitrile:water (38:57:5, v/v/v). Liner gradient was 17 min in length
with 90% phase B. Injection volume of 20 μl, flow rate of 0.5 ml/min, and column temperature
of 45°C were used throughout. Ex and Em wavelengths for FD were 343 and 385 nm,
respectively. Kinetic parameters were determined using the Michaelis–Menten equation, as
mentioned in section 2.9.
2.11. SULT-dependent 1-hydroxypyrene sulfation (HPyS) activity
SULT activity for 1-hydroxypyrene was assessed by the method of Ueda et al. (2011)
with slight modification. Of 500 μg/ml hepatic cytosolic protein solution, 50 μl was mixed with
26.5 μl of 100 mM Tris-HCl buffer (pH 7.4), 10 μl of 50 mM MgCl2, 10 μl of 50 mM Na2SO3,
and 1 μl of 1-hydroxypyrene. Mixtures were pre-incubated at 26°C for 5 min. Reaction was
initiated with 2.5 μl of 1 mM PAPS in a final volume of 100 μl. After incubation at 26°C for
10 min, reaction was stopped by adding 400 μl of ice-cold methanol. Reaction samples were
then placed on ice for 5 min prior to centrifugation at 2000 rpm for 10 min. The resultant
supernatant was injected into the HPLC system. Mobile phase A consisted of 10 mM
ammonium acetate buffer (pH 5.0) and phase B of methanol:acetonitrile:water (38:57:5, v/v/v).
The solvent gradient was 17 min in length with a linear gradient of phase B from 50% to 90%
from 0 to 7 min, then kept at 90% for 3 min, and decreased to 50%. Injection volume of 20 μl,
flow rate of 0.5 ml/min, and column temperature of 45°C were used throughout. Ex and Em
wavelengths for FD were 343 and 385 nm, respectively. Kinetics parameters were determined
by the Michaelis–Menten equation as mentioned in section 2.9.
3. Statistical analysis
Values were represented as mean ± standard deviation (SD) for kinetic analysis and as
mean ± standard error (SE) for other experiments. Statistical analysis was performed using
Student’s t-test for the ratios of pyrene glucuronide:pyrene sulfate in each fish species,
Dunnett’s test for the total amount of pyrene conjugates in each fish species, and Tukey’s HSD
test for the total amount of pyrene metabolites per liver weight in four fish species. p < 0.05 was
considered statistically significant for all analyses. All kinetic parameters (Michaelis–Menten
equation) were analyzed using Sigmaplot 11.2 software.

4. Results
4.1. Identification of pyrene metabolites formed by each species
The results of pyrene exposure experiment revealed two major metabolites in all fish
species. The results of enzymatic deconjugation of these metabolites and the MS spectrum
identified these conjugates as pyrene-glucuronide (m/z 393) and pyrene-sulfate (m/z 297; Figure
2).
Representative HPLC/FD chromatograms of pyrene metabolites are shown in Figure 2.
These peaks were detected in all pyrene exposure treatment groups; however, they were not
detected in the control group. Therefore, they were considered to be pyrene-derived substances
and the main pyrene metabolites of fish. Pyrene metabolites, particularly pyrene glucuronide,
have been reported to be easily deconjugated by bacteria. For this reason, the experiments were
controlled for any bacterial effect. Furthermore, it was confirmed that metabolite compositions
detected from pyrene exposed fish and from purified tap water were not different. Moreover,
there was no difference in metabolite composition between purified tap water that was used in
the exposure experiment and aged tap water that was used for rearing the fish.
The volume of pyrene that remained in purified tap water was also analyzed using O.
latipes and C. labiosa. After 24 h of exposure to 10 µg pyrene in 100 ml water, 0.15 ± 0.01 µg
(O. latipes) and 0.15 ± 0.006 µg (C. labiosa) of the total amount remained. These results
indicate that approximately 98.5% of the pyrene was absorbed by the fish body (i.e., the
recovery rate of pyrene was more that 99%).
4.2. Amount of pyrene metabolites formed by each species
The amount of pyrene metabolites excreted differed by species (Figure 3). F. gardneri
excreted a high amount of pyrene glucuronide (92.7 pmol/24 h), whereas D. rerio and O.
niloticus excreted a high amount of pyrene sulfate (27.1 pmol/24 h and 22.3 pmol/24 h,
respectively; Tukey’s HSD test). C. labiosa produced significantly lesser amounts of pyrene
metabolite (41.97 pmol/24h), whereas F. gardneri produced a larger amount (704.96 pmol/24h).
Interestingly, the total amount of eliminated metabolites was significantly larger in species
whose main metabolite was pyrene glucuronide than that in species whose main metabolite was
pyrene sulfate (Tukey’s HSD test; p < 0.05). Moreover, the amount of pyrene glucuronide
correlated to the total amount of pyrene metabolites (r = 0.94; Figure 5).
4.3. Profile of pyrene metabolites formed by each species
Inter-species differences were observed in the ratio of pyrene glucuronide:pyrene sulfate
ratio (Figure 6). The major metabolite of O. latipes, F. gardneri, T. travancoricus, S. nigriventris,
and A. normai was pyrene glucuronide (p < 0.05). For C. auratus, C. aeneus, and C. labiosa, the
major metabolite was pyrene sulfate (p < 0.05). In D. rerio, T. albonubes, P. reticulate, O.
niloticus, X. maculatus, and P. innes, there was no difference between the amounts of pyrene
glucuronide and pyrene sulfate.
4.4. Comparison of pyrene metabolizing ability among fish species
Inter-species differences were observed in the total amount and the ratio of pyrene
metabolites. Therefore, enzyme activities (CYP1A, UGT, and SULT) were measured, and the
relationships to these differences were explored. EROD activity was used to determine phase-I
(CYP1A) activity. D. rerio, O. latipes, F. gardneri, and C. labiosa were chosen because D. rerio
and O. latipes are the main fish species used in OECD toxicological tests, whereas F. gardneri
and C. labiosa showed high and low total amounts of pyrene metabolites, respectively, in vivo.

Enzyme activities were measured in vitro using liver microsomes and cytosol to observe
hydroxylation, glucuronidation, and sulfation activities.
Activities of EROD, HPyG, and HPyS were different among the four fish species (Figure
7, Figure 8, Figure 9, and Table 2). Typical hyperbolic kinetics were observed for EROD and
HPyG activities (Figure 7 and 8). C. labiosa showed the lowest enzymatic efficiency for both
EROD and HPyG among the four species (Vmax/ Km values were 3.1 and 0.6, respectively). In
case of D. rerio, high EROD activities (Vmax/ Km was 25.5) were found. In contrast to C. labiosa,
O. latipes showed high HPyG activity (Vmax/ Km was 12.6). F. gardneri showed moderate
activity of both EROD and HPyG (Vmax/ Km were 17.6 and 6.8, respectively). In contrast, HPyS
activity of the four species demonstrated non-hyperbolic kinetics (Figure 9), fitting with a
substrate inhibition model. When examining HPyS kinetic parameters, O. latipes showed high
HPyS activity (Vmax/ Km was 14.3) and C. labiosa showed the lowest enzymatic efficiency (Vmax/
Km was 4.3). C. labiosa showed the highest inhibition constant (Ki was 117.7), whereas there
was no difference in Ki between the other three fish species.

5. Discussion
5.1. Pyrene metabolites excreted by fish
Results of pyrene exposure indicated that fish excreted mainly pyrene glucuronide and
pyrene sulfate. Differences in both the pyrene glucuronide:pyrene sulfate ratio and the total
amount of each excreted metabolite between fish species were observed.
In previous studies, it has been reported that fish can conjugate xenobiotics to sulfuric
acid, glucuronic acid, and glutathione (GSH; Beyer et al., 2010; James, 1987). The conjugated
metabolite of PAHs in fish is primarily glucuronic acid (Bayer et al., 2010; Hornung et al.,
2007), and it is known that glucuronidation of xenobiotics is performed by the action of UGT
(Leaver et al., 2007). For example, in Pleuronectes platessa hepatocytes, the extent of
glucuronide formation was higher than sulfate formation of 1-naphthol and phenolphthalein
(Morrison et al., 1985). GSH is also an important conjugate in fish because it contributes
significantly to metabolite levels. In Bullhead hepatocytes, benzo[a]pyrene is metabolized to
large amounts of GSH conjugates, which are more likely to be retained in the liver than
glucuronide or sulfates (Beyer et al., 2010). Glucuronic and glutathione conjugates are major
metabolites in fish. In contrast to fish, amphibians and crustaceans have a high capacity to
metabolize xenobiotics to sulfate conjugates (Ikenaka et al., 2006; Ueda et al., 2011). For
example, crustaceans such as D. magna and N. denticulata have high ability to predominantly
metabolize pyrene to pyrene sulfate (Ikenaka et al., 2006. 2007). However, in this study,
differences in the ratio of glucuronide:sulfate conjugation ratios among fish species were seen;
these species were divided in three groups on the basis on the differences in the ratio (Figure 6).
Highest amount of pyrene sulfate was excreted by D. rerio and O. niloticus, which
showed no difference in the pyrene glucuronide:pyrene sulfate ratio indicating that the two
species excrete pyrene glucuronide to the same extent. In fish species whose main metabolite
was pyrene sulfate, pyrene glucuronide was excreted at a low level, which was one factor
behind pyrene sulfate being the main metabolite. These results indicated that species diversity
exists in metabolism among different fish species.
5.2. Liver size, but not diet, affects differences in the total amount and the ratio of pyrene
metabolites
Liver weight may be one of the key factors contributing toward differences in the total
amount of pyrene metabolite because larger livers seemed to metabolize more xenobiotics than
smaller ones. The liver weight (mg):body weight (g) ratio for four fish species were 7.22 for O.
latipes, 8.77 for D. rerio, 5.39 for F. gardneri, and 4.83 for C. labiosa. Total amounts of
metabolites, normalized per liver weight, in each fish are shown in Table 1. Interestingly, no
significant differences in total amount of metabolites were observed in O. latipes, F. gardneri,
and D. rerio after normalization. These results indicate that liver size is one of the key factors
contributing toward total metabolite excretion. However, C. labiosa, still showed a significantly
lower elimination of pyrene metabolites compare to other species.
Next, we suspected that diet may be the second factor contributing toward differences in
metabolites. In a previous study, it was reported that herbivorous animals, including fish express
more CYP than carnivorous animals (Liu et al., 2006; Stegeman et al., 1997). In case of fish,
Stegeman et al. (1997) found that CYP2B-like proteins and CYP3A-like proteins are found at
high levels in herbivorous fish. However, most of the fish species in this study, including F.
gardneri and C. labiosa, were omnivorous (Bhattacharjee et al., 2009). Therefore, the
differences in the total amount and the ratio of pyrene metabolites were not related to diet.
These differences were also not related to body weight or the evolution of fish as indicated by
the phylogenetic tree as analyzed by Spearman’s ρ (ρ < 0.05).
5.3. Comparison of pyrene metabolizing ability among fish species
EROD and HPyG kinetics parameters (Vmax, Km, Vmax/Km) were similar to those of
previously reported fish species (Gonzalez et al., 2009). Gonzalez and coworkers found bluegill
HPyG activity to have Vmax, Km, and Vmax/ Km values of 263 (pmol resorufin/min/mg protein),
17.5 (μM), and 16.3 (pmol resorufin/min/mg protein/μM), respectively. In this study, C. labiosa
showed the lowest enzymatic efficiency for both EROD and HPyG activities among the four
species. These results were in accordance with the excreted amount of pyrene metabolites in
vivo.
HPyS activity demonstrated non-hyperbolic kinetics (Figure 9), fitting with a substrate
inhibition model. Some types of SULTs showed substrate inhibition for certain substrates such
as human SULT1A3 and dopamine (Wang et al., 2007; Barnett et al., 2004). However, when
inhibited, the velocity decreased to a plateau rather than to zero. This phenomenon was also
shown in a study, which observed partial substrate inhibition for human estrogen
sulfotransferase (EST) and estradiol (E2) (Zhang et al., 1998). This indicated that one or more of
the kinetic parameters for the reaction were being titrated from one value to another. In the
study by Zhang et al. (1998), two E2 were bound to each EST, suggesting that partial inhibition
occurred through binding at an allosteric site. From this report, we assumed that HPyS utilized
the same mechanism. When examining HPyS activity kinetic parameters, C. labiosa showed the
lowest enzymatic efficiency. This result was in accordance with the excreted amount of pyrene
metabolites in vivo. C. labiosa showed the highest inhibition constant, whereas there was no
difference in Ki between the other three fish species. However, because the concentration of
pyrene was very low in vivo (0.198 μM), it was not necessary to take Ki into account when
considering the relationship between in vitro and in vivo experiments. These data indicated that

both phase-I and phase-II metabolic activities potentially contributed toward the observed
inter-species differences in the excretion levels of pyrene metabolites in fish.
5.4. Why are there many variations of metabolism among fish species?
Mammals have been reported to metabolize PAHs predominantly to sulfate conjugates in
the early phase; however, in the late phase, glucuronide conjugates become the main metabolite
(Zamek-Gliszczynski et al., 2006). This phenomenon occurs because of sulfate ion depletion.
However, aquatic organisms live in an environment where sulfate ions are in abundance. There
is a possibility that sulfate conjugation is the fundamental biological defense mechanism against
xenobiotics for aquatic organisms because there is no need to be concerned about sulfate ion
depletion. It has been reported that the aquatic crustacean D. magna and some species of atyidae
(the fresh water shrimp decapoda), metabolize pyrene specifically to sulfate conjugates (Ikenaka
et al., 2006; 2007). In case of amphibians, which live in wetlands, pyrene is also metabolized
mainly to sulfate conjugates (Ueda et al., 2011). In case of fish, sulfate conjugation is the
fundamental biological defense mechanism against xenobiotics. Furthermore, the amount of
excreted sulfate conjugates was not as variable as that of excreted glucuronide conjugates. Clear
positive correlation between the amount of eliminated glucuronide conjugates and the total
amount of eliminated pyrene metabolites in fish supported this hypothesis.
Glucuronide conjugates require UDP-glucuronide, which is biosynthesized from
UDP-glucose, as a co-factor implying that glucose, an important source of energy for animals, is
used for xenobiotic metabolism. Therefore, it is possible that the strategy of xenobiotic
metabolism is directly linked to the specific carbohydrate metabolism strategy employed by
each fish species. Inter-species differences observed in metabolic patterns appeared to depend
on whether glucuronide conjugates were employed for metabolites or not by a default metabolic

strategy. F. gardneri, which had high levels of glucuronide conjugates and total metabolites,
employed the strategy of metabolizing with glucuronidation in addition to sulfation. In contrast,
C. auratus metabolized mainly with sulfation, which seemed to be the fundamental metabolite,
and little with glucuronidation. From these differences in energy strategy, it seemed that there
were variations in the amount and ratio of metabolites in fish species.

6. Conclusion
In conclusion, clear inter-species differences were found in both pyrene
metabolite characteristics and metabolic capacities for phase-I and phase-II reactions in
fish. Metabolites of pyrene were mainly pyrene-glucuronide and pyrene-sulfate. There
were also significant differences in the ratio of pyrene conjugates and the total amount
of pyrene conjugates. Pyrene-glucuronide seems to be the key factor to determine the
total amount of pyrene metabolites. Differences in CYP1A, UGT and SULT activities
were also observed between different fish species. Both phase-I and phase-II metabolic
activities potentially contributed to the species differences in the excretion levels of
pyrene in fish. These large differences in PAH metabolism between fish species were
found even between OECD standard test organisms D. rerio and O. latipes. It is
therefore necessary to consider inter-species differences in xenobiotic metabolism
during environmental toxicological assessments.
Acknowledgments
This study was supported in part by Grants-in-Aid for Scientific Research from
the Ministry of Education, Culture, Sports, Science, and Technology of Japan awarded
to M. Ishizuka (No. 19671001) and Y. Ikenaka (No. 2181000100).
The first two authors contributed equally to this work
7. References
Akkanen, J., Kukkonen, J.V.K., 2003. Biotransformation and bioconcentration of pyrene in
Daphnia magna. Aquat. Toxicol. 64, 53–61.
Barnett, A.C., Tsvetanov, S., Gamage, Niranjali., Martin, J.L., Duggleby, R.G., MaManus, M.E.,
2004. Active site mutations and substrate inhibition in human sulfotransferase 1A1 and
1A3. Biol. Chem. 279, 18, 18799-18805.
Beyer, J., Jonsson, G., Porte, C., Krahn, M. M., Ariese, F., 2010. Analytical methods for
determining metabolitesnof polycyclic aromatic hydrocarbon (PAH) pollutants in fish bile:
A review. Environ. Toxicol. Pharmacol. 30, 224-244.
Bhattacharjee, I., Aditya, G., Chandra, G., 2009. Laboratory and field assessment of the
potential of larvivorous, air-breathing fishes as predators of culicine mosquitoes. Biol.
Control. 49, 126-133.
Cole, S.P.C., Deeley, R.G., 1998. Multidrug resistance mediated by the ATP-binding cassette
transporter protein MRP. BioEssays 20, 931-940.
Gobas, F.A.P.C., Morrison, H.A., 2000. Bioconcentration and Biomagnification in the Aquatic
Environment. Bioconcentration. Biomagnification. Aquat. Environ. 9, 189-227
González, J. F., Reimschuessel, R., Shaikh, B., Kane, A.S., 2009. Kinetics of hepatic phase I
and II biotransformation reactions in eight finfish species. Mar. Environ. Res. 67, 183-188.
Guerrero, N.R.V., Taylor, M.G., Davies, N.A., Lawrence, M.A.M., Edwards, P.A., Simkiss, K.,
Wider, E.A., 2002. Evidence of differences in the biotransformation of organic
contaminants in three species of freshwater invertebrates. Environ. Pollut. 117, 523–530.
Hornung, M. W., Cook, M. P., Fitzsimmons, N.P., Kuehl, D.W., Nichols, J.W., 2007. Tissue
distribution and metabolism of benzo[a]pyrene in embryonic and larval medaka (Oryzias
latipes) Toxicol. Sci. 100, 393-405.
Ikenaka, Y., Eun, H., Ishizaka, M., Miyabara, Y., 2006. Metabolism of pyrene by aquatic
crustacean, Daphnia magna. Aquat. Toxicol. 80, 158-65.
Ikenaka, Y., Ishizaka, M., Eun, H., Miyabara, Y., 2007. Glucose–sulfate conjugates as a new
phase II metabolite formed by aquatic crustaceans. Biochem. Biophys. Res. Commun. 360,
490–495.
Incardona, J.P., Collier, T.K., Scholz, N.L., 2004. Defects in cardiac function precede
morphological abnormalities in fish embryos exposed to polycyclic aromatic hydrocarbons.
Toxicol. Appl. Pharmacol. 196, 191-205.
Incardona, J.P., Day, H.L., Cllier, T.K., Scholz, N.L., 2006. Developmental toxicity of 4-ring
polycyclic aromatic hydrocarbons in zebrafish is differentially dependent in AH receptor
isoforms and hepatic cytochrome P4501 A metabolism. Toxicol. Appl. Pharmacol. 217,
308-321.
James, M, O., 1987. Conjugation of organic pollutants in aquatic species. Environ. Health.
Perspective. 71, 97-103.
Kawahara, S., Hirai, N., Arai, M., Tatarazako, N., 2009. Effects of in vivo Combined Exposure
of Japanese Medaka (Oryzias latipes) to a Proestrogen, trans-Stilbene, and a CYP1A
Inducer, β-naphthoflavone. Environ. Chem. 19, 371-380.
Leaver, J.L., Wright, J., Hodgson, P., Boukouvala, E., George, S.G., 2007. Aquat. Toxicol. 84,
356-365.
Liu, X., Liang, P., Gao, X., Shi, X., 2006. Induction of the cytochrome P450 activity by plant
allelochemicals in the cotton bollworm, Helicoverpa armigera (Hübner). Pestic. Biochem.
Physiol. 84, 127-134.
Luthe, G., Stroomberg, G.J., Ariese, F., Brinkman, U.A.T., van Straalen, N.M., 2002.
Metabolism of 1-fluoropyrene and pyrene in marine flatfish and terrestrial isopods. Environ.
Toxicol. Pharmacol. 12, 221–229.
Monteiro, P,R,R., Reis-Henriques,M.A., Coimbra, J., 2000. Polycyclic aromatic hydrocarbons
inhibit in vitro ovarian steroidogenesis in the flounder (Platichthys flesus L.). Aquatic.
Toxicol. 48, 549-559.
Morrison, H., Young, P., George, S., 1985. Conjugation of organic compounds in isolated
hepatocytes from a marine fish, the plaice, Pleuronectes platessa. Biochem. Pharmacol. 34,
21, 3933-3938.
Nelson, J.S., 2006. Fishes of the World, fourth ed. Wiley, New York.
Oost, R.V.D., Beyer, J., Vermeulen, N.P.E., 2003. Fish bioaccumulation and biomarkers in
environmental risk assessment: a review. Environ. Toxicol. Pharmacol. 13, 57-149.
Pikkarainen, A.L., 2006. Ethoxyresorufin-O-deethylase (EROD) activity and bile metabolites as
contamination indicators in Baltic Sea perch: Determination by HPLC. Chemosphere 65,
1888-1897.
Stegeman, J.J., Woodin, B.R., Singh, H., Oleksiak, M.F., Celander, M., 1997. Cytochromes
P450 (CYP) in tropical fishes: catalytic activities, expression of multiple CYP proteins and
high levels of microsomal P450 in liver of fishes from Bermuda. Comp. Biochem. Physiol.,
Part C: Toxicol. Pharmacol. Endocrinol. 116, 61-75.
Stroomberg, G.J., Ariese, F., van Gestel, C.A.M., van Hattum, B., Velthorst, N.H., van Straalen,
N.M., 2004. Pyrene biotransformation and kinetics in the hepatopancreas of the isopod
Porcellio scaber. Arch. Environ. Contam. Toxicol. 47, 324–331.

Ueda, H., Ikenaka, Y., Nakayama, M.M.S., Tanaka-Ueno, T., Ishizuka, M., 2011. Phase-II
conjugation ability for PAH metabolism in amphibians: characteristics and inter-species
differences. Aquat. Toxicol. 105, 337-343.
Vives, I., Grimalt, J.O., Ventura, M., Catalan, J., 2005. Distribution of polycyclic aromatic
hydrocarbons in the food web of a high mountain lake, Pyrenees, Catalonia, Spain. Environ.
Toxicol. Chem. 24, 1344–1352.
Wang, L.Q., James, M.O., 2007. Sulfonation of 17 β-estradiol and inhibition of sulfotransferase
activity by polychlorobiphenylols and celecoxib in channel catfish, Ictalurus punctatus.
Aquat. Toxicol. 81, 286-292.
Willett, K.L., Gardinali, P.R., Lienesch, L.A., Giulio, R.T.D., 2000. Comparative metabolism
and excretion of Benzo(a)pyrene in 2 species of Ictalurid Catfish. Toxicol. sci. 58, 68-76.
Zamek-Gliszczynski, M, J., Hoffmaster, K, A., Nezasa, K., Tallman, M, N., Brouwer, K, L, R.,
2006. Integration of hepatic drug transporters and phase II metabolizing enzymes:
Mechanisms of hepatic excretion of sulfate, glucuronide, and glutathione metabolites. Eur.
J. Pharm. Sci. 27, 447-486.
Zhang, H., Varmalova, O., Vargas, F.M., Falany, C.N., Leyh, T.S., 1998. Sulfuryl Transfer: The
Catalytic Mechanism of Human Estrogen Sulfotransferase. Biol. Chem. 273, 18,
10888-10892.
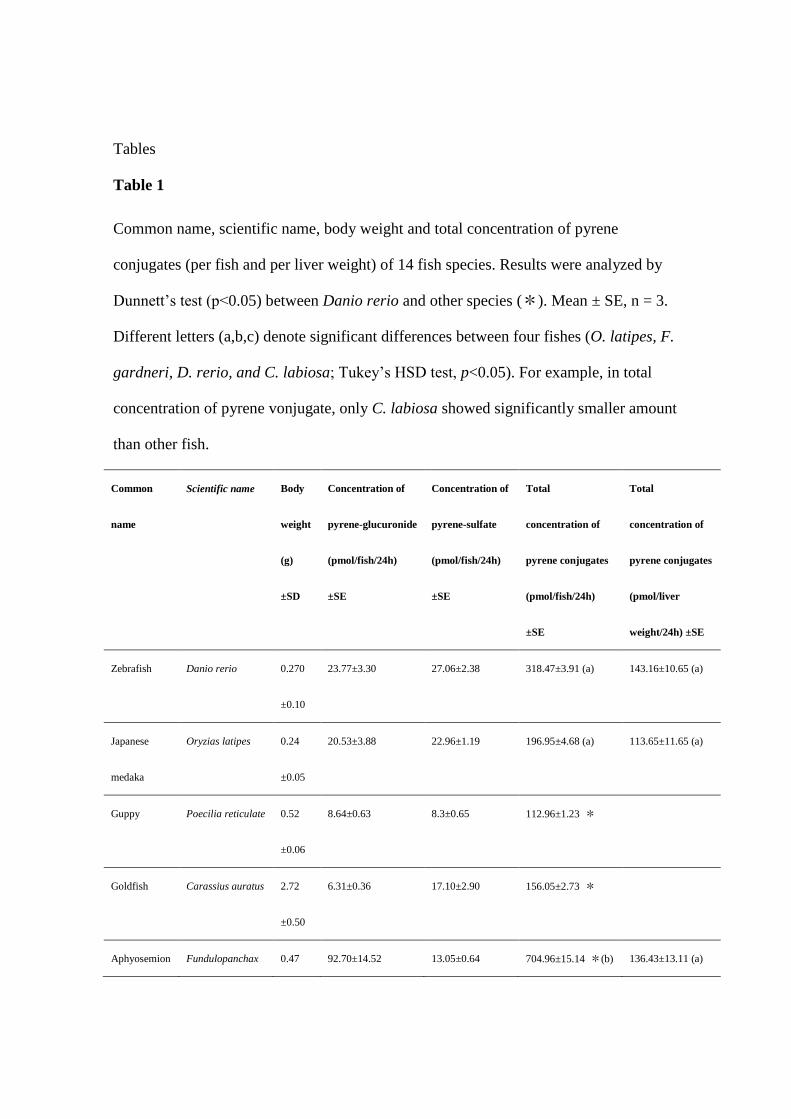
Tables
Table 1
Common name, scientific name, body weight and total concentration of pyrene
conjugates (per fish and per liver weight) of 14 fish species. Results were analyzed by
Dunnett’s test (p<0.05) between Danio rerio and other species (*). Mean ± SE, n = 3.
Different letters (a,b,c) denote significant differences between four fishes (O. latipes, F.
gardneri, D. rerio, and C. labiosa; Tukey’s HSD test, p<0.05). For example, in total
concentration of pyrene vonjugate, only C. labiosa showed significantly smaller amount
than other fish.
Common
name
Scientific name Body
weight
(g)
±SD
Concentration of
pyrene-glucuronide
(pmol/fish/24h)
±SE
Concentration of
pyrene-sulfate
(pmol/fish/24h)
±SE
Total
concentration of
pyrene conjugates
(pmol/fish/24h)
±SE
Total
concentration of
pyrene conjugates
(pmol/liver
weight/24h) ±SE
Zebrafish Danio rerio 0.270
±0.10
23.77±3.30 27.06±2.38 318.47±3.91 (a) 143.16±10.65 (a)
Japanese
medaka
Oryzias latipes 0.24
±0.05
20.53±3.88 22.96±1.19 196.95±4.68 (a) 113.65±11.65 (a)
Guppy Poecilia reticulate 0.52
±0.06
8.64±0.63 8.3±0.65 112.96±1.23 *
Goldfish Carassius auratus 2.72
±0.50
6.31±0.36 17.10±2.90 156.05±2.73 *
Aphyosemion Fundulopanchax 0.47 92.70±14.52 13.05±0.64 704.96±15.14 *(b) 136.43±13.11 (a)

gardneri gardneri
Red gourami Colisa labiosa 1.07
±0.41
1.61±1.61 4.69±2.36 41.97±3.33 *(c) 16.57±2.13 (b)
Nile tilapia Oreochromis
niloticus
0.42
±0.05
14.21±2.22 22.28±5.19 243.22±7.08
African
lampeye
Aplocheilichthys
normai
0.07
±0.01
39.79±11.49 10.83±0.93 337.51±10.56
White cloud
mountain
Minnow
Tanichthys
albonubes
0.17
±0.07
9.22±0.67 9.88±2.24 127.30±2.47 *
Green spotted
puffer
Tetraodon
travancoricus
0.15 20.15±7.73 6.87±0.21 180.16±7.92
Upside-down
catfish
Synodontis
nigriventris
1.4 44.83±19.36 9.01±1.99 358.96±19.14
Neon tetra Paracheirodon
innes
0.17
±0.03
5.89±0.92 7.32±0.28 88.07±1.19 *
Platy Xiphophorus
maculatus
0.93
±0.15
13.66±0.95 9.344±0.13 153.34±1.02 *
Corydoras Corydoras aeneus 1.30
±0.2
5.15±0.13 10.35±0.82 103.30±0.83 *

Table 2
Kinetic parameters of enzymes in fish.
EROD activity Vmax
(nmol/min/mg protein)
Km
(μM)
Vmax/ Km
(nmol/min/mg
protein/μM)
O. latipes 179.4 10.4 17.3
F. gardneri 40.4 2.3 17.6
D. rerio 28.1 1.1 25.5
C. labiosa 7.2 2.3 3.1
UGT activity Vmax
(pmol/min/mg protein)
Km
(μM)
Vmax/ Km
(pmol/min/mg
protein/μM)
O. latipes 609.5 48.5 12.6
F. gardneri 165.5 24.5 6.8
D. rerio 286.9 47.1 6.1
C. labiosa 54.4 96.9 0.6
SULT activity Vmax
(pmol/min/mg protein)
Km
(μM)
Vmax/ Km
(pmol/min/mg protein/μM)
Ki
(μM)
O. latipes 6.7 0.47 14.3 9.8
F. gardneri 35.7 4.7 7.6 5.9
D. rerio 21.7 2.4 9.0 9.5
C. labiosa 4.3 1.0 4.3 117.7

Vmax: maximum response velocity; Km: substrate concentration at Vmax /2, Vmax/ Km: enzyme
efficiency; Ki: inhibition constant

Figure legends
Fig. 1. Phylogenetic tree of the 14 fish species used in this experiment.
Fig. 2. High performance liquid chromatography (HPLC)/fluorescence detector (FD)
chromatogram of pyrene metabolites from six fish species (O. latipes, F. gardneri, P. reticulate,
C. auratus, D. rerio, and C. labiosa). Pyrene glucuronide (m/z 393) and pyrene sulfate (m/z 297)
were major metabolites in all the fish species. Excitation (Ex) and emission (Em) wavelengths
for FD were 343 nm and 385 nm, respectively.
Fig. 3. Concentrations of each pyrene conjugate in each fish species. Results were analyzed by
Tukey’s HSD test. Mean ± SE, n = 3.
Fig. 4. Total concentration of pyrene conjugates in each fish species. Results were analyzed by
Dunnett’s test (p < 0.05) between D. rerio and other species (*). Mean ± SE, n = 3.
Fig. 5. Relationship between the amount of pyrene glucuronide and the total amount of pyrene
metabolites determined by correlation analysis.
Fig. 6. Pyrene glucuronide:pyrene sulfate ratio in each fish species. Species were categorized
into three groups on the basis of the pyrene glucuronide:pyrene sulfate ratio. Results were
analyzed by Student’s t-test (p < 0.05), Mean ± SE, n = 3.
Fig. 7. Ethoxyresorufin-O-deethylase (EROD) activity. Data were fitted to nonlinear regression
curves using the Michaelis–Menten equation. Plots show the means (± SD) of the triplicate
procedures.
Fig. 8. UDP-glucuronosyltransferase (UGT) activity. Data were fitted to nonlinear regression
curves using the Michaelis–Menten equation. Plots show the means (± SD) of the triplicate
procedures.

Fig. 9. Sulfotransferases (SULT) activity. Data were fitted to nonlinear regression curves using
the Michaelis–Menten equation. Plots show the means (± SD) of the triplicate procedures.
Recommended