
1
__________CHAPTER I__________
CONVERSION OF BIOPITCH TO CARBON FOAM WITH
TUNABLE PROPERTIES: THE ROLE OF CHEMICAL
ACTIVATION
Adife Seyda Yargic
(Asst. Prof. Dr.), Bilecik Şeyh Edebali University, Bilecik, Turkey
e-mail: [email protected]
0000-0002-8671-5896
1. Introduction
Carbon foams are cellular structures with characteristic sizes
between 100-500 µm and involving randomly distributed pores. The
properties of carbon foams can be listed as adjustable thermal and electrical
conductivity, lightness, low thermal expansion, high thermal shock
resistance, and mechanical strength (Gao, et al., 2018; Liu, et al., 2014;
Wang, et al., 2016). These unique properties, which are primarily related
to the features of the precursors and working parameters, turn carbon foams
into high-performance engineering materials and become attractive for
numerous application fields in industries (Tzvetkov, et al., 2016). Carbon
foams are evaluated in various usages such as heat exchanger, high-
temperature heat insulation, electromagnetic shielding, the electrode for
fuel cells, catalyst support, sound/radar absorption, and filter (Antunes and
Velasco, 2014; Elgafy and Mishra, 2014; Liu, et al., 2014; Lv, et al., 2012;
Micheli, et al., 2014; Velasco, et al., 2010). Traditionally, carbon foams
are produced by foaming pitch-based or organic polymer resins, curing in
an inert atmosphere and applying carbonization/graphitization processes.
Pitch-based carbon foams are in tendency to give a regular graphitic
structure and reveal high thermal/electrical conductivities. On the contrary,
carbon foams with amorphous structures are synthesized from synthetic
polymer resins or naturally renewable materials (Chithra, et al., 2020).
In this study, carbon foam with adjustable properties was
synthesized from the pistachio shell, which was renewable household
waste, following the stages of pyrolysis, pitch production, foaming, and
carbonization, respectively. Within the scope of examining the effect of the
chemical activation process on carbon foam properties, it was aimed to
increase porosity by applying activation with potassium hydroxide after
the foaming process. In the last stage, comprehensive characterization

2
studies were carried out to determine the CHN content by elemental
analysis of carbon foams, to examine their structural, morphological, and
crystallographic properties, and to calculate porosity and compression
strength values to get information about structure-property relevance.
2. Materials and Methods
2.1. The Characteristics of Waste Biomass
Pistachio shells (PS) were first washed with distilled water and
were left to dry under laboratory air. Then, the particle size of the raw
material was minimized by operating Armfield FT-7A brand grinder and
the mean particle size was estimated as 1.57 mm via particle size analysis.
PS with a particle size in the range of 0.425> Dp> 0.25 mm was used in
the experiments. The structural analyzes that determine the amounts of
holocellulose, hemicellulose, extractive material, lignin, and cellulose, and
also a preliminary analysis of the raw material including moisture, ash,
volatile matter, and fixed carbon contents were performed based on ASTM
standard test methods (Ozbay and Yargic, 2019). The ultimate analysis
was carried out by examining the carbon, hydrogen, and nitrogen contents
in the structure of PS with the organic sample burning process carried out
in the elemental analysis device (Leco CNH628 S628) at 950 °C. The
oxygen content was ascertained by subtracting the total amount of CHN%
by weight obtained from the elemental analysis process from 100. Besides,
thermal degradation behavior of PS with thermogravimetric analysis
(TGA, Setaram Labsys Evo) and surface morphology with scanning
electron microscopy (SEM, Zeiss Supra VP 40) were investigated, and
functional groups were recognized by Fourier transform infrared
spectroscopy (FT-IR, Perkin Elmer Spectrum 100). Before SEM analysis,
the material was platinum-coated under vacuum in the Quorum Q 150 R
ES DC Sputter device. FT-IR spectra were taken using the attenuated total
reflectance (ATR) technique with a spectral resolution of 4 cm-1 in the
4000-400 cm-1 scan range.
2.2. Pyrolysis of PS and Tar Production
Pyrolysis process was practiced in stainless steel (# 316) Heinze
reactor under static atmospheric conditions at a heating rate of 7 °C/min.
The temperature of the reactor was measured with a thermocouple and the
heating of the system with the resistance furnace around the reactor was
carried out in a controlled manner. The temperature of PS (15 g) was raised
from Troom to the final pyrolysis temperature of 400 °C and it was held at
this temperature for 20 minutes until no remarkable gas evolution was
observed. After condensing the tar and aqueous phase mixture in liquid
collection traps at 0 °C, they were washed with dichloromethane and the
tar was transferred into the organic phase by splitting up in the separation
funnel. In the last stage, the aqueous phase that may have passed into the

3
organic phase was caught by using anhydrous sodium sulfate, and then the
tar yield was calculated by separating the tar and solvent in the rotary
evaporator. The solid product yield was determined by weighing the
remaining part in the reactor, and the gaseous product yield was attained
from the total mass balance. While determining the pyrolysis product
distribution, calculations were made on a dry and ash-free basis (daf) and
the mean of three runs was taken. Elemental analysis was accomplished to
examine the structure of tar (PS@400 °C) to be used in the production of
biopitch, FT-IR spectroscopy, proton nuclear magnetic resonance
spectroscopy (1H-NMR, Varian Mercury 300 MHz), and gas
chromatography-mass spectroscopy (GC-MS, GC-2010 Plus) analysis
methods were applied. In the GC-MS device, a TRB-5MS model column
with dimensions of 30mx0.25mmx0.25μm was used and the peaks were
identified using the Wiley7 library.
2.3. Biopitch Production Process from Tar
The biopitch to be used as a precursor in the fabrication of carbon
foam was prepared from the heavy phase aromatic structures in the tar
structure by the vacuum distillation process performed for 24 hours at 250
°C and 50 mbar vacuum pressure. The oxygen content in the structure of
biomass-based tar causes the deterioration of the pitch structure at higher
temperatures and the formation of solid thermofix carbon residue (Rocha,
et al., 2002). Prauchner et al. (2004) found that during the formation of
eucalyptus tar pitches through the distillation process at 250 °C, the C–O
bonds in the structure were broken, and although the side chains were
released, the heavier fractions in the aromatic ring reacted to create larger
molecules. While highlighting the structure of the biopitch, ash content and
softening point were determined, elemental analysis, helium gas
pycnometer, thermogravimetric analysis, and Fourier transform infrared
spectroscopy methods were applied.
2.4. Foaming, Carbonization and Activation Processes,
Product Characterization
An inert atmosphere was provided with nitrogen gas during the
foaming process of the biopitch performed in the Parr 4575B model reactor
(Parr Instrument Company, USA). Synthesized-green foam, which was a
semi-finished product, was produced by the process of heating the biopitch
up to 450 °C with a heating rate of 2.5 °C/min at 1MPa reactor pressure
and releasing the pressure after standing 1 hour at this temperature. To
promote the surface area of the synthesized-green foam, a chemical
activation process was applied with potassium hydroxide (KOH) in a ratio
of foam: activation agent of 1:1 (Tondi, et al., 2010). The chemical
reactions during the heat treatment applied to improve the surface area with
the help of potassium hydroxide were detailed in the previous study

4
(Yargic and Ozbay, 2019). In the last stage, the synthesized-green foam
and activated foam were heated to 1050 °C with a heating rate of 5 °C/min
under a N2 atmosphere (flow rate 100 mL/min) and carbonized for 2 hours
in a tube furnace. The carbonized foams were coded as PSCF or PSACF,
respectively, depending on whether they were synthesized or activated
from the pistachio shell-based biopitch.
Elemental analysis, x-ray diffraction (XRD, PANalytical
Empyrean, 2θ=0–80° range), scanning electron microscope (Zeiss Supra
VP 40), nitrogen sorption (Micromeritics ASAP 2020, @ 77 K) techniques
were used to analyze the characteristic properties of carbon and activated
foams. Also, Shimadzu AG-IC 100KN with a loading speed of 0.5 mm/min
was utilized to measure the compressive strengths. Finally, the bulk density
of the foams was computed and the porosity(%) was calculated by
measuring the actual density values with a helium pycnometer
(Micromeritics, Accupyc II 1340).
3. Results and Discussion
3.1. The Properties of PS
The results of the ultimate and proximate analyses of the pistachio
shell were presented in Table 1. According to the elemental analysis
results, the higher heating value (HHV) of PS was calculated as 15.11
MJ/kg from the Dulong formula (Harker & Backhurst, 1981). The high
volatile matter (80.68%) and low ash (2.12%) amounts of the PS with the
carbon (47.10%) and lignin contents (27.36%) indicated that the selected
biomass was suitable for the pyrolysis and biopitch preparation processes
to be applied in the development of carbon foam. As shown in Figure 1, it
was determined that PS consisted of particles with similar structures and
had a non-porous morphology due to the image taken at 5000x
magnification using the scanning electron microscope.
Figure 1. SEM Image of PS
10 µm

5
Table 1. The Results of Ultimate and Proximate Analyses
Ultimate Analysis
PS PS@400 °C
Component (%)
C 47.10 51.66
N 2.46 4.66
H 5.08 6.01
Oa 46.70 37.67
Empirical formula CH1.29N0.05O0.75 CH1.40N0.08O0.55
H/C 1.29 1.40
O/C 0.75 0.55
HHV (MJ/kg) 15.11 19.35
Proximate Analysis of PS
Preliminary analysis wt.%.
Moisture 2.05
Ash 2.12
Volatiles 80.68
Fixed Carbona 15.15
Structural analysis wt.%
Holocellulose 69.84
Hemicellulose 23.05
Extractives 0.68
Lignin 27.36
Cellulosea 46.79
Average bulk density (g/cm3) 0.71
a Calculated by the difference.
TG and dTG curves of the thermogravimetric analysis applied to
determine the thermal and pyrolytic behavior of PS were shown in Figure
2.a. According to the thermogravimetric analysis results, the moisture in
the structure of PS was removed in the first step between 80 and 120 °C,
the high weight loss was arisen due to the breakdown of cellulose and

6
hemicellulose through the pyrolysis reaction in the range of 180-450 °C,
and the degradation process was slower between 450 and 550 °C with
regards to the degradation of lignin (Yargıç et al., 2021). The ash and non-
degradable C amounts in the structure of raw material were detected from
the residue remaining from the thermogravimetric analysis.
Figure 2. a) TG/dTG Curves and b) FT-IR Spectrum of PS
Due to the FT-IR spectrum taken to examine the functional groups
in the PS structure (Figure 2b), the wide –OH band designating the
presence of alcohol/phenol or carboxylic acids around 3600-3300 cm-1
(Apaydın-Varol and Erülken, 2015) and peaks indicating the entity of
aliphatic structures and asymmetrical/symmetrical C–H vibrations
between 2950-2800 cm-1 were determined. Strong peaks around 1770-
1500 cm-1 referring to the existence of either ester, ketone, carboxylic acid,
or aldehyde indicated the C=C stretching vibrations in aromatic and
olefinic structures and C=O vibrations of the carbonyl group. Peaks in the
band range of 1480-1420 cm-1, which were an indicator of the presence of
unsaturated ethers and phenols, defined C–H bending vibrations in
aliphatic structures, and peaks between 1430-1200 cm-1 defined –CH
bending vibrations of aliphatic methyl and methylene, and also C–O–C
4000 3400 2800 2200 1800 1500 1200 900 700 380
Wavenumber (cm-1)
%T
b)
a)

7
stretching vibrations of unsaturated ethers. Finally, the C–O stretching
band of lignin in the structure of biomass was detected with severe peaks
around 1060-1020 cm-1. Finally, the C–O stretching band of lignin in the
structure of biomass was attributed to severe peaks around 1060-1020 cm-
1 (Sun and Webley, 2011).
3.2. Pyrolysis Product Distribution and Characterization of
Tar
According to the product distribution of the pyrolysis of PS at 400
°C, the gaseous and solid product yields were determined as 23.11% and
31.75%, respectively. Besides, tar and aqueous phase yields were
calculated as 19.40% and 25.74%. As given in Table 1, the C content was
detected as 51.66% and the higher heating value was 19.35 MJ/kg in
reference to the elemental analysis of tar (PS@400 °C). Tar produced by
thermal degradation of lignocellulosic biomass, which had a complex
chemical structure, was found to be comprised of various organic
compounds arising from the decomposition of cellulose, hemicellulose,
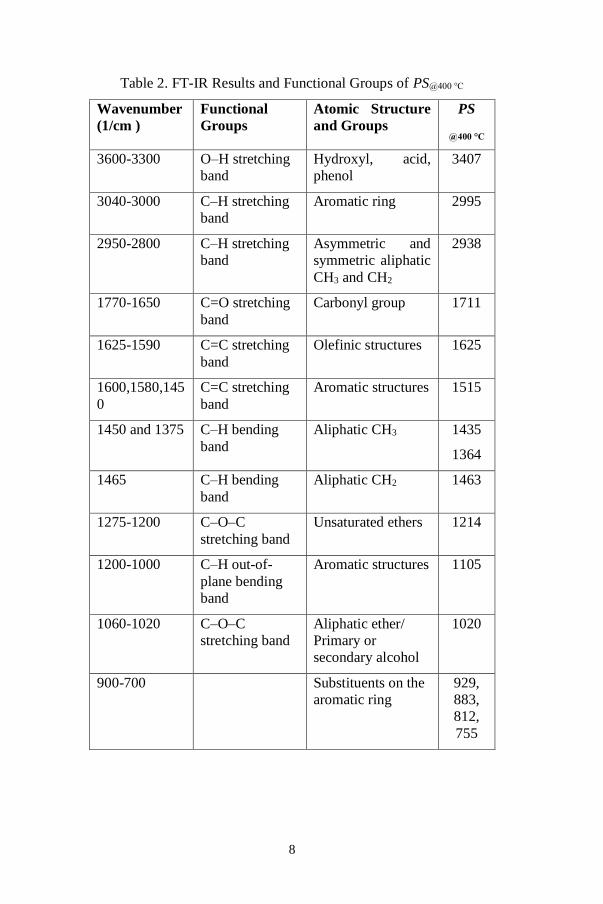
and lignin. Functional groups specified to be in the structure of PS@400 °C
via FT-IR analysis and the atomic structures/groups to which these
functional groups belong were presented in Table 2 related to their
wavenumber values.
GC-MS chromatogram of PS@400 °C tar and qualitative composition
data of organic fractions defined according to GC-MS analysis results were
given in Figure 3 and Figure 4, respectively. Chemical compounds were
categorized related to GC-MS chromatogram as acids (AC), alcohols (AL),
aldehydes (ALD), esters (EST), phenols (PH), ketones (KET), oxygenated
aromatics (OxyAR), and oxygenated phenols (OxyPH). Among these
compounds, phenols and aromatic hydrocarbons were classified as high
value-added chemicals that could be utilized in the production of next-
generation technological materials such as carbon foam or used as fuel
(Yaman, et al., 2018). It was found that furan and vanillin compounds were
formed in the tar due to the degradation of lignin, which was 27.36% in the
pistachio shell with lignocellulosic structure, during the pyrolysis process.
Furfural; 2-furan methanol; 2-methoxyphenol; 2-methoxy-4-methylphenol
and 2,6-dimethoxyphenol compounds were found more in the composition
of PS@400 °C tar compared to other compounds.
8
Table 2. FT-IR Results and Functional Groups of PS@400 °C
Wavenumber
(1/cm )
Functional
Groups
Atomic Structure
and Groups
PS
@400 °C
3600-3300 O–H stretching
band
Hydroxyl, acid,
phenol
3407
3040-3000 C–H stretching
band
Aromatic ring 2995
2950-2800 C–H stretching
band
Asymmetric and
symmetric aliphatic
CH3 and CH2
2938
1770-1650 C=O stretching
band
Carbonyl group 1711
1625-1590 C=C stretching
band
Olefinic structures 1625
1600,1580,145
0
C=C stretching
band
Aromatic structures 1515
1450 and 1375 C–H bending
band
Aliphatic CH3 1435
1364
1465 C–H bending
band
Aliphatic CH2 1463
1275-1200 C–O–C
stretching band
Unsaturated ethers 1214
1200-1000
C–H out-of-
plane bending
band
Aromatic structures 1105
1060-1020 C–O–C
stretching band
Aliphatic ether/
Primary or
secondary alcohol
1020
900-700
Substituents on the
aromatic ring
929,
883,
812,
755

9
Figure 3. GC-MS Chromatogram of PS@400 °C
Figure 4. Chemical Composition of the Organic Fraction PS@400 °C
The results of the 1H-NMR analysis applied to illustrate the
hydrogen species in the structure of PS@400 °C were represented in Table 3.
According to the 1H-NMR spectrum related to the chemical shift of the
proton species, it was noticed that the proportion of hydrogen bonds in
aromatic and phenolic compounds, which were noteworthy in biopitch and
carbon foam formation, was high. Thus, it was concluded that;
i) Aromatic hydrogen bonds belonging to aromatics and
conjugated olefins were found as 28.37% in the range of 9.0-6.0 ppm,
ii) Allylic and vinylic hydrogen bonds defining phenols and
unconjugated olefins were ascertained as 8.04% in the range of 6.0-4.0
ppm.
0%
10%
20%
30%
40%
Ch
rom
ato
gra
m a
rea (
%) PS@400 °C

10
Table 3. 1H-NMR Analysis Results of PS@400 °C
Chemical shift
range, δ (ppm) Hydrogen type PS@400 °C
0.5-1.0 CH3 and paraffinic CH3 groups in γ
or farther positions attached to the
aromatic ring
2.31
1.0-1.5 CH3, CH2, and CH in the β position
of the aromatic ring
8.66
1.5-2.0 CH2 and CH attached to naphthenes 5.21
2.0-3.0 CH3, CH2, and CH in the α position
of the aromatic ring
32.96
0.5-3.0 TOTAL ALIPHATICS 49.15
3.0-4.0 Hydroxyls, ring-binding
methylene, methyl and methoxy
13.13
4.0-6.0 Phenols, non-conjugated olefins 8.04
6.0-9.0 Aromatics, conjugated olefins 28.37
9.0-12.0 Aldehydes and/or carboxylic acids 1.31
3.3. The Properties of Biopitch
The elemental analysis, softening point (SP) and actual density
measurements, % ash and% yield calculation results of biopitch (PS-P50-
250°C-24h) prepared from PS@400 °C were given in Table 4. Accordingly,
as a result of the vacuum distillation process carried out for 24 hours at 250
°C and 50 mbar vacuum pressure, the biopitch with a C content of 73.785%
was produced with a yield of 20.37%. Considering the C content of the raw
material (47.10%), it was stated that the C content of the biopitch was
~57% higher than the raw material. Besides, the ash amount of the biopitch
structure was at a negligible level of 0.181% while the ash content in the
PS structure was 2.12%. The softening point of PS-P50-250°C-24h was
compatible with the softening points of biomass-based pitches in the
literature and was measured as 129.8 °C (Prauchner, et al., 2004; Yargic
and Ozbay, 2019).

11
Table 4. Biopitch Properties (T=250 °C, P=50mbar, t=24 h)
Precursor PS biopitch
C (%) 73.785
H (%) 6.627
O (%) 18.695
N (%) 0.893
Pitch yield (%) 20.37
Ash (%) 0.181
Density (g/cm3) 1.22
SP (°C) 129.8
The functional groups in the biopitch structure, which had a
complex composition and contained lignin-derived compounds, were
elucidated by examining the FT-IR spectrum (Figure 5). In reference to the
FT-IR spectrum, peaks of –OH and –COOH for free alcohol and phenolic
compounds near 3300 cm-1, and CH stretching vibrations related to alkane
structure around 2900 cm-1 were detected. The existence of C≡CH alkyne
stretching vibrations was proved by the peak observed in the 2100 cm-1
band. Unconjugated C=O (aldehyde, ketone, carboxylic acid) stretching
vibration peaks around 1700 cm-1, C=Car stretching band indicating the
presence of aromatic structures between 1600 and 1400 cm-1, CH bending
band of guaiacyl- and syringyl- derivatives at 1115 cm-1 and finally, the
peak of C=C cis bending band close by 750 cm-1 were observed (Araújo
and Pasa, 2003; Araújo and Pasa, 2004; Melo and Pasa, 2003). The
presence of hydroxyl and carboxyl groups referring to the existence of
oxygenated derivatives such as alcohol, phenol, aldehyde, ketone, and
carboxylic acid in the structure of the biopitch, which was determined to
have 18.695% O content from the elemental analysis results, was
supported by the FT-IR spectrum.

12
Figure 5. FT-IR Spectrum of PS-P50-250°C-24h
TG and dTG curves of the thermogravimetric analysis process
performed by heating the biopitch under a nitrogen sweeping environment
from room temperature to 1000 °C were shown in Figure 6. Regarding the
TG curve, a residue (44%) was formed as a result of decomposition
reactions that started at 200 °C and proceeded continuously up to 620 °C.
The behavior of the biopitch against the heating process applied during the
foaming process in the reactor was analyzed by the thermogravimetric
analysis. Oxygen, which was ascertained to be ~ 19% via elemental
analysis, moved away from the complex biopitch structure rich in aromatic
components during the foaming process and caused 56% degradation of
the biopitch as it supported self-combustion.
Figure 6. TG and dTG Curves of PS-P50-250°C-24h
3.4. The Characteristics of Carbon Foams
3.4.1. Elemental analysis
Elemental analysis results of carbonized foams (PZCF and
PZACF) synthesized from PS-based biopitch or after the activation process
-4
-3,5
-3
-2,5
-2
-1,5
-1
-0,5
0
0,5
1
0
20
40
60
80
100
120
0 200 400 600 800 1.000
TG
(%
)
Temperature (°C)
TG dTG
dT
G (%
/min
)
86
44
4000 3400 2800 2200 1800 1500 1200 900 700 380
Wavenumber (cm-1)
%T

13
were shown in Table 4. Conceiving that the PS-P50-250°C-24h biopitch
had 73.785% C and 18.695% O contents, the C content of biopitch-based
foams after carbonization increased to 91.66% and 84.046%; whereas the
O content decreased inversely to 5.736% and 13.570% for PZCF and
PZACF, respectively. In conclusion, higher O and lower C contents were
obtained when the activation process was applied after the foaming step
compared to the directly synthesized carbon foam.
Table 4. Elemental Analysis Results of Carbon Foams
Foam C (%) H (%) O (%) N (%)
PZCF 91.66 0.71 5.736 1.894
PZACF 84.046 0.552 13.570 1.832
3.4.2. Scanning electron microscope images
Both PZCF and PZACF had similar cell sequences at 200x
magnification of SEM images (Figure 7). Although the pores of the PZCF
carbon foam were partially closed, the pores of the PZACF were relatively
open, and also micro-cracks formed in the material structure. It was
observed clearly that the formation of windows, which allowed adjacent
cells to connect, in the carbon wall developed with the KOH activation.
The opening of the pores caused an enhancement in the surface area and
thus a reduction in the compressive strength. While there were cells of
various sizes in the range of 200-520 μm in the structure of the non-
activated foam, it was found out that smaller cells and a more regular pore
network were originated in the 40-335 μm range, thus the porosity was
increased after the activation process.
Figure 7. SEM Images of a) PZCF and b) PZACF
3.4.3. X-ray diffraction patterns
XRD parameters and diffraction patterns of biopitch-based non-
activated and activated carbon foams were offered in Table 5 and Figure
8. In the X-ray diffraction patterns, (1 0 0) and (0 0 2) planes were
specified as two characteristic planes particular to carbon-based materials.
a) b)
200 µm 200 µm

14
The broadband stacked graphitic basal plane (0 0 2), the maximum value
of which was around 2θ=23° in XRD patterns of all carbonaceous materials
and detected in the range of 2θ=10°–30°, was also identified in diffraction
patterns of pistachio shell biopitch-based carbon foams (Apaydın-Varol &
Erülken, 2015; Girgis, et al., 2002; Lopez, et al., 2013; Ozbay & Yargic,
2019; Tushar, et al., 2012; Zhang, et al., 2014). Besides, the diffraction
peaks around 2θ=23° and 43° corresponded to the planes of hexagonal
carbon (0 0 2) and hexagonal graphite (1 0 0), respectively (Gamllen &
White, 1976; Hull, 1926; Li, et al., 2014; Lipson and Stokes, 1942; Strano,
et al., 2002; Wang, et al., 2012); and the peak around 2θ=72° belonged to
orthorhombic graphite (Fayos, 1999). It was proven that the thermoplastic
property of the biopitch and small molecules in the structure prepossessed
the structural arrangement even at a low carbonization temperature of 1050
°C and promote the development of carbon crystals (Prauchner et al.,
2005).
Figure 8. X-Ray Diffraction Patterns of PZCF and PZACF ( :
Hexagonal Carbon, : Hexagonal Graphite, : Orthorhombic Graphite)
Table 5. XRD Parameters of PZCF and PZACF
Foam 2θ (002)
(°)
d002
(nm)
2θ (100)
(°)
d100
(nm)
PZCF 23.95 0.3713 43.38 0.2084
PZACF 23.01 0.3862 43.38 0.2084
3.4.4. Structural analysis
Nitrogen sorption isotherms and pore size distributions, which
were analyzed to elucidate the pore structures of carbon foams, were shown
in Figure 9, and also BET surface area, pore-volume, and average pore
0 10 20 30 40 50 60 70 80
Inte
nsi
ty (
a.u
.)
2θ (degree)
PZACF
PZCF

15
diameter values were given in Table 6. Following the SEM analysis, the
surface area value (783,171 m2/g) of the carbon foam (PZACF), which had
an open porous structure as a result of chemical activation, was much
higher than the surface area (1,334 m2/g) of the unactivated carbon foam
(PZCF). The adsorption/desorption isotherms of the carbon foams
conformed to the type IV isotherm implying the presence of micro and
mesopores according to the IUPAC classification. When the pore size
distribution plots were investigated, it was designated that the PZCF
carbon foam had an average pore diameter of 2.60 nm and showed a regular
pore size distribution. It was concluded that the size of the smaller pores
formed during the chemical activation process in the structure of the
PZACF was not uniform, but the average pore diameter (1.22 nm) value
shifted towards the micropore range, thus the surface area was improved.
Figure 9. Nitrogen Sorption Isotherms and Pore Size Distribution Plots
of a) PZCF and b) PZACF
0
1
2
3
4
5
6
7
0 0,1 0,2 0,3 0,4 0,5 0,6 0,7 0,8 0,9 1
Vad
s(c
m3/g
)
P/P0
PZCF
0
50
100
150
200
250
300
0 0,1 0,2 0,3 0,4 0,5 0,6 0,7 0,8 0,9 1
Vad
s(c
m3/g
)
P/P0
PZACF
0
0,01
0,02
0,03
0,04
0,05
0 10 20 30 40 50
Pore
volu
me
(cm
3/g
.nm
)
Pore diameter (nm)
0
0,001
0,002
0,003
0,004
0 5 10 15
Pore
volu
me
(cm
3/g
.nm
)
Pore diameter (nm)
a)
b)

16
Table 6. Structural Properties of Carbon Foams
Foam SBET
(m2/g)
Vtotal
(cm3/g)
Vmicro
(cm3/g)
Vmeso
(cm3/g)
Average pore
diameter
(nm)
PZCF 1.334 6.1686 0.0002 6.1684 2.60
PZACF 783.171 0.3623 0.3083 0.0540 1.22
3.4.5. Compressive strength and porosity(%)
It is known that the cell structure and density of porous carbon
foam are directly related to its strength and thermal conductivity.
Increasing the number of micro and mesopores in the foam structure
improves porosity but diminishes its strength value (Luo, et al., 2013;
Yargic & Ozbay, 2019). The porosity(%) was calculated due to the actual
and bulk density values specified in Table 7. Hereunder, depending on the
formation of windows connecting adjacent cells by chemical activation
process, the porosity value of PAZCF carbon foam was calculated as
91.32% while PACF’s was 87.96%. However, the compressive strength
test results revealed that PZACF strength value decreased by 71.36%
compared to PZCA carbon foam, inversely proportional to porosity(%).
The results obtained were in accordance with the scanning electron
microscope images and surface area values, and the properties of the
material were diversified with the chemical activation process.
Table 7. Compressive Strength and Porosity(%) Values of Biopitch-
Based Carbon Foams
Foam Strength
(MPa)
Bulk density
(g/cm3)
Actual density
(g/cm3)
Porosity
(%)
PZCF 0.887 0.1902 1.5795 87.96
PZACF 0.254 0.1535 1.7689 91.32
4. Conclusion
In recent years, studies on the selection of sustainable precursors
in the production of carbonaceous materials, optimizing the synthesis
conditions, and arranging the product properties to suit the application area
have come to the fore. In the study, it was aimed to obtain tar from the
pistachio shell, which was a household biomass waste, by pyrolysis
process at 400 °C, and to evaluate the biopitch produced by vacuum
distillation of tar in carbon foam production. In this context, the effects of

17
the chemical activation process on carbon foam properties were studied in
detail. The properties of the carbon foam (CHN content, compressive
strength, crystalline structure, morphology, surface area, etc.) were
significantly changed due to the formation of interconnected open cells in
the biopitch-based foam structure as a result of the chemical activation
process. It was determined that the C content of the carbon foam (PZCF)
synthesized without chemical activation was 9% higher than the PZACF
foam. Considering the compressive strength values, PZCF carbon foam
was 3.49 times more resistant than PZACF foam. Compared to the PZCF
foam produced without chemical activation, the porosity of PZACF carbon
foam was raised by 3.82%, which supported the presence of micropores in
the structure and confirmed the enhancement in surface area. As a result,
it is possible to synthesize high-tech materials such as carbon foam from
nutshells by applying simpler and economical processes as an alternative
to the high temperature/pressure conditions required in the processing of
coal and petroleum-based pitches and to tailor their properties via process
parameters.

18
References
Antunes, M., & Velasco, J. I. (2014). Multifunctional polymer foams with
carbon nanoparticles. Progress in Polymer Science, 39(3), 486-509.
Apaydın-Varol, E., & Erülken, Y. (2015). A study on the porosity
development for biomass-based carbonaceous materials. Journal of
the Taiwan Institute of Chemical Engineers, 54, 37-44.
Araujo, R. C. S., & Pasa, V. M. D. (2003). Mechanical and thermal
properties of polyurethane elastomers based on hydroxyl‐terminated
polybutadienes and biopitch. Journal of applied polymer
science, 88(3), 759-766.
Araújo, R. C. S., & Pasa, V. M. D. (2004). New Eucalyptus tar-derived
polyurethane coatings. Progress in Organic Coatings, 51(1), 6-14.
Chithra, A., Wilson, P., Vijayan, S., Rajeev, R., & Prabhakaran, K. (2020).
Carbon foams with low thermal conductivity and high EMI
shielding effectiveness from sawdust. Industrial Crops and
Products, 145, 112076.
Elgafy, A., & Mishra, S. (2014). A heat transfer model for incorporating
carbon foam fabrics in firefighter’s garment. Heat and Mass
Transfer, 50(4), 545-557.
Fayos, J. (1999). Possible 3D carbon structures as progressive
intermediates in graphite to diamond phase transition. Journal of
Solid State Chemistry, 148(2), 278-285.
Gamlen, P. H., & White, J. W. (1976). Structure and dynamics of
microcrystalline graphite, graphon, by neutron scattering. Journal of
the Chemical Society, Faraday Transactions 2: Molecular and
Chemical Physics, 72, 446-455.
Gao, N., Cheng, B., Hou, H., & Zhang, R. (2018). Mesophase pitch based
carbon foams as sound absorbers. Materials Letters, 212, 243-246.
Girgis, B. S., Yunis, S. S., & Soliman, A. M. (2002). Characteristics of
activated carbon from peanut hulls in relation to conditions of
preparation. Materials Letters, 57(1), 164-172.
Harker, J. H., & Backhurst, J. R. (1981). Fuel and energy. Academic Press
Limited, London.
Hull, A. (1926). Berichte der Deutschen Chemischen Gesellschaft. 59,
2433-2444.
Li, W., Huang, Z., Wu, Y., Zhao, X., & Liu, S. (2015). Honeycomb carbon
foams with tunable pore structures prepared from liquefied larch
sawdust by self-foaming. Industrial Crops and Products, 64, 215-

19
223. Lipson, H., & Stokes, A. R. (1942). A new structure of
carbon. Nature, 149(3777), 328-328.
Liu, H., Li, T., Wang, X., Zhang, W., & Zhao, T. (2014). Preparation and
characterization of carbon foams with high mechanical strength
using modified coal tar pitches. Journal of Analytical and Applied
Pyrolysis, 110, 442-447.
Lopez, F. A., Centeno, T. A., Garcia-Diaz, I., & Alguacil, F. J. (2013).
Textural and fuel characteristics of the chars produced by the
pyrolysis of waste wood, and the properties of activated carbons
prepared from them. Journal of Analytical and Applied
Pyrolysis, 104, 551-558.
Luo, X., Mohanty, A., & Misra, M. (2013). Lignin as a reactive reinforcing
filler for water-blown rigid biofoam composites from soy oil-based
polyurethane. Industrial Crops and Products, 47, 13-19.
Lv, Y., Gan, L., Liu, M., Xiong, W., Xu, Z., Zhu, D., & Wright, D. S.
(2012). A self-template synthesis of hierarchical porous carbon
foams based on banana peel for supercapacitor electrodes. Journal
of Power Sources, 209, 152-157.
Melo, B. N., & Pasa, V. M. (2003). Composites based on eucalyptus tar
pitch/castor oil polyurethane and short sisal fibers. Journal of
applied polymer science, 89(14), 3797-3802.
Micheli, D., Morles, R. B., Marchetti, M., Moglie, F., & Primiani, V. M.
(2014). Broadband electromagnetic characterization of carbon foam
to metal contact. Carbon, 68, 149-158.
Ozbay, N., & Yargic, A. S. (2019). Carbon foam production from bio‐
based polyols of liquefied spruce tree sawdust: Effects of
biomass/solvent mass ratio and pyrolytic oil addition. Journal of
Applied Polymer Science, 136(11), 47185.
Prauchner, M. J., Pasa, V. M., Molhallem, N. D., Otani, C., Otani, S., &
Pardini, L. C. (2005). Structural evolution of Eucalyptus tar pitch-
based carbons during carbonization. Biomass and Bioenergy, 28(1),
53-61.
Prauchner, M. J., Pasa, V. M., Otani, C., Otani, S., & de Menezes, S. M.
(2004). Eucalyptus tar pitch pretreatment for carbon material
processing. Journal of applied polymer science, 91(3), 1604-1611.
Rocha, J. D., Coutinho, A. R., & Luengo, C. A. (2002). Biopitch produced
from eucalyptus wood pyrolysis liquids as a renewable binder for
carbon electrode manufacture. Brazilian Journal of Chemical
Engineering, 19(2), 127-132.

20
Strano, M. S., Zydney, A. L., Barth, H., Wooler, G., Agarwal, H., & Foley,
H. C. (2002). Ultrafiltration membrane synthesis by nanoscale
templating of porous carbon. Journal of membrane science, 198(2),
173-186.
Sun, Y., & Webley, P. A. (2011). Preparation of activated carbons with
large specific surface areas from biomass corncob and their
adsorption equilibrium for methane, carbon dioxide, nitrogen, and
hydrogen. Industrial & engineering chemistry research, 50(15),
9286-9294.
Tondi, G., Pizzi, A., Delmotte, L., Parmentier, J., & Gadiou, R. (2010).
Chemical activation of tannin–furanic carbon foams. Industrial
Crops and Products, 31(2), 327-334.
Tushar, M. S. H. K., Mahinpey, N., Khan, A., Ibrahim, H., Kumar, P., &
Idem, R. (2012). Production, characterization and reactivity studies
of chars produced by the isothermal pyrolysis of flax straw. Biomass
and bioenergy, 37, 97-105.
Tzvetkov, G., Tsyntsarski, B., Balashev, K., & Spassov, T. (2016).
Microstructural investigations of carbon foams derived from
modified coal-tar pitch. Micron, 89, 34-42.
Velasco, L. F., Tsyntsarski, B., Petrova, B., Budinova, T., Petrov, N.,
Parra, J. B., & Ania, C. O. (2010). Carbon foams as catalyst supports
for phenol photodegradation. Journal of Hazardous
Materials, 184(1-3), 843-848.
Wang, R., Li, W., & Liu, S. (2012). A porous carbon foam prepared from
liquefied birch sawdust. Journal of Materials Science, 47(4), 1977-
1984.
Wang, Y., He, Z., Zhan, L., & Liu, X. (2016). Coal tar pitch based carbon
foam for thermal insulating material. Materials Letters, 169, 95-98.
Yaman, E., Yargic, A. S., Ozbay, N., Uzun, B. B., Kalogiannis, K. G.,
Stefanidis, S. D., Pachatouridou, E. P., Iliopoulou, E. F., & Lappas,
A. A. (2018). Catalytic upgrading of pyrolysis vapours: Effect of
catalyst support and metal type on phenolic content of bio-
oil. Journal of Cleaner Production, 185, 52-61.
Yargıç, A. Ş., Şahin, R. Z. Y., & Özbay, N (2021). Investigation of solvent
type effect on the structural properties of bio-polyol-based carbon
foam. Journal of the Faculty of Engineering and Architecture of
Gazi University, 36(1), 133-146.
Yargic, A. S., & Ozbay, N. (2019). Effect of chemical activation on the
cellular structure of biopitch-derived green carbon foam. Diamond
and Related Materials, 96, 58-66.

21
Zhang, S., Zheng, M., Lin, Z., Li, N., Liu, Y., Zhao, B., Pang, H., Cao, J.,
He, P., & Shi, Y. (2014). Activated carbon with ultrahigh specific
surface area synthesized from natural plant material for lithium–
sulfur batteries. Journal of Materials Chemistry A, 2(38), 15889-
15896.

22
Recommended


