11th December 2011
Islington: Census 2011 Second Release

Census release 2.1• On the 11th December 2012, the ONS released the key statistics and selected quick
statistics for local authorities in England and Wales.
• Topics covered in this release include demographics, ethnicity, religion, health,housing and accommodation, qualifications, labour market and migration.
• Further to this, the key statistics and the quick statistics for the output areas andwards is due to be released on the 30th January 2013.wards is due to be released on the 30 January 2013.
• All data in this briefing are available from the ONS at:http://www.ons.gov.uk/ons/rel/Census/2011-Census/key-statistics-for-local-authorities-in-england-and-wales/index.html
• Further Islington briefings for are available at the Evidence Hub at:http://evidencehub.islington.gov.uk/Demographics/census/Pages/default.aspx
• For further information, please contact Alexandra Cronberg([email protected], tel. 020 7527 1248)

Summary I
Demographic changes and migration
• The population of Islington increased by 30,000 (17%) between 2001 and 2011, to 206,100 residents. Almost 40% ofthis increase is accounted for by a growth in the population born in the European Union but outside of the UK andIreland (11,500 people, 73% increase). The number of people born in non-EU countries increased by 10,400 (25%increase), while the number of people born in the UK increased by 9,600 (8% increase).
• Islington’s population profile in terms of relationship status is considerably different compared to London and England,with the majority recorded as single (60% vs 44% in London and 35% in England). This proportion has increased from54% since 2001.
• Islington’s population has become more ethnically diverse over the past ten years, with less than half (48%) of residentsbeing White British in 2011 compared to 57% in 2001. This percentage is now slightly higher than the London average(45%) and much lower than the England average (80%).
• Less than half of Islington’s population (40%) describe themselves as Christian, down from 54% in 2001. This decrease• Less than half of Islington’s population (40%) describe themselves as Christian, down from 54% in 2001. This decreaseis in part due to more people describing themselves as having no religion (30% in 2011 vs 24% in 2001).
Education qualifications
• The percentage of residents with no education qualifications in Islington has decreased from 25% in 2001 to 17% in2011. A similar change has been seen in London and England.
Health
• There were 13,200 people Islington in 2011 who reported they were in bad or very bad health, equating to 6.4% ofresidents. Islington has the highest percentage of people reporting they are in bad or very bad health among Londonboroughs and it is higher than both the London and England averages (5.0% and 5.5% respectively).
• Twenty-four percent of households in Islington has a person with a long term health problem or disability. This reflects adecrease compared to 2001 (32%).

Summary II
Employment
• In 2011, 64% of Islington residents aged 16-74 were in employment, 6% were unemployed and 30% wereeconomically inactive. This represents an increase in employment compared to 2001 (58%) and no changein the level of unemployment.
• Six percent (6% of men, and 5% of women) of Islington's economically active population were unemployedin 2011, which is significantly higher than the London and England rates (both 5%).
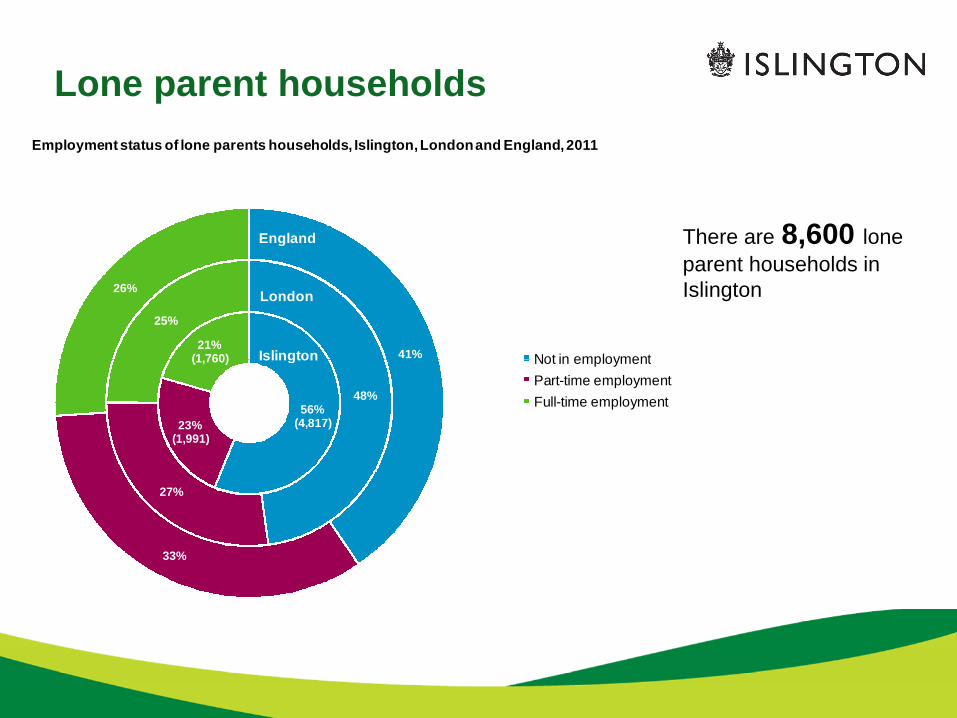
• More than half (56%) of lone parents in Islington were not in employment (4,800 people) in 2011. Thisproportion is notably higher compared to London and England (48% and 41% respectively).
Housing
• Social rented housing from the council and private rented housing from a landlord/letting agency account forthe largest proportions of housing tenure in Islington (27% and 26% respectively).
• Private renting has increased by 85% in Islington between 2001 and 2011, while outright ownership hasincreased by 19%. In contrast, social renting and mortgage-owned housing have decreased by 17% and9% respectively.
Car ownership
• Sixty-five percent of households did not own a car or van in 2011. This represents a 7% point decrease incar/van ownership between 2001 and 2011, which is slightly higher than the decrease seen in Londonoverall (5% point decrease).

1. DEMOGRAPHY• All London boroughs show an increase in the population from 2001 to 2011, with Islington increasing from
175,800 to 206,100 people (17% increase).
• Islington’s population profile in terms of relationship status is considerably different compared to Londonand England, with 60% of residents recorded as single compared to 44% in London and 35% in England.The percentage of people recorded as single in Islington has increased from 54% in 2001. The equivalentfigure was 41% in London and 30% in England in 2001.
• In Islington 46% of people (76,800) are not living in a couple and have single status. This is higher thanboth London (35%) and England (26%).
• The largest category for household composition in Islington is one person households (31%). This has• The largest category for household composition in Islington is one person households (31%). This haslargely remained unchanged since 2001 (32%).
• The percentage of households with no adults in employment or with a person with a long term healthproblem or disability has decreased in Islington between 2001 and 2011. Twenty-four percent ofhouseholds in Islington have a person with a long term health problem or disability (22,000 households),representing a decrease from 32% in 2001. Similarly, 24% of households in Islington have no adults inemployment and no dependent children, which is down from 29%. The percentage of households with noadults in employment and dependent children is 7%, which represents a decrease from 9%.
• There are 8,600 lone parent households in Islington. Of the lone parents in Islington, 56% are not inemployment, and 23% and 21% are in part-time and full-time employment respectively. The percentage notin employment is notably higher than London (48%) and England (41%).

Resident population
150,000
200,000
250,000
300,000
350,000
400,000
Re
sid
en
tpo
pu
lati
on
Resident population, Londonboroughs, 2001 and 2011
2001
2011
0
50,000
100,000
Cro
ydo
n
Ba
rne
t
Ealin
g
Bro
mle
y
Enf
ield
La
mb
eth
Bre
nt
Wa
ndsw
ort
h
Le
wis
ham
So
uthw
ark
Ne
wham
Hill
ing
do
n
Re
db
rid
ge
Ha
veri
ng
Wa
ltha
mF
ore
st
Bexl
ey
Ha
ring
ey
Gre
enw
ich
Ho
unsl
ow
Ha
rro
w
Ha
ckne
y
Ca
md
en
Tow
er
Ha
mle
ts
Me
rto
n
We
stm
inst
er
Sutto
n
ISLIN
GT
ON
Ric
hmo
ndup
on
Tha
me
s
Ha
mm
ers
mith
and
Ful
ham
Ba
rkin
ga
ndD
ag
enha
m
Ke
nsin
gto
nand
Che
lse
a
Kin
gst
on
upo
nT
ham
es
City
of
Lo
ndo
n
London borough

Marriage and civil partnership status
103,900 people were
recorded as single inIslington in 2011
54% Islington’s
population were25%
7%
4%3%
1%
44%
7%
5%
3%1%
35%
9%
7%3%
0%
Relationship status of residents, Islington, Londonand England, in 2011
population wererecorded as single in2001
The equivalent figure
was 41% and
30% for London and
England respectivelyin 2001
60%25%
40%
46%
Single (never married or never registered a same-sexcivil partnership)MarriedDivorced or formerly in a same-sex civil partnership which is now legally dissolvedWidowed orsurviving partner from a same-sexcivil partnershipSeparated (but still legally married or still legally in a same-sexcivil partnership)In a registered same-sexcivil partnership
Islington
England
London

Living arrangements
46% of Islington
residents weresingle and notliving in a couple in2011
In 2001 theequivalent figure
was 43%
20%
30%
40%
50%
60%
Pe
rce
nta
ge
Living arrangements of residents, Islington, London and England, 2011
was 43%
In London in 2001this figure was
33% and in
England it was
23%
0%
10%
Not living in acouple: Single
(never married ornever registereda same-sex civil
partnership)
Living in acouple: Married
or in a registeredsame-sex civil
partnership
Living in acouple:
Cohabiting
Not living in acouple: Married
or in a registeredsame-sex civil
partnership
Not living in acouple:
Separated (butstill legally
married or stilllegally in a
same-sex civilpartnership)
Not living in acouple: Divorcedor formerly in asame-sex civil
partnershipwhich is now
legally dissolved
Not living in acouple: Widowed
or survivingpartner from asame-sex civil
partnership
Living arrangement
Islington London England

Household composition
26,692
7,8217,705
5,659
7,295
9,613
4,564
6,560
2,891 2,599
882
28,643
11,854
8,6098,422 7,720 7,597
6,508 6,3443,812
2,553 1,494
0%
5%
10%
15%
20%
25%
30%
35%
40%
Pe
rce
nta
ge
Household composition,percentage of households, Islington, 2001 and 2011
2001
2011
0%
One
pe
rso
nho
use
hold
:O
the
r
Oth
er
house
hold
typ
es:
Oth
er
One
fam
ilyo
nly:
Lone
pa
rent
:D
ep
end
ent
child
ren
One
fam
ilyo
nly:
Co
ha
bitin
gco
up
le:
No
child
ren
One
fam
ilyo
nly:
Ma
rrie
do
rsa
me
-se
xciv
ilp
artne
rshi
pco
uple
:D
ep
end
ent
chi
ldre
n
One
pe
rso
nho
use
ho
ld:
Ag
ed
65
and
ove
r
One
fam
ilyo
nly:
Ma
rrie
do
rsa
me
-se
xci
vilp
art
ners
hip
coup
le:
No
child
ren
One
fam
ilyo
nly:
Lo
ne
pa
rent
:A
llch
ildre
nno
n-d
epe
nd
ent
Oth
er
ho
use
ho
ldty
pes:
With
de
pe
nde
ntchi
ldre
n
Oth
er
hous
eho
ldty
pe
s:a
llfu
lltim
est
ude
nts
,a
nda
lla
ge
d6
5a
nd
ove
r
Household composition
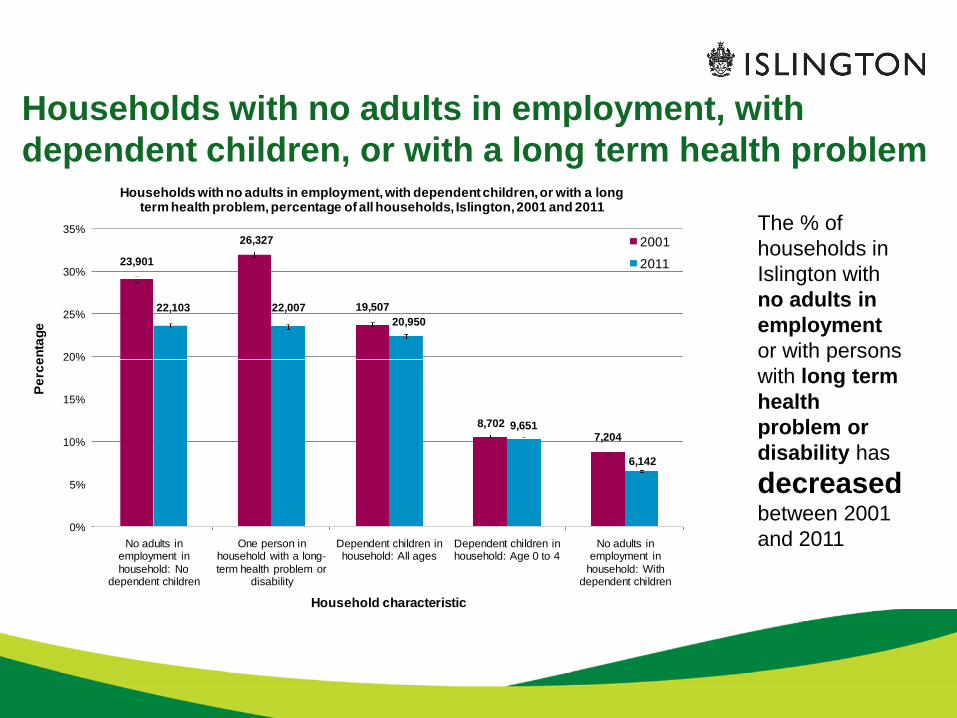
Households with no adults in employment, withdependent children, or with a long term health problem
The % ofhouseholds inIslington withno adults inemploymentor with persons
23,901
26,327
19,50722,103 22,007
20,950
20%
25%
30%
35%
Pe
rce
nta
ge
Households with no adults in employment, with dependent children,or with a longterm health problem, percentage of all households, Islington,2001 and 2011
2001
2011
or with personswith long termhealthproblem ordisability has
decreasedbetween 2001and 2011
8,7027,204
9,651
6,142
0%
5%
10%
15%
20%
No adults inemployment inhousehold: No
dependent children
One person inhousehold with a long-term health problem or
disability
Dependent children inhousehold: All ages
Dependent children inhousehold: Age 0 to 4
No adults inemployment in
household: Withdependent children
Pe
rce
nta
ge
Household characteristic
Lone parent households
21%(1,760)
25%
41%
26%
Employmentstatus of lone parents households, Islington,Londonand England,2011
Not in employmentIslington
England
London
There are 8,600 lone
parent households inIslington
56%(4,817)23%
(1,991)
(1,760)
48%
27%
41%
33%
Not in employment
Part-time employment
Full-time employment
Islington

2. ETHNICITY, IDENTITY, LANGUAGE ANDRELIGION
• The population of Islington increased by 30,000 (17%) between 2001 and 2011, to 206,100 residents. Almost 40% of thisincrease is accounted for by a growth in the population born in the European Union but outside of the UK and Ireland (11,500people, 73% increase). The number of people born in non-EU countries increased by 10,400 (25% increase), while thenumber of people born in the UK increased by 9,600 (8% increase). In contrast, the Irish population in Islington decreased by17% (1,200 people). In terms of the population growth with respect to people born in the EU, a similar share was born in thenew accession countries as within EU’s old boundaries. Consequently, people born within the old boundaries now account for70% of Islington residents born in the EU but outside of the UK and Ireland.
• Islington has an ethnically diverse population: less than half (48%) of residents describe themselves as White British, which isslightly higher than the London average (45%) and much lower than the England average (80%). Islington’s population hasbecome more diverse since 2001, when 57% of Islington residents described themselves as White British. This was slightlylower than London (60%) and again much lower than England (87%).
• Seventy-four percent of Islington residents describe themselves as at least one of English/Welsh/Scottish/NorthernIrish/British identities only; similar to London (75%) but lower than England (91%).
• Seventy-two percent of Islington residents have a UK passport, which is similar to London and slightly lower than England(71% and 76% respectively). Seven percent of Islington’s residents do not have a passport. The equivalent figure is 8% inLondon and 17% in England.
• In Islington, 76% of households have English as their main language, compared to 74% and 91% in households in Londonand England respectively. There are 12% of households (11,500) in Islington where no one has English as their mainlanguage. This is similar to London (13%) but higher than England (4%).
• Forty percent of Islington residents (82,900) describe themselves as Christian and 30% (61,900 people) are of no religion.The percentage of people who describe themselves as Christian has decreased from 54% in 2001 while the number of peoplewho stated that they were of no religion has increased from 24% in 2001.

Ethnicity
9%(19,034)
6%(13,339)
3%(6,943)
Ethnic groups of Islington residents, 2011
White: English/Welsh/Scottish/NorthernIrish/British
White: Other
In 2001 57% of
Islington’s residentswhere White British
In 201148%
(98,322)
20%(42,193)
13%(26,294)
Black/African/Caribbean/Black British
Asian/Asian British
Mixed/multiple ethnic group
Other ethnic group
In 2011
45% in London
and
80% in England
areWhite British

National identity
50%
60%
70%
80%
90%
100%
Pe
rce
nta
ge
Self-defined national identity of residents, Islington, London and England, 2011
151,941
5,769
48,415
0%
10%
20%
30%
40%
At least one ofEnglish/Welsh/Scottish/Northern
Irish/British identities only
Other identities and at least one ofEnglish/Welsh/Scottish/Northern
Irish/British only
Other identities only
Pe
rce
nta
ge
Islington London England

Country of birth
116,100
125,879
50%
60%
70%
80%
90%
100%
Pe
rcen
tag
e
Comparison of the country ofbirth for Islington residents, 2001 and 2011
2001 2011
7,370 6,848 7,873
37,606
7,216 5,679
13,587
5,795
47,969
0%
10%
20%
30%
40%
50%
England Rest of UK Republic of Ireland Other EU MemberStates (March 2001)
Other EU memberstates
(joined post-2001)*
Rest of the world
Pe
rcen
tag
e
*This category was new in the 2011 Census

Passports held
6,815
6,101
5,782
5,081
3,2293,131
1,985
14,542
Passports held by Islington residents, 2011
United Kingdom
Other EU countries
Republic of Ireland
72% of Islington
residents hold a UKpassport
147,787
19,967
Republic of Ireland
Middle East and Asia
North America and the Caribbean
Antarctica and Oceania
Africa
Other Europe: Non EU countries
Other
No passport
Note: The total adds to more than the Islington population, as some residents hold more than one passport.

Household language
70,980 9,071 2,054 11,451
London
Islington
Are
a
Households with people who speak English as a main language, Islington, LondonandEngland,2011
0% 10% 20% 30% 40% 50% 60% 70% 80% 90% 100%
England
Percentage
All people aged 16 and over in household have English as a main language
At least one but not all people aged 16 and over in household have English as a main language
No people aged 16 and over in household but at least one person aged 3 to 15 has English as a main language
No people in household have English as a main language

Religion
40%1%
1%
1%
0.3%
1%17%
Breakdown of religion, Islington residents, 2011
Christian
No religion
Muslim
In 2001
57% Islington’s residents
described themselves as
Christian and
24% said they had noreligion
30%
10%
Buddhist
Hindu
Jewish
Sikh
Other religion
Religionnot stated
In 2011 in London
48% describe themselves
as Christian and
21% have no religion
3. HEALTH
• There were 13,200 people in Islington in 2011 who stated their health was bad or very bad, equating to6.4% of the population. This percentage is the highest compared to all other London boroughs and higherthan both the London and England averages (5.0% and 5.5% respectively).
• Although the 2001 Census data is not directly comparable to the 2011 Census data due to differences inhealth status categories, the percentage of people that reported that their health was ‘not good’ in 2001 was11%.
• The proportion of people providing unpaid care in Islington in 2011 was 7.9%, which is lower than in London• The proportion of people providing unpaid care in Islington in 2011 was 7.9%, which is lower than in London(8.4%) and England (10.2%). Islington had one of the lowest proportions of people providing unpaid carecompared to other London boroughs, ranking 22nd from a total of 33 London boroughs.

Health status reporting
11%(23,113)
5%(9,771)
1.3%(3,473)
Reported health status of residents, Islington, 2011
Very good health
Good health
52%(106,386)
31%(63,382)
Fair health
Bad health
Very bad health

Health status reporting in London boroughs
3%
4%
5%
6%
7%
8%
9%
10%
Pe
rce
nta
ge
Residents reportingbad health or very bad health, London boroughs, 2011
London
England13,200people report tobe in bad or verybad health inIslington
0%
1%
2%
3%
Islin
gto
n
Ha
ckne
y
Ba
rkin
ga
nd
Da
ge
nha
m
Tow
er
Ha
mle
ts
We
stm
inst
er
Ha
ring
ey
Ne
wha
m
Ca
md
en
Enfie
ld
Gre
enw
ich
Bre
nt
Wa
ltha
mF
ore
st
Le
wis
ha
m
Ha
veri
ng
Ea
ling
So
uth
wa
rk
Re
db
rid
ge
Ha
mm
ers
mith
and
Fulh
am
Be
xle
y
La
mb
eth
Ho
unslo
w
Cro
ydo
n
Ha
rro
w
Ba
rne
t
Ke
nsin
gto
na
nd
Che
lse
a
Hill
ing
do
n
Bro
mle
y
Sutto
n
Me
rto
n
Wa
nd
sw
ort
h
Kin
gst
on
up
on
Tha
me
s
City
of
Lo
nd
on
Ric
hm
ond
up
on
Tha
me
s
London borough
Islington

Unpaid care
4%
6%
8%
10%
12%
14%
Pe
rce
nta
ge
Residents providing unpaid care,Londonboroughs,2011
London
England
16,300people providedunpaid care inIslington in 2011
0%
2%
Ha
veri
ng
Ha
rro
w
Be
xle
y
Bro
mle
y
Re
db
rid
ge
Sut
ton
Hill
ing
do
n
Cro
ydo
n
Ba
rne
t
Enfie
ld
Ho
unslo
w
Ba
rkin
ga
ndD
ag
enh
am
Gre
enw
ich
Bre
nt
Ea
ling
Ric
hm
ond
upo
nT
ha
me
s
Kin
gst
on
upo
nT
ham
es
Wa
ltha
mF
ore
st
Me
rto
n
Le
wis
ha
m
Ne
wha
m
Islin
gto
n
Ca
md
en
City
of
Lo
ndo
n
Tow
er
Ha
mle
ts
Ha
ring
ey
Ha
ckn
ey
We
stm
inst
er
So
uthw
ark
Ke
nsin
gto
na
ndC
hels
ea
Ha
mm
ers
mith
and
Ful
ha
m
La
mb
eth
Wa
nd
swo
rth
London borough

4. HOUSING AND ACCOMMODATION• There were 98,200 household spaces in Islington and 93,600 household spaces (95%) with at least one usual
resident in 2011. The number of household spaces with at least one resident in Islington has increased by 11,275(14% increase) from 2001 to 2011.
• The most common types of housing tenure in Islington are social rented housing from the council and privaterented housing from a landlord/letting agency (27% and 26% of all households respectively). Twenty-eight percentof households own their home with a mortgage/loan or outright.
• Private renting has increased by 85% in Islington between 2001 and 2011, while outright ownership has increasedby 19%. In contrast, social renting and mortgage-owned housing have decreased by 17% and 9% respectively.
• There were 10,300 households in Islington (11%) with an occupancy rating of -1 or less (bedrooms) in 2011. Thisis similar to London (12%) but higher than England (5%).is similar to London (12%) but higher than England (5%).
• The percentage of households in Islington without central heating has decreased from 7% in 2001 to 3% 2011.
• Sixty-five percent of households did not own a car or van in 2011. This represents a 7% point decrease in car/vanownership between 2001 and 2011, which is slightly higher than the decrease seen in London overall (5% pointdecrease).
• Islington ranks second highest compared to other London boroughs for the percentage of people in communalestablishments (6,000 people).
The occupancy rating of -1 or less indicates that the household has at least one too few bedrooms for thenumbers of people living there and is therefore considered overcrowded.

Accommodation type
54%
25%
14%
3%3% 1%
49%
16%
3%2%
1%
Household spacesby accommodationtype, Islington, 2001 and 2011
25%
29%
Flat, maisonette or apartment in purpose-built block of flats or tenement
Flat, maisonette or apartment in part of a converted or shared house (including bed-sits)
Terraced house or bungalow (including end-terrace)
Semi-detached house or bungalow
Flat, maisonette or apartment in a commercial building
Detached house or bungalow
2011
2001

Housing Tenure
29,320
12,958
17,394
11,168
25,01423,954
15,97714,328
20%
25%
30%
35%
40%
Pe
rce
nta
ge
Housing tenure, Islington, 2001 and 2011
2001
2011
In 2011
14% in Londonand
9% in Englandwere
private rented
17% in London12,958
11,168
8,193
2,384
*864
14,328
10,587
1,263 1,226 1,207
0%
5%
10%
15%
Social rented:Rented from
council (LocalAuthority)
Private rented:Private
landlord orletting agency
Owned:Owned with amortgage or
loan
Social rented:Other
Owned:Ownedoutright
Private rented:Other
Living rent free Sharedownership
(part ownedand partrented)
Pe
rce
nta
ge
Tenure*New category of 'Living rent free' included in2011 census.
17% in Londonand
13% in Englandwere
social rented

Occupancy rating
5%
10%
15%
20%
25%
30%
Pe
rce
nta
ge
Households with occupancyrating (bedrooms)of -1 or less, London boroughs,2011
London
England
The occupancy rating of -1 or less indicates that the household has at least one too few bedrooms forthe numbers of people living there and is therefore considered overcrowded.
0%
Ne
wha
m
Bre
nt
Tow
er
Ha
mle
ts
Ha
ring
ey
So
uth
wa
rk
Wa
ltha
mF
ore
st
Ha
ckn
ey
Ea
ling
Ba
rkin
ga
nd
Da
ge
nha
m
La
mb
eth
Ho
uns
low
Ha
mm
ers
mith
and
Ful
ha
m
Ca
md
en
Le
wis
ham
We
stm
inst
er
Enf
ield
Gre
enw
ich
ISL
ING
TO
N
Re
db
rid
ge
Ha
rro
w
Ba
rne
t
Hill
ing
do
n
Cro
ydo
n
Me
rto
n
Ke
nsi
ng
ton
and
Che
lse
a
Wa
ndsw
ort
h
City
of
Lo
ndo
n
Kin
gsto
nup
on
Tha
me
s
Sut
ton
Be
xle
y
Bro
mle
y
Ha
veri
ng
Ric
hm
ond
up
on
Tha
me
s
London borough

Car or van ownership
33,100 Islington
households own at least
60,500 Islington
households do not own acar/van
30%
4%1%
35%
6%
1%
Car/van ownership, households, Islington, 2001 and 2011
2011
2001
households own at leastone car/van65% 58%
35%
No cars or vans in household 1 car or van in household
2 cars or vans in household 3 or more cars or vans in household

Communal establishments6,000 people in
Islington live incommunalestablishments
85% of Islington
residents living incommunalestablishments live in
‘other‘
1%
2%
3%
4%
Pe
rce
nta
ge
Residents living in communal establishments,Londonboroughs,LondonandEngland,2011
London
England
‘other‘establishments,including studentaccommodation,hostels, and prisons
0%
Ca
md
en
ISL
ING
TO
N
We
stm
inst
er
City
ofL
ond
on
Hill
ingd
on
Kin
gst
on
upo
nT
ham
es
So
uth
wa
rk
Gre
enw
ich
Wa
ndsw
orth
Ke
nsin
gto
nand
Che
lsea
Ric
hm
ond
upo
nT
ham
es
Tow
er
Ham
lets
Ea
ling
Ba
rne
t
Ha
mm
ers
mith
and
Fulh
am
La
mbe
th
Le
wis
ham
Harr
ow
Cro
ydo
n
Ho
uns
low
Enf
ield
Bro
mle
y
Sutto
n
Ha
ckney
Bre
nt
Mert
on
Ha
ring
ey
Ha
veri
ng
Ne
wha
m
Wa
ltham
Fore
st
Re
db
rid
ge
Ba
rkin
ga
ndD
ag
enh
am
Be
xle
y
London borough

5. QUALFICATIONS
• Islington has a higher percentage of residents who have a university degree (48%) compared to London(38%) and England (27%).
• A similar pattern was seen in 2001, but the percentage of university-educated residents has increased in allthree areas.
• Seventeen percent of Islington residents in 2011 had no education qualifications, which is slightly lower• Seventeen percent of Islington residents in 2011 had no education qualifications, which is slightly lowerthan the London average. The percentage has decreased from 25% in 2001, when it was slightly higherthan the London average.

Qualification level
83,276
13,434
50%
60%
70%
80%
90%
100%
Pe
rce
nta
ge
Highest level of education achieved, residents aged 16 and over, Islington, LondonandEngland, 2011
Other
University education
2+ A-Levels
25% of
Islingtonresidents hadnoeducationalqualificationin 2001
29,448
13,943
14,552
1,743
16,904
0%
10%
20%
30%
40%
50%
Islington London England
Pe
rce
nta
ge
Area
2+ A-Levels
Apprenticeship
5+ GCSE/O-Level passes
1-4 GCSEs or O-Levels
No qualifications

6. LABOUR MARKET
• In 2011, 64% of Islington residents aged 16-74 were in employment, 6% were unemployed and 30% wereeconomically inactive. This represents an increase of 6% points in employment, no change in unemployment and 6%point decrease in economically inactive people from 2001.
• Six percent (6% in men, and 5% in women) of Islington's economically active population is currently unemployed, whichis significantly higher than the London and England rates (both 5%).
• The percentage of the resident population in full time employment in Islington has increased from 40% in 2001 to 42%in 2011. Forty-six percent of men and 39% of women are in full time employment.
• The majority (58%) of people in Islington who are employed work full-time (31-48hrs), which is similar to London andEngland. Islington has a higher proportion of people who work full time, longer hours (49 hours or more) compared toLondon and England (21% vs 16% and 13% respectively).London and England (21% vs 16% and 13% respectively).
• Professional, scientific and technical activities is the largest source of employment for Islington residents (19%). Incomparison, wholesale and retail trade, repair of motor vehicles and motor cycles is the largest source of employmentfor London and England (13% and 16% respectively).
• In 2011, professional occupations was the most prevalent occupation group in Islington (31%, 33,400 people), this hasincreased by 11% from 2001. Other prevalent occupational groups in Islington include associate professional andtechnical occupations (22%, 23,600) and managers, directors and senior officials (11%, 12,300).
Employment status categories are 1) Economically active: those who are either in employment or are actively seekingemployment and are available for work, 2) Economically inactive: those who are not in work and are not seeking workand are not available for work, 3) Employed: those that are in work and 4) Unemployed: those who are who are not inwork but are actively seeking work.

Labour market status
36%(47,069)
30%(47,661)
Labour market status, resident population aged 16-74, Islington, 2001 and 2011
Employed
Unemployed
Economically inactive2001
2011
58%(76,717)
6%(7,873)
64%(102,325)
6%(8,960)
Note: Full-time students have been excluded from this graph.

Unemployment
3%
4%
5%
6%
7%
8%
9%
Pe
rce
nta
ge
Unemployment, London boroughs, London and England, 2011
London
England
9,000 people
in Islington areunemployed
0%
1%
2%
3%
Bark
ing
and
Dagenham
New
ham
Hackn
ey
Tow
erH
am
lets
Lew
isham
Gre
enw
ich
Walth
am
Fore
st
Haringey
South
wark
Lam
beth
Enfie
ld
Bre
nt
Cro
ydon
Islin
gto
n
Redbridge
Ealin
g
Ham
mers
mith
and
Fulh
am
Hounslo
w
Harr
ow
Westm
inste
r
Cam
den
Barn
et
Have
ring
Hill
ingdon
Bexl
ey
Kensin
gto
nand
Chels
ea
Mert
on
Sutton
Bro
mle
y
Wandsw
ort
h
Kin
gsto
nupon
Tham
es
Ric
hm
ond
upon
Tham
es
City
of
London
Pe
rce
nta
ge
London boroughNote: Full-time students have been excluded from this graph.

Type of employment
61,581
30%
40%
50%
60%
70%
Pe
rce
nta
ge
Hours worked, resident employed population aged 16-74 years, Islington, London and England, 2011
7,790
14,494
22,900
0%
10%
20%
30%
Part-time: 15 hours or less Part-time: 16 to 30 hours Full-time: 31 to 48 hours Full-time: 49 or more hours
Pe
rce
nta
ge
Type of employment and hours worked
Islington London England

Industry
20,470
10,793 10,356 10,319 10,146 9,644
5,9664,744 4,499 3,768
16,030
0%
5%
10%
15%
20%
25%P
rofe
ssi
ona
l,sc
ient
ific
and
tech
nica
l
Info
rma
tio
na
ndco
mm
unic
atio
n
Ed
uca
tio
n
Hum
an
hea
ltha
ndso
cia
lwo
rka
ctiv
itie
s
Who
lesa
lea
ndre
tail
tra
de
;re
pa
iro
fm
oto
r
Fin
anc
iala
ndin
sura
nce
act
iviti
es
Acco
mm
od
atio
na
ndfo
od
serv
ice
Ad
min
istr
ativ
ea
ndsu
pp
ort
serv
ice
Pub
lica
dm
inis
tra
tion
and
de
fenc
e;
Co
nstr
uctio
n
Oth
er
Pe
rce
nta
ge
Industry of occupation, resident employed population ages 16-74, Islington, London andEngland, 2011
Pro
fessi
ona
l,sc
ient
ific
and
tech
nica
la
ctiv
itie
s
Info
rma
tio
na
ndco
mm
unic
atio
n
Ed
uca
tio
n
Hum
an
hea
ltha
ndso
cia
lwo
rka
ctiv
itie
s
Who
lesa
lea
ndre
tail
tra
de
;re
pa
iro
fm
oto
rve
hicl
es
and
mo
tor
cycl
es
Fin
anc
iala
ndin
sura
nce
act
iviti
es
Acco
mm
od
atio
na
ndfo
od
serv
ice
act
iviti
es
Ad
min
istr
ativ
ea
ndsu
pp
ort
serv
ice
act
iviti
es
Pub
lica
dm
inis
tra
tion
and
de
fenc
e;
com
pul
sory
soci
als
ecu
rity
Co
nstr
uctio
n
Oth
er
Industry
Islington London England
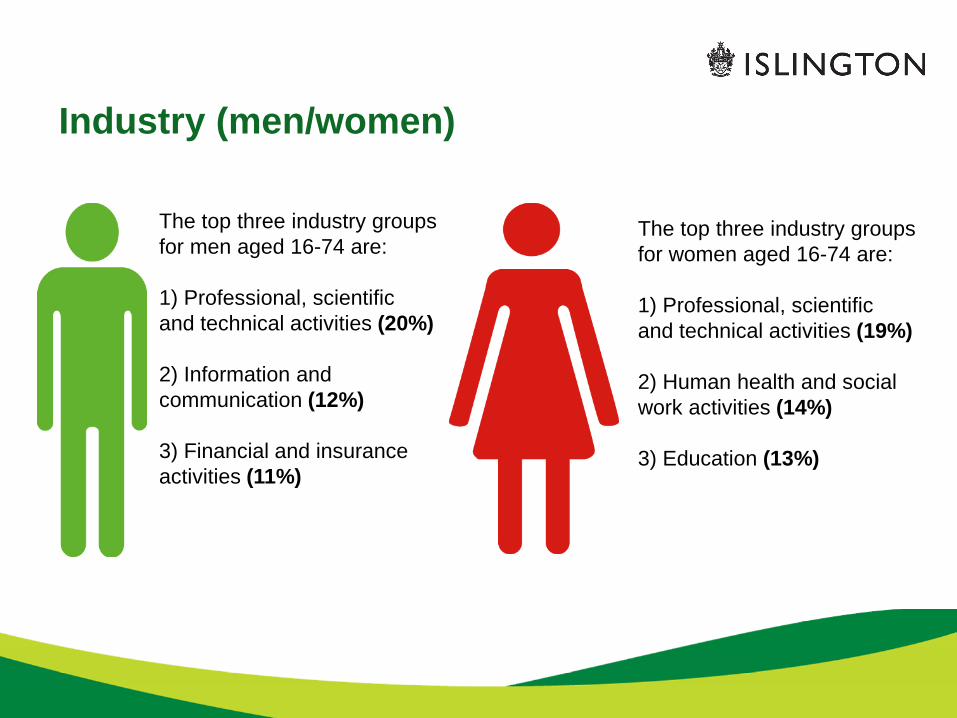
Industry (men/women)
The top three industry groupsfor men aged 16-74 are:
1) Professional, scientificand technical activities (20%)
The top three industry groupsfor women aged 16-74 are:
1) Professional, scientificand technical activities (19%)
2) Information andcommunication (12%)
3) Financial and insuranceactivities (11%)
2) Human health and socialwork activities (14%)
3) Education (13%)

Occupation
20%5%
5%5%
4%31%
7%
6%
6%
5%3%
Occupation ofemployment, residentpopulationaged 16-74, Islington,2001 and 2011
Professional occupations
Associate professional and technicaloccupations
Managers, directors and seniorofficials
Administrative and secretarialoccupations
Elementary occupations
2011
2001
23%
17%
12%
9%
22%11%
9%
7% Elementary occupations
Caring, leisure and other serviceoccupations
Sales and customer serviceoccupations
Skilled trades occupations
Process, plant and machineoperatives

Occupation (men/women)
The top three occupationgroups for men are:
1) Professional occupations(31%)
The top three occupationgroups for women are:
1) Professional occupations(32%)(31%)
2) Associate professional andtechnical occupations (23%)
3) Managers, directors andsenior officials (14%)
(32%)
2) Associate professional andtechnical occupations (21%)
3) Administrative andsecretarial occupations (13%)

7. MIGRATION
• Twenty-one percent of Islington residents born outside the UK arrived into the UK between 1991 and 2000(5,600 people). This is higher than the equivalent percentage for England (17%). Forty-nine percent ofIslington residents born outside the UK arrived into the UK between 2001-2011, which is similar to England(50%).
• Immigrants living in Islington are more likely to have arrived aged between 20 and 29 years compared toEngland (46% vs 38%).
• Approximately 1 in 2 Islington residents born outside the UK stay in the UK for 10 years or more.
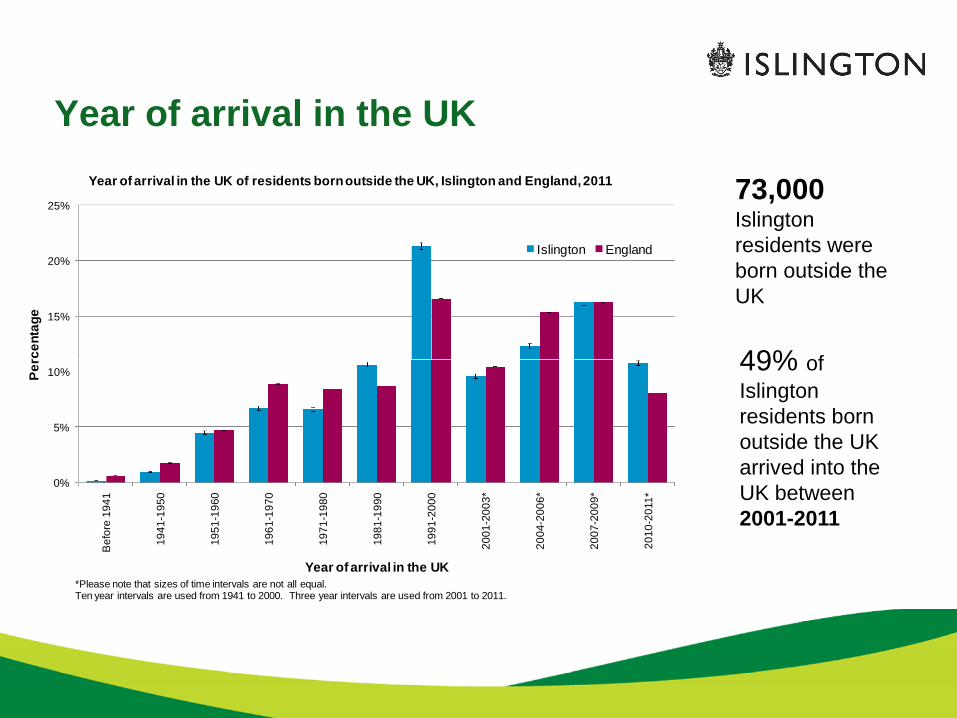
Year of arrival in the UK
15%
20%
25%
Pe
rce
nta
ge
Year of arrival in the UK of residents bornoutside the UK, Islington and England,2011
Islington England
73,000Islingtonresidents wereborn outside theUK
49% of
0%
5%
10%
Be
fore
19
41
19
41
-19
50
19
51
-19
60
19
61
-19
70
19
71
-19
80
19
81
-19
90
19
91
-20
00
20
01-2
00
3*
20
04-2
00
6*
20
07-2
00
9*
201
0-2
011
*
Pe
rce
nta
ge
Year of arrival in the UK*Please note that sizes of time intervals are not all equal.Ten year intervals are used from 1941 to 2000. Three year intervals are used from 2001 to 2011.
49% of
Islingtonresidents bornoutside the UKarrived into theUK between2001-2011
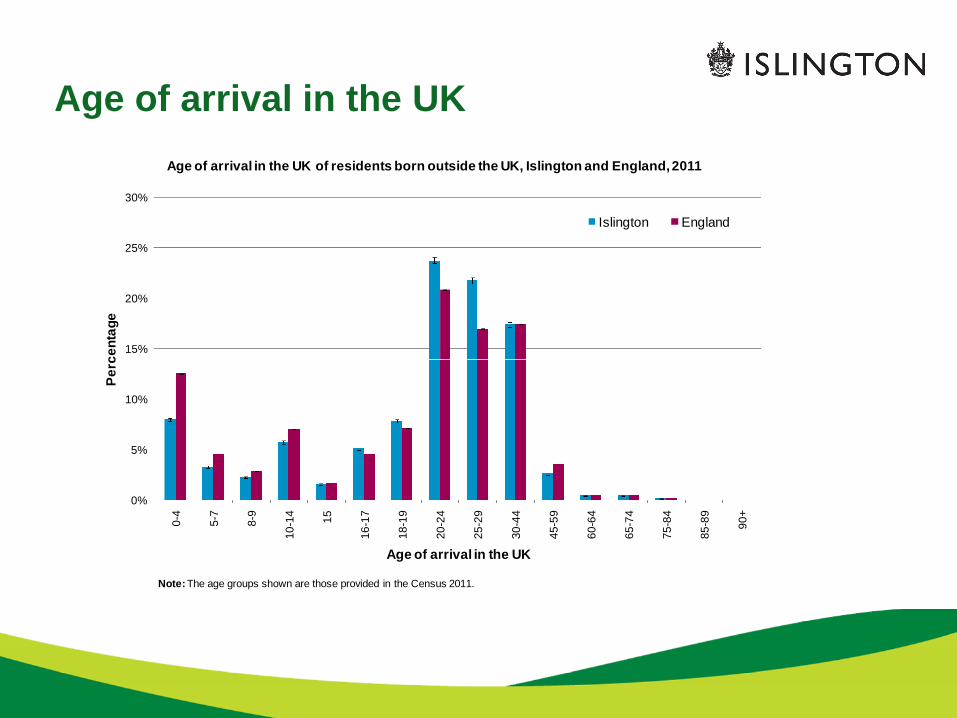
Age of arrival in the UK
15%
20%
25%
30%
Pe
rce
nta
ge
Age of arrival in the UK of residents born outside the UK, Islington and England,2011
Islington England
0%
5%
10%
0-4
5-7
8-9
10
-14
15
16
-17
18
-19
20
-24
25
-29
30
-44
45
-59
60
-64
65
-74
75
-84
85
-89
90
+
Pe
rce
nta
ge
Age of arrival in the UK
Note:The age groups shown are those provided in the Census 2011.

Length of residence in the UK
40%
50%
60%
Pe
rce
nta
ge
Length of residence in the UK of residents born outside the UK, Islington andEngland, 2011
Islington England
0%
10%
20%
30%
Less than 2 years 2 years or more but lessthan 5 years
5 years or more but lessthan 10 years
10 years or more
Pe
rce
nta
ge
Length of residence
Recommended