doi:10.1182/blood-2004-10-3864Prepublished online December 16, 2004;
Jing Jin Gu, Lalaine Santiago and Beverly S Mitchell cell lines expressing Bcr-AblSynergy between imatinib and mycophenolic acid in inducing apoptosis in
(795 articles)Oncogenes and Tumor Suppressors � (4217 articles)Neoplasia � (746 articles)Apoptosis �
Articles on similar topics can be found in the following Blood collections
http://bloodjournal.hematologylibrary.org/site/misc/rights.xhtml#repub_requestsInformation about reproducing this article in parts or in its entirety may be found online at:
http://bloodjournal.hematologylibrary.org/site/misc/rights.xhtml#reprintsInformation about ordering reprints may be found online at:
http://bloodjournal.hematologylibrary.org/site/subscriptions/index.xhtmlInformation about subscriptions and ASH membership may be found online at:
digital object identifier (DOIs) and date of initial publication. theindexed by PubMed from initial publication. Citations to Advance online articles must include
final publication). Advance online articles are citable and establish publication priority; they areappeared in the paper journal (edited, typeset versions may be posted when available prior to Advance online articles have been peer reviewed and accepted for publication but have not yet
Copyright 2011 by The American Society of Hematology; all rights reserved.20036.the American Society of Hematology, 2021 L St, NW, Suite 900, Washington DC Blood (print ISSN 0006-4971, online ISSN 1528-0020), is published weekly by
only.For personal use at PENN STATE UNIVERSITY on February 23, 2013. bloodjournal.hematologylibrary.orgFrom

1
Synergy between Imatinib and Mycophenolic Acid in Inducing Apoptosis in Cell Lines Expressing Bcr-Abl
(Running head) Enhanced Imatinib cytotoxicity with GTP depletion.
Jing Jin Gu, Lalaine Santiago and Beverly S. Mitchell
Lineberger Comprehensive Cancer Center, Departments of Pharmacology and Medicine,
University of North Carolina at Chapel Hill, Chapel Hill, NC.
This study was supported by National Institutes of Health Grant CA 64193 to BSM
Corresponding author: Beverly S. Mitchell, MD, Departments of Pharmacology and
Medicine, Lineberger Comprehensive Cancer Center, University of North Carolina,
Chapel Hill, NC27599-7295. Telephone: 919-966-4340. Fax: 919-966-8212. Email:
Total text word count: 4772 Abstract word count: 196 Scientific categories: Neoplasia
Blood First Edition Paper, prepublished online December 16, 2004; DOI 10.1182/blood-2004-10-3864
Copyright © 2004 American Society of Hematology
only.For personal use at PENN STATE UNIVERSITY on February 23, 2013. bloodjournal.hematologylibrary.orgFrom
2
Abstract
Bcr-Abl tyrosine kinase activity initiates a number of intracellular signaling cascades that
result in leukemogenesis. Imatinib mesylate, a specific Bcr-Abl tyrosine kinase inhibitor,
has been highly successful in the treatment of chronic myelogenous leukemia. However,
the emergence of Imatinib resistance and the incomplete molecular response of a
significant number of patients receiving this therapy have led to a search for
combinations of drugs that will enhance the efficacy of Imatinib. We have demonstrated
that Mycophenolic Acid (MPA), a specific inosine monophosphate dehydrogenase
(IMPDH) inhibitor that results in depletion of intracellular guanine nucleotides, is
synergistic with Imatinib in inducing apoptosis in Bcr-Abl expressing cell lines. Studies
of signaling pathways downstream of Bcr-Abl demonstrated that the addition of MPA to
Imatinib reduced the phosphorylation of both Stat5 and Lyn, a Src kinase family member.
The phosphorylation of S6 ribosomal protein was also greatly reduced. These results
demonstrate that inhibitors of guanine nucleotide biosynthesis may synergize with
Imatinib in reducing the levels of minimal residual disease in CML and lay the
foundation for clinical trials in which IMPDH inhibitors are added to Imatinib in patients
who have suboptimal molecular responses to single agent therapy or who have
progressive disease.
only.For personal use at PENN STATE UNIVERSITY on February 23, 2013. bloodjournal.hematologylibrary.orgFrom
3
Introduction Bcr-Abl, a chimeric oncogene, is formed by a reciprocal translocation between
chromosomes 9 and 22 (Philadelphia chromosome, Ph1), that places the c-ABL gene
under the transcriptional control of the BCR gene 1,2, resulting in the constitutive
activation of c-Abl tyrosine kinase 3,4. Depending on the breakpoint site in the Bcr gene,
two variants of the Bcr-Abl fusion proteins are generated 5. The p210 Bcr-Abl is present
in virtually all cases of chronic myelogenous leukemia (CML), while the p185 product is
present in approximately 20% of acute lymphoblastic leukemias 6. The Bcr-Abl tyrosine
kinase activates a number of downstream cell signaling pathways resulting in growth
factor-independent cell proliferation, altered cell adhesion and resistance to apoptosis
induced by other chemotherapeutic agents 7. The recently developed inhibitor of Bcr-Abl
kinase activity, Imatinib mesylate, induces a high percentage of complete hematologic
responses and partial or complete cytogenetic remissions in chronic phase CML 8,9.
Imatinib has high affinity for Bcr-Abl tyrosine kinase 10 and inhibits its activity by
binding to its ATP-binding pocket 11. Despite a high degree of selectivity, approximately
60% of CML patients retain the Ph1 chromosome after 18 months on Imatinib treatment 12 and more than 90% remain positive for Bcr-Abl transcripts, as measured by the
quantitative real-time polymerase chain reaction assay 13. Residual Bcr-Abl positivity is
clearly linked to risk for disease progression and the development of blast crisis.
Resistance to Imatinib eventually develops in the majority of patients treated in the blast
crisis stage of the disease, primarily due to the emergence of point mutations in or
amplification of the Bcr-Abl gene 14. The emergence of Imatinib resistance creates a
strong incentive to find non-toxic approaches to enhance its efficacy, including
combining Imatinib with a drug that enhances its cytotoxicity.
Inosine monophosphate dehydrogenase (IMPDH; EC1.1.1.205) is an essential,
rate-limiting enzyme for the generation of guanine nucleotides through the de novo
synthesis pathway. It catalyzes the NAD-dependent conversion of inosine
monophosphate to xanthine monophosphate, which is subsequently converted to
guanosine monophosphate (GMP) by GMP synthase. The only alternative pathway for
guanine nucleotide biosynthesis is through the salvage of guanine to GMP by
hypoxanthine-guanine phosphoribosyltransferase. IMPDH enzyme activity is composed
only.For personal use at PENN STATE UNIVERSITY on February 23, 2013. bloodjournal.hematologylibrary.orgFrom

4
of the activities of two separate but very closely related IMPDH isoenzymes, termed type
I and type II, that share 84% amino acid identity 15. Expression of IMPDH, particularly
the type II enzyme, is significantly upregulated in many tumor cells, including leukemia
cells 16-19, presumably to meet a high demand for guanine nucleotides during cell
proliferation. Reduction of guanine nucleotides by inhibiting IMPDH activity effectively
induces cell cycle arrest in late G1 phase in lymphocytes 20,21 and results in differentiation 22-24 or apoptosis 25-27 in cultured cell lines depending on the cell type. The fact that these
effects on cell growth and differentiation are completely reversed by the addition of
guanine or guanosine to the medium demonstrates that the effects of IMPDH inhibitors
are specifically due to guanine nucleotide depletion. Inhibitors of IMPDH have been
used clinically as immunosuppressive agents 28-30 and have also been used to induce
hematologic responses in patients with CML in blast crisis 31,32 and in Bcr-Abl positive
AML patients33. However, the reduction in blast count is temporary and other studies
have suggested that IMPDH inhibitors may be better used in combination with other
chemotherapeutic drugs 34,35.
In the present study, we have demonstrated that a specific IMPDH inhibitor,
Mycophenolic Acid (MPA), can significantly enhance Imatinib cytotoxicity in Bcr-Abl
positive cells. We have also investigated the possible Bcr-Abl signaling pathways
affected by combining a specific inhibitor of Bcr-Abl tyrosine kinase with guanine
nucleotide depletion.
only.For personal use at PENN STATE UNIVERSITY on February 23, 2013. bloodjournal.hematologylibrary.orgFrom

5
Materials and Methods
Recombinant retroviral infection The pSRMSVtkneo plasmid, containing the p185 form of Bcr-Abl was kindly provided
by Dr. C. Der (Lineberger Comprehensive Cancer Center, University of North Carolina
at Chapel Hill). Retrovirus was produced in 293T cells using pVpack system
(Stratagene, La Jolla, CA). Both 32D and FL5.12 cells were infected with control
retrovirus alone or retrovirus encoding the p185 Bcr-Abl fusion gene. Cells were
selected and maintained in the presence of 500 µg/ml G418. The p185 Bcr-Abl-
expressing cells were also selected for growth independent of IL-3.
Cell lines and reagents
The murine myeloid cell line 32D was maintained in RPMI-1640 medium supplemented
with 10% heat-inactivated fetal bovine serum (FBS, Hyclone, Logan, UT) and 10%
WEHI conditioned medium as a source of IL-3. The murine pre-B cell line FL5.12 (a
gift from C. B. Thompson, University of Pennsylvania, Philadelphia) was maintained in
RPMI-1640 medium supplemented with 10% heat-inactivated FBS, 20 mM HEPES (N-
2-hydroxyethylpiperazine-N’-2-ethanesulfonic acid), 55 µM 2-mercaptoethonal, and 10%
WEHI conditioned medium. Human leukemia cell lines K562, HL60 and U937
(originally obtained from ATCC, Rockville, MD) were maintained in RPMI-1640
medium supplemented with 10% heat-inactivated FBS. An Imatinib-resistant K562
derivative cell line K562R and LAMA84 cells were generously provided by Dr. S. Grant
(Commonwealth University, Richmond, Virginia). LAMA84 cells were maintained in
RPMI-1640 medium (without phenol-red) supplemented with 0.1 mM MEM non-
essential amino acid (Gibco, Caraday, CA), 2 mM L-glutamine (Gibco) and 1 mM MEM
sodium pyruvate (Gibco). All cell cultures were maintained in the presence of 100 µg/ml
penicillin and streptomycin.
Mycophenolic acid purchased from Sigma (St Louis, MO) was dissolved in
ethanol to a final concentration of 10 mM. Imatinib obtained from Novartis Pharm
(Basel, Switzerland) was dissolved in DMSO to a final concentration of 10 mM. Both
only.For personal use at PENN STATE UNIVERSITY on February 23, 2013. bloodjournal.hematologylibrary.orgFrom

6
drugs were stored in aliquots in –20oC. In all experiments, control samples received the
equivalent amount of solvent used for drugs. Antibodies against total and phospho-Stat5
(Tyr 694), phospho-Src (Tyr 416), total and phospho-S6 (Ser 235/236) were all
purchased from Cell Signaling Technology (Beverly, MA). The anti-Lyn antibody and
protein A-beads were obtained from Santa Cruz Biotechnology (Santa Cruz, CA). Anti-
phosphotyrosine (4G10) antibody was obtained from Upstate USA, Inc (Charlottesville,
VA). MTT (3-[4,5-Dimethylthiazol-2-yl]-2,5-diphenyl-tetrazolium bromide) was
purchased from Sigma and dissolved in PBS to a final concentration of 5 mg/ml, stored
aliquots in -20 oC.
MTT assay
Cells were seeded at approximately 1 x 10⁴ in a final volume of 100 µl in 96-well flat-
bottom microtiter plates (Corning Costar, Corning, NY) with or without various
concentrations of drugs. To exclude effects of drugs on the OD reading, the highest
concentration of drug was added to the medium without cells to serve as the background
control. Plates were incubated at 37oC in a 5% CO2 incubator for the indicated times. At
the end of incubation, 15 µl of MTT were added to each well, and plates were incubated
at 37oC for another 4 hrs, followed by the addition of 100 µl 10% sodium dodecyl sulfate
(SDS) solution in 0.01M hydrochloric acid. Plates were incubated overnight in 37oC and
absorbance was measured at 595 nm against a reference wavelength at 650 nm using a
MAXline Microplate Reader (Molecular Devices, Sunnyvale, CA). The mean of
quadruplicate for each dose was used to calculate the IC50 and for all the Combination
Index values.
Combination Index (CI) calculation
CI values were calculated using Biosoft CalcuSyn program (Ferguson, MO). The dose-
effect relationships analyzed using the median-effect equation was first obtained for each
single drug by its serial dilution. A CI value for each combination treatment was then
calculated based on the formula D1/Dx1 + D2/Dx2, where Dx1 and Dx2 are the doses of
drug1 and drug 2 alone required to produce x% effect, and D1 and D2 are the doses of
only.For personal use at PENN STATE UNIVERSITY on February 23, 2013. bloodjournal.hematologylibrary.orgFrom
7
drug 1 and drug 2 in combination required to produce the same effect 36,37. CI was used
to express synergism (CI<1), additive effect (CI=1) or antagonism (CI >1).
Annexin V staining and cell cycle analysis
Apoptosis was measured using the Annexin V-FITC Apoptosis Detection Kit I (BD
Pharmingen, San Diego, CA), following the staining procedure provided by the
manufacturer. Briefly, 2 to 3 x 10⁵ cells after single or combination drug treatment were
washed twice with cold PBS and resuspended in 100 µl of 1x binding buffer for Annexin
V and propidium iodide (PI) staining. For cell cycle analysis, approximately 5 x 10⁵ cells
were harvested after drug treatment, washed once in cold PBS and fixed in 80% EtOH
and stored at 4oC overnight. For PI staining, cells were centrifuged at 1,300 x g for 5
min, washed once with PBS containing 0.2% BSA (BSA/PBS), and pellets were
resuspended in 500 µl BSA/PBS containing 100 µg RNaseA and 50 µg PI and incubated
at 37oC for 30 min. Both Annexin V stained and cell cycle PI stained cells were analyzed
by flow cytometry. Approximately 30,000 cells were collected using FACScan Flow
(Becton Dickinson Immunocytometry, Mountain View, CA).
DNA fragmentation ELISA assay
Mononucleosomes and oligonucleosomes in the cytoplasm of the apoptotic cells were
measured using a Cell Death Detection ELISA kit (Roche Diagnostic GmbH,
Indianapolis, IN) according to the manufacturer’s protocol. Lysate from approximately 1
x 103 cells was used for each well. Absorbance was measured at 405 nm against a
reference of 490 nm using a MAXline Microplate Reader (Molecular Devices). All the
experiments were performed in duplicate in ELISA assays.
Western immunobloting
To prepare cell lysates for Western immunoblot analysis, cell pellets were lysed in buffer
containing 20 mM Tris-HCl (pH 8.0), 137 mM NaCl, 10% Glycerol, 1% TritonX-100, 1
mM Na3VO4, 25 mM β-glycerophosphate, 1x protease inhibitor cocktail and 1x
phosphatase inhibitor cocktail 1 (Sigma). After centrifugation at 14,000 x g for 15 min,
protein concentrations were quantitated in duplicate by the Bradford method (Bio-Rad
only.For personal use at PENN STATE UNIVERSITY on February 23, 2013. bloodjournal.hematologylibrary.orgFrom

8
Laboratories, Hercules, CA). Equal amounts of protein were separated on a SDS-
polyacrylamide gel electrophoresis (PAGE), and transferred to either polyvinylidene
difluoride Immobilon-P membranes (Millipore Corp. Bedford, MA) or Protran
nitrocellulose membranes (Schleicher & Schuell, Keene, NH). The membranes were
blocked with 5% nonfat milk made in Tris-Buffer Saline containing 0.1% Tween 20
(TBST0.1) at room temperature for 1 hr, and then incubated with primary antibodies
diluted either in 5% BSA for phospho-protein detection or in blocking solution for other
antibodies at 4oC overnight. Dilutions of primary antibodies were made following the
manufacturer’s instructions. Following several washes in TBST0.1, membranes were
incubated with appropriate secondary antibodies (1:2000 to 1:5000 dilution, Amersham,
Co. Arlington Heights, IL) at room temperature for 1 hr. Detection was performed using
the ECL chemiluminescence system (Amersham).
Immunoprecipitation
Immunoprecipitation (IP) of Lyn was performed following the protocol described by
Danhauser-Riedl et al38. Briefly, 1 mg of total lysate was incubated with 5 µg of anti-
Lyn antibody. After rotating 3 hrs at 4oC, 100 µl of protein A-Beads (50% beads volume)
was added for an additional 2 hrs. Precipitated proteins were separated on 10% SDS-
PAGE and blotted with anti-phosphotyrosine antibody (4G10).
only.For personal use at PENN STATE UNIVERSITY on February 23, 2013. bloodjournal.hematologylibrary.orgFrom
9
Results Effects of Imatinib and MPA on growth of Bcr-Abl transformed cell lines
Murine 32D myeloid and FL5.12 pre-B cells were infected with retrovirus carrying the
p185 Bcr-Abl fusion protein or an empty vector (as described in the Methods). Both cell
lines appropriately expressed the Bcr-Abl protein, as demonstrated by Western blots (data
not shown). Inhibition of cell growth by MPA or Imatinib was then analyzed using MTT
assays 37. As indicated in Table 1, the IC50 values for MPA are similar across cell lines
regardless of Bcr-Abl expression. Consistent with previous results39, 32D and FL5.12
cell lines expressing Bcr-Abl are highly sensitive to Imatinib with IC50 values of
approximately 0.6 µM, whereas vector control cells are completely resistant to Imatinib-
induced growth inhibition up to the highest concentration (8 µM) tested. Growth
inhibition data for these two drugs were also obtained for two human leukemia cell lines
expressing p210 Bcr-Abl, K562 and LAMA84, and two Bcr-Abl negative leukemic cell
lines, HL-60 and U937. The growth of all four-cell lines is inhibited by MPA at similar
concentrations, albeit at longer incubation times than for the murine cells. In contrast, the
two Bcr-Abl-negative cell lines are completely resistant to Imatinib concentrations up to
8 µM, whereas the K562 and LAMA84 cells are very sensitive to Imatinib with IC50
values of 0.5 and 0.1 µM respectively.
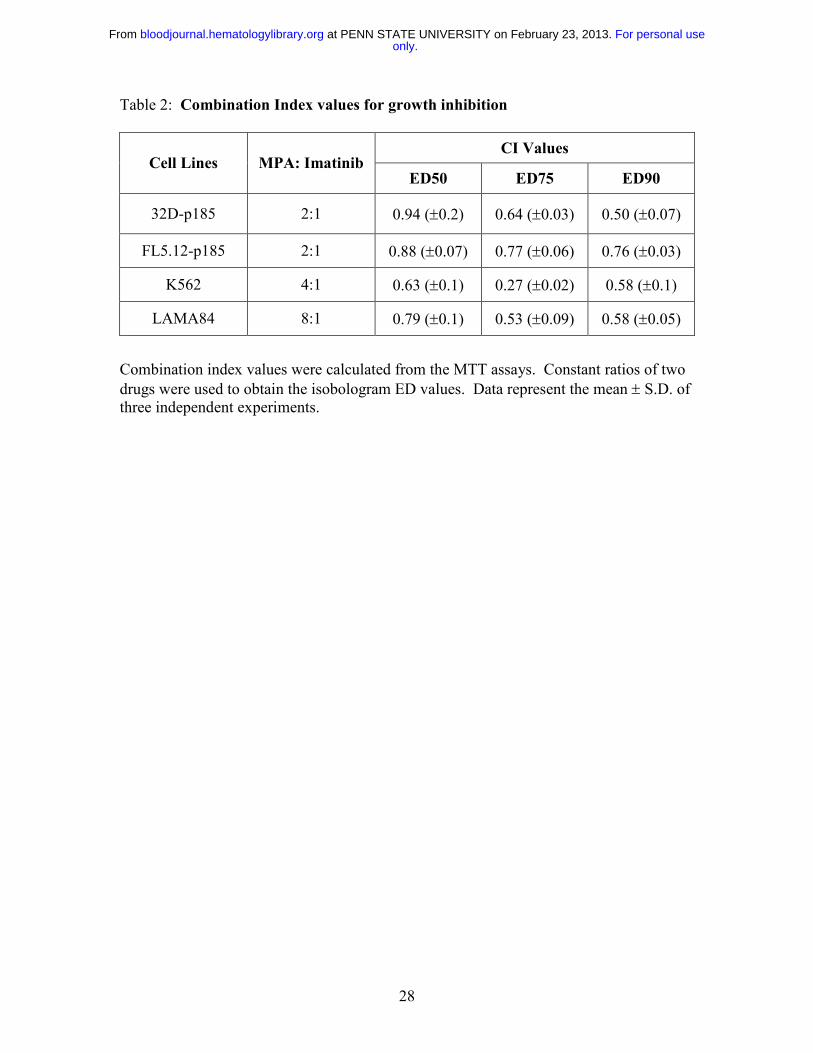
To study the possible synergy between Imatinib and MPA, approximately
equipotent concentrations of each drug were used. Combination index (CI) values were
calculated using CalcuSyn software (see Methods), where CI=1 indicates an additive
affect, CI<1 indicates synergy and CI>1 indicates antagonism calculated using a formula
initially proposed by Chou and Talalay 36. The two drugs were used in constant ratios in
most MTT assays to generate classical isobolograms. In some instances, non-constant
ratios were also tested to determine the effectiveness of a broader range of combinations
(data not shown). The CI values at ED50, ED75 and ED90 generated from classical
isobolograms for all four Bcr-Abl positive cell lines are summarized in Table 2.
Combined treatment with MPA and Imatinib demonstrates an additive (at about the
ED50) to synergistic (above the ED50) effect on growth inhibition in Bcr-Abl
expressing-32D and -FL5.12 cell lines. Combination treatment is clearly synergistic at
and above the ED50 in both human Bcr-Abl positive cell lines. Since the cell lines not
only.For personal use at PENN STATE UNIVERSITY on February 23, 2013. bloodjournal.hematologylibrary.orgFrom

10
expressing Bcr-Abl are insensitive to Imatinib and data obtained for the combination are
similar to those obtained with MPA alone, the combination index calculation is not
applicable.
Effect of MPA and Imatinib combinations on the induction of apoptosis
To determine whether combined treatment with MPA and Imatinib also enhances
apoptosis, 32D-p185 and K562 cells were treated with various concentrations of MPA
and/or Imatinib followed by Annexin V staining and analyzed by flow cytometry. Each
drug alone at the doses used induced very little or no apoptosis; however, the
combination of the two greatly increased the percentage of Annexin V-positive cells in
both cell lines (Fig. 1). To determine the CI values for apoptosis, at least 4 doses of each
drug was used in every experiment to generate single drug curves. Highly synergistic
effects were observed for multiple combination treatments in both 32D-p185 and K562
cell lines (Table 3). Interestingly, the CI values for apoptosis demonstrate far more
synergy than do the cell growth inhibition experiments. This is most likely because each
drug alone can significantly inhibit growth but only induce very low levels of apoptosis at
the concentrations used. The reduction in live cells, as defined by both Annexin V and PI
negativity, for each combination treatment as compared to each drug alone was also
statistically significant (p<0.05) using a paired two-tailed Student t test analysis on three
independent experiments (data not shown).
Specificity of induction of apoptosis for Bcr-Abl-positive cells
To determine whether the induction of apoptosis by combined treatment with MPA and
Imatinib is specific for Bcr-Abl expressing cells, we treated vector control or Bcr-Abl-
expressing-32D and FL5.12 cells with MPA and/or Imatinib for 16 to 20 hrs and
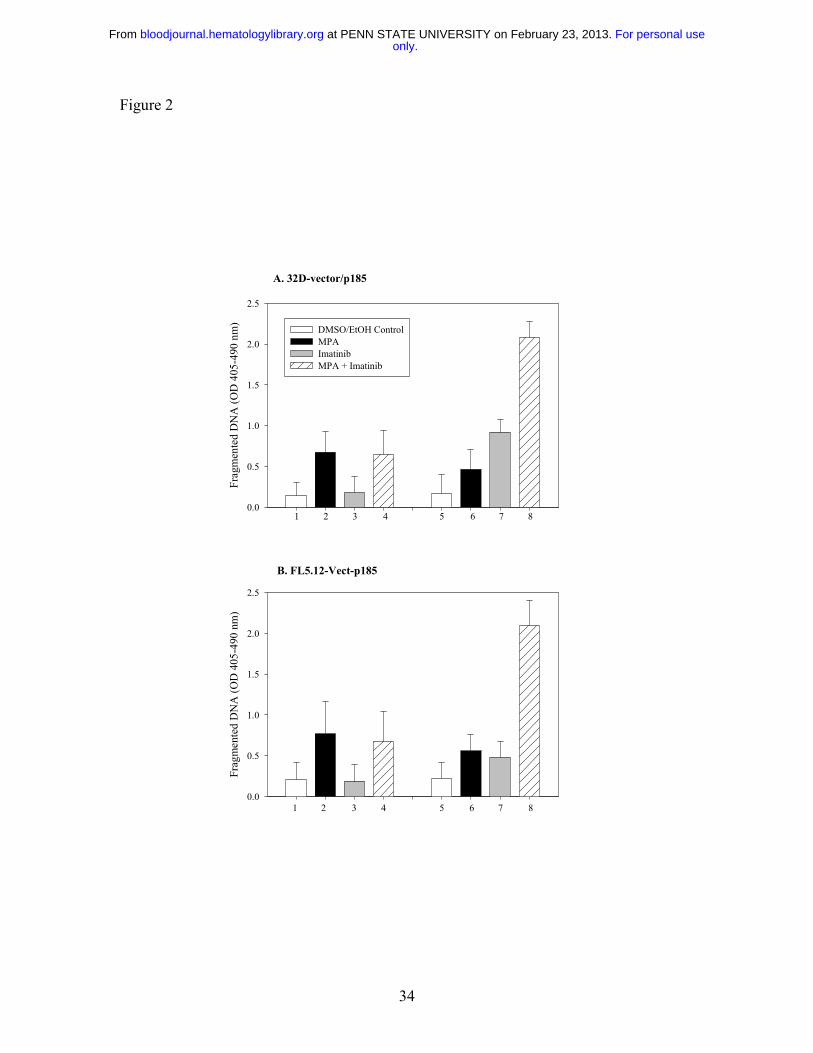
fragmented DNA was analyzed using the Cell Death Detection ELISA method 27. The
level of apoptosis induced by the combination treatment in vector-control cells was
similar to that of MPA alone, whereas the combination markedly enhanced apoptosis in
Bcr-Abl expressing-cells (Fig. 2). Apoptosis was also evaluated by the size of the sub-
G1 peak obtained from cell cycle analysis. Bcr-Abl positive FL5.12 and LAMA84 cells
and Bcr-Abl negative HL-60 and U937 cells were analyzed by flow cytometry after
only.For personal use at PENN STATE UNIVERSITY on February 23, 2013. bloodjournal.hematologylibrary.orgFrom
11
single and combination drug treatment (Fig. 3). In both FL5.12-p185 and LAMA cells,
MPA and Imatinib alone induced a small increase in the sub-G1 peak, whereas this peak
was markedly increased by the combination treatment. In HL-60 and U937 cells,
Imatinib (4uM) did not induce the apoptotic sub-G1 peak, nor did it enhance the MPA
effect.
Synergistic activity in K562 cells resistant to Imatinib
To determine whether MPA also enhance the response to Imatinib in cells that
demonstrate Imatinib resistance, we tested the effect of the combination on induction of
apoptosis using a K562 derivative cell line selected in the presence of Imatinib
(K562R40). As shown in Figure 4, K562R cells were significantly less sensitive to
Imatinib-induced apoptosis. K562 parental and K562R cells have similar sensitivity to
MPA treatment. The combination of MPA and Imatinib significantly enhanced the
induction of apoptosis in both K562 parental and K562R cells.
Effect of Imatinib and MPA on Stat5 phosphorylation
To study the possible mechanism(s) by which the combination of Imatinib and MPA
caused a synergistic effect on growth inhibition and apoptosis, we measured the
expression of several downstream effectors of Bcr-Abl signaling that have been
demonstrated to play important roles in Bcr-Abl transformation. The signal transducer
and activator of transcription (Stat) 5 was highly phosphorylated in 32D-p185, FL5.12-
p185 cells and in both K562 and LAMA84 human cell lines as compared to vector-
transfected 32D and FL5.12 parental cells and HL-60 and U937 cells (data not shown).
To determine whether MPA and/or Imatinib treatment decreases Stat5 phosphorylation,
we treated 32D-p185 and FL5.12-p185 cell lines with either drug alone or in combination
for 90 min. This time period is far shorter than the 4 to 8 hrs required for caspase 3
activation in these two cell lines (data not shown). Although Imatinib alone potently
inhibited Stat5 phosphorylation (p-Stat5), the combination of Imatinib and MPA further
reduced the level of p-Stat5 (Fig. 5A and B). Similar effects are also seen in K562 and
LAMA cells, although at much later time points (between 8 to 24 hrs; Fig. 5C and D).
The reduction of p-Stat5 levels by Imatinib alone at 24 h is less than the reduction at 3
only.For personal use at PENN STATE UNIVERSITY on February 23, 2013. bloodjournal.hematologylibrary.orgFrom

12
and 8 hrs, indicating the effect of Imatinib is relatively short. However, the combination
of Imatinib and MPA maintained lower levels of p-Stat5 at 24hrs. This prolongation of
effect may have biologic significance in view of the 48 to 72 hrs it takes for the
combination to induce apoptosis in human cell lines. We have also demonstrated (data
not shown) that Mcl-1 and Bcl-xL, both downstream targets of p-Stat5, are significantly
reduced at these time points, underscoring the biologic consequences of reducing p-Stat5
levels41,42.
Effect of combination treatment on phospho-Jak2 and phospho-Src expression
We next examined upstream molecules that could phosphorylate Stat5. We failed to
identify significant amounts of constitutively activated Janus kinase (Jak) 2 protein in our
Bcr-Abl expressing cell lines, and did not detect any significant effect on phospho-Jak2
levels by either single or combination drug treatment (data not shown), suggesting that
Jak2 is not responsible for the effect on Stat5 phosphorylation. This result is also
consistent with the previous finding that inhibition of Jak2 does not affect Stat5 activity
in Bcr-Abl positive cells43.
Increasing evidence has indicated that Stat proteins can also be activated through
members of the Src gene family 44. In particular, two family members, Lyn and Hck, can
phosphorylate Stat5 45,46, and have been implicated in Bcr-Abl-mediated transformation 38,47. We have found that levels Src phosphorylation in 32D and FL5.12 cells were very
high independent of the expression of p185 Bcr-Abl, most likely due to the continuous
IL-3 stimulation required for the growth of vector-control cells. However, Src is more
highly phosphorylated in the human Bcr-Abl positive cell lines, K562 and LAMA84
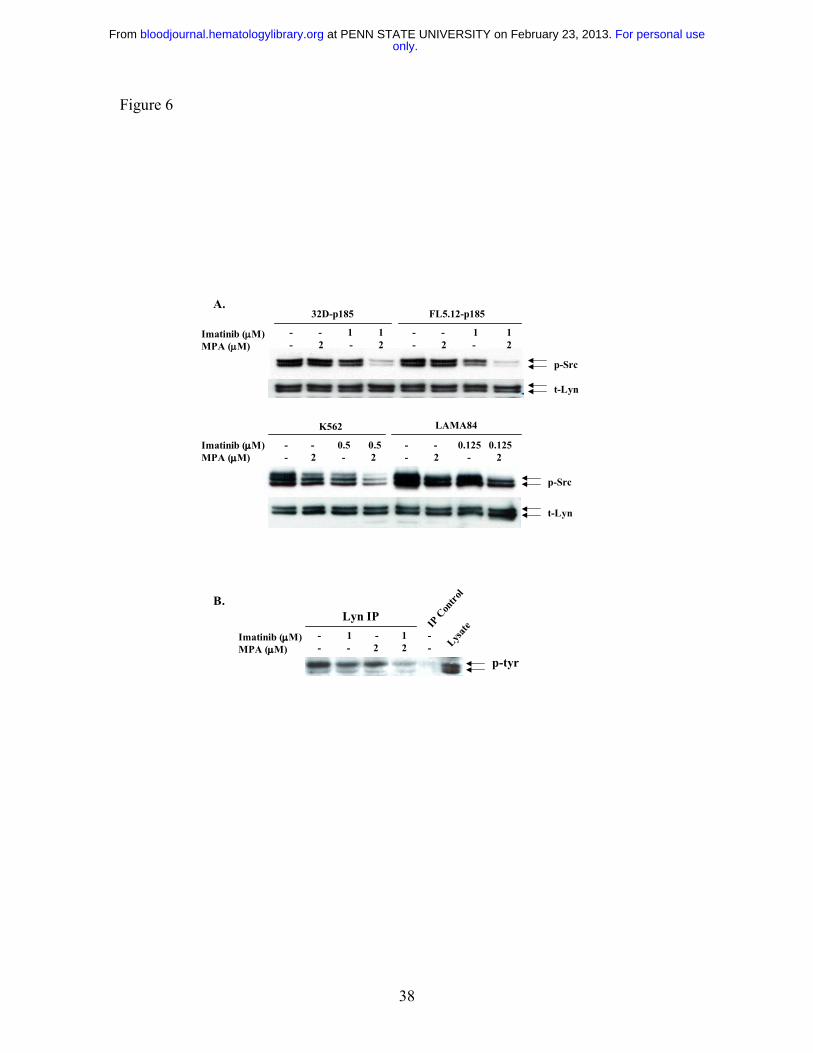
cells, than in HL-60 and U937 cells (data not shown). Although neither drug by itself
significantly decreased p-Src levels, the combination dramatically reduced Src
phosphorylation in 32D-p185 and FL5.12-p185 cells after 90 min (Fig. 6A). Similar,
although less dramatic, reductions were observed after 24 hrs of combined treatment of
K562 and LAMA cells (Fig. 6A). The antibody used to detect p-Src (Y416) detects
several activated Src family members, including Lyn (Y396, p53/p56) and Hck (Y390,
p59). When the blots were probed with total Lyn, Hck or Src antibodies, two bands
detected by the Lyn antibody, p53 and p56, corresponded precisely to the two bands
only.For personal use at PENN STATE UNIVERSITY on February 23, 2013. bloodjournal.hematologylibrary.orgFrom

13
detected by p-Src antibody. In contrast, Hck-specific antibody demonstrated a single
slightly higher band, the p59 protein, while Src-specific antibody also recognized a p60
protein. To confirm that the reduction in phosphorylation is that of Lyn, we performed
immunoprecipitation using anti-Lyn antibody followed by Western blot analysis with a
tyrosine phosphorylation-specific antibody (Fig. 6B). These results clearly demonstrated
that Lyn phosphorylation is reduced by the combination treatment.
Effect of combination treatment on mTOR pathway
It has been shown that the mammalian target of Rapamycin (mTOR) pathway is activated
in Bcr-Abl transformed cells 48, as indicated by hyper-phosphorylation of p70 S6 kinase
and S6 ribosomal proteins, as well as 4EBP1, resulting in enhanced protein translation
and cell growth. We have previously shown that the p70 S6 kinase phosphorylation is
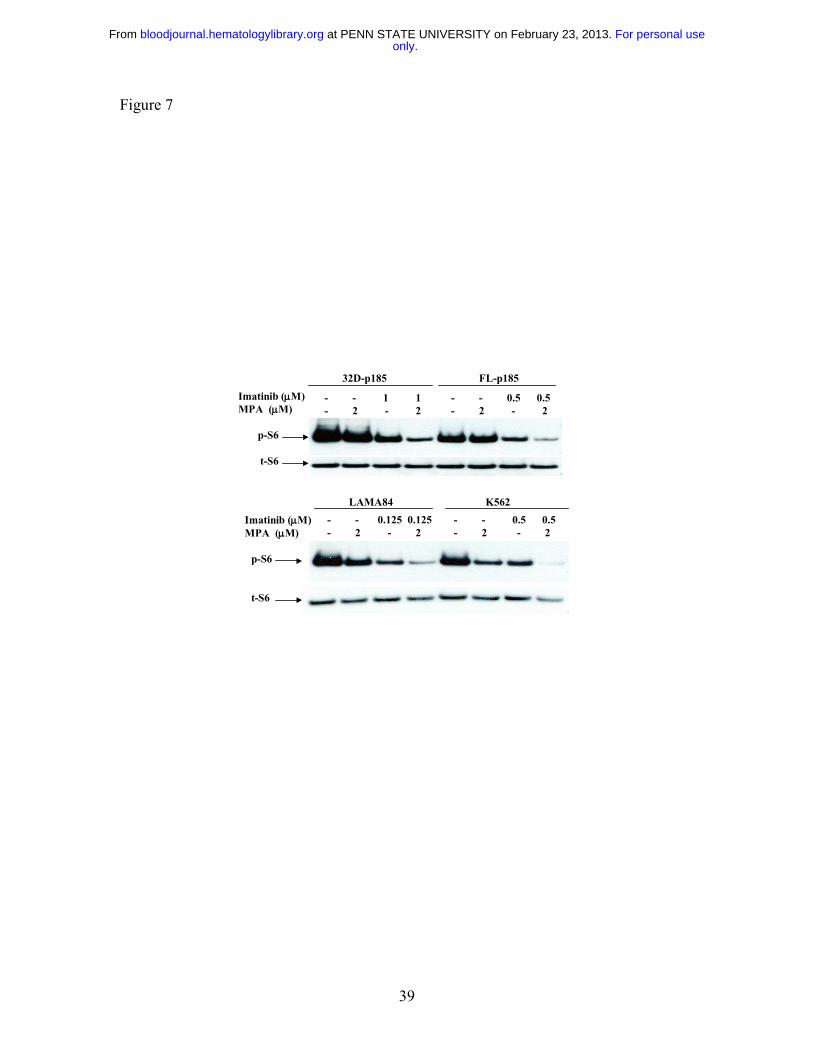
downregulated by MPA treatment in 32D cells 27. We therefore examined the S6
phosphorylation level following MPA and/or Imatinib treatment in both murine and
human Bcr-Abl expressing cell lines. The level of phosphorylated S6 (p-S6) was
slightly reduced by either MPA or Imatinib treatment alone, but was markedly reduced
with combination of MPA and Imatinib (Fig. 7).
only.For personal use at PENN STATE UNIVERSITY on February 23, 2013. bloodjournal.hematologylibrary.orgFrom
14
Discussion: Inhibition of the enzyme IMPDH and the consequent guanine nucleotide
depletion have previously been shown to reduce blast counts in patients with CML in
blast crisis31-33, but the effect was transient and the toxicity of the drug precluded further
investigation. Although inhibition of IMPDH has also been shown to result in the
differentiation of leukemic cell lines such as HL-60 and K-562 23,49 and to cause either
cell cycle arrest 20,21 or apoptosis 25-27 in other cell lines, the alterations in specific
signaling pathways that result in these effects have not been fully elucidated. In previous
work, we demonstrated that inhibition of the de novo synthesis of guanine nucleotides in
IL-3 dependent cell lines resulted in apoptosis, while simultaneously causing the early
down-regulation of both the MEK/Erk and the mTOR signaling pathways 27. These
results and the demonstration of synergy between MPA and Imatinib in Bcr-Abl
expressing cells led us to examine the effects of combined treatment on specific signaling
molecules that have been demonstrated to be important in Bcr-Abl mediated
transformation.
The Stat proteins are very important in Bcr-Abl-mediated oncogenesis 50,51.
These transcription factors are normally present in the cytoplasm of quiescent cells and
are phosphorylated in response to stimulation by cytokines or growth factors, resulting in
dimerization and nuclear translocation, and ultimately to the expression of specific target
genes 52. Stat5 is the major Stat protein activated by Bcr-Abl in cell lines and in
hematopoietic cells derived from patients with CML 43,53. Although an increase in Stat5
phosphorylation alone, using a dominant-active Stat5, is not sufficient to transform
primary murine bone marrow cells, expression of a dominant negative Stat5 reduces the
efficiency of Bcr-Abl-mediated transformation and impairs leukemogenesis 54. It has
also been shown that the anti-apoptotic effect of Bcr-Abl is dependent upon Stat5
signaling to activate the Bcl-2 family members, Bcl-xL and Mcl-1 55,56. We have
demonstrated that MPA treatment significantly enhanced Imatinib’s ability to decrease
Stat5 phosphorylation and also reduced Mcl-1 and Bcl-xL expression. This effect was
also enhanced at later time points in human cell lines, suggesting that the inhibitory effect
of Imatinib can be extended by treatment with MPA.
only.For personal use at PENN STATE UNIVERSITY on February 23, 2013. bloodjournal.hematologylibrary.orgFrom
15
The Src family of tyrosine kinases are known to phosphorylate Stat proteins 44.
The two Src family members, Lyn and Hck, are highly activated in Bcr-Abl expressing
cells 38 as a results of direct physical interaction with Bcr-Abl 57,58. Expression of a
kinase-defective mutant of Hck significantly down-regulated p-Stat5 46 and prevented
transformation by Bcr-Abl 47, while inhibition of Lyn kinase expression using antisense
oligonucleotides also significantly reduced leukemia cell growth 59,60. Our results have
demonstrated that the combination of MPA and Imatinib markedly reduces Lyn
phosphorylation. Since overexpression of activated Lyn has been documented in later
stages of CML and in Bcr-Abl expressing cells that have developed resistant to Imatinib 60, the additive effect of MPA on reducing p-Lyn may well be pivotal to its synergistic
effect.
Although the PI3 kinase pathway is believed to be important for Bcr-Abl
transformation and leukemia cell proliferation 61,62, we failed to observe any change in
phospho-Akt level at either Thr 308 and Ser 473 sites following either MPA or Imatinib
alone or in combination. However, we did observe a dramatic down-regulation of the
phosphorylated S6 ribosomal protein, a direct target of the mTOR/S6K1 pathway. It has
been demonstrated previously that a Bcr-Abl mutant that failed to activate PI3K/Akt can
still activate S6K1 62, indicating that the mTOR pathway may be activated independent of
the PI3K/Akt pathway. The importance of the mTOR pathway in CML has become
increasingly evident. This pathway acts as a sensor for the deprivation of essential
nutrients such as amino acids, sources of nitrogen or ATP 63,64 and regulates the
translation of a specific subset of mRNAs that contain polypyrimidine tracts at their 5’
ends 65. Both ribosomal protein S6, a substrate of S6K1, and 4EBP1 are constitutively
phosphorylated in CML cells 48. A very recent paper has documented synergy between
the mTOR inhibitor, Rapamycin, and Imatinib in Bcr-Abl expressing cell lines, as well as
synergy of Rapamycin with PKC412, an inhibitor of Flt-3 tyrosine kinase, in cell lines
overexpressing Flt-3 66. The addition of a MEK inhibitor further potentiated the
cytotoxicity. Clearly, pharmacological agents that inhibit multiple signaling pathways
including mTOR have the potential to be more effective than single agents in inducing
apoptosis in malignant cell lines.
only.For personal use at PENN STATE UNIVERSITY on February 23, 2013. bloodjournal.hematologylibrary.orgFrom

16
Down-regulation of several signaling pathways caused by GTP depletion may
enhance the effects of several other more specifically targeted chemotherapeutic agents.
Our hypothesis is that guanine nucleotide depletion has a central sensing mechanism with
multiple downstream effectors, ultimately resulting in growth arrest or apoptosis.
Although this molecular sensor has not been definitively identified, we are exploring
several small GTP binding proteins as candidates. One, the Rheb GTPase, was initially
isolated as a Ras homolog enriched in brain 67 and directly activates the mTOR pathway 68. Transient expression of a wild-type Rheb induces a dramatic increase in S6K
phosphorylation and mobility shift of 4EBP1, and this high level of activity is consistent
with its being predominantly GTP bound68. A dominant negative Rheb, defective in GTP
binding, was found to block nutrient and serum-induced p70 S6K activation 69. We are
currently testing the hypothesis that a reduction of intracellular GTP resulting from
inhibition of de novo guanine nucleotide synthesis might decrease the level of GTP-
bound Rheb, thus inhibiting the mTOR/S6K1 pathway.
Our data suggest that the IMPDH inhibitors may constitute a major addition to the
armamentarium of drugs that target oncogenic receptor tyrosine kinases and we are
implementing a clinical protocol to test the combination of Imatinib and MPA in patients
with persistent positivity for the Bcr-Abl transcript on Imatinib alone after 12 months.
Our results demonstrating enhanced toxicity of the combination over either agent alone in
cells that are partially resistant to Imatinib on the basis of Lyn overexpression 40
constitutes preliminary evidence that partial resistance to Imatinib may be overcome by
this approach. Although we have attempted to test this hypothesis in the leukemic cells
from two cases of CML in blast crisis, the high degree of baseline apoptosis resulting
from incubation of these cells ex vivo made interpretation of the results impossible.
Guanine nucleotides can be synthesized directly through the salvage of guanosine
in vivo, thereby compensating for IMPDH inhibition. However, it has been
demonstrated that Imatinib inhibits nucleoside uptake through selective inhibition of
nucleoside transporters 70 . We have confirmed that Imatinib treatment blocked the
nucleoside transporter in a dose-dependent manner in leukemic blast cells from a CML
patient (data not shown). Addition of guanosine to the culture medium did not reverse
the synergistic effects of MPA and Imatinib (data not shown). This observation enhances
only.For personal use at PENN STATE UNIVERSITY on February 23, 2013. bloodjournal.hematologylibrary.orgFrom

17
the probability that this combination will be effective in patients, since Imatinib will
inhibit purine salvage. The proposed clinical trial will be the optimal approach to
definitively test our hypothesis and will incorporate the specific molecular endpoint of a
greater than 1 log reduction in the Bcr-Abl transcript six months after the addition of
MPA.
only.For personal use at PENN STATE UNIVERSITY on February 23, 2013. bloodjournal.hematologylibrary.orgFrom

18
Acknowledgment We thank Lee Graves for reading and critiquing the manuscript.
only.For personal use at PENN STATE UNIVERSITY on February 23, 2013. bloodjournal.hematologylibrary.orgFrom

19
References 1. Rowley JD. Letter: A new consistent chromosomal abnormality in chronic
myelogenous leukaemia identified by quinacrine fluorescence and Giemsa staining.
Nature. 1973;243:290-293
2. Shtivelman E, Lifshitz B, Gale RP, Canaani E. Fused transcript of abl and bcr
genes in chronic myelogenous leukaemia. Nature. 1985;315:550-554
3. Konopka JB, Witte ON. Activation of the abl oncogene in murine and human
leukemias. Biochim Biophys Acta. 1985;823:1-17
4. Evans CA, Owen-Lynch PJ, Whetton AD, Dive C. Activation of the Abelson
tyrosine kinase activity is associated with suppression of apoptosis in hemopoietic cells.
Cancer Res. 1993;53:1735-1738
5. Faderl S, Talpaz M, Estrov Z, O'Brien S, Kurzrock R, Kantarjian HM. The
biology of chronic myeloid leukemia. N Engl J Med. 1999;341:164-172
6. Sawyers CL. Chronic myeloid leukemia. N Engl J Med. 1999;340:1330-1340
7. Deininger MW, Goldman JM, Melo JV. The molecular biology of chronic
myeloid leukemia. Blood. 2000;96:3343-3356
8. Chrobak L, Voglova J. Imatinib mesylate (STI 571)--a new oral target therapy
for chronic myelogenous leukemia (CML). Acta Medica (Hradec Kralove). 2003;46:85-
89
9. Branford S, Rudzki Z, Harper A, Grigg A, Taylor K, Durrant S, Arthur C,
Browett P, Schwarer AP, Ma D, Seymour JF, Bradstock K, Joske D, Lynch K, Gathmann
I, Hughes TP. Imatinib produces significantly superior molecular responses compared to
interferon alfa plus cytarabine in patients with newly diagnosed chronic myeloid
leukemia in chronic phase. Leukemia. 2003;17:2401-2409
10. Druker BJ, Tamura S, Buchdunger E, Ohno S, Segal GM, Fanning S,
Zimmermann J, Lydon NB. Effects of a selective inhibitor of the Abl tyrosine kinase on
the growth of Bcr-Abl positive cells. Nat Med. 1996;2:561-566
11. Schindler T, Bornmann W, Pellicena P, Miller WT, Clarkson B, Kuriyan J.
Structural mechanism for STI-571 inhibition of abelson tyrosine kinase. Science.
2000;289:1938-1942
only.For personal use at PENN STATE UNIVERSITY on February 23, 2013. bloodjournal.hematologylibrary.orgFrom

20
12. Kantarjian H, Sawyers C, Hochhaus A, Guilhot F, Schiffer C, Gambacorti-
Passerini C, Niederwieser D, Resta D, Capdeville R, Zoellner U, Talpaz M, Druker B,
Goldman J, O'Brien SG, Russell N, Fischer T, Ottmann O, Cony-Makhoul P, Facon T,
Stone R, Miller C, Tallman M, Brown R, Schuster M, Loughran T, Gratwohl A, Mandelli
F, Saglio G, Lazzarino M, Russo D, Baccarani M, Morra E. Hematologic and cytogenetic
responses to imatinib mesylate in chronic myelogenous leukemia. N Engl J Med.
2002;346:645-652
13. Paschka P, Muller MC, Merx K, Kreil S, Schoch C, Lahaye T, Weisser A,
Petzold A, Konig H, Berger U, Gschaidmeier H, Hehlmann R, Hochhaus A. Molecular
monitoring of response to imatinib (Glivec) in CML patients pretreated with interferon
alpha. Low levels of residual disease are associated with continuous remission.
Leukemia. 2003;17:1687-1694
14. Shah NP, Sawyers CL. Mechanisms of resistance to STI571 in Philadelphia
chromosome-associated leukemias. Oncogene. 2003;22:7389-7395
15. Natsumeda Y, Ohno S, Kawasaki H, Konno Y, Weber G, Suzuki K. Two
distinct cDNAs for human IMP dehydrogenase. J Biol Chem. 1990;265:5292-5295
16. Jackson RC, Weber G. IMP dehydrogenase, an enzyme linked with
proliferation and malignancy. Nature. 1975;256:331-333
17. Nagai M, Natsumeda Y, Konno Y, Hoffman R, Irino S, Weber G. Selective
up-regulation of type II inosine 5'-monophosphate dehydrogenase messenger RNA
expression in human leukemias. Cancer Research. 1991;51:3886-3890
18. Nagai M, Natsumeda Y, Weber G. Proliferation-linked regulation of type II
IMP dehydrogenase gene in human normal lymphocytes and HL-60 leukemic cells.
Cancer Research. 1992;52:258-261
19. Gharehbaghi K, Burgess GS, Collart FR, Litz-Jackson S, Huberman E,
Jayaram HN, Boswell HS. p210 bcr-abl confers overexpression of inosine
monophosphate dehydrogenase: an intrinsic pathway to drug resistance mediated by
oncogene. Leukemia. 1994;8:1257-1263
20. Turka LA, Dayton J, Sinclair G, Thompson CB, Mitchell BS. Guanine
ribonucleotide depletion inhibits T cell activation. Mechanism of action of the
immunosuppressive drug mizoribine. Journal of Clinical Investigation. 1991;87:940-948
only.For personal use at PENN STATE UNIVERSITY on February 23, 2013. bloodjournal.hematologylibrary.orgFrom
21
21. Laliberte J, Yee A, Xiong Y, Mitchell BS. Effects of guanine nucleotide
depletion on cell cycle progression in human T lymphocytes. Blood. 1998;91:2896-2904
22. Kiguchi K, Collart FR, Henning-Chubb C, Huberman E. Induction of cell
differentiation in melanoma cells by inhibitors of IMP dehydrogenase: altered patterns of
IMP dehydrogenase expression and activity. Cell Growth Differ. 1990;1:259-270
23. Inai K, Tsutani H, Yamauchi T, Nakamura T, Ueda T. Differentiation and
reduction of intracellular GTP levels in HL-60 and U937 cells upon treatment with IMP
dehydrogenase inhibitors. Advances in Experimental Medicine & Biology.
1998;431:549-553
24. Inai K, Tsutani H, Yamauchi T, Fukushima T, Iwasaki H, Imamura S, Wano
Y, Nemoto Y, Naiki H, Ueda T. Differentiation induction in non-lymphocytic leukemia
cells upon treatment with mycophenolate mofetil. Leuk Res. 2000;24:761-768
25. Vitale M, Zamai L, Falcieri E, Zauli G, Gobbi P, Santi S, Cinti C, Weber G.
IMP dehydrogenase inhibitor, tiazofurin, induces apoptosis in K562 human
erythroleukemia cells. Cytometry. 1997;30:61-66
26. Li G, Segu VB, Rabaglia ME, Luo RH, Kowluru A, Metz SA. Prolonged
depletion of guanosine triphosphate induces death of insulin-secreting cells by apoptosis.
Endocrinology. 1998;139:3752-3762
27. Gu JJ, Gathy K, Santiago L, Chen E, Huang M, Graves LM, Mitchell BS.
Induction of apoptosis in IL-3-dependent hematopoietic cell lines by guanine nucleotide
depletion. Blood. 2003;101:4958-4965
28. Mookerjee B. Salvage therapy for refractory chronic graft-versus-host disease
with mycophenolate mofetil and tacrolimus. [see comments.]. Bone Marrow
Transplantation. 1999;24:517-520
29. Nousari HC, Sragovich A, Kimyai-Asadi A, Orlinsky D, Anhalt GJ.
Mycophenolate mofetil in autoimmune and inflammatory skin disorders. Journal of the
American Academy of Dermatology. 1999;40:265-268
30. Yashima Y, Ohgane T. [Pharmacological profiles of mycophenolate mofetil
(CellCept), a new immunosuppressive agent]. Nippon Yakurigaku Zasshi - Folia
Pharmacologica Japonica. 2001;117:131-137
only.For personal use at PENN STATE UNIVERSITY on February 23, 2013. bloodjournal.hematologylibrary.orgFrom

22
31. Tricot G, Weber G. Biochemically targeted therapy of refractory leukemia
and myeloid blast crisis of chronic granulocytic leukemia with Tiazofurin, a selective
blocker of inosine 5'-phosphate dehydrogenase activity. Anticancer Res. 1996;16:3341-
3347
32. Wright DG, Boosalis MS, Waraska K, Oshry LJ, Weintraub LR, Vosburgh E.
Tiazofurin effects on IMP-dehydrogenase activity and expression in the leukemia cells of
patients with CML blast crisis. Anticancer Res. 1996;16:3349-3351
33. Malek K, Boosalis MS, Waraska K, Mitchell BS, Wright DG. Effects of the
IMP-dehydrogenase inhibitor, Tiazofurin, in bcr-abl positive acute myelogenous
leukemia; Part I. In vivo studies. Leuk Res. 2004;28:1125-1136
34. Taniki T, Prajda N, Monden Y, Weber G. Synergistic action of taxol and
tiazofurin in human ovarian, pancreatic and lung carcinoma cells. Cancer Biochem
Biophys. 1993;13:295-302
35. Yeh YA, Olah E, Wendel JJ, Sledge GW, Jr., Weber G. Synergistic action of
taxol with tiazofurin and methotrexate in human breast cancer cells: schedule-
dependence. Life Sci. 1994;54:PL431-435
36. Chou TC, Talalay P. Quantitative analysis of dose-effect relationships: the
combined effects of multiple drugs or enzyme inhibitors. Adv Enzyme Regul.
1984;22:27-55
37. Topaly J, Zeller WJ, Fruehauf S. Synergistic activity of the new ABL-
specific tyrosine kinase inhibitor STI571 and chemotherapeutic drugs on BCR-ABL-
positive chronic myelogenous leukemia cells. Leukemia. 2001;15:342-347
38. Danhauser-Riedl S, Warmuth M, Druker BJ, Emmerich B, Hallek M.
Activation of Src kinases p53/56lyn and p59hck by p210bcr/abl in myeloid cells. Cancer
Res. 1996;56:3589-3596
39. Fang G, Kim CN, Perkins CL, Ramadevi N, Winton E, Wittmann S, Bhalla
KN. CGP57148B (STI-571) induces differentiation and apoptosis and sensitizes Bcr-Abl-
positive human leukemia cells to apoptosis due to antileukemic drugs. Blood.
2000;96:2246-2253
only.For personal use at PENN STATE UNIVERSITY on February 23, 2013. bloodjournal.hematologylibrary.orgFrom

23
40. Dai Y, Rahmani M, Corey SJ, Dent P, Grant S. A Bcr/Abl-independent, Lyn-
dependent form of imatinib mesylate (STI-571) resistance is associated with altered
expression of Bcl-2. J Biol Chem. 2004;279:34227-34239
41. Huang M, Dorsey JF, Epling-Burnette PK, Nimmanapalli R, Landowski TH,
Mora LB, Niu G, Sinibaldi D, Bai F, Kraker A, Yu H, Moscinski L, Wei S, Djeu J,
Dalton WS, Bhalla K, Loughran TP, Wu J, Jove R. Inhibition of Bcr-Abl kinase activity
by PD180970 blocks constitutive activation of Stat5 and growth of CML cells.
Oncogene. 2002;21:8804-8816
42. Yu C, Krystal G, Varticovksi L, McKinstry R, Rahmani M, Dent P, Grant S.
Pharmacologic mitogen-activated protein/extracellular signal-regulated kinase
kinase/mitogen-activated protein kinase inhibitors interact synergistically with STI571 to
induce apoptosis in Bcr/Abl-expressing human leukemia cells. Cancer Res. 2002;62:188-
199
43. Ilaria RL, Jr., Van Etten RA. P210 and P190(BCR/ABL) induce the tyrosine
phosphorylation and DNA binding activity of multiple specific STAT family members. J
Biol Chem. 1996;271:31704-31710
44. Reddy EP, Korapati A, Chaturvedi P, Rane S. IL-3 signaling and the role of
Src kinases, JAKs and STATs: a covert liaison unveiled. Oncogene. 2000;19:2532-2547
45. Chin H, Arai A, Wakao H, Kamiyama R, Miyasaka N, Miura O. Lyn
physically associates with the erythropoietin receptor and may play a role in activation of
the Stat5 pathway. Blood. 1998;91:3734-3745
46. Klejman A, Schreiner SJ, Nieborowska-Skorska M, Slupianek A, Wilson M,
Smithgall TE, Skorski T. The Src family kinase Hck couples BCR/ABL to STAT5
activation in myeloid leukemia cells. Embo J. 2002;21:5766-5774
47. Lionberger JM, Wilson MB, Smithgall TE. Transformation of myeloid
leukemia cells to cytokine independence by Bcr-Abl is suppressed by kinase-defective
Hck. J Biol Chem. 2000;275:18581-18585
48. Ly C, Arechiga AF, Melo JV, Walsh CM, Ong ST. Bcr-Abl kinase modulates
the translation regulators ribosomal protein S6 and 4E-BP1 in chronic myelogenous
leukemia cells via the mammalian target of rapamycin. Cancer Res. 2003;63:5716-5722
only.For personal use at PENN STATE UNIVERSITY on February 23, 2013. bloodjournal.hematologylibrary.orgFrom

24
49. Tsutani H, Inai K, Imamura S, Ueda T, Nakamura T. Induction of cell
differentiation by IMPDH antisense oligomer in HL-60 and K562 human leukemia cell
lines. Adv Exp Med Biol. 1994;370:757-760
50. Sillaber C, Gesbert F, Frank DA, Sattler M, Griffin JD. STAT5 activation
contributes to growth and viability in Bcr/Abl-transformed cells. Blood. 2000;95:2118-
2125
51. Lin TS, Mahajan S, Frank DA. STAT signaling in the pathogenesis and
treatment of leukemias. Oncogene. 2000;19:2496-2504
52. Darnell JE, Jr. STATs and gene regulation. Science. 1997;277:1630-1635
53. Chai SK, Nichols GL, Rothman P. Constitutive activation of JAKs and
STATs in BCR-Abl-expressing cell lines and peripheral blood cells derived from
leukemic patients. J Immunol. 1997;159:4720-4728
54. Nieborowska-Skorska M, Wasik MA, Slupianek A, Salomoni P, Kitamura T,
Calabretta B, Skorski T. Signal transducer and activator of transcription (STAT)5
activation by BCR/ABL is dependent on intact Src homology (SH)3 and SH2 domains of
BCR/ABL and is required for leukemogenesis. J Exp Med. 1999;189:1229-1242
55. de Groot RP, Raaijmakers JA, Lammers JW, Koenderman L. STAT5-
Dependent CyclinD1 and Bcl-xL expression in Bcr-Abl-transformed cells. Mol Cell Biol
Res Commun. 2000;3:299-305
56. Buettner R, Mora LB, Jove R. Activated STAT signaling in human tumors
provides novel molecular targets for therapeutic intervention. Clin Cancer Res.
2002;8:945-954
57. Ptasznik A, Urbanowska E, Chinta S, Costa MA, Katz BA, Stanislaus MA,
Demir G, Linnekin D, Pan ZK, Gewirtz AM. Crosstalk between BCR/ABL oncoprotein
and CXCR4 signaling through a Src family kinase in human leukemia cells. J Exp Med.
2002;196:667-678
58. Stanglmaier M, Warmuth M, Kleinlein I, Reis S, Hallek M. The interaction of
the Bcr-Abl tyrosine kinase with the Src kinase Hck is mediated by multiple binding
domains. Leukemia. 2003;17:283-289
only.For personal use at PENN STATE UNIVERSITY on February 23, 2013. bloodjournal.hematologylibrary.orgFrom

25
59. Roginskaya V, Zuo S, Caudell E, Nambudiri G, Kraker AJ, Corey SJ.
Therapeutic targeting of Src-kinase Lyn in myeloid leukemic cell growth. Leukemia.
1999;13:855-861
60. Donato NJ, Wu JY, Stapley J, Gallick G, Lin H, Arlinghaus R, Talpaz M.
BCR-ABL independence and LYN kinase overexpression in chronic myelogenous
leukemia cells selected for resistance to STI571. Blood. 2003;101:690-698
61. Skorski T, Kanakaraj P, Nieborowska-Skorska M, Ratajczak MZ, Wen SC,
Zon G, Gewirtz AM, Perussia B, Calabretta B. Phosphatidylinositol-3 kinase activity is
regulated by BCR/ABL and is required for the growth of Philadelphia chromosome-
positive cells. Blood. 1995;86:726-736
62. Skorski T, Bellacosa A, Nieborowska-Skorska M, Majewski M, Martinez R,
Choi JK, Trotta R, Wlodarski P, Perrotti D, Chan TO, Wasik MA, Tsichlis PN,
Calabretta B. Transformation of hematopoietic cells by BCR/ABL requires activation of
a PI-3k/Akt-dependent pathway. Embo J. 1997;16:6151-6161
63. Rohde J, Heitman J, Cardenas ME. The TOR kinases link nutrient sensing to
cell growth. J Biol Chem. 2001;276:9583-9586
64. Dennis PB, Jaeschke A, Saitoh M, Fowler B, Kozma SC, Thomas G.
Mammalian TOR: a homeostatic ATP sensor. Science. 2001;294:1102-1105
65. Gingras AC, Raught B, Sonenberg N. Regulation of translation initiation by
FRAP/mTOR. Genes Dev. 2001;15:807-826
66. Mohi MG, Boulton C, Gu TL, Sternberg DW, Neuberg D, Griffin JD,
Gilliland DG, Neel BG. Combination of rapamycin and protein tyrosine kinase (PTK)
inhibitors for the treatment of leukemias caused by oncogenic PTKs. Proc Natl Acad Sci
U S A. 2004;101:3130-3135
67. Yamagata K, Sanders LK, Kaufmann WE, Yee W, Barnes CA, Nathans D,
Worley PF. rheb, a growth factor- and synaptic activity-regulated gene, encodes a novel
Ras-related protein. J Biol Chem. 1994;269:16333-16339
68. Inoki K, Li Y, Xu T, Guan KL. Rheb GTPase is a direct target of TSC2 GAP
activity and regulates mTOR signaling. Genes Dev. 2003;17:1829-1834
69. Tabancay AP, Jr., Gau CL, Machado IM, Uhlmann EJ, Gutmann DH, Guo L,
Tamanoi F. Identification of dominant negative mutants of Rheb GTPase and their use to
only.For personal use at PENN STATE UNIVERSITY on February 23, 2013. bloodjournal.hematologylibrary.orgFrom

26
implicate the involvement of human Rheb in the activation of p70S6K. J Biol Chem.
2003;278:39921-39930
70. Huang M, Wang Y, Cogut SB, Mitchell BS, Graves LM. Inhibition of
nucleoside transport by protein kinase inhibitors. J Pharmacol Exp Ther. 2003;304:753-
760
only.For personal use at PENN STATE UNIVERSITY on February 23, 2013. bloodjournal.hematologylibrary.orgFrom

27
Table 1: Effect of MPA or Imatinib on cell growth in Bcr-Abl positive and negative cell lines
Cell Lines Description IncubationTime (hrs)
IC50 MPA (µM)
IC50 Imatinib (µM)
32D-Vector Murine myeloid 24 0.46 (±0.16) >8
32D-p185 Murine myeloid (p185 Bcr-Abl) 24 0.56 (±0.14) 0.56 (±0.08)
FL5.12-Vector Murine pre-B 24 0.4 (±0.16) >8
FL5.12-p185 Murine pre-B (p185 Bcr-Abl) 24 0.8 (±0.14) 0.68 (±0.2)
K562 Human CML (p210 Bcr-Abl) 72 0.41 (±0.17) 0.53 (±0.07)
LAMA84 Human CML (p210 Bcr-Abl) 48 0.47 (±0.03) 0.089 (±0.01)
HL-60 Human
Promyelocytic Leukemia
48 1.0 (±0.2) >8
U937 Human Monocytic Leukemia 48 0.65 (±0.37) >8
IC50 values were obtained using the MTT assays. Values represent the mean ± S.D. for at least three experiments.
only.For personal use at PENN STATE UNIVERSITY on February 23, 2013. bloodjournal.hematologylibrary.orgFrom
28
Table 2: Combination Index values for growth inhibition
CI Values Cell Lines MPA: Imatinib
ED50 ED75 ED90
32D-p185 2:1 0.94 (±0.2) 0.64 (±0.03) 0.50 (±0.07)
FL5.12-p185 2:1 0.88 (±0.07) 0.77 (±0.06) 0.76 (±0.03)
K562 4:1 0.63 (±0.1) 0.27 (±0.02) 0.58 (±0.1)
LAMA84 8:1 0.79 (±0.1) 0.53 (±0.09) 0.58 (±0.05)
Combination index values were calculated from the MTT assays. Constant ratios of two drugs were used to obtain the isobologram ED values. Data represent the mean ± S.D. of three independent experiments.
only.For personal use at PENN STATE UNIVERSITY on February 23, 2013. bloodjournal.hematologylibrary.orgFrom

29
Table 3: Combination Index values for induction of apoptosis
Cell Lines Drugs (µM) CI Description
32D-p185 MPA (1) + Imatinib (0.5) 0.47 (± 0.13) Synergism
MPA (1) + Imatinib (1) 0.28 (±0.07) Strong Synergism
MPA (2) + Imatinib (0.5) 0.34 (± 0.04) Synergism
MPA (2) + Imatinib (1) 0.21(± 0.09) Strong Synergism
K562 MPA (1) + Imatinib (0.25) 0.04 (± 0.04) Very strong Synergism
MPA (2) + Imatinib (0.5) 0.04 (± 0.05) Very strong Synergism
MPA (4) + Imatinib (1) 0.06 (± 0.08) Very strong Synergism
CI values were obtained by Annexin V staining analyzed by flow cytometry. Data represent the mean ± S.D. of three independent experiments.
only.For personal use at PENN STATE UNIVERSITY on February 23, 2013. bloodjournal.hematologylibrary.orgFrom
30
Figure Legends
Figure 1: Effect of combined treatment with Imatinib and MPA on the induction of
apoptosis. 32D-p185 (A) and K562 (B) cells were treated with MPA and/or Imatinib at
the doses indicated for 24 and 72 hrs, respectively. Apoptosis was measured by Annexin
V and PI staining. The percentage of Annexin V-negative and -positive cells are
indicated on each histogram. The Annexin V positive peak shown in the histogram
includes both the AnnexinV-positive, PI-negative and the Annexin V-positive, PI-
positive populations. At least three experiments with multiple drug combinations were
performed on each cell line. One representative experiment at a selected combination of
doses is shown.
Figure 2: Effect of combination treatment on the induction of DNA fragmentation in
Bcr-Abl-expressing cells. Both 32D (A) and FL5.12 (B) vector control cells (Bars 1-4)
or p185-expressing cells (Bars 5-8) were either not treated (white bars) or treated with
MPA alone (Black bars; 1µM for 32D, 0.5 µM for FL5.12) or Imatinib alone (Gray bars;
1µM for 32D, 0.5 µM for FL5.12 cells) or the combination of MPA and Imatinib (striped
bars) for 16-20 hrs and apoptosis was measured by the Cell Death Detection ELISA
method. Data represent mean ± S.D. of three independent experiments. ELISA assays
were performed in duplicate.
Figure 3: Induction of apoptosis in Bcr-Abl positive and negative cell lines using cell
cycle analysis. FL5.12-p185, LAMA84, HL-60 and U937 cells were treated with the
indicated concentrations of MPA and/or Imatinib for 24 hrs (FL5.12-p185) and 48 hrs (all
other cell lines). The percent of sub-G1 (apoptotic) cells are shown on each histogram.
At least three experiments with multiple drug combinations were performed on each cell
line. One representative experiment at one selected dose combination is shown.
Figure 4: Effect of combination treatment on Imatinib-resistant cells. K562 and
K562R cells were treated with Imatinib at the indicated doses for 72 hrs with or without
MPA. Apoptosis was measured by Annexin V and PI staining. Imatinib treatment alone
only.For personal use at PENN STATE UNIVERSITY on February 23, 2013. bloodjournal.hematologylibrary.orgFrom
31
is indicated by the closed symbols. The controls in the absence of drug have 10.2 % ±
2.2 and 10.9 % ± 2.7 Annexin V/PI positive cells for K562 and K562R, respectively.
Imatinib plus MPA (2 µM) is indicated by the open symbols. MPA alone induced 22.5
% ± 0.6 and 26.3 % ± 2.3 apoptosis for K562 and K562R, respectively. Data represent
the mean ± S.D. of three independent experiments.
Figure 5: Effect of combination treatment on Stat5 phosphorylation. 32D-p185 (A),
FL5.12-p185 (B), K562 (C) and LAMA84 (D) cells were treated with indicated
concentrations of MPA and/or Imatinib for 90 min (for 32D- and FL5.12-p185) or the
indicated times for K562 and LAMA84 cells. 30 µg of total cell lysate were loaded in
each lane and Western blot analysis was performed using an antibody specific for
phospho-Stat5 (p-Stat5). Duplicate gels were probed with antibody specific for total
Stat5 (t-Stat5). 32D-p185 and FL5.12-p185 results are the representative of 4 and 3
independent experiments, respectively. K562 and LAMA84 results are representative of
two independent experiments; treatment for 24 hrs has been repeated three times.
Figure 6: Effect of combination treatment on Src and Lyn phosphorylation. (A).
32D-p185, FL5.12-p185, K562 and LAMA84 cells were treated with the indicated
concentrations of MPA and/or Imatinib for 90 min (for 32D- and FL5.12-p185 cells) and
24 hrs (for K562 and LAMA84 cells). Total cell lysate (30 µg) was used in each lane.
Western blots were first probed with anti-phospho-Src antibody. Membranes were
washed and re-probed with an antibody to detect total levels of Lyn (t-Lyn). This result
is representative of three independent experiments. (B). 32D-p185 cells were treated
with single or the combination of drugs as indicated for 3 hrs. Lysate was
immunoprecipitated with anti-Lyn antibody and blotted with an antibody (4G10) specific
for tyrosine phosphorylated proteins (p-tyr). Lysate precipitated with protein A-beads in
the absence of Lyn antibody (IP control) and total lysate are shown in the last two lanes.
Figure 7: Effect of combination treatment on S6 phosphorylation. 32D-p185, FL5.12-
p185, LAMA84 and K562 cells were treated with the indicated concentrations of MPA
and/or Imatinib for 3 hrs (for 32D- and FL5.12-p185 cells) and 24 hrs (for LAMA84 and
only.For personal use at PENN STATE UNIVERSITY on February 23, 2013. bloodjournal.hematologylibrary.orgFrom

32
K562 cells). Western blots were probed with antibody specific for phospho-S6 ribosomal
protein (p-S6). Duplicate gels were probed with antibody specific for total S6 (t-S6).
This is representative of three independent experiments.
only.For personal use at PENN STATE UNIVERSITY on February 23, 2013. bloodjournal.hematologylibrary.orgFrom

33
Figure 1
Annexin V
Cel
lCou
nts
Control
Control
Imatinib 1 µM
Imatinib 0.5 µM
MPA 2 µM
MPA 2 µM
Combined
Combined
86 14 74 26 66 34 28 72
72 28 82 18 73 27 37 63
A.
B.
32D-p185
K562
only.For personal use at PENN STATE UNIVERSITY on February 23, 2013. bloodjournal.hematologylibrary.orgFrom
34
Figure 2
A. 32D-vector/p185
Frag
men
ted
DN
A(O
D40
5-49
0nm
)
0.0
0.5
1.0
1.5
2.0
2.5
1 2 3 4 5 6 7 8
DMSO/EtOH ControlMPAImatinibMPA + Imatinib
B. FL5.12-Vect-p185
Frag
men
ted
DN
A(O
D40
5-49
0nm
)
0.0
0.5
1.0
1.5
2.0
2.5
1 2 3 4 5 6 7 8
only.For personal use at PENN STATE UNIVERSITY on February 23, 2013. bloodjournal.hematologylibrary.orgFrom

35
Figure 3
DNA area
Cel
lCou
nts
FL5.12-p185
Control Imatinib MPA Combined0.5 µM 0.5 µM
0.125 µM 1 µM
4 µM 1 µM
1 µM4 µM
4 23 12 71
9 17 6 54
0.7 0.7 43 38
4 2 14 15
LAMA
HL-60
U937
only.For personal use at PENN STATE UNIVERSITY on February 23, 2013. bloodjournal.hematologylibrary.orgFrom

36
Figure 4
Imatinib (µM)
Perc
ento
fAnn
exin
V/P
IPos
itice
Cel
ls
0
20
40
60
80
100
K562 Imatinib aloneK562 Imatinib + MPAK562R Imatinib aloneK562R Imatinib + MPA
0 0.25 0.5 1 2
only.For personal use at PENN STATE UNIVERSITY on February 23, 2013. bloodjournal.hematologylibrary.orgFrom

37
Figure 5
Imatinib (µM)MPA (µM)
3h 8h 24h
Imatinib (µM)MPA (µM)
3h 8h 24h
C.
p-Stat5
p-Stat5
Imatinib (µM)MPA (µM)
A.
p-Stat5
Imatinib (µM)MPA (µM)
B.
p-Stat5
- 1 - - - 1 1 1- - 0.5 1 2 0.5 1 2
- 0.5 - - - 0.5 0.5 0.5- - 1 2 4 1 2 4
- - 0.5 0.5 - 0.5 0.5 - 0.5 0.5- 2 - 2 2 - 2 2 - 2
- - 0.125 0.125 - 0.125 0.125 - 0.125 0.125- 2 - 2 2 - 2 2 - 2
t-Stat5
t-Stat5
t-Stat5
t-Stat5
D.
only.For personal use at PENN STATE UNIVERSITY on February 23, 2013. bloodjournal.hematologylibrary.orgFrom
38
Figure 6
- - 1 1 - - 1 1- 2 - 2 - 2 - 2
Imatinib (µM)MPA (µM)
32D-p185 FL5.12-p185
p-Src
t-Lyn
- - 0.5 0.5 - - 0.125 0.125- 2 - 2 - 2 - 2
K562 LAMA84
p-Src
t-Lyn
Imatinib (µM)MPA (µM)
A.
B.
Imatinib (µM)MPA (µM) - - 2 2 -
- 1 - 1 -
Lyn IP
IPCon
trol
Lysate
p-tyr
only.For personal use at PENN STATE UNIVERSITY on February 23, 2013. bloodjournal.hematologylibrary.orgFrom
39
Figure 7
Imatinib (µM)MPA (µM)
Imatinib (µM)MPA (µM)
- - 1 1 - - 0.5 0.5- 2 - 2 - 2 - 2
- - 0.125 0.125 - - 0.5 0.5- 2 - 2 - 2 - 2
32D-p185 FL-p185
LAMA84 K562
p-S6
p-S6
t-S6
t-S6
only.For personal use at PENN STATE UNIVERSITY on February 23, 2013. bloodjournal.hematologylibrary.orgFrom
Recommended