CD Equisearch Pvt Ltd Nov 15, 2017
Equities Derivatives Commodities Distribution of Mutual Funds Distribution of Life Insurance
S
Aarti Industries Ltd
No. of shares (m) 82.12
Mkt cap (Rs crs/$m) 7319/1117.0
Current price (Rs/$) 891/13.6
Price target (Rs/$) 1034/15.8
52 W H/L (Rs.) 1040/653
Book Value (Rs/$) 175/2.7
Beta 0.7
Daily volume NSE (avg. monthly) 31630
P/BV (FY18e/19e) 4.6/3.9
EV/EBITDA (FY18e/19e) 12.5/10.9
P/E (FY18e/19e) 22.2/19.0
EPS growth (FY17/18e/19e) 24.7/4.6/17.0
OPM (FY17/18e/19e) 22.0/20.6/20.3
ROE (FY17/18e/19e) 25.3/22.4/22.1
ROCE(FY17/18e/19e) 15.4/13.8/13.9
D/E ratio (FY17/18e/19e) 1.1/1.1/1.0
BSE Code 524208
NSE Code AARTIIND
Bloomberg ARTO IN
Reuters ARTI.BO
Shareholding pattern %
Promoters 53.7
MFs / Banks / FIs 12.7
Foreign Portfolio Investors 4.0 .3 Govt. Holding 0.0
Public & Others 29.7
Total 100.0
As on Sep 30, 2017
Recommendation
ACCUMULATE
Analyst
KISHAN GUPTA, CFA, FRM
Phone: + 91 (33) 4488 0043
E- mail: [email protected]
Consolidated (Rs crs)
FY16
FY17 FY18e FY19e
Income from operations (gross) 3006.59 3163.46 3722.39 4333.40
Other Income 5.94 1.96 1.50 1.75
EBITDA (other income included) 578.20 655.46 710.74 812.44
Profit after MI 256.43 315.14 329.59 385.78
EPS(Rs) 30.78 38.38 40.13 46.98
EPS growth (%) 36.0 24.7 4.6 17.0
Company Brief
AIL is one of India's leading manufacturers of chemicals and pharmaceutical
intermediates: dyestuff; pigment; agro chemicals; speciality chemicals; active
pharmaceutical ingredient (API); intermediates of API
Quarterly Highlights
� Underpinned by higher capacity utilization, launch of some intermediates
and increased supplies from the caffeine plant, Aarti's pharmaceuticals
business in Q2 reported the highest revenue growth in at least six
quarters. Thanks to increased benefits of operating leverage, EBIT
margins soared to the highest level in at least ten quarters - 13.9% Vs
11.9% in Q2FY17 Vs 12..8% in Q1FY18. Despite miraculous jump in home
& personal care chemicals business in H1 (+51.3%). losses barely trimmed.
� After restart of acid plant post maintenance shutdown and draw down of
accumulated inventories, its speciality chemicals reported 10.3%
sequential growth in revenues (20.8% y-o-y). Increase in prices of finished
products explains most of the 13.2% growth in sales in H1 for the volumes
grew by an abysmal 3-4%, partly evidenced by 7.4% growth in NCB
production. Overall operating profits slid 2.3% in H1 and post tax
earnings declined by 10.7%.
� Given large long foreign currency exposure arising out of exports, rupee
appreciation continues to post no measly challenges. After spending Rs
245 crs as capex in H1, it is on course to meet its annual target of Rs 450-
500 crs ($68.7-76.3m). Most of its ongoing expansion projects including the
acid concentration plant in Vapi and API and pharmaceutical intermediate
de-bottlenecking and expansions at Vapi and Tarapur would get over by
FY19.
� The stock currently trades at 22.2x FY18e EPS of Rs 40.13 and 19x FY19e
EPS of Rs 46.98. Beneficial client engagement - larger revenue share from
older clients - and backward integration for intermediates does instill
wider economic moat and so does enriching global market share (25-40%
across products) in benzene products. Despite massive ongoing capex, its
return on capital has shown only faint signs of degradation in last few
years. Rebound in its speciality chemicals dispatches partly instigated by
resurrection in agrochemical industry and ramp up of nitro toluene
capacity next fiscal would help earnings surge by some 17%. On balance
we maintain "accumulate" rating on the stock with revised target of Rs
1034 (previous target: Rs 900) based on 22x FY19e earnings.

2
2
CD Equisearch Pvt Ltd
Equities Derivatives Commodities Distribution of Mutual Funds Distribution of Life Insurance
[
Outlook & Recommendation
Global specialty chemicals update
According to MarketsandMarkets, a global market research and consulting firm, the global specialty chemicals market is
expected to grow at a CAGR of 5.42% between 2015 and 2020 to reach $470bn. The report states that 'speciality coatings and
surfactants' has been the largest functions for the speciality chemicals market (27.2% market share in 2014) with increasing
demand for speciality chemicals such as construction chemicals, pesticides, oilfield chemicals, mining chemicals from Asia -
Pacific region and sturdy growth in end-user industries such as construction, automotive, and electronics. The firm expects
growth to surge partly driven by turnaround in these key markets and also higher need for speciality chemicals for these
functions. But the construction sector is expected to rule the roost for the construction chemicals are estimated to witness the
highest growth (8.63% CAGR) from 2015 to 2020, mainly on account of growing construction sector in major emerging
economies like India, China, Brazil and South Korea.
IHS Markit reckons that the center of gravity of the global chemical industry is shifting towards the Middle East - due to
availability of cheap petrochemical feedstocks - and Asia - high economic growth and cheap labour buttressing the shift - due
to tearing down of trade barriers, spread of process technology, rising standards of living in many developing countries and
fast growth in many industrialized Asian economies. As a result, North American, European and Japanese speciality chemical
manufacturers have either set up facilities in Asia or elsewhere or increased outsourcing from Chinese and Indian
manufacturers. Low per capita consumption of speciality chemicals in these fledgling regions - compared to that of the
advanced regions - presents irresistible market potential.
IHS Market posits that global volume consumption would grow by 3-3.5% annually during 2016 and 2021 with consumption in
North America, Western Europe and Japan combined to grow by about 2% annually, while emerging markets would grow at a
brisker pace. Despite economic setbacks, China would lead the pack with 6-7% annual growth during the forecast period.
Driven by Make In India initiative of the Government of India, Chemtech Foundation expects India to garner 6% of global
speciality chemicals markets by 2020 from 3% now. Indian Speciality Chemical Manufacturers' Association (ISCMA) expects
the Indian speciality chemicals industry in the range of $80-100bn by 2023, implying 6-7% annual growth for tightening
environmental norms (eg. REACH regulations) in developed countries and slowdown in China have opened up new vistas for
exports. Globally, India is emerging a strong market for agrochemicals, dyes and pigments and flavors and fragrances.
Source: IBEF
Though Research and Markets expects global speciality chemicals industry to grow by 6.3% CAGR from 2015 to 2022, volatile
material prices and environmental regulations regarding the usage of specialty chemicals have dragged market growth. It
reckons that growing concerns regarding environment due to production, usage and wastage of these chemicals is expected to
impact demand, most pertinently in food processing and manufacturing industry where governments continue to regulate
usage of these chemicals. Yet diminishing arable land, rising population and growing need for higher crop yields hold
potential for demand of pesticides.
3
3
CD Equisearch Pvt Ltd
Equities Derivatives Commodities Distribution of Mutual Funds Distribution of Life Insurance
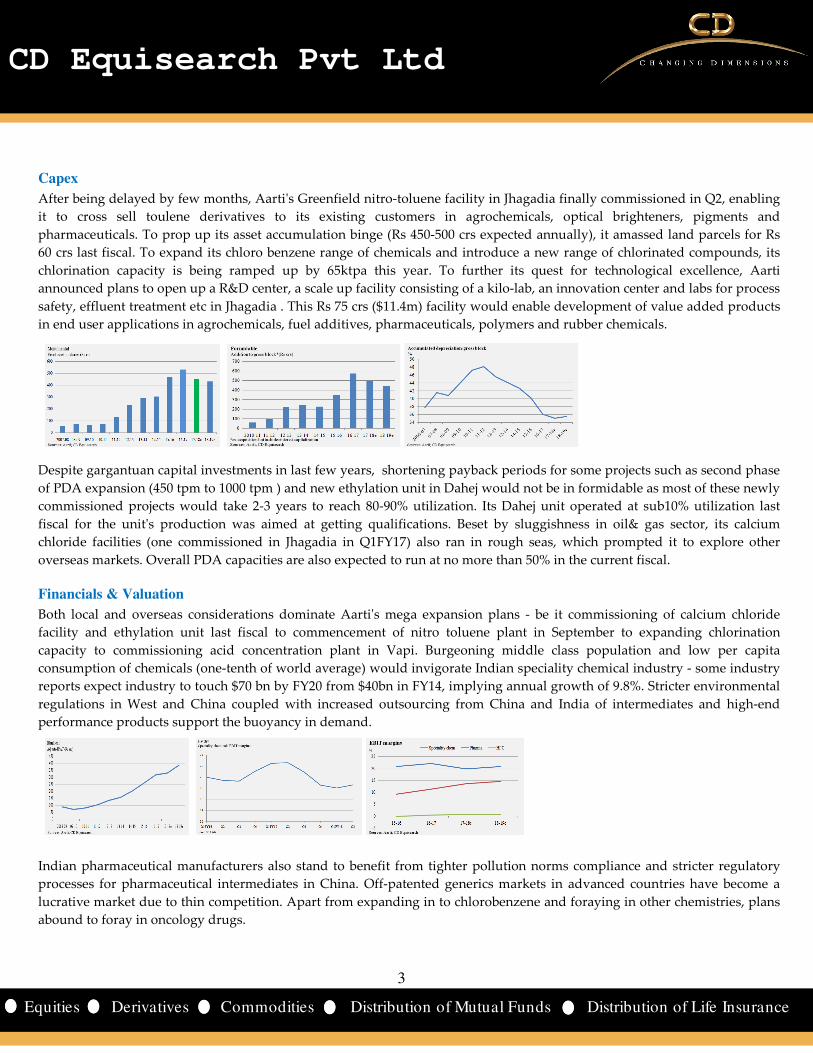
Capex
After being delayed by few months, Aarti's Greenfield nitro-toluene facility in Jhagadia finally commissioned in Q2, enabling
it to cross sell toulene derivatives to its existing customers in agrochemicals, optical brighteners, pigments and
pharmaceuticals. To prop up its asset accumulation binge (Rs 450-500 crs expected annually), it amassed land parcels for Rs
60 crs last fiscal. To expand its chloro benzene range of chemicals and introduce a new range of chlorinated compounds, its
chlorination capacity is being ramped up by 65ktpa this year. To further its quest for technological excellence, Aarti
announced plans to open up a R&D center, a scale up facility consisting of a kilo-lab, an innovation center and labs for process
safety, effluent treatment etc in Jhagadia . This Rs 75 crs ($11.4m) facility would enable development of value added products
in end user applications in agrochemicals, fuel additives, pharmaceuticals, polymers and rubber chemicals.
Despite gargantuan capital investments in last few years, shortening payback periods for some projects such as second phase
of PDA expansion (450 tpm to 1000 tpm ) and new ethylation unit in Dahej would not be in formidable as most of these newly
commissioned projects would take 2-3 years to reach 80-90% utilization. Its Dahej unit operated at sub10% utilization last
fiscal for the unit's production was aimed at getting qualifications. Beset by sluggishness in oil& gas sector, its calcium
chloride facilities (one commissioned in Jhagadia in Q1FY17) also ran in rough seas, which prompted it to explore other
overseas markets. Overall PDA capacities are also expected to run at no more than 50% in the current fiscal.
Financials & Valuation
Both local and overseas considerations dominate Aarti's mega expansion plans - be it commissioning of calcium chloride
facility and ethylation unit last fiscal to commencement of nitro toluene plant in September to expanding chlorination
capacity to commissioning acid concentration plant in Vapi. Burgeoning middle class population and low per capita
consumption of chemicals (one-tenth of world average) would invigorate Indian speciality chemical industry - some industry
reports expect industry to touch $70 bn by FY20 from $40bn in FY14, implying annual growth of 9.8%. Stricter environmental
regulations in West and China coupled with increased outsourcing from China and India of intermediates and high-end
performance products support the buoyancy in demand.
Indian pharmaceutical manufacturers also stand to benefit from tighter pollution norms compliance and stricter regulatory
processes for pharmaceutical intermediates in China. Off-patented generics markets in advanced countries have become a
lucrative market due to thin competition. Apart from expanding in to chlorobenzene and foraying in other chemistries, plans
abound to foray in oncology drugs.

4
4
CD Equisearch Pvt Ltd
Equities Derivatives Commodities Distribution of Mutual Funds Distribution of Life Insurance
Yet risks in terms of stricter regulations interrupting operations or rupee appreciation impacting revenue recognition
/margins is not worthy of abject neglect; Aarti felt Rs 8-10 crs currency loss in last two quarters because of rupee
strengthening. With implementation of Phase 3 of EU's REACH (Registration, Evaluation, Authorization and Restriction of
Chemicals) from June 2018, chemical supplies to EU would entice greater scrutiny, a no less arduous task for scantily
regulated Indian chemical companies. Though bagging mega supply orders - like the Rs 4000 crs ($610.5m) agrochemical
intermediary supply contract with a global agriculture company - does help prequalify for similar orders in future, it does not
guarantee a propitious deal for stakeholders not least due to long gestation period of such deals and significant inbuilt
uncertainty in supply schedules.
The stock currently trades at 22.2x FY18e EPS of Rs 40.13 and 19x FY19e EPS of Rs 46.98. Aarti's margin faces risk of reeling
under the twin effects of rising crude oil prices (margins capped in absolute terms) and strengthening of Indian rupee. It
wobbly Home & Personal Care Chemicals have barely revived - continues to bleed - despite posting over 50% growth in
revenues in H1. Still rebound in its speciality chemicals dispatches partly instigated by resurrection in agrochemical industry
and ramp up of nitro toluene capacity next fiscal would help earnings surge by some 17%. Strong operating cash flows would
doubtlessly contain built up ever pinching financial leverage. On balance we maintain "accumulate" rating on the stock with
revised target of Rs 1034 (previous target: Rs 900) based on 22x FY19e earnings. For more info refer to our March report.

5
5
CD Equisearch Pvt Ltd
Equities Derivatives Commodities Distribution of Mutual Funds Distribution of Life Insurance
Cross Sectional Analysis
Company
Equity (Rs crs)
CMP (Rs crs)
Mcap (Rs crs)
Inc. from ops.
(Rs crs)
Profit (Rs crs)
OPM (%)
NPM (%)
Int. coverage
ROE (%)
Mcap / IO P/BV P/E
Aarti Inds. 41 891 7318 3210 289 18.7 9.0 3.9 21.5 2.3 5.1 25.3
Atul Ltd 30 2446 7256 2798 224 14.6 8.0 24.7 12.1 2.6 3.7 32.3
Deepak Nitrite 26 215 2806 1290 69 13.6 5.4 3.4 11.0 2.2 3.7 37.0
Sudarshan Chem 14 370 2561 1292 77 12.8 6.0 5.1 19.0 2.0 5.9 33.2
calculations on ttm basis; Aarti income from operations approximated Companies not truly comparable due to product dissimilarity
Partly distressed by GST enforcement, Sudarshan Chemical revenues flat lined in first half of current fiscal with revenues of its
flagship pigments business rose by 4.4% while that of agro chemicals plunged by 25.4%; though not exactly comparable due to sales
reporting in Q2 net of GST. Pigments EBIT margins recovered somewhat in Q2 - 16.1% Vs 14.6% in Q1- but was still down over 200
bps in H1. PBT as a result tumbled by 16.4% (yoy) in H1. To augment its global position in the pigments market, subsidiaries in
Mexico and China have been set up. Risks of mass scale dumping by China looms large as the Indian pigment industry struggles
due to surplus capacities in China. Also Sudarshan continues to face challenges in procuring key intermediates from China.
After a tormenting Q1, Atul's performance and other chemicals business did show stark improvement in revenues and margins -
EBIT margins rose to 12.7% in Q2 from 7.6% in Q1 (though not exactly comparable due to sales in Q2 reported net of GST) but not
by enough to preclude nearly one-third fall in segment EBIT. Perceptible stress in both life science chemicals and performance and
other chemicals explains 35.8% drop in post tax earnings in H1. In its bulk chemicals business, plans are afoot to boost capacity
utilization of its new caustic chlorine plant - subject to external demand - and launch chlorine derivative products. Sensing
increased demand for its polymers, higher capacities are planned for specialty resins, sulphone intermediates and other
upstream/downstream products. For aromatics, building capacities for fragrance intermediate and downstream and launching new
products from its newly established kilo lab facility are also on the anvil.
Greater traction in Deepak Nitrite's performance products business last quarter - revenues up 23% (yoy) helped this business to turn
in to black; though not exactly comparable due to sales report net of GST in Q2. Buttressed by higher crude oil prices, its basic
chemicals business continued its good run for it has posted 30.2% growth in its EBIT in H1(23.6% in Q2) . To quicken
commissioning of its all engrossing phenol & acetone project by fourth quarter of current fiscal, Deepk Phenolics (DPL), wholly
owned subsidiary of Deepak Nitrite, is pulling out all stops to recruit commissioning and operational teams to speedup seed
marketing initiatives to finalize construction work. As per last reporting, the company has already invested Rs 865 crs and more
than Rs 1075 crs have been committed for project implementation.

6
6
CD Equisearch Pvt Ltd
Equities Derivatives Commodities Distribution of Mutual Funds Distribution of Life Insurance
Financials
Quarterly Results -Standalone Figures in Rs crs
Q2FY18 Q2FY17 % chg. H1FY18 H1FY17 % chg.
Income from operations (Gross) 887.89 710.25 25.0 1679.70 1445.65 16.2
Other Income 0.11 0.18 -38.9 0.20 0.54 -63.0
Total Income (gross) 888.00 710.43 25.0 1679.90 1446.19 16.2
Total Expenditure 727.61 559.31 30.1 1381.03 1140.07 21.1
EBIDTA (other income included) 160.39 151.12 6.1 298.87 306.12 -2.4
Interest 31.38 28.98 8.3 60.62 55.96 8.3
Depreciation 33.00 27.64 19.4 64.69 54.44 18.8
PBT 96.01 94.50 1.6 173.56 195.72 -11.3
Tax 17.50 18.50 -5.4 32.00 37.21 -14.0
PAT 78.51 76.00 3.3 141.56 158.51 -10.7
Extraordinary Item - - - - - -
Adjusted Net Profit 78.51 76.00 3.3 141.56 158.51 -10.7 EPS (F.V. 5) 9.56 9.12 4.8 17.24 19.02 -9.4
Segment Results Figures in Rs crs
Q2FY18 Q2FY17 % chg. H1FY18 H1FY17 % chg.
Segment Revenue (Gross)
Speciality Chemicals 690.98 572.13 20.8 1317.16 1163.35 13.2
Pharmaceuticals 136.86 101.45 34.9 242.93 203.24 19.5
Home & Personal Care Chemicals 60.05 36.67 63.8 119.61 79.06 51.3
Total 887.89 710.25 25.0 1679.70 1445.65 16.2
Segment EBIT
Speciality Chemicals 128.64 129.23 -0.5 241.57 262.25 -7.9
Pharmaceuticals 19.04 12.07 57.7 32.65 23.82 37.1
Home & Personal Care Chemicals -0.76 -1.02 -25.5 -0.18 -0.90 -80.0
Total 146.92 140.28 4.7 274.04 285.17 -3.9
Interest 31.38 28.98 8.3 60.62 55.96 8.3
Other Unallocable Exp. (net of income) 19.53 16.80 16.3 39.86 33.49 19.0
PBT 96.01 94.50 1.6 173.56 195.72 -11.3

7
7
CD Equisearch Pvt Ltd
Equities Derivatives Commodities Distribution of Mutual Funds Distribution of Life Insurance
Financials
Income Statement - Consolidated Figures in Rs crs
FY16 FY17 FY18e FY19e
Income from operations (Gross) 3006.59 3163.46 3722.39 4333.40
Growth (%) -3.7 5.2 17.7 16.4
Other Income 5.94 1.96 1.50 1.75
Total Income (gross) 3012.53 3165.42 3723.89 4335.15
Total Expenditure 2434.33 2509.96 3013.15 3522.71
EBITDA (other income included) 578.20 655.46 710.74 812.44
Interest 116.98 117.34 133.23 147.98
EBDT 461.22 538.12 577.51 664.46
Depreciation 98.50 122.52 147.44 169.60
Tax 94.63 88.06 88.16 96.00
Net profit 268.09 327.54 341.90 398.85
Minority interest 11.22 11.76 12.32 13.08
Net profit after MI 256.87 315.78 329.59 385.78
Extraordinary item 0.44 0.64 - -
Adjusted Net Profit 256.43 315.14 329.59 385.78
EPS (Rs.) 30.78 38.38 40.13 46.98
Segment Results Figures in Rs crs
FY16 FY17 FY18e FY19e
Segment Revenue
Speciality Chemicals 2430.36 2569.29 2975.77 3449.22
Pharmaceuticals 425.76 426.07 511.28 613.54
Home & Personal Care Chemicals 150.47 168.10 235.34 270.64
Total (gross) 3006.59 3163.46 3722.39 4333.40 Segment EBIT
Speciality Chemicals 503.64 565.75 589.88 668.82
Pharmaceuticals 38.80 48.13 68.88 88.96
Home & Personal Care Chemicals -0.24 0.77 -1.00 1.00
Sub Total 542.20 614.65 657.76 758.78
Interest 116.98 117.34 133.23 147.98
Other Unallocable Exp. (net of income) 62.50 81.72 94.45 115.95
PBT 362.72 415.59 430.07 494.86

8
8
CD Equisearch Pvt Ltd
Equities Derivatives Commodities Distribution of Mutual Funds Distribution of Life Insurance
Consolidated Balance Sheet Figures in Rs crs
FY16 FY17 FY18e FY19e
SOURCES OF FUNDS
Share Capital 41.66 41.06 41.06 41.06
Reserves 1095.64 1321.41 1614.42 1911.24
Total Shareholders Funds 1137.30 1362.47 1655.48 1952.30
Minority Interest 52.09 63.85 76.16 89.24
Long term debt 526.76 596.44 758.73 728.58
Total Liabilities 1716.15 2022.76 2490.37 2770.12
APPLICATION OF FUNDS
Gross Block 2081.44 2654.61 3149.61 3589.61
Less: Accumulated Depreciation 835.48 957.59 1105.03 1274.64
Net Block 1245.96 1697.02 2044.58 2314.97
Capital Work in Progress 313.01 269.52 225.48 214.52
Investments 41.26 46.96 44.98 44.98
Current Assets, Loans & Advances
Inventory 495.19 571.41 605.69 696.55
Sundry Debtors 523.40 524.67 592.88 640.31
Cash and Bank 28.99 28.50 33.55 31.37
Other Assets 186.41 192.61 217.77 248.32
Total CA & LA 1233.99 1317.19 1449.90 1616.54
Current liabilities 1102.59 1292.57 1262.04 1410.57
Provisions 20.50 27.83 32.57 38.23
Total Current Liabilities 1123.09 1320.40 1294.60 1448.79
Net Current Assets 110.91 -3.21 155.29 167.75
Net Deferred Tax (net of liability) -127.06 -155.44 -179.16 -204.46
Other Assets (Net of liabilities) 132.08 167.91 199.21 232.36
Total Assets 1716.15 2022.76 2490.37 2770.12

9
9
CD Equisearch Pvt Ltd
Equities Derivatives Commodities Distribution of Mutual Funds Distribution of Life Insurance
Cash Flow Statement Figures in Rs crs
FY17 FY18e FY19e
Net Income (a) 327.54 341.90 398.85
Non cash exp. & others (b) 149.85 170.91 194.65
Depreciation 122.52 147.44 169.60
Profit / loss on sale of assets / inv -0.80 0.00 0.00
Dividend income 0.00 0.00 0.00
Lease income -0.25 -0.25 -0.25
Deferred tax & others 28.38 23.72 25.30
(Increase) / decrease in NWC (c) -123.43 -300.04 -200.24
Inventory -76.22 -34.28 -90.85
Other assets (net of liabilities) -47.21 -265.76 -109.39
Operating cash flow (a+b+c) 353.96 212.77 393.27
Capex -530.22 -450.96 -429.04
Investments 0.60 0.00 0.00
Dividend income 0.00 0.00 0.00
Lease income 0.25 0.25 0.25
Investing cash flow (d) -529.04 -450.71 -428.79
Net borrowings 272.24 277.59 122.29
Dividends & others -1.64 -34.59 -88.96
Equity issuances -96.00 0.00 0.00
Financing cash flow (e) 174.60 243.00 33.33
Net change (a+b+c+d+e) -0.48 5.06 -2.19
10
10
CD Equisearch Pvt Ltd
Equities Derivatives Commodities Distribution of Mutual Funds Distribution of Life Insurance
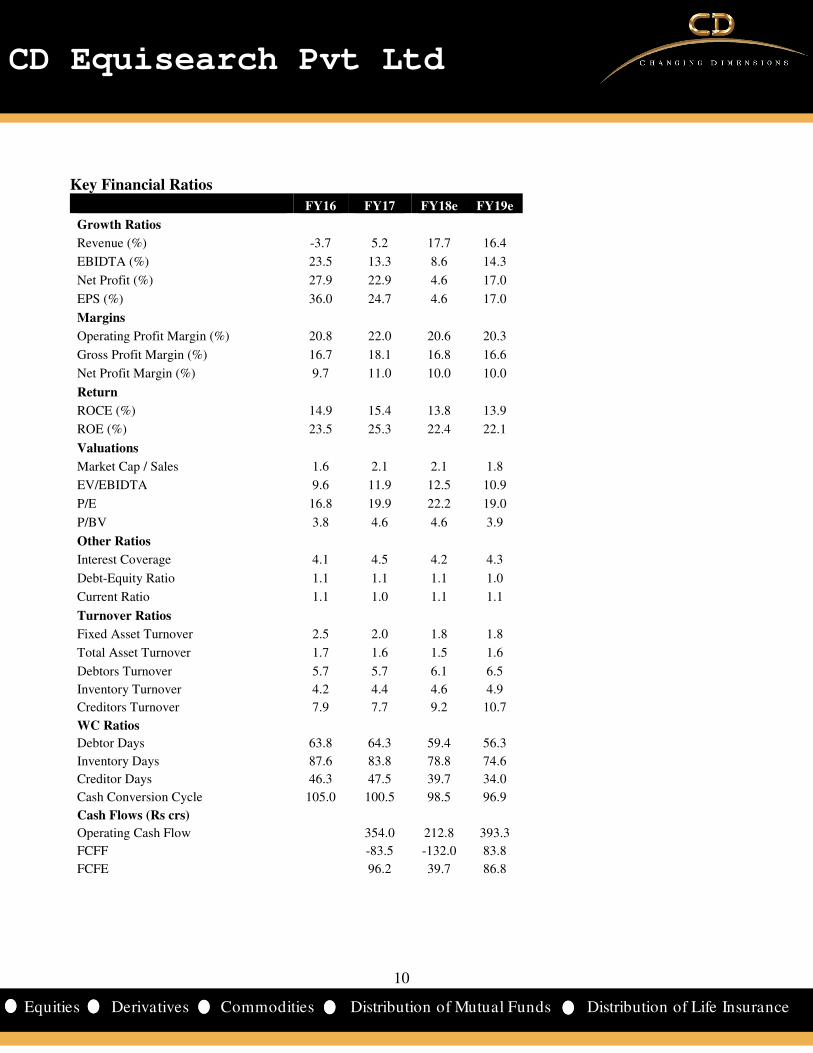
Key Financial Ratios
FY16 FY17 FY18e FY19e
Growth Ratios
Revenue (%) -3.7 5.2 17.7 16.4
EBIDTA (%) 23.5 13.3 8.6 14.3
Net Profit (%) 27.9 22.9 4.6 17.0
EPS (%) 36.0 24.7 4.6 17.0
Margins
Operating Profit Margin (%) 20.8 22.0 20.6 20.3
Gross Profit Margin (%) 16.7 18.1 16.8 16.6
Net Profit Margin (%) 9.7 11.0 10.0 10.0
Return
ROCE (%) 14.9 15.4 13.8 13.9
ROE (%) 23.5 25.3 22.4 22.1
Valuations
Market Cap / Sales 1.6 2.1 2.1 1.8
EV/EBIDTA 9.6 11.9 12.5 10.9
P/E 16.8 19.9 22.2 19.0
P/BV 3.8 4.6 4.6 3.9
Other Ratios
Interest Coverage 4.1 4.5 4.2 4.3
Debt-Equity Ratio 1.1 1.1 1.1 1.0
Current Ratio 1.1 1.0 1.1 1.1
Turnover Ratios
Fixed Asset Turnover 2.5 2.0 1.8 1.8
Total Asset Turnover 1.7 1.6 1.5 1.6
Debtors Turnover 5.7 5.7 6.1 6.5
Inventory Turnover 4.2 4.4 4.6 4.9
Creditors Turnover 7.9 7.7 9.2 10.7
WC Ratios
Debtor Days 63.8 64.3 59.4 56.3
Inventory Days 87.6 83.8 78.8 74.6
Creditor Days 46.3 47.5 39.7 34.0
Cash Conversion Cycle 105.0 100.5 98.5 96.9
Cash Flows (Rs crs)
Operating Cash Flow 354.0 212.8 393.3
FCFF -83.5 -132.0 83.8
FCFE 96.2 39.7 86.8

11
11
CD Equisearch Pvt Ltd
Equities Derivatives Commodities Distribution of Mutual Funds Distribution of Life Insurance
Cumulative Financial Data Figures in Rs crs FY08-10 FY11-13 FY14-16 FY17-19e
Income from operations (net) 3640 5223 8295 10409
Operating profit 573 808 1440 2173
EBIT 462 627 1179 1738
PBT 282 403 807 1340
Profit after MI & associate profit 195 315 612 1031 OPM (%) 15.7 15.5 17.4 20.9
NPM (%) 5.4 5.5 7.2 10.3
Interest coverage 2.6 2.8 3.2 4.4
ROE (%) 17.6 17.1 21.5 22.7
ROCE (%) 14.1 12.6 14.7 14.4
Debt-equity ratio* 0.9 1.1 1.1 1.0
Fixed asset turnover 3.4 3.2 2.9 1.9
Debtors turnover 6.2 5.1 5.8 6.0
Inventory turnover 4.9 4.0 4.8 4.6
Creditors turnover 8.8 8.1 8.6 9.1
Debtors days 59.3 71.9 62.9 61.2
Inventory days 73.9 90.2 76.5 79.2
Creditor days 41.6 45.3 42.5 40.2
Cash conversion cycle 91.6 116.7 96.8 100.2
FY08-10 implies three years ending fiscal 10; *as on terminal year
Despite nerve-wracking fall in crude oil prices, Aarti managed to report nearly 60% growth in income from operations in FY14-
16 period (43% in previous three year period). Thanks to its pricing formula for speciality chemicals - which caps absolute
margins per tonne of chemicals sold - OPMs expanded strikingly during this period (see table). Yet growing stress from
slowdown in off take of speciality chemicals - volume growth at 8% last fiscal plunged to the lowest level in at least three years;
further down 3-4% in H1- portend near term strain in its speciality chemicals earnings - estimated to rise by a meager 4.3% in the
current fiscal. Its NCB production as a result is also expected to grow at the weakest pace in FY17-19 period when compared to
that in FY11-13 and FY14-16 periods.
Yet stabilization of newly commissioned nitro-toluene capacity and newly found vigor in its pharmaceutical business (due to
higher capacity utilization and launch of new intermediates) would prop up earnings next fiscal - cumulative post tax earnings
in FY17-19 period would surge by 68% (see table). Sub-optimal utilization of ethylene plant at Dahej and nitro toluene plant
coupled with prodigious capital asset addition plans (Rs 450-500 crs /$68.7-76.3m annually) would further stymie asset turnover
ratios; would marginally suppress return on capital due to vigorous ramp up in utilization of newly commissioned projects.
Cash conversion cycle though would more or less flat line in the ensuing period.
.

12
12
CD Equisearch Pvt Ltd
Equities Derivatives Commodities Distribution of Mutual Funds Distribution of Life Insurance
Financial Summary – US dollar denominated
million $ FY16 FY17 FY18e FY19e
Equity capital 6.3 6.3 6.3 6.3
Shareholders funds 171.5 208.6 243.6 288.2
Total debt 194.7 241.2 281.1 299.7
Net fixed assets (incl CWIP) 235.0 303.3 346.5 386.1
Investments 6.2 7.2 6.9 6.9
Net current assets 16.7 -2.0 14.7 15.8
Total assets 258.7 310.4 371.1 413.0
Revenues (Gross) 459.3 471.5 568.2 661.4
EBITDA 88.2 97.6 108.5 124.0
EBDT 70.4 80.1 88.1 101.4
PBT 55.3 61.8 65.6 75.5
Profit after MI 39.2 47.0 50.3 58.9
EPS($) 0.47 0.57 0.61 0.72
Book value ($) 2.06 2.54 2.97 3.51
Operating cash flow 54.6 32.5 60.0
Investing cash flow -81.6 -68.8 -65.4
Financing cash flow 26.9 37.1 5.1
income statement figures translated at average rates; balance sheet and cash flow at year end rates; projections at current rates(Rs 65.52/$). All dollar denominated figures are adjusted for extraordinary items.

13
13
CD Equisearch Pvt Ltd
Equities Derivatives Commodities Distribution of Mutual Funds Distribution of Life Insurance
Disclosure& Disclaimer CD Equisearch Private Limited (hereinafter referred to as ‘CD Equi’) is a Member registered with National Stock Exchange of India Limited,
Bombay Stock Exchange Limited and Metropolitan Stock Exchange of India Limited (Formerly known as MCX Stock Exchange Limited). CD Equi
is also registered as Depository Participant with CDSL and AMFI registered Mutual Fund Advisor. The associates of CD Equi are engaged in
activities relating to NBFC-ND - Financing and Investment, Commodity Broking, Real Estate, etc.
CD Equi is registered under SEBI (Research Analysts) Regulations, 2014 with SEBI Registration no INH300002274. Further, CD Equi hereby
declares that –
• No disciplinary action has been taken against CD Equi by any of the regulatory authorities.
• CD Equi/its associates/research analysts do not have any financial interest/beneficial interest of more than one percent/material conflict of
interest in the subject company(s) (kindly disclose if otherwise).
• CD Equi/its associates/research analysts have not received any compensation from the subject company(s) during the past twelve months.
• CD Equi/its research analysts has not served as an officer, director or employee of company covered by analysts and has not been engaged
in market making activity of the company covered by analysts.
This document is solely for the personal information of the recipient and must not be singularly used as the basis of any investment decision.
Nothing in this document should be construed as investment or financial advice. Each recipient of this document should make such investigations
as they deem necessary to arrive at an independent evaluation of an investment in the securities of the companies referred to in this document
(including the merits and risks involved) and should consult their own advisors to determine the merits and risks of such an investment.
Reports based on technical and derivative analysis center on studying charts of a stock's price movement, outstanding positions and trading
volume, as opposed to focusing on a company's fundamentals and as such, may not match with a report on a company's fundamentals.
The information in this document has been printed on the basis of publicly available information, internal data and other reliable sources believed
to be true but we do not represent that it is accurate or complete and it should not be relied on as such, as this document is for general guidance
only. CD Equi or any of its affiliates/group companies shall not be in any way responsible for any loss or damage that may arise to any person from
any inadvertent error in the information contained in this report. CD Equi has not independently verified all the information contained within this
document. Accordingly, we cannot testify nor make any representation or warranty, express or implied, to the accuracy, contents or data contained
within this document.
While, CD Equi endeavors to update on a reasonable basis the information discussed in this material, there may be regulatory compliance or other
reasons that prevent us from doing so.
This document is being supplied to you solely for your information and its contents, information or data may not be reproduced, redistributed or
passed on, directly or indirectly. Neither, CD Equi nor its directors, employees or affiliates shall be liable for any loss or damage that may arise
from or in connection with the use of this information.
CD Equisearch Private Limited (CIN: U67120WB1995PTC071521)
Registered Office: 37, Shakespeare Sarani, 3rd Floor, Kolkata – 700 017; Phone: +91(33) 4488 0000; Fax: +91(33) 2289 2557 Corporate Office: 10,
Vasawani Mansion, 5th Floor, Dinshaw Wachha Road, Churchgate, Mumbai – 400 020. Phone: +91(22) 2283 0652/0653; Fax: +91(22) 2283, 2276
Website: www.cdequi.com; Email: [email protected]
buy: >20% accumulate: >10% to ≤20% hold: ≥-10% to ≤10% reduce: ≥-20% to <-10% sell: <-20%
Exchange Rates Used- Indicative
Rs/$ FY14 FY15 FY16 FY17
Average 60.5 61.15 65.46 67.09
Year end 60.1 62.59 66.33 64.84
All $ values mentioned in the write-up translated at the average rate of the respective quarter/ year as applicable. Projections converted at current
exchange rate. Cumulative dollar figure is the sum of respective yearly dollar value.
Recommended