CD Equisearch Pvt Ltd Jan 5, 2016
Equities Derivatives Commodities Distribution of Mutual Funds Distribution of Life Insurance
Supreme Industries Ltd.
No. of shares (m) 127.1
Mkt cap (Rs crs/$m) 8706/1309.9
Current price (Rs/$) 685/10.3
Price target (Rs/$) 821/12.4
52 W H/L (Rs.) 745/540
Book Value (Rs/$) 97/1.5
Beta 0.4
Daily volume (avg. monthly) 89218
P/BV (FY16e/17e) 6.5/5.5
EV/EBITDA (FY16e/17e) 13.7/11.8
P/E (FY16e/17e) 27.7/22.5
EPS growth (FY15/16e/17e) 14.2/-1.7/22.8
OPM (FY15/16e/17e) 15.7/14.4/14.9
ROE (FY15/16e/17e) 28.4/24.6/26.4
ROCE(FY15/16e/17e) 22.5/20.8/23.4
D/E ratio (FY15/16e/17e) 0.3/0.2/0.1
BSE Code 509930
NSE Code SUPREMEIND
Bloomberg SI IN
Reuters SUPI.BO
Shareholding pattern %
Promoters 49.7
MFs / Banks / FIs 7.4
Foreign 21.7
Govt. Holding 0.0
Non-Promoter Corp. 3.6
Total Public 17.6
Total 100.0
As on Sep 30, 2015
Recommendation
ACCUMULATE
Analyst
KISHAN GUPTA, CFA, FRM
Phone: + 91 (33) 4488 0043
E- mail: [email protected]
Rs crs
FY13
FY14
FY15
FY16e*
FY17e
Net revenues 3403.98 3962.22 4255.18 3335.39
5014.46 Other Income 2.69 5.94 4.66 8.99 9.11
EBITDA (other income included) 538.32 594.74 670.89 490.71 758.38
Profit after MI & associate profit
290.26 280.22 319.92 236.42 386.20
EPS(Rs) 22.85 22.06 25.18 18.61 30.40
EPS growth (%) 21.4 -3.5 14.2 -1.7 22.8
* nine months ended Mar 31, 2016 due to change in accounting year
Company Brief Supreme operates in five major business verticals namely plastic piping,
consumer products, packaging products, industrial products and composite
products. Some of its products include moulded furniture, storage & material
handling products, plastic piping system and protective packaging products.
Highlights
� Government of India’s much talked up schemes like "Housing for All by
2022"and 'Swachh Bharat Mission ' would doubtless boost growth of
plastic piping industry. Backed by State subsidy, the government proposes
to set up 20m urban houses. No less important is its plan to set up 100
smart cities in next five years. World Bank committing financial and
technical assistance to the 'Swachh Bharat Mission ' has given much needed
credibility to the program.
� To race ahead of the competition, Supreme unvaryingly ties up with
renowned global companies. It recently tied up with Calcamite Sanitary
Services, South Africa for manufacturing septic tanks. It is also in process of
renewing its contract for light weight and heavy duty plastic pallets
reinforced with glass fiber; earlier entered in to license agreement with
Lomold of South Africa for glass fiber composite products. It bagged
global rights for manufacturing & selling XF products from Rasmussen,
Polymer Development, Switzerland last fiscal, besides worldwide rights for
cross line bonded film and cross plastics.
� Supreme regularly strives to fling innovative products. Few such products
lined for this year include fusion furniture, cPVC fire sprinkler system,
underground tanks & septic tanks, industrial valves, underground sewer &
drainage systems and PPR pipe system for industrial applications.
� Supreme's composite LPG cylinder business is yet to take off full throng.
However, it has managed to get approval from Korea Gas Safety
Corporation for couple of its cylinder sizes. Opportunities galore in India
not least due to colossal demand for LPG cylinders - got a leg up from the
Ministry of Petroleum plan to launch such cylinders in India from April.
� The stock trades at 27.7x FY16e EPS of Rs 24.75 (annualized) and 22.5x
FY17e EPS of Rs 30.40. We expect robust recovery in earnings (+22.8%) next
fiscal helped by modest recovery in crude oil prices, which increases
margins. Favorable return on capital and leverage ratios should also cajole
investments. We, therefore, assign ‘accumulate’ rating on the stock with
target of Rs 821 based on 27xFY17e earnings (last two years average P/E on
year end prices: 25.5x), over a period of 9-12 months.

2
2
CD Equisearch Pvt Ltd
Equities Derivatives Commodities Distribution of Mutual Funds Distribution of Life Insurance
[
Company Profile Supreme Industries, a leading plastic processing company, is engaged in the business of processing polymers and resins into
finished plastic products. It deals in variety of products viz. moulded furniture, storage & material handling products, XF
films & products, performance films, industrial moulded products, protective packaging products, plastic piping system &
petrochemicals. Besides foraying in different methods of plastic processing like injection moulding, rotational moulding,
extrusion, compression moulding and blow moulding, Supreme has also pioneered few defining products in India such as
cross-laminated films, multilayer films, HMHD films and S.W.R. piping systems. Its over two dozen plants are spread out
across the nation spanning nine states and one union territory (see chart below). It counts on an army of its foreign
collaborators to roll out value added products. They include Rasmussen Polymer Development, Switzerland (cross-laminated
films), Wavin, Netherlands (plastic piping systems), PE Tech, Korea (cross linked foam), Kumi Kasai, Japan (automotive
components), and Kautex GMBH (composite LPG cylinders).
Its other businesses include construction of a corporate office complex in Andheri and ~30% stake in Supreme Petrochem Ltd
(SPL), one of the largest producers (single site) of polystyrene. SPL's other products include expanded polystyrene, extruded
polystyrene, extruded polystyrene insulation boards and compounds of polystyrene and polyolefin. Of the total 2.82 lakh sq.
ft. saleable area at its Andheri complex, it has sold 2.12 lakh sq.ft., amounting Rs 339 crs; expects to realize Rs 125 crs more
from the unsold area.
Plant locations
Source: Supreme Source: Supreme
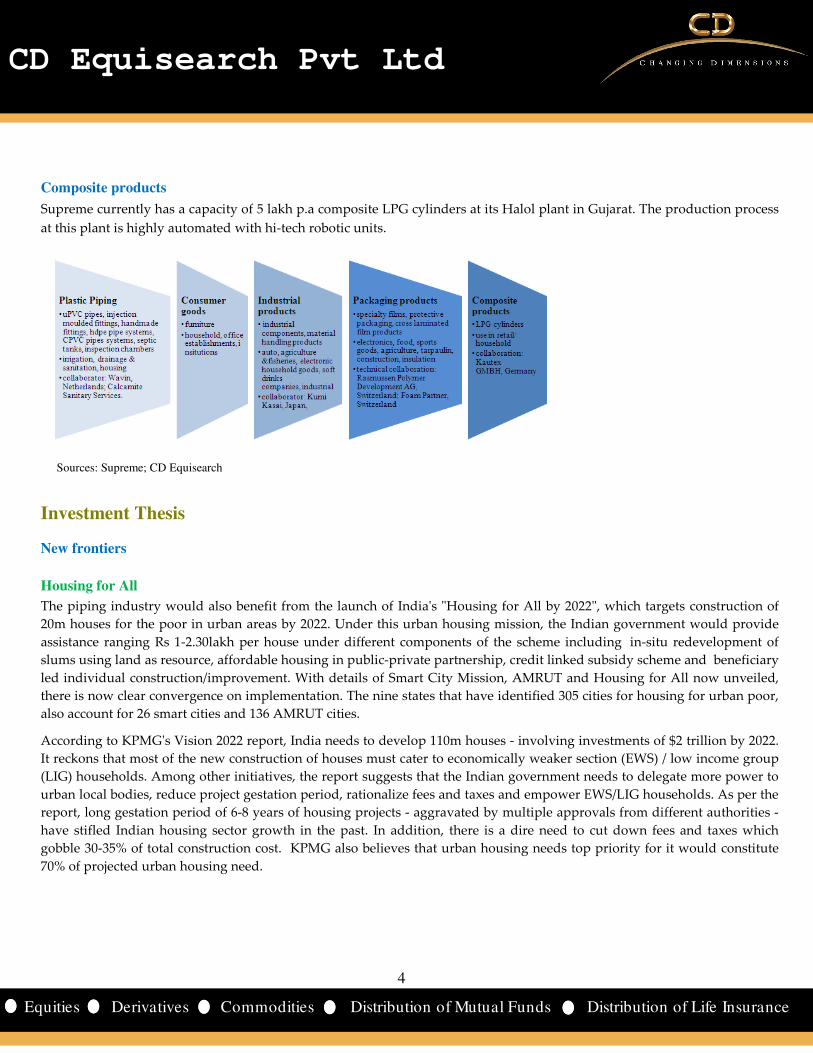
Product Profile Supreme basically operates in five major business verticals namely plastic piping, consumer products, packaging products,
industrial products and composite products.
Plastic piping system
Supreme supplies wide range of piping products and systems including uPVC pipes, injection moulded fittings, handmade
fittings, polypropylene random, co-polymer pipes & fittings, HDPE pipe systems, CPVC pipes systems, inspection chambers,
water tanks, septic tanks, bath fittings and solvents. Thanks to its large scale of offerings and product customization, it has
been able to garner 14% of the organized domestic plastic piping market. It has introduced a slew of innovative products,
which includes S.W.R. draining system, silent pipe system, inspection chambers, and aqua gold high pressure plumbing
system.

3
3
CD Equisearch Pvt Ltd
Equities Derivatives Commodities Distribution of Mutual Funds Distribution of Life Insurance
Consumer goods
It comprises vast array of moulded plastic furniture like moulded plastic chairs and tables, trolleys, centre tables, stools, baby
chairs and garden and office furniture. With a processing capacity of 30000 mt, the division has claimed executing the rare
feat of pioneering lacquered and upholstered moulded plastic furniture in India.
Packaging products
This division could be sub-classified in to three broad categories - specialty films, protective packaging products and cross
laminated film products.
Protective packaging
Its product range - designed to prevent wares from transit damages like breakages, dents, abrasions, scratches and corrosion-
includes thermoplastic PE foam sheets and profiles, cross-linked and blended PE foams (block & extruded) and air bubble
films and composites thereof. It also offers customized products like corrosion resistant, anti-static, UV resistant and metal
laminated foam & bubble films. This division can be further sub-classified as below:
a) protective packaging and cushioning division
b) insulation
• under deck insulation in textile units, malls, airports etc
• ducting insulation in hospitals, airports, IT/BPO etc
• pipe insulation for split AC tubings, drain pipes, chilled water pipelines etc
• floor insulation in server rooms, data centers, control rooms for petrochemicals
• overdeck and wall insulation in residential and commercial buildings, expansion joints for roads & buildings,
adhesive backed tapes for roofing, floor/tile protection etc
c) construction accessories division
Cross laminated films
It supplies cross laminated film products under brand name 'Silpaulin' for use in agriculture and industry. Technical
collaboration with Rasmussen Polymer Development AG, Switzerland has helped Supreme find ready market for its
products in Europe, Pacific Islands, Africa, America and Middle East. In the agriculture sector, cross laminated films are used
for covering the agricultural produce, erecting plant nutrition beds, and green house sheds and fumigation of tobacco leaves,
food grains and other agriculture produce.
Performance films
Hailed as one of India's largest manufacturers of co-extruded multi-layer barrier films, Supreme churns various kinds of
performance films such as thermoforming film, lamination grade film (beverages; lamitubes; medical devices; gels &
cosmetics), UHT milk film, lidding film (dairy products; meat and sea foods; bakery products; fresh vegetables) and
industrial applications (liner for windmill blades).
Industrial products
It manufactures industrial components and material handling products. Specifically, its material handling & storage
products range from small bins to super jumbo crates, injection moulded and roto moulded pallets and garbage bins. It also
handles home appliances, cabinets for electronic items, automotive parts, electronic voting machines and water purifiers.
After becoming the first company to launch injection moulded plastic pallets, it has also grown to be the country's largest.
Further for the automobile sector -where it boasts of clients like Ashok Leyland, Tata Motors, Maruti Udyog and Subros -it
serves electronic goods industry, agriculture, fisheries and soft drink companies.
4
4
CD Equisearch Pvt Ltd
Equities Derivatives Commodities Distribution of Mutual Funds Distribution of Life Insurance
Composite products
Supreme currently has a capacity of 5 lakh p.a composite LPG cylinders at its Halol plant in Gujarat. The production process
at this plant is highly automated with hi-tech robotic units.
Sources: Supreme; CD Equisearch
Investment Thesis
New frontiers
Housing for All
The piping industry would also benefit from the launch of India's "Housing for All by 2022", which targets construction of
20m houses for the poor in urban areas by 2022. Under this urban housing mission, the Indian government would provide
assistance ranging Rs 1-2.30lakh per house under different components of the scheme including in-situ redevelopment of
slums using land as resource, affordable housing in public-private partnership, credit linked subsidy scheme and beneficiary
led individual construction/improvement. With details of Smart City Mission, AMRUT and Housing for All now unveiled,
there is now clear convergence on implementation. The nine states that have identified 305 cities for housing for urban poor,
also account for 26 smart cities and 136 AMRUT cities.
According to KPMG's Vision 2022 report, India needs to develop 110m houses - involving investments of $2 trillion by 2022.
It reckons that most of the new construction of houses must cater to economically weaker section (EWS) / low income group
(LIG) households. Among other initiatives, the report suggests that the Indian government needs to delegate more power to
urban local bodies, reduce project gestation period, rationalize fees and taxes and empower EWS/LIG households. As per the
report, long gestation period of 6-8 years of housing projects - aggravated by multiple approvals from different authorities -
have stifled Indian housing sector growth in the past. In addition, there is a dire need to cut down fees and taxes which
gobble 30-35% of total construction cost. KPMG also believes that urban housing needs top priority for it would constitute
70% of projected urban housing need.

5
5
CD Equisearch Pvt Ltd
Equities Derivatives Commodities Distribution of Mutual Funds Distribution of Life Insurance
Source: Funding the vision — Housing for all by 2022, KPMG in India, 2014
Smart Cities Mission
To pep up the infrastructural appetite of the country, the GOI has set out an ambitious program of setting up 100 smart
cities in next five years. To give credibility to its plans, it has allocated Rs 98000 crs ($15330m) to build smart cities and
rejuvenate 500 towns and cities. Under the Smart City Mission, the Central Government proposes to spend Rs 48000 crs
over the next five years with matching contribution from the States.
Besides focusing on core infrastructure needs of adequate water and electricity supply, robust IT connectivity and
digitalization and efficient urban mobility and public transport, the Smart Cities Mission (SCM) emphasizes on proper
sanitation. The Central government also seeks to maximize gains by converging other State and Central Govt schemes with
the SCM. Cities must therefore seek convergence in the Smart City Proposal (SCP) with AMRUT, Swachh Bharat Mission
(SBM), National Heritage City Development and Augmentation Yojana (HRIDAY), Digital India, Skill development,
Housing for All etc
Source: smartcities.gov.in Source:.india.gov.in
Swawch Bharat Mission
The Indian government has also laid greater emphasis on cleanliness and sanitation. Swachh Bharat Mission envisages a
total investment of Rs 62009 crore of which Rs 14623 crore will be provided by the Centre. For the current fiscal, the GOI has
allocated Rs 3625 crs for this mission, an increase of 27% over the previous year. Apart from funding support from Indian
corporates - as part of their CSR initiatives, World Bank has also provided financial and technical assistance for the
program, which would propel demand for pipes & fittings beside other things. Under the Swachh Bharat Mission, the GOI
has built 8.9m toilets, increasing toilet access to 46.9% from 32.6% in 2011. In urban areas, it will build nearly two-thirds of
its total target of 2.5m household toilets by March 2016.

6
6
CD Equisearch Pvt Ltd
Equities Derivatives Commodities Distribution of Mutual Funds Distribution of Life Insurance
Technical collaborations
To widen its range of value added products (defined as products with operating margins in excess of 17%), Supreme has
relentlessly tied up with global firms for technology transfers. Currently, over a third of its total turnover comes from the
basket of value added products and it is estimated to surpass 35% by 2019-20. Extension of the scope of existing contracts
would also help. Rasmussen Polymer Development , Switzerland, Supreme's collaborator for cross laminated films, has now
extended the company's manufacturing and distribution rights of XF products to the entire world (earlier it covered only
South Asia). Similarly, global manufacturing and distribution rights have also been extended to cross line bonded film and
cross plastics film. Other envy-provoking collaborations include technical license agreement with Lomold of South Africa
for glass fiber composite products, Wavin Overseas B.V., Netherlands for plastics piping, Kumi Kasai Co of Japan for auto
components and Kautex GMBH, Germany for composite LPG cylinders.
Product launches
To rev up its product range, Supreme endeveaours to roll out new value added products. After having successfully launched
overhead water tanks, it aims to unveil other kinds of underground water storage tanks and septic tanks (in collaboration
with South Africa's Calcamite Sanitary Services). For the first time in India PVC based silent pipe system - used often in up
market hotels, high rise buildings and hospitals - was introduced last fiscal. PVC plumbing system was overhauled to
optimize costs.
Other introductions include multilayer foam pipe and several dozen injection moulded pipe fittings. Identifying
unprecedented growth in housing market, it has now sharpened its focus on sewerage and drainage segment. It would also
showcase new varieties of both plastic and chrome plated bath fittings in the current fiscal. To beat entrenched sluggishness
in consumer products segment (read: furniture business) - last fiscal 's volumes were one-quarter smaller than that four years
back - Supreme will launch a dozen new furniture models in current fiscal. A slew of other growth buttressing initiatives
include launch of various home appliance products, ramp up in auto component supplies to Honda Motors and engineering
a range of high margin accoustic insulation products.
Capex
After having invested nearly Rs 200 crs last fiscal, Supreme plans to splurge alike across businesses in just nine months (July-
Mar16) - to be funded through a mix of internal accruals and suppliers credit. Khargapur in West Bengal would house its
plastics product complex - for churning out PVC pipes, PE pipes, protective packaging products and plastic furniture - and a
roto moulding facility. Besides the Kharagpur plant, commercial production has recently started at a roto products and cPVC
facility in Malanpur (M.P.) Plans are afoot to boost capacities of premium furniture products in all its plants and enhance
pallet capacity at its existing facility at Gadegaon. Enhancing capacities of polyethylene & PVC pipes, bath fitting products
and protective packaging products are also in the pipeline. Production of roto moulding products (at Kanpur) and double
wall corrugated HDPE pipes would start by the first quarter of 2016. Other eye-catching measures include introduction of
several varieties of moulded fittings at Jalgaon and Malanpur and cross laminated films at its Get Muvala (Gujarat) plant.
7
7
CD Equisearch Pvt Ltd
Equities Derivatives Commodities Distribution of Mutual Funds Distribution of Life Insurance
Financials & valuation
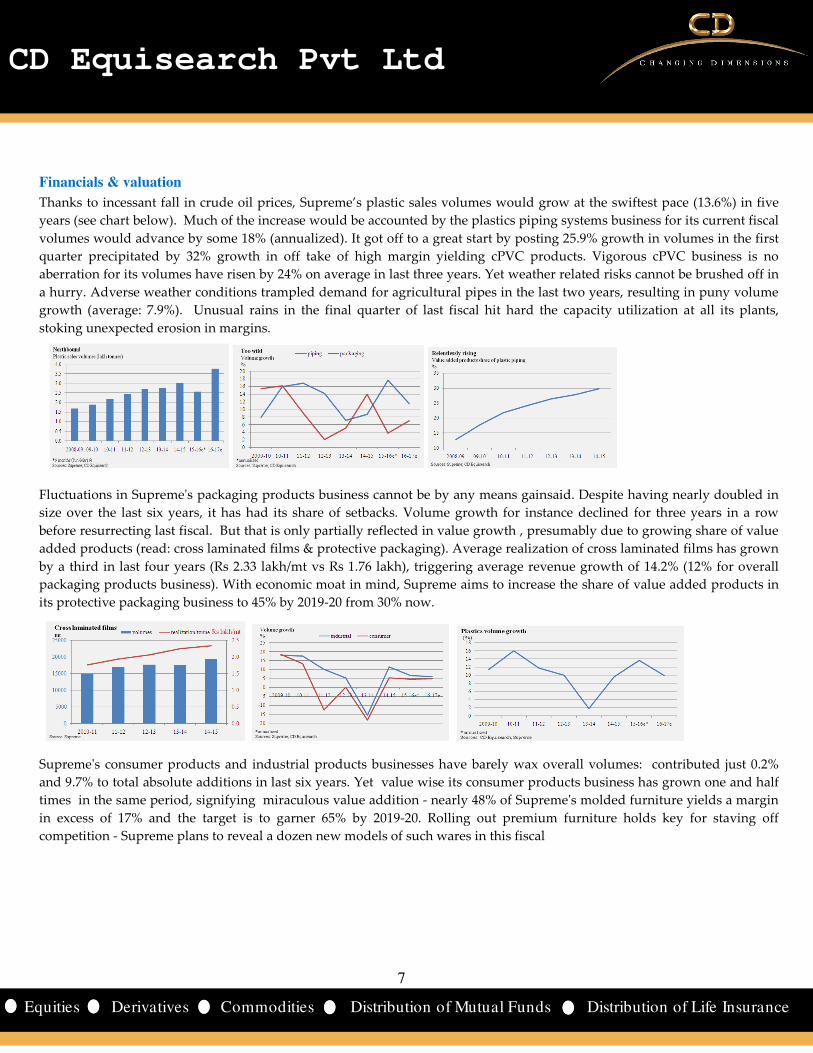
Thanks to incessant fall in crude oil prices, Supreme’s plastic sales volumes would grow at the swiftest pace (13.6%) in five
years (see chart below). Much of the increase would be accounted by the plastics piping systems business for its current fiscal
volumes would advance by some 18% (annualized). It got off to a great start by posting 25.9% growth in volumes in the first
quarter precipitated by 32% growth in off take of high margin yielding cPVC products. Vigorous cPVC business is no
aberration for its volumes have risen by 24% on average in last three years. Yet weather related risks cannot be brushed off in
a hurry. Adverse weather conditions trampled demand for agricultural pipes in the last two years, resulting in puny volume
growth (average: 7.9%). Unusual rains in the final quarter of last fiscal hit hard the capacity utilization at all its plants,
stoking unexpected erosion in margins.
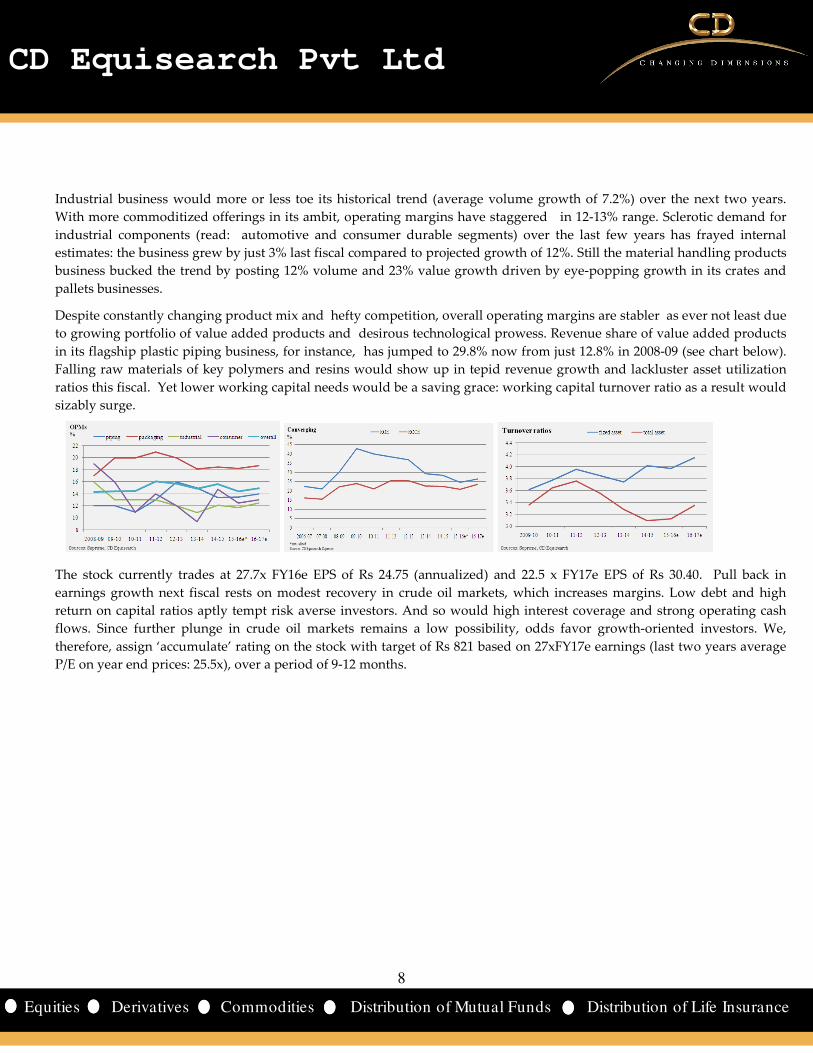
Fluctuations in Supreme's packaging products business cannot be by any means gainsaid. Despite having nearly doubled in
size over the last six years, it has had its share of setbacks. Volume growth for instance declined for three years in a row
before resurrecting last fiscal. But that is only partially reflected in value growth , presumably due to growing share of value
added products (read: cross laminated films & protective packaging). Average realization of cross laminated films has grown
by a third in last four years (Rs 2.33 lakh/mt vs Rs 1.76 lakh), triggering average revenue growth of 14.2% (12% for overall
packaging products business). With economic moat in mind, Supreme aims to increase the share of value added products in
its protective packaging business to 45% by 2019-20 from 30% now.
Supreme's consumer products and industrial products businesses have barely wax overall volumes: contributed just 0.2%
and 9.7% to total absolute additions in last six years. Yet value wise its consumer products business has grown one and half
times in the same period, signifying miraculous value addition - nearly 48% of Supreme's molded furniture yields a margin
in excess of 17% and the target is to garner 65% by 2019-20. Rolling out premium furniture holds key for staving off
competition - Supreme plans to reveal a dozen new models of such wares in this fiscal
8
8
CD Equisearch Pvt Ltd
Equities Derivatives Commodities Distribution of Mutual Funds Distribution of Life Insurance
Industrial business would more or less toe its historical trend (average volume growth of 7.2%) over the next two years.
With more commoditized offerings in its ambit, operating margins have staggered in 12-13% range. Sclerotic demand for
industrial components (read: automotive and consumer durable segments) over the last few years has frayed internal
estimates: the business grew by just 3% last fiscal compared to projected growth of 12%. Still the material handling products
business bucked the trend by posting 12% volume and 23% value growth driven by eye-popping growth in its crates and
pallets businesses.
Despite constantly changing product mix and hefty competition, overall operating margins are stabler as ever not least due
to growing portfolio of value added products and desirous technological prowess. Revenue share of value added products
in its flagship plastic piping business, for instance, has jumped to 29.8% now from just 12.8% in 2008-09 (see chart below).
Falling raw materials of key polymers and resins would show up in tepid revenue growth and lackluster asset utilization
ratios this fiscal. Yet lower working capital needs would be a saving grace: working capital turnover ratio as a result would
sizably surge.
The stock currently trades at 27.7x FY16e EPS of Rs 24.75 (annualized) and 22.5 x FY17e EPS of Rs 30.40. Pull back in
earnings growth next fiscal rests on modest recovery in crude oil markets, which increases margins. Low debt and high
return on capital ratios aptly tempt risk averse investors. And so would high interest coverage and strong operating cash
flows. Since further plunge in crude oil markets remains a low possibility, odds favor growth-oriented investors. We,
therefore, assign ‘accumulate’ rating on the stock with target of Rs 821 based on 27xFY17e earnings (last two years average
P/E on year end prices: 25.5x), over a period of 9-12 months.
9
9
CD Equisearch Pvt Ltd
Equities Derivatives Commodities Distribution of Mutual Funds Distribution of Life Insurance
Risks and Concerns
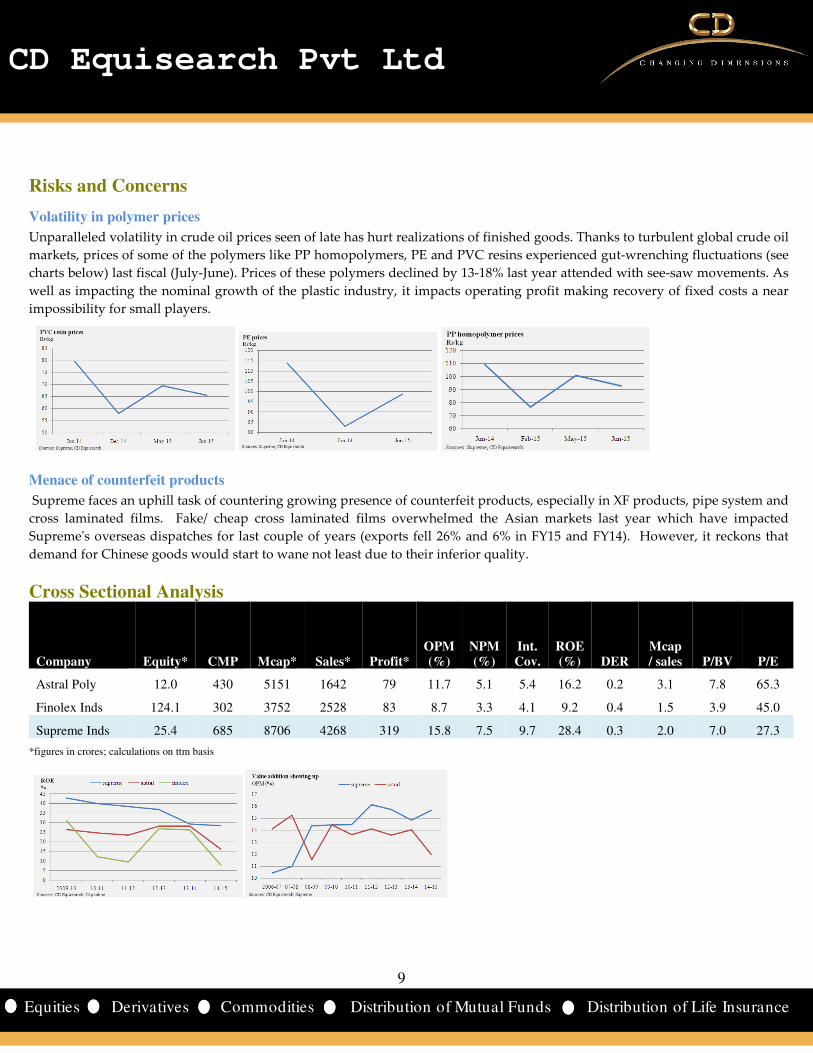
Volatility in polymer prices
Unparalleled volatility in crude oil prices seen of late has hurt realizations of finished goods. Thanks to turbulent global crude oil
markets, prices of some of the polymers like PP homopolymers, PE and PVC resins experienced gut-wrenching fluctuations (see
charts below) last fiscal (July-June). Prices of these polymers declined by 13-18% last year attended with see-saw movements. As
well as impacting the nominal growth of the plastic industry, it impacts operating profit making recovery of fixed costs a near
impossibility for small players.
Menace of counterfeit products
Supreme faces an uphill task of countering growing presence of counterfeit products, especially in XF products, pipe system and
cross laminated films. Fake/ cheap cross laminated films overwhelmed the Asian markets last year which have impacted
Supreme's overseas dispatches for last couple of years (exports fell 26% and 6% in FY15 and FY14). However, it reckons that
demand for Chinese goods would start to wane not least due to their inferior quality.
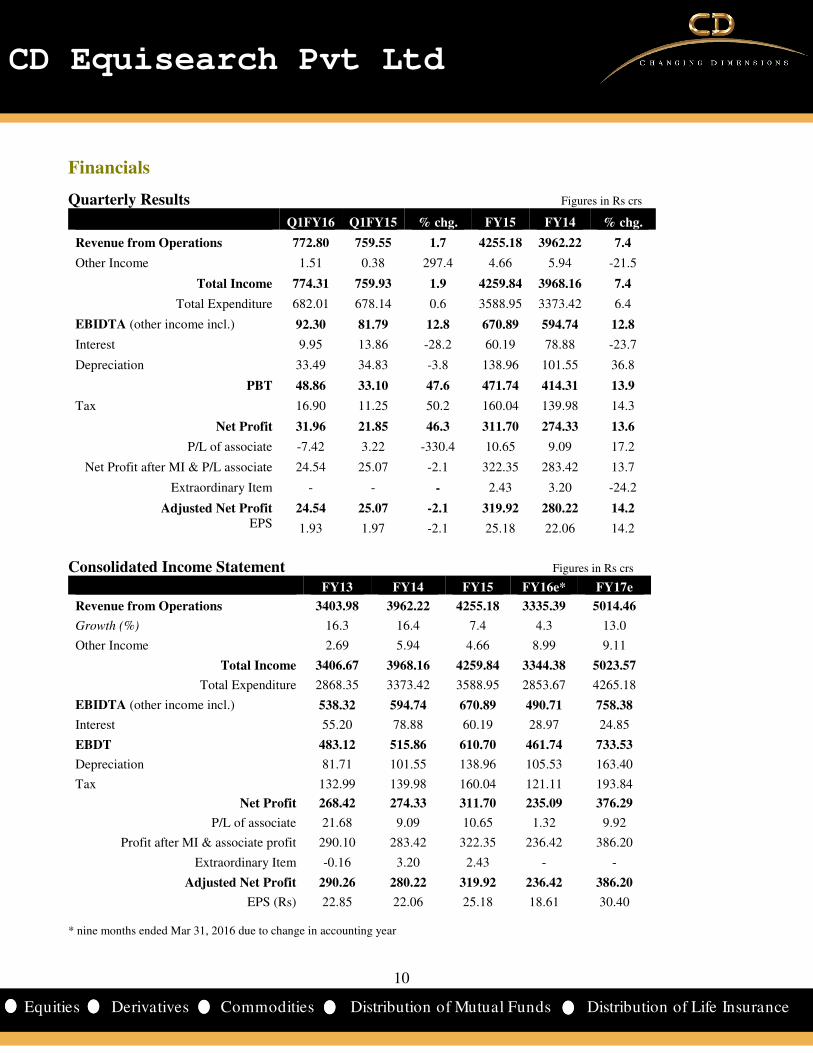
Cross Sectional Analysis
Company Equity* CMP Mcap* Sales* Profit*
OPM
(%)
NPM
(%)
Int.
Cov.
ROE
(%) DER
Mcap
/ sales P/BV P/E
Astral Poly 12.0 430 5151 1642 79 11.7 5.1 5.4 16.2 0.2 3.1 7.8 65.3
Finolex Inds 124.1 302 3752 2528 83 8.7 3.3 4.1 9.2 0.4 1.5 3.9 45.0
Supreme Inds 25.4 685 8706 4268 319 15.8 7.5 9.7 28.4 0.3 2.0 7.0 27.3
*figures in crores; calculations on ttm basis
10
10
CD Equisearch Pvt Ltd
Equities Derivatives Commodities Distribution of Mutual Funds Distribution of Life Insurance
Financials
Quarterly Results Figures in Rs crs
Q1FY16 Q1FY15 % chg. FY15 FY14 % chg.
Revenue from Operations 772.80 759.55 1.7 4255.18 3962.22 7.4
Other Income 1.51 0.38 297.4 4.66 5.94 -21.5
Total Income 774.31 759.93 1.9 4259.84 3968.16 7.4
Total Expenditure 682.01 678.14 0.6 3588.95 3373.42 6.4
EBIDTA (other income incl.) 92.30 81.79 12.8 670.89 594.74 12.8
Interest 9.95 13.86 -28.2 60.19 78.88 -23.7
Depreciation 33.49 34.83 -3.8 138.96 101.55 36.8
PBT 48.86 33.10 47.6 471.74 414.31 13.9
Tax 16.90 11.25 50.2 160.04 139.98 14.3
Net Profit 31.96 21.85 46.3 311.70 274.33 13.6
P/L of associate -7.42 3.22 -330.4 10.65 9.09 17.2
Net Profit after MI & P/L associate 24.54 25.07 -2.1 322.35 283.42 13.7
Extraordinary Item - - - 2.43 3.20 -24.2
Adjusted Net Profit 24.54 25.07 -2.1 319.92 280.22 14.2
EPS 1.93 1.97 -2.1 25.18 22.06 14.2
Consolidated Income Statement Figures in Rs crs
FY13 FY14 FY15 FY16e* FY17e
Revenue from Operations 3403.98 3962.22 4255.18 3335.39 5014.46
Growth (%) 16.3 16.4 7.4 4.3 13.0
Other Income 2.69 5.94 4.66 8.99 9.11
Total Income 3406.67 3968.16 4259.84 3344.38 5023.57
Total Expenditure 2868.35 3373.42 3588.95 2853.67 4265.18
EBIDTA (other income incl.) 538.32 594.74 670.89 490.71 758.38
Interest 55.20 78.88 60.19 28.97 24.85
EBDT 483.12 515.86 610.70 461.74 733.53
Depreciation 81.71 101.55 138.96 105.53 163.40
Tax 132.99 139.98 160.04 121.11 193.84
Net Profit 268.42 274.33 311.70 235.09 376.29
P/L of associate 21.68 9.09 10.65 1.32 9.92
Profit after MI & associate profit 290.10 283.42 322.35 236.42 386.20
Extraordinary Item -0.16 3.20 2.43 - -
Adjusted Net Profit 290.26 280.22 319.92 236.42 386.20
EPS (Rs) 22.85 22.06 25.18 18.61 30.40 * nine months ended Mar 31, 2016 due to change in accounting year
11
11
CD Equisearch Pvt Ltd
Equities Derivatives Commodities Distribution of Mutual Funds Distribution of Life Insurance
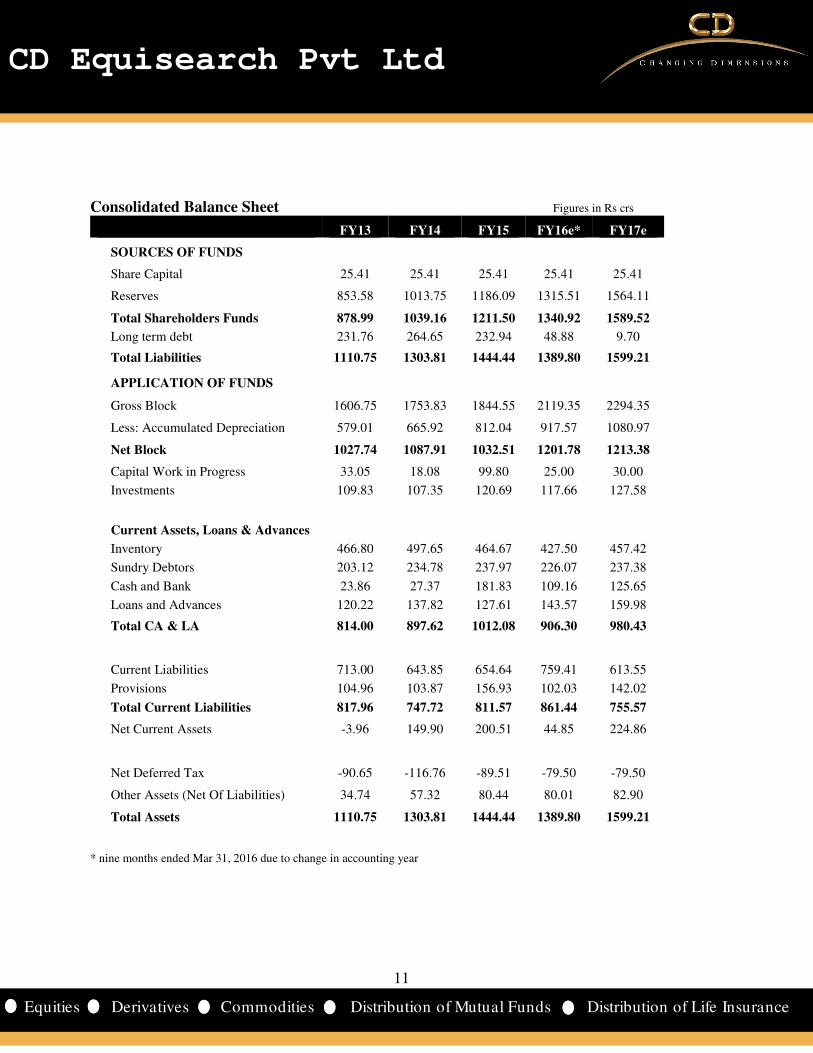
Consolidated Balance Sheet Figures in Rs crs
FY13 FY14 FY15 FY16e* FY17e
SOURCES OF FUNDS
Share Capital 25.41 25.41 25.41 25.41 25.41
Reserves 853.58 1013.75 1186.09 1315.51 1564.11
Total Shareholders Funds 878.99 1039.16 1211.50 1340.92 1589.52
Long term debt 231.76 264.65 232.94 48.88 9.70
Total Liabilities 1110.75 1303.81 1444.44 1389.80 1599.21
APPLICATION OF FUNDS
Gross Block 1606.75 1753.83 1844.55 2119.35 2294.35
Less: Accumulated Depreciation 579.01 665.92 812.04 917.57 1080.97
Net Block 1027.74 1087.91 1032.51 1201.78 1213.38
Capital Work in Progress 33.05 18.08 99.80 25.00 30.00
Investments 109.83 107.35 120.69 117.66 127.58
Current Assets, Loans & Advances
Inventory 466.80 497.65 464.67 427.50 457.42
Sundry Debtors 203.12 234.78 237.97 226.07 237.38
Cash and Bank 23.86 27.37 181.83 109.16 125.65
Loans and Advances 120.22 137.82 127.61 143.57 159.98
Total CA & LA 814.00 897.62 1012.08 906.30 980.43
Current Liabilities 713.00 643.85 654.64 759.41 613.55
Provisions 104.96 103.87 156.93 102.03 142.02
Total Current Liabilities 817.96 747.72 811.57 861.44 755.57
Net Current Assets -3.96 149.90 200.51 44.85 224.86
Net Deferred Tax -90.65 -116.76 -89.51 -79.50 -79.50
Other Assets (Net Of Liabilities) 34.74 57.32 80.44 80.01 82.90
Total Assets 1110.75 1303.81 1444.44 1389.80 1599.21
* nine months ended Mar 31, 2016 due to change in accounting year
12
12
CD Equisearch Pvt Ltd
Equities Derivatives Commodities Distribution of Mutual Funds Distribution of Life Insurance
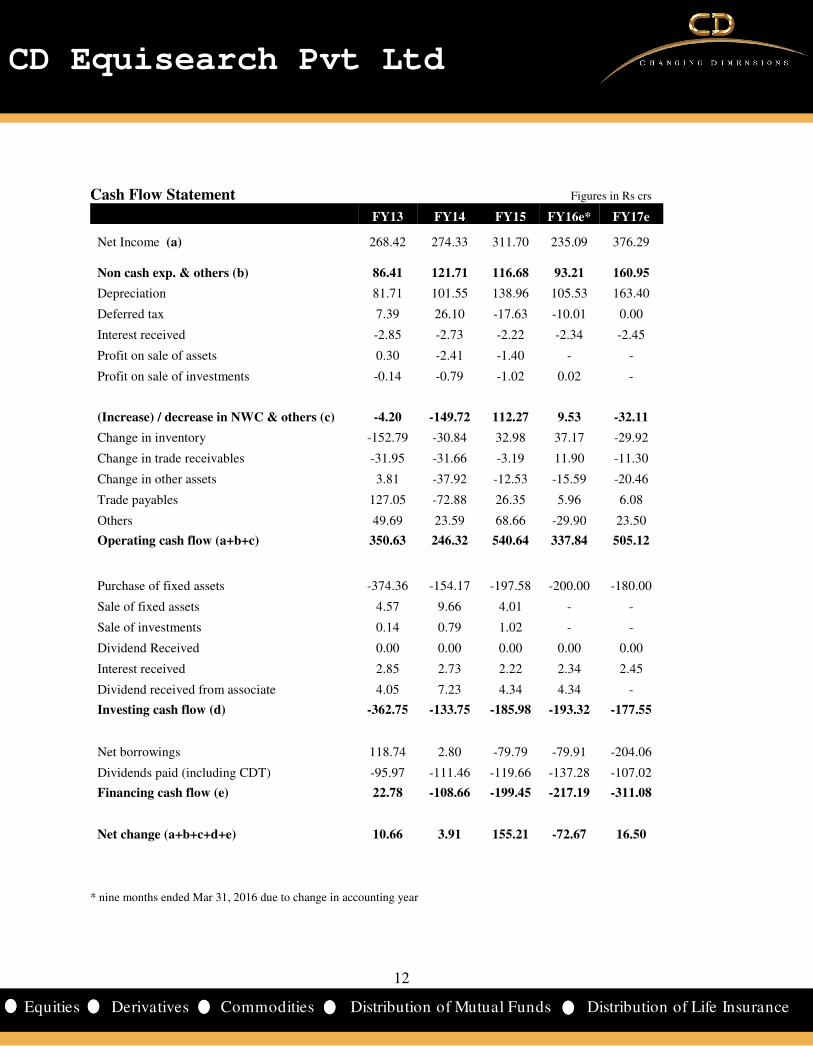
Cash Flow Statement Figures in Rs crs
FY13 FY14 FY15 FY16e* FY17e
Net Income (a) 268.42 274.33 311.70 235.09 376.29
Non cash exp. & others (b) 86.41 121.71 116.68 93.21 160.95
Depreciation 81.71 101.55 138.96 105.53 163.40
Deferred tax 7.39 26.10 -17.63 -10.01 0.00
Interest received -2.85 -2.73 -2.22 -2.34 -2.45
Profit on sale of assets 0.30 -2.41 -1.40 - -
Profit on sale of investments -0.14 -0.79 -1.02 0.02 -
(Increase) / decrease in NWC & others (c) -4.20 -149.72 112.27 9.53 -32.11
Change in inventory -152.79 -30.84 32.98 37.17 -29.92
Change in trade receivables -31.95 -31.66 -3.19 11.90 -11.30
Change in other assets 3.81 -37.92 -12.53 -15.59 -20.46
Trade payables 127.05 -72.88 26.35 5.96 6.08
Others 49.69 23.59 68.66 -29.90 23.50
Operating cash flow (a+b+c) 350.63 246.32 540.64 337.84 505.12
Purchase of fixed assets -374.36 -154.17 -197.58 -200.00 -180.00
Sale of fixed assets 4.57 9.66 4.01 - -
Sale of investments 0.14 0.79 1.02 - -
Dividend Received 0.00 0.00 0.00 0.00 0.00
Interest received 2.85 2.73 2.22 2.34 2.45
Dividend received from associate 4.05 7.23 4.34 4.34 -
Investing cash flow (d) -362.75 -133.75 -185.98 -193.32 -177.55
Net borrowings 118.74 2.80 -79.79 -79.91 -204.06
Dividends paid (including CDT) -95.97 -111.46 -119.66 -137.28 -107.02
Financing cash flow (e) 22.78 -108.66 -199.45 -217.19 -311.08
Net change (a+b+c+d+e) 10.66 3.91 155.21 -72.67 16.50
* nine months ended Mar 31, 2016 due to change in accounting year

13
13
CD Equisearch Pvt Ltd
Equities Derivatives Commodities Distribution of Mutual Funds Distribution of Life Insurance
Key Financial Ratios
FY13 FY14 FY15 FY16e FY17e
Growth Ratios (%)
Revenue 16.3 16.4 7.4 4.3 13.0
EBIDTA (other income included) 13.4 9.9 13.0 -2.4 16.2
Net Profit 21.4 -3.5 14.2 -1.7 22.8
EPS 21.4 -3.5 14.2 -1.7 22.8
Margins (%)
Operating Profit Margin 15.7 14.9 15.7 14.4 14.9
Gross Profit Margin 14.2 12.9 14.3 13.8 14.6
Net Profit Margin 7.9 6.8 7.3 7.0 7.5
Return (%)
ROCE 25.5 22.7 22.5 20.8 23.4
RONW 36.8 29.2 28.4 24.6 26.4
Valuations
Market Cap / Sales 1.2 1.6 2.1 2.0 1.7
EV/EBIDTA 8.2 11.5 13.8 13.7 11.8
P/E 13.8 22.7 28.2 27.7 22.5
P/BV 4.5 6.1 7.5 6.5 5.5
Other Ratios
Interest Coverage 8.3 6.2 8.8 13.3 23.9
Debt-Equity Ratio 0.5 0.5 0.3 0.2 0.1
Current Ratioa 1.0 1.2 1.2 1.1 1.3
Turnover Ratios
Fixed Asset Turnover 3.9 3.7 4.0 4.0 4.2
Total Asset Turnover 3.6 3.3 3.1 3.1 3.4
Debtors Turnover 18.2 18.1 18.0 19.1 21.6
Inventory Turnover 7.3 7.0 7.5 8.5 9.6
Creditors Turnover 10.1 10.8 12.4 12.6 13.9
Working Capital Turnover 15.0 13.4 13.8 18.5 22.6
WC Ratios
Debtor days 20.1 20.2 20.3 19.1 16.9
Inventory days 49.7 52.2 48.9 42.9 37.9
Creditor days 36.0 33.9 29.4 29.1 26.3
Cash conversion cycle 33.7 38.4 39.8 32.9 28.5
Cash Flows
Operating cash flow 350.6 246.3 540.6 337.8 505.1
FCFE -362.7 -133.7 -186.0 -193.3 -177.5
FCFF 22.8 -108.7 -199.5 -217.2 -311.1
Ratios for FY16 annualized
14
14
CD Equisearch Pvt Ltd
Equities Derivatives Commodities Distribution of Mutual Funds Distribution of Life Insurance
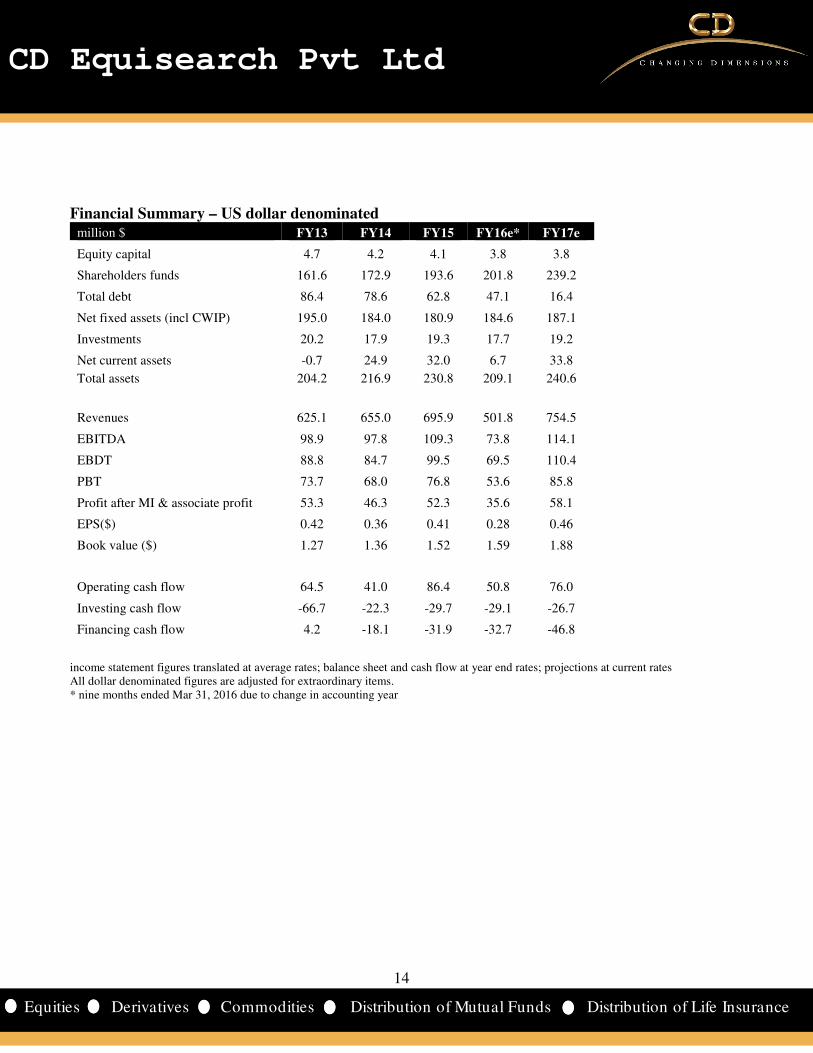
Financial Summary – US dollar denominated
million $ FY13 FY14 FY15 FY16e* FY17e
Equity capital 4.7 4.2 4.1 3.8 3.8
Shareholders funds 161.6 172.9 193.6 201.8 239.2
Total debt 86.4 78.6 62.8 47.1 16.4
Net fixed assets (incl CWIP) 195.0 184.0 180.9 184.6 187.1
Investments 20.2 17.9 19.3 17.7 19.2
Net current assets -0.7 24.9 32.0 6.7 33.8
Total assets 204.2 216.9 230.8 209.1 240.6
Revenues 625.1 655.0 695.9 501.8 754.5
EBITDA 98.9 97.8 109.3 73.8 114.1
EBDT 88.8 84.7 99.5 69.5 110.4
PBT 73.7 68.0 76.8 53.6 85.8
Profit after MI & associate profit 53.3 46.3 52.3 35.6 58.1
EPS($) 0.42 0.36 0.41 0.28 0.46
Book value ($) 1.27 1.36 1.52 1.59 1.88
Operating cash flow 64.5 41.0 86.4 50.8 76.0
Investing cash flow -66.7 -22.3 -29.7 -29.1 -26.7
Financing cash flow 4.2 -18.1 -31.9 -32.7 -46.8
income statement figures translated at average rates; balance sheet and cash flow at year end rates; projections at current rates All dollar denominated figures are adjusted for extraordinary items. * nine months ended Mar 31, 2016 due to change in accounting year

15
15
CD Equisearch Pvt Ltd
Equities Derivatives Commodities Distribution of Mutual Funds Distribution of Life Insurance
Recommendation
Unequalled opportunities await Indian piping industry thanks to GOI's ambitious plans to promote affordable urban
housing, support irrigation and foster sanitation. Implementation of GST would further galvanize the plumbing industry
for currently 65% of that market is organized. Substitution of conventional piping systems like galvanized iron and cast
iron piping systems with plastic would also do its bit to fuel demand. No less worthwhile is the demand propelling impact
of GOI's phenomenal schemes like "Housing for All by 2022", Smart Cities Mission (SCM) and Swachh Bharat Mission.
Most remarkably, it is the convergence of these schemes - SCM with AMRUT, Housing for All and others - that would
work wonders. However, KPMG reckons that the Indian urban housing market would flounder unless the government
embraces ground breaking reforms - reduce project gestation period by doing away the need for multiple approvals;
rationalize fees and taxes; delegate more power to urban local bodies; empower EWS/LIG households.
Supreme's plastic piping system business still rules the roost for it contributed 58% to the plastic business revenue growth
in last six years; as a result its revenue share climbed ten percentage points to 51%. Product introductions have helped too:
flaunted 1500 new products in last five years taking the total tally to 6500. Tellingly, revenue share of valued added
products has also conspicuously soared: 29.8% in 2014-15 from just 12.8% in 2008-09. Yet its piping business volume has
remarkably lagged Astral Poly's (a PVC and cPVC pipe manufacturer) for last two years (latter posted volume growth in
excess of 20%). Operating margins though of Supreme has been distinctly higher in last three years.
Its plastics packaging business has been most profitable, earning margins in 18-20% range. To gain a larger foothold,
Supreme would vitalize its protective packaging and cross laminated films business over the next few years. Plans are
afoot to more than double revenue of protective packaging over the next five years. Its cross laminated films - sold under
the brand 'Silpaulin' - has also registered average annual revenue growth of 14.1% in last four years, vitalized by a thriving
domestic market. Yet exports suffered not least due to overwhelming Chinese exports in prized Asian markets.
Yet risks cannot be undone. Precipitous fall in global crude oil markets would inevitably reduce product realizations.
Prices of some key polymers like PP homopolymers, PE and PVC resins have already taken a knock. Wild price
fluctuations of polymers not only affect domestic plastic consumption but also hurt operating margins. Also a worth
noting risk is inundation of cheaper Chinese products, particularly XF products, pipe system and cross laminated films.
The stock currently trades at 27.7x FY16e EPS of Rs 24.75(annualized) and 22.5x FY17e EPS of Rs 30.40. Revenue would
grow in low single digits this fiscal before resurrecting by next year. However, pull back in earnings growth next fiscal
rests on modest recovery in crude oil markets. Volumes though would remain buoyant thanks to higher dispatches of
plastic piping systems business. Low debt and high return on capital ratios remain aptly tempting. And so would high
interest coverage and strong operating cash flows. Since further plunge in crude oil markets remains a low possibility,
odds favour growth-oriented investors. We, therefore, assign ‘accumulate’ rating on the stock with target of Rs 821 based
on 27xFY17e earnings (last two years average P/E on year end prices: 25.5x; infinitesimal downside risk warrants a lower
equity risk premium), over a period of 9-12 months.
16
16
CD Equisearch Pvt Ltd
Equities Derivatives Commodities Distribution of Mutual Funds Distribution of Life Insurance
Disclosure& Disclaimer CD Equisearch Private Limited (hereinafter referred to as ‘CD Equi’) is a Member registered with National Stock Exchange of India Limited,
Bombay Stock Exchange Limited and Metropolitan Stock Exchange of India Limited (Formerly known as MCX Stock Exchange Limited). CD
Equi is also registered as Depository Participant with CDSL and AMFI registered Mutual Fund Advisor. The associates of CD Equi are
engaged in activities relating to NBFC-ND - Financing and Investment, Commodity Broking, Real Estate, etc.
CD Equi is registered under SEBI (Research Analysts) Regulations, 2014. Further, CD Equi hereby declares that –
• No disciplinary action has been taken against CD Equi by any of the regulatory authorities.
• CD Equi/its associates/research analysts do not have any financial interest/beneficial interest of more than one percent/material
conflict of interest in the subject company(s).
• CD Equi/its associates/research analysts have not received any compensation from the subject company(s) during the past twelve
months.
• CD Equi/its research analysts has not served as an officer, director or employee of company covered by analysts and has not been
engaged in market making activity of the company covered by analysts.
This document is solely for the personal information of the recipient and must not be singularly used as the basis of any investment decision.
Nothing in this document should be construed as investment or financial advice. Each recipient of this document should make such
investigations as they deem necessary to arrive at an independent evaluation of an investment in the securities of the companies referred to in
this document (including the merits and risks involved) and should consult their own advisors to determine the merits and risks of such an
investment.
Reports based on technical and derivative analysis center on studying charts of a stock's price movement, outstanding positions and trading
volume, as opposed to focusing on a company's fundamentals and as such, may not match with a report on a company's fundamentals.
The information in this document has been printed on the basis of publicly available information, internal data and other reliable sources
believed to be true but we do not represent that it is accurate or complete and it should not be relied on as such, as this document is for general
guidance only. CD Equi or any of its affiliates/group companies shall not be in any way responsible for any loss or damage that may arise to
any person from any inadvertent error in the information contained in this report. CD Equi has not independently verified all the information
contained within this document. Accordingly, we cannot testify nor make any representation or warranty, express or implied, to the accuracy,
contents or data contained within this document.
While, CD Equi endeavors to update on a reasonable basis the information discussed in this material, there may be regulatory compliance or
other reasons that prevent us from doing so.
This document is being supplied to you solely for your information and its contents, information or data may not be reproduced, redistributed
or passed on, directly or indirectly. Neither, CD Equi nor its directors, employees or affiliates shall be liable for any loss or damage that may
arise from or in connection with the use of this information.
CD Equisearch Private Limited (CIN: U67120WB1995PTC071521)
Registered Office: 37, Shakespeare Sarani, 1st Floor, Kolkata – 700 017; Phone: +91(33) 4488 0000; Fax: +91(33) 2289 2557; Corporate Office: 10,
Vasawani Mansion, 2nd Floor, Dinshaw Wachha Road, Churchgate, Mumbai – 400 020; Phone: +91(22) 2283 0652/0653; Fax: +91(22) 2283, 2276
Website: www.cdequi.com; Email: [email protected]
buy: >20% accumulate: >10% to ≤20% hold: ≥-10% to ≤10% reduce: ≥-20% to <-10% sell: <-20%
Recommended