S1
Cascaded Spiral Microfluidic Device for Deterministic and High Purity Continuous
Separation of Circulating Tumor Cells
Tae Hyun Kim,1,2,3,4 Hyeun Joong Yoon,1,3,4 Philip Stella,5 and Sunitha Nagrath1,3,4,a)
1Department of Chemical Engineering, University of Michigan, Ann Arbor, MI, 48109 2Department of Electrical Engineering and Computer Science, University of Michigan, Ann
Arbor, MI, 48109 3Biointerfaces Institute, University of Michigan, Ann Arbor, MI, 48109 4Translational Oncology Program, University of Michigan, Ann Arbor, MI, 48109 5Department of Chemical and Biomolecular Engineering, University of Notre Dame, Notre
Dame, IN, 46556
Supplemental Material
Figure S1. Sample preparation
Figure S2. Device design for focused particle streak analysis
Figure S3. Channel Reynolds number and Dean number for different channel geometries
Figure S4. Pressure induced deformation of PDMS microchannel and its effect on streak equilibriums
Figure S5. Focused particle streak breakdown
Figure S6. Streak patterns of different size particles and the influence of each channel parameters
Figure S7. Additional streak patterns
Figure S8. Additional streak patterns
Figure S9. Schematic of the cascaded spiral separator
Figure S10. Cell separation efficiency and leukocyte depletion rate at different flow rates
Table S1. Cell separation efficiency with lower number MCF-7 cell spikes Video S1. Focusing and separation of leukocytes (DAPI, 2x speed)
Video S2. Focusing and separation of MCF-7 cells (FITC, 1x speed)

S2
Microfabrication
To fabricate the spiral microfluidic devices, a silicon master mold was produced using a conventional
photolithography process. Briefly, a negative photoresist, SU-8 (2025, Microchem Corp.), was spun on a flat 4-
inch silicon wafer to a desired thickness, exposed to UV light through a printed photomask (Fineline Imaging), and
developed. Microchannel replicas were formed by casting a 10:1 ratio mixture of polydimethylsiloxane (PDMS,
Sylgard 184, Dow Corning) elastomer and curing agent onto the patterned silicon/SU-8 master using standard soft
lithography methods. After degassing and curing in an oven for 6 hours at 65 °C, the PDMS channels were
peeled off and flip bonded to a plasma treated microscope glass slide (Fisher Scientific). To ensure complete
bonding, devices were heated on a 65°C hot plate for 10 minutes. Inlet and outlet ports were manually punched
with a coring tool (Harris Uni-core). Tygon tubings (Cole-Parmer) were then press fitted into the holes, forming
tight connections.
Sample preparation
Due to the high volume fraction of RBCs affecting the focused streams, the experiments were carried out
with RBCs depleted blood. Although, this method does not mean a complete removal of RBCs, the solution is
now suitable for inertial separation. Also, since the remaining RBCs are small in size, the majority of RBCs were
depleted with the WBC streaks during separation using the cascaded spiral device. However, the device will
perform equally well, even with the whole blood when diluted, with some sacrifice in throughput.
FIG. S1. Sample preparation procedure for MCF-7 and leukocyte suspensions.

S3
Device design for focused particle streak analysis
Several low aspect ratio spiral microfluidic devices were designed by varying each geometric parameter to
systematically study the effect of channel geometry on particle focusing behaviors. The variables considered
were the height, width, and radius of curvature. Each device consisted of an inlet with a filter region to prevent
debris and particle aggregates from entering the microchannel, multiple 180° sections of curvatures followed by an
outlet. Initially, a single turn of a specific radius of interest, ranging from 1250 to 20000 µm, was connected
before an outlet where the focusing particle streaks were imaged and analyzed. Additional consecutive turns with
a 500 µm increment in radius of curvature were added to provide sufficient channel length to allow particles to
reach their equilibrium positions completely. The lengths of each devices were calculated based on the lateral
migration velocity of 10 µm diameter particles along the channel width resulting from the inertial forces for the
lowest measured flow rate1. Samples were run through the device from the largest radius of curvature inward.
By modifying the width and height of the channels, from 200 to 400 µm and 50 to 100 µm respectively, streak
images for different particle sizes were obtained. The inlet and outlet were large enough to fit the tubing for
particle injection and collection.
FIG. S2. Schematic representation of the spiral device design for particle focusing and streak equilibrium
characterization. Each device consists of an inlet, filter, and consecutive channel curvatures to ensure complete
focusing of 10 and 20 µm particles, followed by an outlet. Prior to the outlet exists a curved channel structure of
particular interest for streak analysis. Channel width, height, and radius of curvature at this analysis region have
been systematically varied to observe the channel’s geometric effect on streak migration behaviors.

S4
FIG. S3. Channel Reynolds number and Dean number as a function of average fluid flow velocity for different
spiral channel geometries. (A, B) Channel width, (C, D) height, and (E, F) radius of curvature are modified from
an initial channel geometry of 300 µm width, 50 µm height, and 5000 µm radius of curvature spiral channel.

S5
FIG S4. Pressure induced deformation of PDMS microchannel and its effect on particle streak equilibrium. (A)
Equilibrium positions of 10 µm focused particle streaks are measured using two spiral devices with identical
channel configurations (analysis region (Figure S-2)) but different channel lengths. (B) Composite image of the
channel wall (bright field) and 10 µm particle streaks (fluorescent) imposed are shown at the overlapping flow
ranges tested. (C) Schematic illustrating the channel cross section being pressurized and the corresponding streak
shift induced during outer wall migration phase.
S6
Focused particle streak breakdown
Some of the unpredictable phenomena such as dual focusing and streak breakdown hindered the process
of designing optimal separation devices. Dual stable equilibria often occurred when the particle streaks reached
the nearest inner channel wall. In some cases, during the inner-to-outer wall transition, single point focusing
equilibrium showed less dominancy over the pre- and post-state equilibriums resulting in three equilibrium
positions. This was more obvious at larger curvatures where the particle migration rates decreased and the
migration occurred more gradually (Figure 2(D)). While stable focusing was maintained during streak migration
of 20 µm particles across the centerline of the channel width, 10 µm particles showed a complete defocus during
the outer wall migration (Figure 2(C)). 10 µm particles with smaller confinement ratio (ap/H) were subjected to
dominant Dean drag force while 20 µm particles maintained focused from the competing lift forces. Thus,
defocusing occurred more obviously while the channel height increased. To further elucidate the exact dynamics
of streak migration and more accurately estimate its equilibria by theoretical calculations and understand focus
breakdowns, a three-dimensional computational model should be developed in future studies.
FIG. S5. Focused particle streak breakdown.
S7
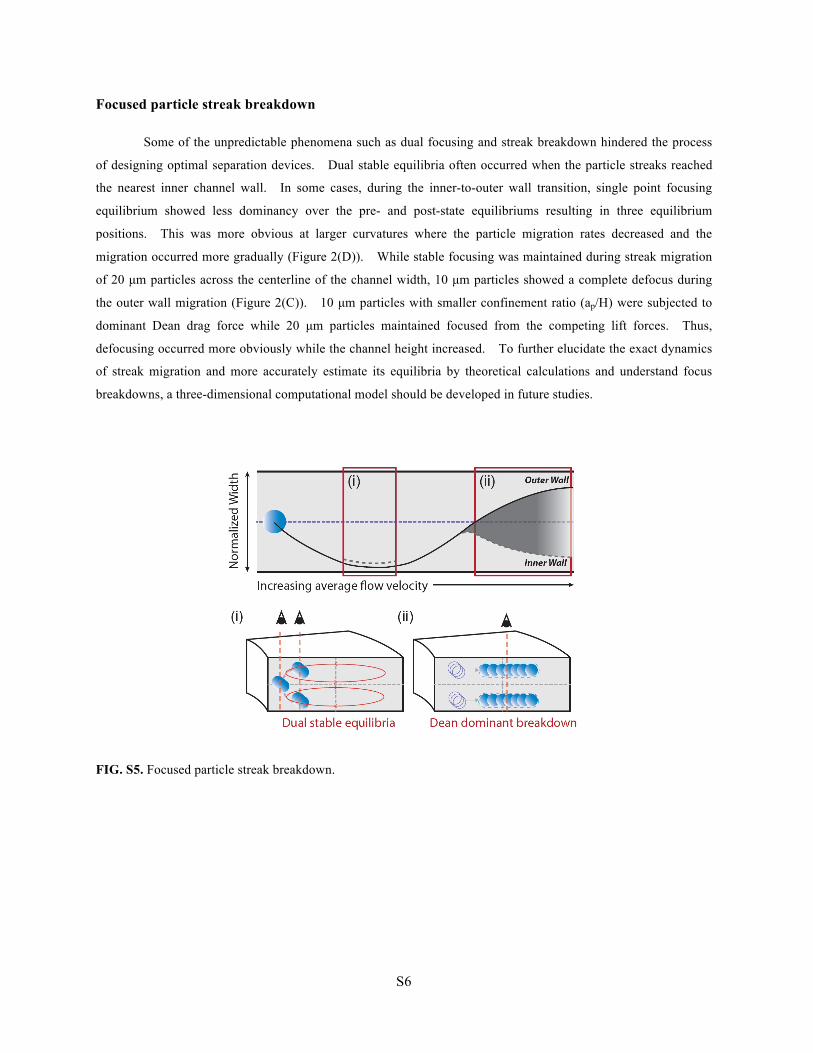
FIG. S6. Schematic illustration of (A) streak migration patterns of different size particles and (B) the influence of
each channel’s geometric parameter. Black line represents a reference condition.

S8
FIG S7. Additional streak patterns of 10 µm and 20 µm particles in a rectangular cross section of 50 µm × 200
µm (H×W) spiral channel structure with varying curvature.

S9
FIG. S8. Additional streak patterns of 10 µm and 20 µm particles in a rectangular cross section of 50 µm × 400
µm (H×W) spiral channel structure with varying curvature.

S10
FIG. S9. Schematic of the low aspect ratio cascaded spiral separator shown with its dimensions at each bifurcation
regions. Channel height is fixed to 50 µm and the cell mixture is injected through the inlet at a flow rate of 550
µL/min.
S11
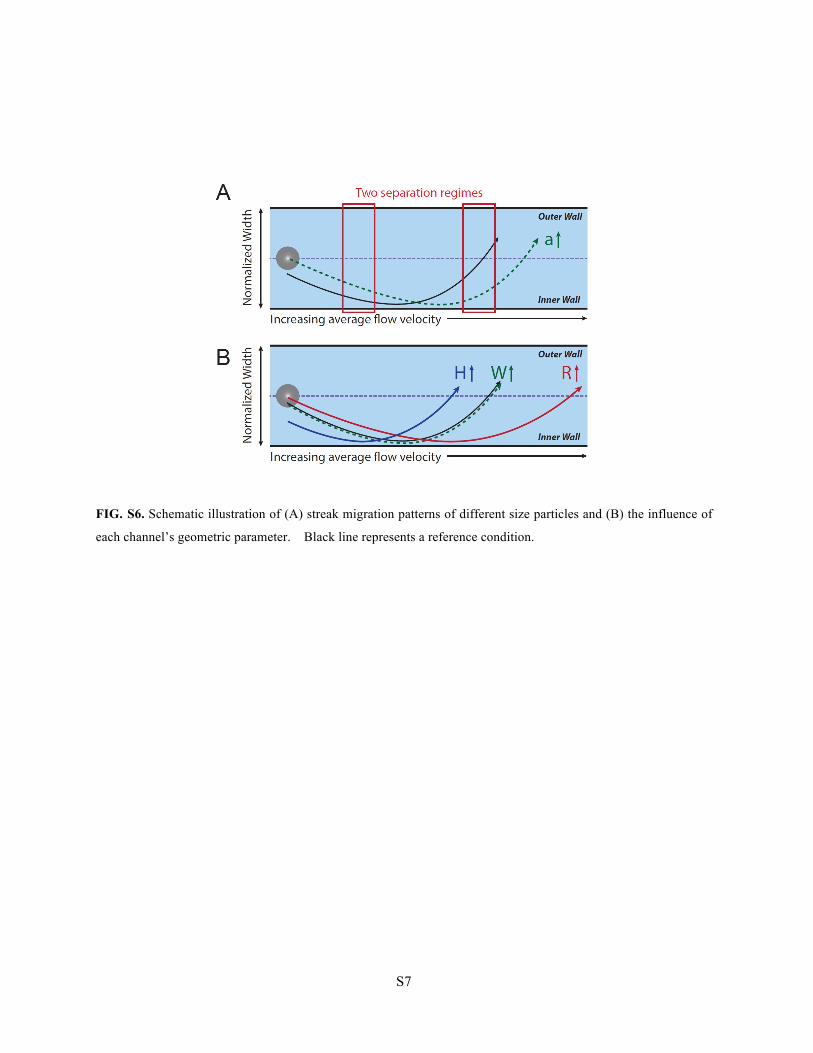
FIG. S10. Cell separation efficiency in a cascaded spiral microfluidic chip. (A) Recovery rate of MCF-7 cells
and (B) leukocyte depletion rate is shown after processing through the 1st, 2nd separation region at different
volumetric flow rates. (C) Total separation efficiency of the cascaded spiral device is calculated after sample
collection. Error bars represent the standard deviation of the results from three experiments.

S12
TABLE S1. Cell separation efficiency with lower number MCF-7 cell spikes in a cascaded spiral microfluidic chip.
Total # of cells Outlet 1 Outlet 2 Outlet 3 Recovery Rate [%]
D1 182 6 0 176 96.70 D2 193 2 1 190 98.45 D3 216 3 6 207 95.83 D4 233 7 1 225 96.57 D5 372 6 1 365 98.12 D6 386 7 3 376 97.41
Average 97.18 (n=6)
VIDEO S1. Focusing and separation of leukocytes (shown in blue) in the cascaded spiral microfluidic chip.
VIDEO S2. Focusing and separation of MCF-7 cells (shown in green) in the cascaded spiral microfluidic chip.
REFERENCES
1 D. Di Carlo, Lab Chip 9, 3038 (2009).
Recommended