CARBON FARM PLAN
Angels Farm
Photo: Belinda Xu
Martina Skjellerudsveen, MS
March 28, 2018, San Diego

2
CARBON FARM PLAN FOR ANGELS FARM
Content
Introduction and planning 3 Acknowledgement 3
Property information 4 Regulations and certificates 4
Assessment of landscape 4 Climate 4 History 5 Infrastructure and resources 6 Ecological sites 9 Soil description 9 Pests and pollinators 13 Water 13 Ecology 13
Current management 14 Produce 14 Animals 14
Goals 14
Potential carbon beneficial practices 15
Calculations of carbon sequestration 19
Discussion 21 Challenges of implementation 22
Recommendations 22
Funding opportunities 26
Future planning and recordkeeping 26 Implementation plan 27 Operation and maintenance of selected management practices 29
Contact information 30
References 30

3
Introduction and planning
The scope of the Carbon Farm Plan is to make recommendations on how a farm can implement
practices that increase the potential for carbon sequestration in the soil and at the same time
support the production and enterprise goals of the farmer. Lowering greenhouse gas (GHG)
emissions from farms and increasing carbon storage in soil are part of the statewide efforts to mitigate climate change. From the farmer’s perspective, carbon farming practices contribute to
increase soil organic matter (SOM), which has several co-benefits. A higher SOM content improves
soil structure and water holding capacity. Keeping moisture in the soil makes plant production more
resilient to drought and increases water use efficiency. Ultimately these practices can potentially
create higher yields.
Carbon beneficial practices are conservation practices that support mechanisms in which carbon is
locked up in biomass. The underground biomass (plant roots and other plant material) is in close
connection with the physical and biological properties of soil. Microorganisms decompose plant
material to smaller organic compounds. These compounds can be encapsulated in soil aggregates
and through different biological, physical and chemical processes, the soil has the potential to store
the carbon in its underground biomass for a very long time. For more detail on carbon farming, visit
Carbon Cycle Institute (carboncycleinstitute.org).
This Carbon Farm Plan (CFP) is the result of in-depth interviews and e-mail correspondence with
Belinda Xu and Jackson Yang, the owners of Angels Farm. The online calculation tools COMET-
planner, COMET-farm, and Compost-planner are used to calculate the amount of carbon a certain
farming practice would potentially sequester.
The objective of this work is to produce a document directed to and for the farmer. It is a report that
can be a source of inspiration and learning and a resource for further planning and funding
opportunities.
Acknowledgement Dr. Chandra Richards, Conservation Ecologist at Resource Conservation District of Greater San
Diego County (RCD), has been my supervisor and creator of the maps made in ArcGIS (Figure 3 and
4).
I am grateful for Belinda Xu, owner of Angels Farm, having been very responsive to all my questions
in person and by e-mail. Without good communication, this project would not be possible.
Jeffrey Creque (Director of the Carbon Cycle Institute), Lance Anderson (Agricultural Program
Director at Mission Resource Conservation District), and Puja Batra (Batra Ecology) have all
contributed with valuable input.

4
Property information
Farm Name: Angels Farm, B&W Farm LLC
Farm owners: Dr. Belinda Xu and Wilson Xu
Purchased: February 2016
Farm Physical Address: 3131 La Posta Road, Campo, CA 91906, San Diego County
Mailing Address: Angela Preschool & Kindergarten, 5708 N Muscatel Avenue,
San Gabriel, CA, 91775
Email: [email protected]
Phone: 626 286 0266
Web site: https://www.angelesfarm.com
Operation Type: Mixed vegetables and poultry
Assessor Parcel Numbers
(APNs):
605-050-16-00
Watershed and region Cottonwood-Tijuana watershed 18070305
Regional Water Board nr. 9*
Size 40.12 acres where 18 acres are farmed.
*Reference: Environmental Protection Agency (2018); California Water Board (2018)
Regulations and certificates
Certifications: Producer, Egg handler, Organic Certification
Monitoring of irrigation water is performed annually.
No conservation plan has been made for this property.
Assessment of landscape
The total size of the property is 40.12 acres. About 15 acres are stony, hilly and not farmable, though
it could be used for grazing. About 18 acres are farmed and mostly flat. There are no open streams
on the property even though maps from Web Soil Survey (NRCS, 2018b) indicate this.
Climate
The climate at Angels Farm is semi-arid Mediterranean with warm dry summers and cold moist
winters. The warmest month is July and August, with an average temperature of 73°F, though an
average high of 94°F. The coldest month is December and January, with an average low of 34°F. The
owners of the farm have experienced temperatures down to 20°F and up to 125°F. The wind usually
derives from southwest and Santa Ana winds from the east. It is frequently experienced high and
sustained winds. High winds and extreme temperatures seem to be a major growth limitation.

5
History
The land was purchased in 2016. In the previous 7–8 years, the land was leased out and used for
grazing approximately 15 cows. The grazed area can be clearly seen in Figure 1A. Previously, the
property also had a small apple orchard.
In the two maps below, it is apparent how the land use has changed. The left hand map,
Figure 1A, is from Web Soil Survey, date unknown (NRCS, 2018b). Figure 1B is from Google Earth
dated 2018 (Google, 2018). It is clear to see that how the land management has changed, assumingly
(also based on information from Belinda Xu), from perennial grass cover to row crops.
Figure 1, two aerial photos of 3131 La Posta, Campo, CA showing different soil cover
6
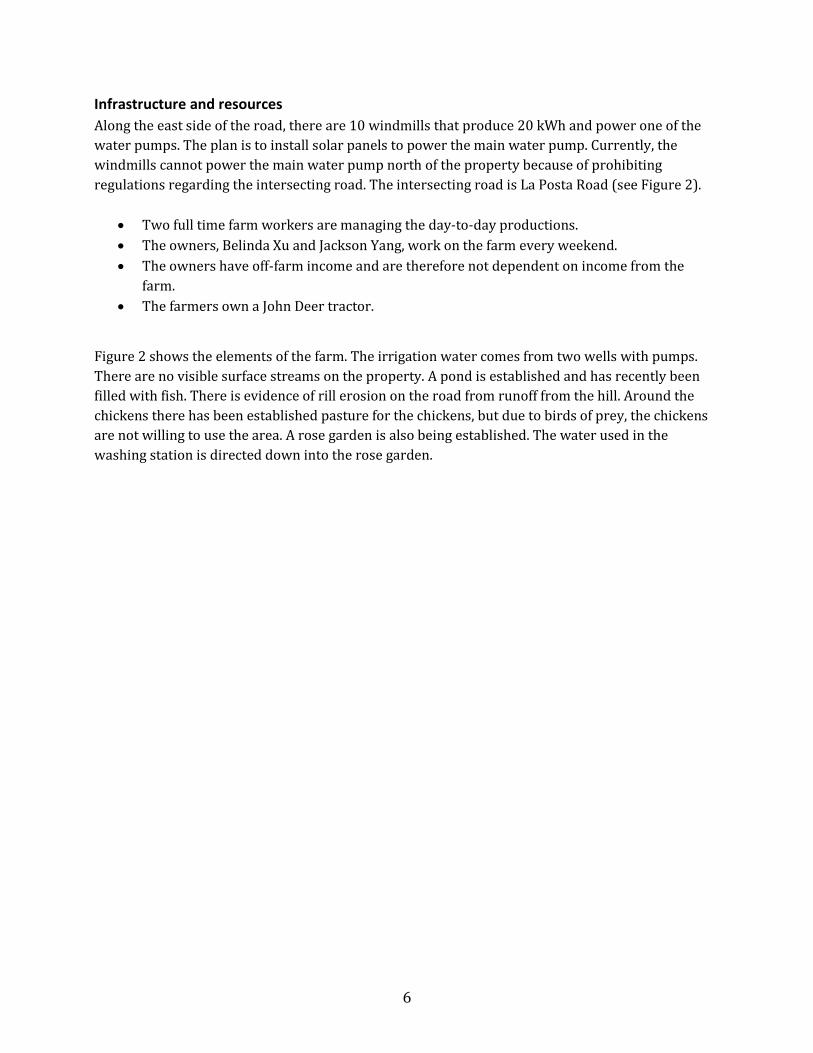
Infrastructure and resources
Along the east side of the road, there are 10 windmills that produce 20 kWh and power one of the
water pumps. The plan is to install solar panels to power the main water pump. Currently, the
windmills cannot power the main water pump north of the property because of prohibiting
regulations regarding the intersecting road. The intersecting road is La Posta Road (see Figure 2).
Two full time farm workers are managing the day-to-day productions.
The owners, Belinda Xu and Jackson Yang, work on the farm every weekend.
The owners have off-farm income and are therefore not dependent on income from the
farm.
The farmers own a John Deer tractor.
Figure 2 shows the elements of the farm. The irrigation water comes from two wells with pumps.
There are no visible surface streams on the property. A pond is established and has recently been
filled with fish. There is evidence of rill erosion on the road from runoff from the hill. Around the
chickens there has been established pasture for the chickens, but due to birds of prey, the chickens
are not willing to use the area. A rose garden is also being established. The water used in the
washing station is directed down into the rose garden.

7
Figure 2, infrastructure elements on Angels Farm
Figure 3 shows the aspect (the cardinal directions) of the slopes on the farm. Lighter colors
represent north-facing slopes and darker colors are south-facing slopes. The black area is flat. The
resolution is not quite detailed enough to give a good representation of such a small area. In the case
of hills being used for production, this is an important feature to map.

8
Figure 3, aspect – cardinal direction of slope

9
Ecological sites
Ecological sites are areas determined by distinct geophysical characteristics, such as soil type, slope,
and the orientation of the slope (aspect). Similar ecological sites are assumed to react similarly to
the same management practice. Large farms may have a mosaic of different and reoccurring
ecological sites. Grouping similar ecological sites thus gives an overview in the planning process.
The farmed area of this property is small compared to the national average, but compared to the
majority of farms in San Diego it is a representative size. The small size makes the planning process
less complex. The farmed area is 18 acres, fairly flat and contains two different soil types. This area
will be treated as one single ecological site though the different soil types will react slightly different
to the different practices.
Soil description
Belinda Xu describes the western part of the field as having “better soil”, meaning that plants grow
better in this area than the soil towards the road to the east. The soil in the eastern part of the field
is described as more sandy. From a geochemical point of view, this description would imply that the
soil in the western part of the field has properties like soil texture, soil structure and organic matter
content that is more beneficial to plant growth.
On the farmed area, there are no signs of erosion. The land is covered from March to December and
is mostly flat. This season, snow peas for chicken feed were planted early February where corn and
peanuts will be planted in May.
In the map below, the dark area extending from the Loamy alluvial land soil type might be a result of
the grassy area from previous management shown in Figure 1A. Table 1 lists the four soil types that
are present on the farm.
Table 1, soil type, slope range, symbol, acres and percent of area
Soil type Percent slope Symbol Acres Percent of area
La Posta loamy course sand 5 – 30 LaE2 2.2 5.5
Loamy alluvial land 0 - 5 Lu 7.3 18.4
Mottsville loamy coarse sand 2 - 9 MvC 20.1 50.3
Tollhouse rocky course sand
loamy
30 - 65 ToG 10.3 25.8
The two soil types, Loamy alluvial land and Mottsville loamy course sand, are mostly flat, the actual
slope is not measures. Only an area of 18 acres is farmed containing the Loamy alluvial land (Lu)
and Mottsville loamy coarse sand (Mvc) soil types.

10
Figure 4, soil types of Angels Farm
La Posta loamy course sand. A small area in the very southeast corner of the property contains
this soil type. The La Posta series exist in mountainous upland and are somewhat excessively
drained due to loamy coarse sand. The color of the A horizon ranges from grayish-brown to very
dark grayish brown. The vegetation consists of chamise, ceanothus, sumac, scrub oak, red shank,

11
and annual grasses. Fertility is low and permeability is rapid. Erosion risk is moderate with
moderate rill and gully erosion. La Posta soils are used for watershed, wild life habitat and to a
smaller degree for range. The water availability is 2 – 3 inches and rooting depth is 25 – 32 inches.
The soil types Kitchen Creek and Tollhouse often occur in the same mapping area. The latter is the
case here (Bowman, 1973).
Loamy alluvial land (Lu). About a third of the farmed area contains this soil type; it is situated in
the northwestern part of the property. This soil type was earlier referred to as “better soil” by the landowners. This land type occurs in mountainous areas and has slopes of 0 to 5 percent. The soil
material is neutral to medium acid. According to soil samples taken on the property, the pH is
neutral.
This soil type consists of very deep, dark brown to black silt loam and sandy loam. These areas were
formerly wet meadows that were drained by head cutting of gullies. The water table was lowered by
gullies that formed drainage ditches. Now the land is seldom saturated except in winter when there
is a risk of overflow. Most of the water-tolerant vegetation has disappeared. The acreage is used
mainly for pasture and range.
Fertility is medium to high. Because of a soil texture with small particle size, the permeability is
moderate. The soil is described not to drain well. The rooting depth is 60 inches with available
moisture from 6 – 9 inches. In many places the underlying material is stratified with lenses of silt
loam to fine sand (Bowman, 1973).
This soil type is classified as prime agricultural land if irrigated and drained. In this case it is
irrigated, but the field is not drained by ditches (USDA NRCS, 2018).
Mottsville loamy coarse sand. About two thirds of the farmed land contains this soil type. This
series consists of excessively drained loamy coarse sand and is very deep. The sandy sediments
have in some places formed from transported granitic rock. The vegetation is mainly California live
oak, sage bushes, buckwheat, and annual grasses. It is mainly used for range (Bowman, 1973). This area corresponds to what the landowners describe as “more sandy soil”.
The upper layer (0 – 17 cm) has a dark grayish color to very dark brown. Very fine roots and fine
pores are situated in this layer. The percentage of fine gravel increases from 10 % to 20 %. The
rooting depth is more than 60 inches, but very few coarser roots occur at that depth. The soil is
slightly acidic. According to soil samples taken on the property, the pH is neutral (USDA NRCS,
2018).
It is often mapped together with Calpine, Bull Trail soils and La Posta soils. The latter is the case
here. Native plants to this soil type are sagebrush, antelope bitterbrush, Anderson's peachbrush, and
needlegrasses.
12
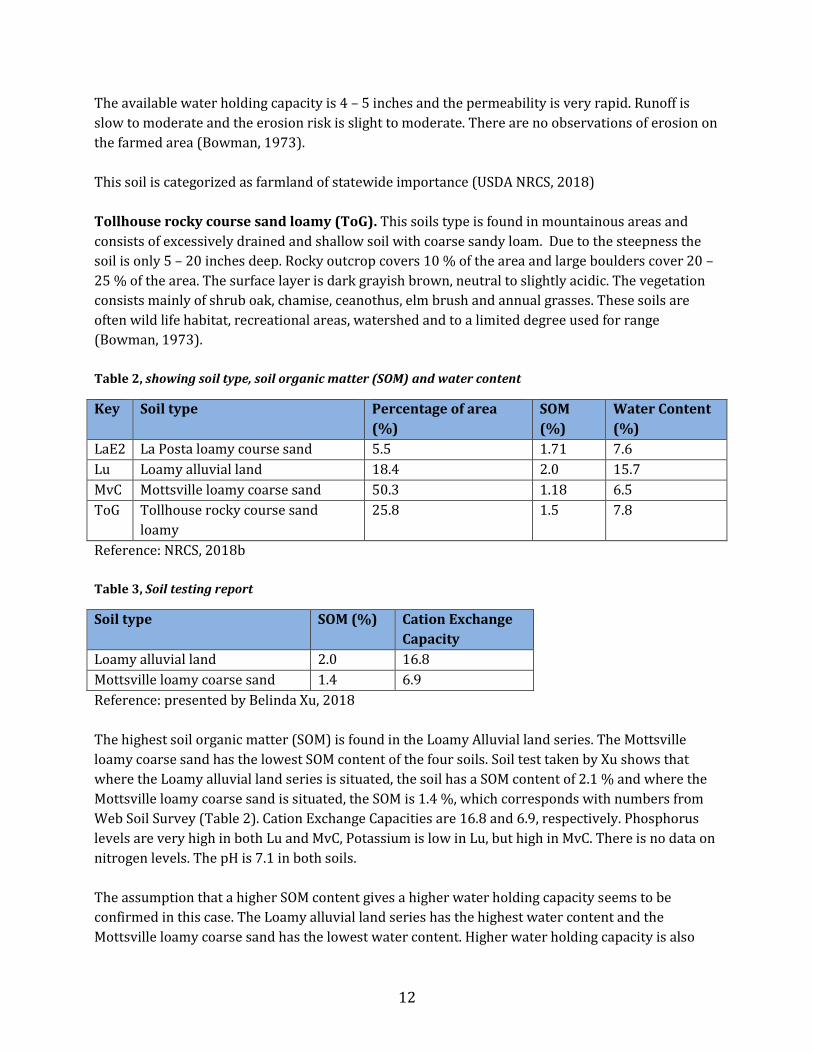
The available water holding capacity is 4 – 5 inches and the permeability is very rapid. Runoff is
slow to moderate and the erosion risk is slight to moderate. There are no observations of erosion on
the farmed area (Bowman, 1973).
This soil is categorized as farmland of statewide importance (USDA NRCS, 2018)
Tollhouse rocky course sand loamy (ToG). This soils type is found in mountainous areas and
consists of excessively drained and shallow soil with coarse sandy loam. Due to the steepness the
soil is only 5 – 20 inches deep. Rocky outcrop covers 10 % of the area and large boulders cover 20 –
25 % of the area. The surface layer is dark grayish brown, neutral to slightly acidic. The vegetation
consists mainly of shrub oak, chamise, ceanothus, elm brush and annual grasses. These soils are
often wild life habitat, recreational areas, watershed and to a limited degree used for range
(Bowman, 1973).
Table 2, showing soil type, soil organic matter (SOM) and water content
Key Soil type Percentage of area
(%)
SOM
(%)
Water Content
(%)
LaE2 La Posta loamy course sand 5.5 1.71 7.6
Lu Loamy alluvial land 18.4 2.0 15.7
MvC Mottsville loamy coarse sand 50.3 1.18 6.5
ToG Tollhouse rocky course sand
loamy
25.8 1.5 7.8
Reference: NRCS, 2018b
Table 3, Soil testing report
Soil type SOM (%) Cation Exchange
Capacity
Loamy alluvial land 2.0 16.8
Mottsville loamy coarse sand 1.4 6.9
Reference: presented by Belinda Xu, 2018
The highest soil organic matter (SOM) is found in the Loamy Alluvial land series. The Mottsville
loamy coarse sand has the lowest SOM content of the four soils. Soil test taken by Xu shows that
where the Loamy alluvial land series is situated, the soil has a SOM content of 2.1 % and where the
Mottsville loamy coarse sand is situated, the SOM is 1.4 %, which corresponds with numbers from
Web Soil Survey (Table 2). Cation Exchange Capacities are 16.8 and 6.9, respectively. Phosphorus
levels are very high in both Lu and MvC, Potassium is low in Lu, but high in MvC. There is no data on
nitrogen levels. The pH is 7.1 in both soils.
The assumption that a higher SOM content gives a higher water holding capacity seems to be
confirmed in this case. The Loamy alluvial land series has the highest water content and the
Mottsville loamy coarse sand has the lowest water content. Higher water holding capacity is also

13
likely due to the smaller particle size of the loam and clay. A contributing factor to a higher SOM in
the Loamy alluvial land series may be the fact that in previous years there was permanent grass for
grazing in the area. Permanent grass is one of the most efficient measures to increase SOM.
Pests and pollinators
Rabbits, ground squirrels and gophers represent the pest problem on the farm. During the planting
season of 2017, rabbits ate all the peanuts.
As the farm has organic certification, no pesticides are used on the property. Ladybugs and frogs are
used as biological pest control. Native bees (i.e. not from a known bee hive) and other pollinators
are observed despite the winds. Insect pests have not been a problem; it is believed that the cold
winter weather creates a low pest pressure.
Water
The primary well is placed on the north side of the property and pumps 160 gallons/min. The
second well is located on the west side of the property and pumps 15 gallons/min. The smaller well
is powered by the wind turbines.
The quality of the irrigation water is good according to the laboratory test that has been performed.
The nitrate levels a slightly high, but beneficial for plant growth. This should be taken into
consideration when fertilizing to avoid over-fertilization.
According to the Web Soil Survey, there is a clear difference between the two soil types when it
comes to possibilities and limitations for irrigation. The MvC series has low SOM, a coarse soil
texture and very limited potential for irrigation due to low water-holding capacity and seepage,
while the Lu series is not limited.
Belinda Xu reports that 10,000 gallons of water was used on the hottest day of 2017. 10,000 gallons
equals 0.37 acre-inches. Evapotranspiration on hottest day is estimated to 0.31 acre-inches
(Anderson, 2018). Leaching of nutrients with irrigation water could potentially be problematic
when watering rates are high and water-holding capacity is low.
Frost has been a problem for the water pipes, making them burst. Rodents have also punctured
water pipes.
Ecology
Wildfire has not been a problem. The neighbor farm burnt recently, so defensible space is
potentially needed.
The oak trees on the property are described as quite large and healthy. There is a rich wildlife in the
area containing foxes, mountain lions, deer, rabbits, birds of prey and coyotes.

14
Current management
Angels Farm is selling their produce to four preschools, one of which Dr. Xu is employed.
Produce
A wide variety of vegetables are grown on 3 acres during the whole growing season (from March to
December). This season snow peas were planted early in February to precede the corn and the
peanuts. In the summer corn and peanuts are grown to source their own feed for the chicken
operation.
Seeds and fertilizer are certified organic. Organic fertilizer from a certified CA organic group is used.
Animals
Approximately 1000 chickens (broilers and egg layers) are being kept on 1 acre of land in 4
structures. A slaughter facility is permitted on the property because they have fewer than 5000.
Currently the manure, feathers and other slaughter waste is not composted but stored in an
uncovered long term stockpiling. Fish were recently added to the pond.
Goals
Angels Farm is looking to increase water efficiency and to provide the main well pump with wind
power or solar. The main goal is not to increase revenue from the production; both owners have off-
farm income and are not dependent on income from the farm. A more efficient and profitable
production is desirable, however. If the farm becomes more profitable and can produce more
produce, they would like to lower the prices and provide fresh and healthy food for more children.
Angels Farm would like to (1) expand the farm enterprise by adding an element of agro-tourism and
education. The owners are interested in teaching children about the cycle of nutrients and the way
food can be produced in a non-industrial way. Adding goats and peacocks as an expansion of the
agro tourism is also of interest. (2) Climate awareness such as carbon farming and other
environmental issues is also a focus of the farming operation. As a beautifying aspect, the owners
would like to (3) expand the rose garden at the base of the slope, on the east side of the road. The
area on the hill (with soil type Tollhouse rocky sandy loam) is not of interest to develop for
production. The area will continue to be a home for the local wildlife and an area of recreation.
In order to accommodate more people visiting the farm, the septic tank would need to be expanded.
There is also a need for frost protection for the irrigation system. The irrigation is also subject to
damage from rodents.
The owners would also like to (5) produce fruit, but have not had success with fruit trees in the past.
This might have been because of the wind or the cold, or a combination of the two. About 200
orange trees died in 2016/17. Peaches and apples have also been attempted, but without success.

15
Potential carbon beneficial practices
The overall function of carbon beneficial practices is the fact that they have the potential to
sequester carbon in the soil and therefore decrease the atmospheric levels of CO2. From a planning
perspective it is important to consider the co-benefits of carbon farming practices to give the farmer
a more thorough understanding of how they can benefit the overall farm and production.
Listed in Table 4 are practices that are considered contributing to lowering the greenhouse gas
(GHG) emissions, followed by a short description and how it affects the soil-, water-, plant-, biota-,
and air resources. Not all practices affect all resources, and are left blank. Some measures will have a
trade-off effect, for example cover crops may compete for moisture and will require watering for
establishment, but will increase soil organic matter with its subsequent positive effects.
The main function of many of these practices is to decrease erosion, but since the farmed land is
close to being completely flat, that is not the focus here. Wind erosion can be a problem, and all
practices that increase soil cover; soil organic matter and soil structure will decrease this risk.

16
Table 4, Co-benefits of carbon beneficial practices. The number in parenthesis in the first column corresponds to the code used by NRCS to
identify a conservation practice.
Practice
(NRCS code) Description
Benefits
Soil Water Plant Biota Air
Compost facility
(317)
The facility will
treat manure and
slaughter waste
into stable
material
The nutrients are
slowly released
and are less
susceptible to
losses from
runoff or
leaching
Composting will
increase CO2
emissions but
will reduce
methane and
N2O emissions.
Reduce odor.
Mulching
(484)
Apply plant
material to land
surface
Reduce erosion
from water and
wind, adds
organic matter
Increase soil
moisture
Mulching
material may
improve
growing
conditions and
may suppress
undesired
species
Increase
biological
activity, and
cover, space and
forage
production for
wildlife
Plant uptake
reduce
atmospheric CO2
from the soil
Nutrient
management (590)
Composted
material with
varying C:N ratio
is applied on land
surface
Increase organic
matter, root
biomass,
improve soil
structure
Increase water
holding capacity
Increase plant
production
Increase
biological
activity
Plant uptake
reduce
atmospheric CO2
Nutrient
management (590)
Replacing
synthetic N
fertilizer with
composted
chicken manure
Increase organic
matter, soil
structure
Excess nutrients
are less soluble,
decreased risk of
leaching
Slow release of
nutrients, more
difficult to time
nutrient
management
Decreased CO2
emission from
manufacturing
and
transportation

17
Conservation cover
(327)
Establish and
maintain
permanent
vegetation cover
Increase soil
cover, organic
matter, root
biomass, buffer
salts, improve
soil structure
Increased water
usage by
permanent
vegetation.
Increased
infiltration
Increase plant
cover slow
noxious plant
growth
Increased quality
and quantity of
vegetation
provides more
food for wildlife
Plant uptake
reduce
atmospheric CO2
Cover crop
(340)
Establish seasonal
plant cover
between main
crops
Increase soil
cover, organic
matter, root
biomass, buffer
salts, improve
soil structure
Cover crop may
compete with
main crop
moisture.
Increased water
usage for
establishing
cover crop;
increase water
holding capacity
over time
Can contribute
to subsequent
crop health and
productivity,
slow noxious
plant growth
Increased quality
and quantity of
vegetation
provides more
food for wildlife
Plant uptake
reduce
atmospheric CO2
Conservation crop
rotation
(328)
Decrease fallow
frequency by
growing crops in a
planned sequence
Increase soil
cover, organic
matter, root
biomass, and
improve soil
structure.
Decrease wind
erosion
Increased water
usage by
permanent
vegetation.
Increased water
uptake and
longer growing
season reduce
risk of nutrient
leaching
Increased plant
growth and
vigor, can
reduce pests
and weeds by
interrupting life
cycle
Increase
biological
activity, and
cover, space and
forage
production for
wildlife and
beneficial insects
Plant uptake
reduce
atmospheric CO2
Firebreak 394 Adding a
permanent or
temporary strip of
Bare soil can
increase wind
erosion
Minimum
reduction in
particulate

18
bare or vegetated
land to retard fire
matter and CO2
emissions due to
decreased fire
incidences
Hedgerow
(422)
Establish a dense
linear design of
herbaceous and
woody plants
Permanent
vegetation
increase organic
matter
Shade and slower
wind speed may
decrease
evaporation
May increase
numbers of
pollinators
depending on
species chosen
May protect
crops from
animal pests
Reduce
atmospheric
CO2, store C in
plants and soils
Residue and Tillage,
no till (329)
Limiting soil
disturbance to
those necessary to
place nutrients,
condition residue
and plant crops
Less oxidation of
organic matter
No-till increases
infiltration and
decreases
evaporation
resulting in more
available water.
Conserving
moisture and
improving soil
conditions
contribute to
enhanced plant
productivity
and health
Crop residue
provides some
food for wildlife
Reduced use of
machinery
reduces CO2
emissions and
increases soil
carbon storage
Reference: Richards and Caires (2017); NRCS (2018a)

19
There are other conservation practices that would be beneficial to the production, and I encourage
the owners of Angels Farm to visit the NRCS website and look through the list of measures and
explore the possibilities to learn about practices that potentially could benefit the farm and
production. Some examples are listed below:
Water harvesting, to utilize rainwater (636)
Irrigation System Micro, for water efficiency (443)
Irrigation water system, for water efficiency and frost protection (449)
High tunnel System, to avoid wind (325)
Fencing, to limit animal pests (382)
Recreational area improvement, to facilitate ideas of agro tourism (562)
See reference list for URL.
Calculations of carbon sequestration
Table 5 shows all practices applicable to Angels Farm that relate to carbon farming. The online tool
COMET–planner, which was used to make these calculations, dictates the combination of practices,
and the way the practices are listed. Positive values indicate carbon sequestration and GHG
emission reduction and negative values indicate loss of carbon or increased emission. All numbers
have the same unit: CO2 equivalents, to be able to compare different GHGs such as methane and
nitrous oxide that have a higher global warming potential than CO2.
All practices (except hedgerows) are applied to the total area of farmable land on the property,
which is set to 18 acres. In a more detailed plan, some practices could be combined on different
areas for practicality. This level of detail is not possible to achieve in the current plan. This table also
serves as an overview for the landowner to see the effect of different practices, combination of
practices and how it effects GHG emissions. Firebreaks are not listed as a carbon beneficial practice
in COMET–farm, and will not be discussed further in this report. However there are practices to
protect against fire that are more carbon beneficial than others as bare ground would be a source of
carbon emission. Shaded fuel break (i.e. avoiding buildup of flammable biomass) can be
implemented to capture additional carbon while also minimizing fine fuels as a risk factor for
fueling wildfires.
The C:N ratio of compost is a measure of the content of carbon to nitrogen. Compost material with
more brown or woody material will have a higher C:N ratio (more carbon) than a compost material
with more easily degradable material.
Hedgerows are applied almost around the entire farmed area, except in the northeastern corner to
not decrease the effect of the windmills. The hedgerow is 3405 feet long and 15 feet broad according
to NRCS conservation practice standard. This gives 1.17 acres of hedgerow. Calculation of hedgerow
acreage is done differently within the California Department of Food and Agriculture (CDFA)
Healthy Soils Incentives Program. 3405 feet of hedgerows is calculated to result in 0.63 acres. This
report follows NRCS conservation practice standards.
20
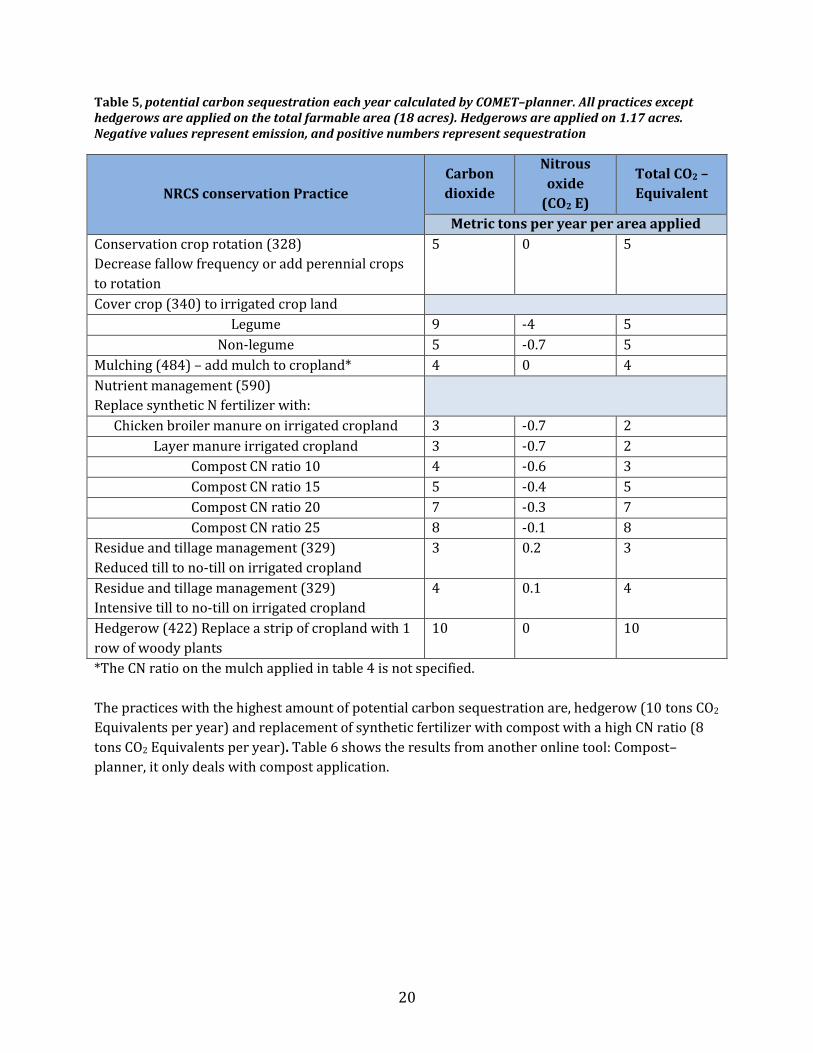
Table 5, potential carbon sequestration each year calculated by COMET–planner. All practices except
hedgerows are applied on the total farmable area (18 acres). Hedgerows are applied on 1.17 acres.
Negative values represent emission, and positive numbers represent sequestration
NRCS conservation Practice
Carbon
dioxide
Nitrous
oxide
(CO2 E)
Total CO2 –
Equivalent
Metric tons per year per area applied
Conservation crop rotation (328)
Decrease fallow frequency or add perennial crops
to rotation
5 0 5
Cover crop (340) to irrigated crop land
Legume 9 -4 5
Non-legume 5 -0.7 5
Mulching (484) – add mulch to cropland* 4 0 4
Nutrient management (590)
Replace synthetic N fertilizer with:
Chicken broiler manure on irrigated cropland 3 -0.7 2
Layer manure irrigated cropland 3 -0.7 2
Compost CN ratio 10 4 -0.6 3
Compost CN ratio 15 5 -0.4 5
Compost CN ratio 20 7 -0.3 7
Compost CN ratio 25 8 -0.1 8
Residue and tillage management (329)
Reduced till to no-till on irrigated cropland
3 0.2 3
Residue and tillage management (329)
Intensive till to no-till on irrigated cropland
4 0.1 4
Hedgerow (422) Replace a strip of cropland with 1
row of woody plants
10 0 10
*The CN ratio on the mulch applied in table 4 is not specified.
The practices with the highest amount of potential carbon sequestration are, hedgerow (10 tons CO2
Equivalents per year) and replacement of synthetic fertilizer with compost with a high CN ratio (8
tons CO2 Equivalents per year). Table 6 shows the results from another online tool: Compost–planner, it only deals with compost application.

21
Table 6, potential carbon sequestration calculated by Compost – planner (2018)
Compost application
practice
Acres
applied
CO2
Nitrous oxide
(tons CO2 E)
Methane
(tons CO2E)
Total tons CO2
Equivalent
Metric tons per year
Compost application to
cropland C:N ratio < 11
18 41 -4 0.1 37
Compost application to
cropland C:N ratio > 11
18 80 -3 0.2 77
An attempt was made to use the online tool COMET–farm (2018). Detailed data from the farm was
entered and scenarios were calculated, but the results were inconclusive. The reasons for this will
be discussed in the next section.
Discussion
Results from COMET–farm are not shown in this report, as they do not give any additional input to
the planning process. The main reason for this is that the scenarios constructed in COMET–farm are
largely inapplicable to small farming systems in California; it seems best suited to commodity-
crop/annual crop-based agriculture (Creque, 2018). Although, the results did lead to the realization
that the previous grass management produces long-term effects when the management is changed
to annual crops. Growing corn several years in a row after perennial grass management would result in net emission of GHG until a new degraded equilibrium is reached. At this point “improved” practices like cover crops and composting would again create reduced amounts of GHG emission
and increased carbon sequestration.
Results shown in table 4 and 5 are not comparable due to how the scenarios are calculated. It is not
clear whether the addition of compost in Compost–planner replaces synthetic fertilizer and it only
divides the compost material into two categories: C:N ratio under or over 11, whereas COMET–planner calculates the use of compost with a wider variety of C:N ratios.
In the opinion of Jeffrey Creque (2018), the Compost–planner tool is not yet reliable because the
underlying modeling is still too unsophisticated. Though it is interesting to see the significant
difference from applying compost with a C:N ratio under or over 11.
The COMET–planner, on the other hand, utilizes relevant and well-established practices, though the
model is conservative and tends to underestimate the carbon benefit of the various practices. The
tool allows calculations of the benefits of a single conservation practices, and the combination of
selected practices to facilitate quantification of GHG benefits in a comprehensive analysis. The
model does not take into account the accumulative GHG benefits of combining several practices in a
broad whole-farm or landscape plan.

22
Challenges of implementation
Cost: equipment, labor, cover crop seeds, hedgerow plants, watering for establishment
of plants and seeds
Sourcing: where to get compost in satisfactory quality
Know-how/advisory service: how to choose the optimal and most suitable species for
cover crops and hedgerow.
Practicality: how can the compost be spread? Are there appliances to hitch a John Deer?
Where can farmers find machinery for no-till seed drilling?
The practical implementation of the practices and the final choice of practices will be further
discussed with the farmer.
Cost is a significant inhibitor for farmers to implement conservation practices. Labor is related to
cost and is also a challenge. Sourcing of material, equipment and choice of species are issues related
to available advisory service in San Diego County.
An important distinction must be made between chicken manure that has been composted or
chicken manure that is applied to land untreated. Table 4 contains untreated chicken manure as a
replacement of synthetic fertilizer. Treated (i.e. composted) manure is preferable as it reduces
overall GHG emissions. If funding for composting is to come from CDFA Healthy Soils Program, it
dictates that compost must come from a certified facility, thus on-farm compost cannot be utilized.
Furthermore if cover crops are already established, it voids the possibility for CDFA grant for this
practice. In this case snow peas was established this January/February 2018, the question is
whether this crop will be harvested at maturity or plowed down at flowering. In case it is harvested
for peas it should not be defined as a cover crop. Belinda Xu reports that if the crop succeeds, the
peas will be harvested for chicken feed.
Recommendations
The following recommendations are based on choosing the practices that have the highest amount
of potential carbon sequestration in combination with the owner’s goals and how the practices can benefits the production. A professional evaluation of the land by the authors of this report, with
input from Jeffrey Creque (Carbon Cycle Institute) and Lance Anderson (Mission Resource
Conservation District) has also contributed to these recommendations.
This relatively newly established farm has a lot of potential and there are several opportunities to
expand the enterprise. The farm has not utilized the whole area of farmable land and there are many
opportunities to increase soil fertility and water efficiency. Landscape elements also facilitate
possibilities to expand the farm enterprise with elements of agro-tourism.
Figure 7 shows an overview of the recommended practices. A combination of compost application, a
legume cover crop and hedgerow is chosen as three complimentary practices. The hedgerow will
23
slow down wind speed; cover crops and compost will increase the input of organic matter and
prevent wind erosion. Decreased wind speed will decrease evaporation of irrigation water and
increased soil organic matter will keep the water longer in the root zone. This is especially
important in the sandy soil (on the MvC soil type). An additional co-benefit of hedgerows is
increased pollinators if the appropriate species are chosen.
No-till is not chosen as a practice both because it has a lower carbon sequestration potential than
other measures, but also because it would require specialty equipment like a no-till seed drill.
Though specialty equipment is also necessary to spread compost on a larger area, reasonably priced
attachments for tractors are available.
Compost application and a high N-fixing capacity legume that is not harvested, but is incorporated
at blooming can reduce or eliminate the need for synthetic fertilizer.
Compost with the highest C:N ratio is not chosen because of a slow release of nutrients compared to
materials with a lower C:N ratio. The release of nutrients from compost can be difficult to time to
plant requirements. A C:N ratio of 25 increases the risk of nitrogen immobilization: the mechanism
of microorganisms competing with plant available nitrogen in order to break down long chains of
carbon molecules in the compost (Brady & Wail, 2010).
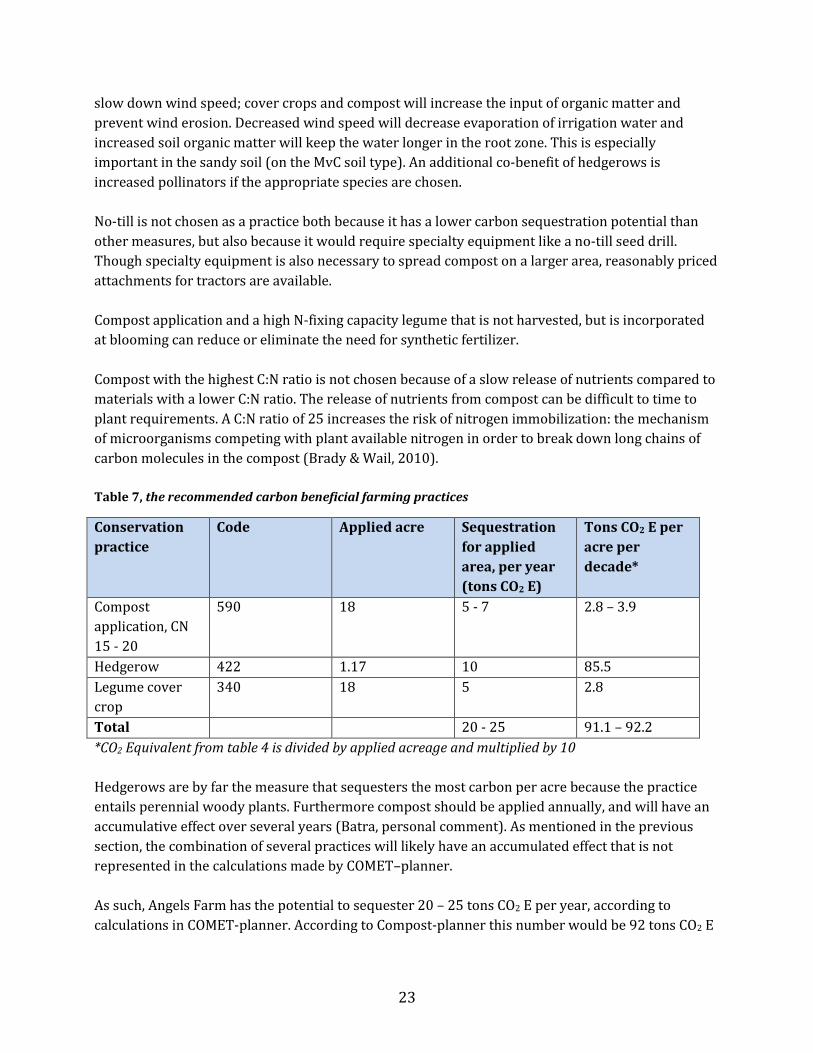
Table 7, the recommended carbon beneficial farming practices
Conservation
practice
Code Applied acre Sequestration
for applied
area, per year
(tons CO2 E)
Tons CO2 E per
acre per
decade*
Compost
application, CN
15 - 20
590 18 5 - 7 2.8 – 3.9
Hedgerow 422 1.17 10 85.5
Legume cover
crop
340 18 5 2.8
Total 20 - 25 91.1 – 92.2
*CO2 Equivalent from table 4 is divided by applied acreage and multiplied by 10
Hedgerows are by far the measure that sequesters the most carbon per acre because the practice
entails perennial woody plants. Furthermore compost should be applied annually, and will have an
accumulative effect over several years (Batra, personal comment). As mentioned in the previous
section, the combination of several practices will likely have an accumulated effect that is not
represented in the calculations made by COMET–planner.
As such, Angels Farm has the potential to sequester 20 – 25 tons CO2 E per year, according to
calculations in COMET-planner. According to Compost-planner this number would be 92 tons CO2 E

24
per year. Over ten years the 18 acres of the farm has the potential to sequester 200 – 250 CO2 E, or
91.1 – 92.2 CO2 per acre per decade.
Additional recommendations for management changes include relocating the vegetable field from
the coarse sandy soil (MvC soil type) in the eastern part of the field to the more loamy soil (Lu soil
type) in the west. It is evaluated that the sandy soil has a very rapid infiltration rate that contributes
to an excess need of watering. The loamy soil has a slower infiltration rate that will keep the water
longer in the root zone of the plant.
Also shown in Figure 4 is the location of a composting facility. Chicken manure and slaughter waste
can be composted, a great resource, and is much better utilized on the farm than going to waste.
According to one method, it requires a cheap and plentiful source of wood chips or other carbon
source to layer or mix in approximately equal quantities with the high nitrogen manure and
slaughter waste. If moisture is maintained, compost can be produced in about 3 months if piles are
turned, or 6 months if managed as static piles. To conform with National Organic program standards
for composting of manure, temperatures must be maintained at or above 131˚F for at least 15 days,
with a minimum of 5 turnings during this pathogen reduction phase. Daily temperature records
must be kept during this period as well. If turning is not desired or not possible, a static pile process
can be used. However, the finished compost should be treated as manure under the Organic
Standard, and applied at least 120 days prior to harvest. Alternatively, it can be applied to non-food
crops (e.g. cover crops) (Creque, 2018). If a 6 month static pile system is chosen, the process is not
very labor intensive, but because the process is slow, it is necessary to expand the facility when new
static piles needs to be added.
On site composting of farm waste is highly recommended from both a carbon sequestration
perspective and a resource conservation perspective. This practice may be implemented on a longer
timeline if funding from CDFA Healthy Soils Program is pursued because of the before mentioned
restrictions (see top of page 19). The funding period for CDFA Healthy Soils Program is three years,
so these three years might be a good timeline for implementing the on-farm utilization of chicken
manure and slaughter waste with funding and technical assistance from NRCS (practice code 317).
In this way, compost application practice can continuo after the CDFA funding period has ended
using an on-farm resource.

25
Figure 4, Suggested carbon farming practices and other beneficial practices

26
Funding opportunities The challenge of advisory service, sourcing material, equipment and costs all relate to the
possibilities and obstacle of applying for funding.
The following are funding opportunities that may be further investigated:
CDFA Healthy Soils Program Incentives Program: ”Provides financial incentives to California
growers and ranchers to implement conservation management practices that sequester
carbon, reduce atmospheric greenhouse gases (GHGs), and improve soil health”. https://www.cdfa.ca.gov/oefi/healthysoils/IncentivesProgram.html
NRCS Environmental Quality Incentives Program (EQIP): “Provides financial and technical
assistance to agricultural producers in order to address natural resource concerns and deliver
environmental benefits such as improved water and air quality conserve ground and surface
water, reduce soil erosion and sedimentation or improve or create wild life habitat”.
https://www.nrcs.usda.gov/wps/portal/nrcs/main/national/programs/financial/eqip/
Future planning and recordkeeping
It is our hope that this document will be useful in many aspects of the future planning of the farming
enterprise.
Recordkeeping is always a useful tool to keep track of development and results of changed practices.
Because the implementation of carbon farming planning is in its infancy in San Diego County, it
would also be helpful for the RCD to gather information from one of the first Carbon Farming Plan
implemented in San Diego County.
Implementation of the chosen practices, operation and maintenance of selected management
practices depends on available funding.

27
Implementation plan Table 8, Carbon Beneficial Practices Implementation Record, see Figure 4
Conservation
Practices
Co2 E Benefit Associated Co-Benefits Date Funding
Source
NRCS
Conservation Practice
Standard & Code
Calculated
Using:
COMET-
Planner
So
il
He
alt
h
Wa
ter
Qu
ali
ty
Wa
ter
Qu
an
tity
Wil
dli
fe
En
ha
nce
me
nt
Pla
nt
Co
mm
un
ity
Air
Qu
ali
ty
Pro
du
cer
Eco
no
mic
s
Planned, Implemented,
Completed
Legume cover crop
(340) 5 x x x x x
Completed 2018
Established August – December
2018 depending on crop rotation
USDA
Compost application
(590) 5 – 7 x x x x x
Completed August 2018 – March
2019 depending on crop rotation
USDA
Hedgerow (422)
10 x x x x x x
Completed 2019
Beginning preparations August
2018
USDA
Composting facility
(317) x x
Completed 2022
Planning preparations January
2020
NRCS
Change location of
vegetable field x x x
Completed 2019 Angels
Farm

28
Table 8 shows the implementation plan for Angels Farm. It also suggests what the associated
benefits of the measures are. The co-benefits for a variety of practices are listed in Table 4. Specific
associated benefits of the selected practices are elaborated below.
Compost application: Increased biomass input and SOM improves soil structure, it makes the soil more resilient to
soil compaction and soil erosion. Improved soil structure and SOM content increases water-
holding capacity, which reduces the risk of nutrients leaching into ground water. Decreased
need for irrigation water would benefit the overall water quantity and availability. Wildlife
benefits from increased above ground biomass and increases in the macro and
microorganism diversity. Quality and quantity of plant growth also benefits from compost
application. Decomposing compost delivers nutrients for growing plants and decreases the
need for synthetic fertilizer. Decreased water bill would be at great economic benefit for the
producer, though implementation will be an initial expense to the farmer.
Legume cover crop: A cover crop has many of the same benefits as compost application as it increases SOM and
above ground biomass. A legume cover crop also inputs nitrogen to the soil, which decreases
the need synthetic fertilizer. Quality and quantity of plant growth benefits from legume
cover crops. Implementation will be an initial expense to the farmer.
Hedgerow: A hedgerow equally has many of the same benefits as compost application as it increases
SOM and above ground biomass. Its main function however is to create a wind brake that
decreases evaporation of soil moisture and wind erosion as a result of decreased wind
speed. A hedgerow with flowering species will benefit the quality and quantity of plant
growth. Air quality will be benefited by decreased dust created by wind soil erosion.
Increased soil cover will also alleviate this by the above-mentioned practices.
Implementation will also be an initial expense to the farmer, but it will contribute to saving
water use.
Compost facility: Composting manure and slaughter waste will decrease smell and thus improve air quality.
Implementation will be an initial expense to the farmer, but will alleviate the need to buy off-
farm compost and decrease the need for synthetic fertilizer.
Changing the location of the vegetable field By moving the vegetable field to the more optimal soil type, the yield and water use
efficiency will increase. This will have a positive effect on the producer economy.
Common for all these practices is that they reduce both the production of GHGs and decrease the
atmospheric levels of GHGs by storing it in biomass. These practices thereby participate in climate
change mitigation.

29
Operation and maintenance of selected management practices
Planning and implementation of the selected practices rely on the crops and farm practices already
adopted by the farm.
Compost application and cover crop implementation:
Certified organic compost will be purchased and an attachment for the tractor will be
acquired to spread the compost. Compost application on the corn and peanut fields will
either be applied after harvest, before the cover crop is being planted, or in the spring after
the cover crop is being incorporated. Establishing the cover crop in early fall will require
more watering, and will require a species mix with a long growing season that will not go to
seed.
In the vegetable field, the cover crop will be established in the winter after the last
vegetables are harvested. The cover crop on this field will have a much shorter growing
season and species will be chosen accordingly. The same principal for the compost
application applies as mentioned in the previous paragraph.
Cover crops and compost application maintenance:
Compost (5 dry tons per acre) will be applied every year and a legume cover crop will be
planted every year. The species mix might change according to feasibility.
Hedgerow implementation:
An assessment of weed pressure in the areas where the hedgerow will be established will be
made as soon as possible. If the weed pressure is high, then appropriate measures will be
taken to address this issue. The level of weed pressure and measures needed will determine
when the hedgerow is to be planted. Native perennial and annual forbs, flowering bushes
and trees will be chosen. There will be put in a watering system for the period needed to
establish the hedgerow.
Hedgerow maintenance:
The progress of the hedgerow will be closely monitored. Weeds will be managed according
to the strategy chosen. Mulch could be necessary if spraying is not an option. Dead plants
will be replaced as necessary.
30
Contact information
Martina Skjellerudsveen
E-mail [email protected]
Resource Conservation District of Greater San Diego
11769 Waterhill Road, Lakeside, CA 92040
Tel 619-562-96
E-mail [email protected]
Web rcdsandiego.org
Belinda Xu
E-mail [email protected]
References
Anderson, L., 2018, e-mail correspondence, March 20, [email protected], Agricultural Program
Director at Mission Resource Conservation District.
Bowman, R. H., 1973, Soil Survey, San Diego Area, California (Vol. 1). United States, Soil Conservation
Service.
Brady, N. C., & Weil, R. R., 2010, Elements of the nature and properties of soils (No. 631.4 B733E.).
Upper Saddle River, NJ: Pearson Educational International.
California Water Board, 2018. Accessed March 1, <https://www.waterboards.ca.gov/sandiego/>
Creque, J., 2018, e-mail correspondence, March 16, [email protected], Director of the Carbon
Cycle Institute.
Compost-planner (2018). Accessed March 12, <compost-planner.com>
Environmental Protection Agency, 2018 Surf your watershed. Accessed March 1,
<https://cfpub.epa.gov/surf/huc.cfm?huc_code=18070305>
Google, 2018, Google maps. 3131 La Posta road, Campo, California.
Richards, C., Caires, K., 2017, Carbon Farming Plan, Resource Conservation District of Greater San
Diego County.
Natural Resources Conservation Service (NRCS), 2018b, Conservation practices, United States
Department of Agriculture. Accessed March 9,

31
<https://www.nrcs.usda.gov/wps/portal/nrcs/detail/national/technical/cp/ncps/?cid=nrcs143_0
26849>
NRCS, 2018b, Web Soil Survey. Accessed February 24,
<https://websoilsurvey.sc.egov.usda.gov/App/WebSoilSurvey.aspx>
US Climate data, 2018, Accessed on March 10,
<https://www.usclimatedata.com/climate/campo/california/united-states/usca0167>
USDA NRCS, 2018. COMET-planner2, Accessed March 15, <http://www.comet-planner2.com>
USDA NRCS, 2018. COMET-farm, Accessed March 17, < http://cometfarm.nrel.colostate.edu>
Recommended