CARBON DISCLOSURE, CARBON
PERFORMANCE AND FINANCIAL
PERFORMANCE: INTERNATIONAL EVIDENCE
A thesis submitted by
Md Abubakar Siddique
Master of Accounting
For the award of
Doctor of Philosophy
2018
ii
ABSTRACT
This study examines the relationships and interrelationships between carbon
disclosure and carbon performance, and between carbon performance and financial
performance. It also examines the relationship between carbon disclosure and financial
performance. Additionally, it investigates the relationship between agency cost and
carbon disclosure, and between agency cost and carbon performance. Finally, this
research investigates the trends in improvement of carbon disclosure and carbon
performance of the companies, over the study period. The interrelationships between
carbon disclosure and carbon performance, and between carbon performance and
financial performance, have not been investigated by any study before. Similarly, no
study has yet investigated the relationship between carbon disclosure and financial
performance. The relationships between carbon disclosure/carbon performance and
agency cost, have not been studied either by any previous research. Whilst a couple of
studies have conducted trend analysis of carbon disclosure previously, no study has yet
undertaken trend analysis of carbon performance. These examinations are performed by
using a cross-sectional sample of the world’s largest 500 firms, drawn from most major
industry sectors, who participated in the Carbon Disclosure Project (CDP) questionnaire
survey over the five-year period from 2011 to 2015. Both full sample and country-wise
analysis have been done, to test the hypotheses of this study.
Carbon disclosure and carbon performance scores for the sample companies are
taken from the CDP database. Data for financial performance indicators, agency costs
and relevant control variables, are collected from Thomson Reuters Datastream
database.

iii
Findings of this study indicate that there is a significant positive relationship
between a firm’s carbon disclosure, and its carbon performance. They also indicate that
carbon disclosure and carbon performance of business, influence each other positively.
Country-wise analysis shows that carbon disclosure is significantly positively related to
carbon performance in all of the four regions of this study - namely North America,
EU, UK and Asia-Pacific. Both way positive interrelationship between carbon
disclosure and carbon performance, holds true in all regions except the UK.
The study also finds that carbon performance of a business is significantly negatively
related to both accounting-based measure as well as market-based measure of a firm’s
financial performance. It also finds that there is no significant interrelationship between
carbon performance and accounting-based measure of a firm’s financial performance.
However, carbon performance and market-based measure of a firm’s financial
performance, influence each other negatively - this relationship might vary across
industries. Carbon performance is negatively related to both accounting-based measure
as well as market-based measure of a firm’s financial performance, in all regions except
the UK. There is no significant and consistent interrelationship between carbon
performance and any of the measures of firm financial performance, in any region.
Results of this study indicate that there is a significant negative relationship
between carbon disclosure and accounting-based measure of a firm’s financial
performance. However, there is no significant and consistent relationship between
carbon disclosure and a firm’s market-based financial performance. There is a
significant negative relationship between carbon disclosure and accounting-based
measure of a firm’s financial performance, in all regions. However, there is no

iv
significant relationship between carbon disclosure and market-based measure of a firm’s
financial performance in any region.
This study also finds out that there is a positive but insignificant relationship
between carbon disclosure and agency cost, both when agency cost is measured by
Expense Ratio or by Asset Utilization Ratio. Results also indicate that carbon
performance does not significantly affect a firm’s agency cost when agency cost is
measured by Expense Ratio. However, when agency cost is measured by Asset
Utilization Ratio, there is a significant negative relationship between carbon
performance and agency cost. Carbon disclosure and carbon performance both
significantly positively affect agency cost in North America, however there is no
significant and consistent relationship between agency cost and both carbon disclosure
and carbon performance, in any other region.
Results of this study show that the level of carbon disclosure for the sample
companies, have significantly and consistently improved during the study period. On the
other hand, carbon performance did not significantly improve towards the beginning of
the study period. It started improving later, but these improvements were not always
consistent. Country-wise analysis shows similar patterns in all regions.
This study contributes to the literature that deals with the relationships and
interrelationships between carbon disclosure, carbon performance and financial
performance, by producing a number of novel findings that suggest there is a positive
interrelationship between carbon disclosure and carbon performance; carbon
performance and market-based measure of financial performance influence each other
negatively; carbon disclosure and accounting-based measure of financial performance
are negatively related and carbon performance negatively affects agency cost.

v
CERTIFICATION OF THESIS
This Thesis is entirely the work of Md Abubakar Siddique except where otherwise
acknowledged. The work is original and has not previously been submitted for any other
award, except where acknowledged.
Principal Supervisor: Dr. Afzalur Rashid
Associate Supervisor: Dr. Md. Akhtaruzzaman

vi
ACKNOWLEDGEMENTS
I am greatly indebted to my principal supervisor, Dr. Afzalur Rashid, for his
relentless support and guidance. It would not have been possible to accomplish this task
without his extraordinary support. I would also like to express my sincere gratitude to
my associate supervisors, Professor Julie Cotter and Dr. Md. Akhtaruzzaman, for their
valuable contribution in this study. I am thankful to the School of Commerce, Faculty of
Business, Education, Law & Arts, at University of Southern Queensland, for giving me
the opportunity to undertake this study. I am also thankful to my current workplace,
United Arab Emirates University, for their support.
I am sincerely grateful to my wife and my two children, for the sacrifices they
made to allow me to continue this study. My gratitude also goes to other members of my
family, for their support and prayers for my success. I would like to dedicate this work
to my late father and father-in-law, who would have been very happy if they were still
alive today.

vii
TABLE OF CONTENTS
ABSTRACT ...................................................................................................................... ii
CERTIFICATION OF THESIS ......................................................................................... v
ACKNOWLEDGEMENTS .............................................................................................. vi
LIST OF FIGURES ........................................................................................................ xii
LIST OF TABLES ......................................................................................................... xiii
CHAPTER 1 INTRODUCTION ....................................................................................... 1
1.1 Background .............................................................................................................. 1
1.2 Motivation of this study ........................................................................................... 4
1.3 Research objectives .................................................................................................. 7
1.4 Contribution of this study ....................................................................................... 10
1.5 Structure of the thesis ............................................................................................. 11
1.6 Chapter summary ................................................................................................... 13
CHAPTER 2 CARBON DISCLOSURE REPORTING FRAMEWORKS .................... 14
2.1 Introduction ............................................................................................................ 14
2.2 Global carbon disclosure reporting frameworks .................................................... 15
2.2.1 Global Reporting Initiatives (GRI) .................................................................. 16
2.2.2 Climate Change Reporting Framework (CCRF) ............................................. 17
2.3 Regional/country-wise carbon disclosure reporting frameworks ........................... 24
2.3.1 North America ................................................................................................. 24
2.3.2 European Union ............................................................................................... 27
2.3.3 The United Kingdom ....................................................................................... 28
2.3.4 Asia-Pacific ...................................................................................................... 29
2.4 Chapter summary ................................................................................................... 32
CHAPTER 3 THEORETICAL BACKGROUND ........................................................... 34
3.1 Introduction ............................................................................................................ 34
3.2 Legitimacy Theory ................................................................................................. 35
3.3 Stakeholder Theory ................................................................................................ 37
3.4 Voluntary Disclosure Theory ................................................................................. 40
viii
3.5 Signalling Theory ................................................................................................... 41
3.6 Proprietary Costs Theory ........................................................................................ 43
3.7 Instrumental Stakeholder Theory ........................................................................... 44
3.8 Agency Theory ....................................................................................................... 45
3.9 Chapter summary ................................................................................................... 48
CHAPTER 4 LITERATURE REVIEW .......................................................................... 49
4.1 Introduction ............................................................................................................ 49
4.2 Relationship between environmental disclosure/carbon disclosure and
environmental performance/carbon performance......................................................... 50
4.2.1 Relationship between environmental disclosure and environmental
performance .............................................................................................................. 50
4.2.2 Relationship between carbon disclosure and carbon performance .................. 55
4.2.3 Summary of previous studies dealing with the relationship between
environmental disclosure/carbon disclosure and environmental performance /carbon
performance .............................................................................................................. 59
4.3 Relationship between environmental performance/carbon performance and
financial performance ................................................................................................... 60
4.3.1 Relationship between environmental performance and financial performance
.................................................................................................................................. 60
4.3.2 Relationship between carbon performance and financial performance ........... 66
4.3.3 Summary of previous studies dealing with the relationship between
environmental performance/carbon performance and financial performance .......... 71
4.4 Interrelationship between carbon performance and financial performance ........... 73
4.5 Relationship between carbon disclosure and financial performance ..................... 74
4.6 Relationship between carbon disclosure/carbon performance and agency cost ..... 75
4.7 Trends in the improvement of carbon disclosure and carbon performance ........... 76
4.7.1 Summary of previous studies dealing with trends in improvement of carbon
disclosure and carbon performance .......................................................................... 79
4.8 Chapter summary ................................................................................................... 80
CHAPTER 5 HYPOTHESIS DEVELOPMENT............................................................. 81
5.1 Introduction ............................................................................................................ 81
5.2 Relationship between carbon disclosure and carbon performance ........................ 81
5.3 Interrelationship between carbon disclosure and carbon performance .................. 83

ix
5.4 Disclosure practices of average carbon performers................................................ 85
5.5 Relationship between carbon performance and financial performance ................. 86
5.6 Interrelationship between carbon performance and financial performance ........... 88
5.7 Relationship between carbon disclosure and financial performance ..................... 90
5.8 Relationship between carbon disclosure and agency cost ...................................... 92
5.9 Relationship between carbon performance and agency cost .................................. 92
5.10 Trends in improvement of carbon disclosure and carbon performance over time
...................................................................................................................................... 94
5.11 Chapter summary ................................................................................................. 94
CHPATER 6 RESEARCH METHOD ............................................................................ 96
6.1 Introduction ............................................................................................................ 96
6.2 Sample period ......................................................................................................... 96
6.3 Sample selection ..................................................................................................... 97
6.4 Measurement of dependent and independent variables ........................................ 101
6.4.1 Measurement of CDP carbon disclosure scores ............................................ 102
6.4.2 Measurement of CDP carbon performance score .......................................... 103
6.4.3 Measurement of Financial performance ........................................................ 105
6.4.4 Measurement of agency cost.......................................................................... 106
6.5 Selection and measurement of control variables .................................................. 107
6.6 Models used in this study ..................................................................................... 112
6.7 Chapter Summary ................................................................................................. 118
CHAPTER 7 DATA ANALYSIS, RESULTS AND INTERPRETATION .................. 119
7.1 Introduction .......................................................................................................... 119
7.2 Descriptive statistics ............................................................................................. 120
7.2.1 Descriptive statistics for dependent, independent and control variables ....... 120
7.2.2 Country-wise descriptive statistics for major variables ................................. 122
7.3 Diagnostic tests ..................................................................................................... 126
7.3.1 Normality Test ............................................................................................... 126
7.3.2 Multicollinearity test ...................................................................................... 126
7.3.3 Heteroscedasticity test ................................................................................... 127

x
7.4 Empirical results for the relationship and interrelationship between carbon
disclosure and carbon performance ............................................................................ 128
7.4.1 Regression results for the relationship between carbon disclosure and carbon
performance for H1 and H2 .................................................................................... 128
7.4.2 Regression results for the interrelationship between carbon disclosure and
carbon performance for H3 ..................................................................................... 132
7.4.3 Country-wise analysis for the relationship between carbon disclosure and
carbon performance ................................................................................................ 138
7.4.4 Empirical results for disclosure practices of average carbon performers for H4
................................................................................................................................ 140
7.5 Empirical results for the relationship and interrelationship between carbon
performance and financial performance ..................................................................... 143
7.5.1 Regression results for the relationship between carbon performance and
financial performance for H5 .................................................................................. 143
7.5.2 Country-wise regression results for the relationship between carbon
performance and financial performance ................................................................. 145
7.5.3 Regression results for the interrelationship between financial performance
(measured by ROA) and carbon performance for H6 ............................................. 150
7.5.4 Regression results for the interrelationship between financial performance
(measured by Tobin’s Q) and carbon performance for H6 ..................................... 154
7.5.5 Country-wise regression results for the interrelationship between carbon
performance and financial performance ................................................................. 157
7.6 Empirical results for the relationship between carbon disclosure and financial
performance ................................................................................................................ 159
7.6.1 Regression results for the relationship between carbon disclosure and financial
performance for H7 ................................................................................................. 159
7.6.2 Country-wise regression results for the relationship between carbon disclosure
and financial performance ...................................................................................... 160
7.7 Empirical results for the relationship of agency cost with carbon disclosure and
carbon performance .................................................................................................... 164
7.7.1 Regression results for the relationship between carbon disclosure and agency
cost for H8 .............................................................................................................. 164
7.7.2 Regression results for the relationship between carbon performance and
agency cost for H9 .................................................................................................. 168

xi
7.7.3 Country-wise regression results for the relationship of agency cost with carbon
disclosure and carbon performance ........................................................................ 172
7.8 Empirical results for the trends in improvement of carbon disclosure and carbon
performance ................................................................................................................ 173
7.8.1 Regression results for the trends in improvement of carbon disclosure and
carbon performance for H10 ................................................................................... 173
7.8.2 Country-wise trend analysis for improvement of carbon disclosure and carbon
performance ............................................................................................................ 174
7.9 Chapter summary ................................................................................................. 178
CHAPTER 8 CONCLUSIONS AND IMPLICATIONS ............................................... 182
8.1 Introduction .......................................................................................................... 182
8.2 Conclusions about research objectives ................................................................. 182
8.2.1 Relationship and interrelationship between carbon disclosure and carbon
performance ............................................................................................................ 183
8.2.2. Relationship and interrelationship between carbon performance and financial
performance ............................................................................................................ 184
8.2.3 Relationship between carbon disclosure and financial performance ............. 186
8.2.4 Relationship of agency cost with carbon disclosure and carbon performance
................................................................................................................................ 187
8.2.5 Trends in improvement of carbon disclosure and carbon performance over
time ......................................................................................................................... 187
8.3 Implications of this study ..................................................................................... 188
8.3.1 Implications for literature .............................................................................. 188
8.3.2 Implications for policy and practice .............................................................. 191
8.4 Research limitations ............................................................................................. 193
8.5 Suggestions for future research ............................................................................ 193
REFERENCES ............................................................................................................... 195

xii
LIST OF FIGURES
Figure 5.1 Interrelationship between carbon disclosure and carbon performance……...84
Figure 5.2 Interrelationship between carbon performance and financial performance…89
Figure 5.3 Relationship between carbon disclosure and financial performance………..91
Figure 5.4 Relationship between carbon performance and agency cost………………..93
Figure 6.1 Sector-wise distribution of sample firms........................................................99

xiii
LIST OF TABLES
Table 6.1 Distribution of sample firms by sector ............................................................. 99
Table 6.2 Distribution of sample firms by regions ........................................................ 100
Table 7.1 Descriptive statistics for dependent, independent and control variables ....... 121
Table 7.2 Country-wise descriptive statistics for major variables ................................. 123
Table 7.3 Regression results for the relationship between carbon disclosure and carbon
performance.................................................................................................................... 131
Table 7.4 Regression results for the relationship between previous year’s carbon
disclosure and current year’s carbon performance ......................................................... 136
Table 7.5 Regression results for the relationship between previous year’s carbon
performance and current year’s carbon disclosure......................................................... 137
Table 7.6 Country-wise regression results for the relationship and interrelationship
between carbon disclosure and carbon performance ..................................................... 139
Table 7.7 Regression results for the relationship between carbon performance and
financial performance measured by ROA ...................................................................... 147
Table 7.8 Regression results for the relationship between carbon performance and
financial performance measured by Tobin’s Q .............................................................. 148
Table 7.9 Country-wise regression results for the relationship between carbon
performance and financial performance......................................................................... 149
Table 7.10 Regression results for the relationship between financial performance
measured by ROA of current year and carbon performance of previous year ............... 152
Table 7.11 Regression results for the relationship between financial performance
measured by ROA of previous year and carbon performance of current year ............... 153
Table 7.12 Regression results for the relationship between financial performance
measured by Tobin’s Q of current year and carbon performance of previous year ....... 155

xiv
Table 7.13 Regression results for the relationship between financial performances
measured by Tobin’s Q of previous year and carbon performance of current year ....... 156
Table 7.14 Country-wise regression results for the interrelationship between carbon
performance and financial performance......................................................................... 158
Table 7.15 Regression results for the relationship between carbon disclosure and
financial performance measured by ROA ...................................................................... 161
Table 7.16 Regression results for the relationship between carbon disclosure and
financial performance measured by Tobin’s Q .............................................................. 162
Table 7.17 Country-wise regression results for the relationship between carbon
disclosure and financial performance............................................................................. 163
Table 7.18 Regression results for the relationship between carbon disclosure and agency
cost measured by ER ...................................................................................................... 166
Table 7.19 Regression results for the relationship between carbon disclosure and agency
cost measured by AUR................................................................................................... 167
Table 7.20 Regression results for the relationship between carbon performance and
agency cost measured by ER.......................................................................................... 169
Table 7.21 Regression results for the relationship between carbon performance and
agency cost measured by AUR ...................................................................................... 170
Table 7.22 Country-wise regression results for the relationship of agency cost with
carbon disclosure and carbon performance .................................................................... 171
Table 7.23 Regression results for improvement of carbon disclosure from year 1 to 5 175
Table 7.24 Regression results for improvement of carbon performance year 1 to 5 ..... 176
Table 7.25 Country-wise trend analysis for improvement of carbon disclosure and
carbon performance ........................................................................................................ 177

1
CHAPTER 1 INTRODUCTION
1.1 Background
Greenhouse gas (GHG) emission has become one of the primary threats for the
existence of life on earth. The excessive concentration of GHG in earth’s atmosphere,
causes adverse consequences in natural ecosystems and humankind, creating the
phenomenon of global warming or climate change (United Nations, 1992; Liu et al.,
2015; Stern, 2006). Companies have always played a pivotal role in facing the problems
of climate change because they are one of the biggest emitters of GHG (Hoffmann &
Busch, 2008). In recent times, stakeholders such as shareholders, consumers and
regulatory authorities, have started exerting pressure on corporations to decrease their
GHG emissions (Jeswani et al., 2008; Weinhofer & Hoffman, 2010; Liesen et al., 2015;
Comyns, 2016). Consequently, corporations are now expected to play a vital role in
reducing their GHG emissions and in contributing towards stabilizing climate change
(Luo & Tang, 2014). Businesses nowadays face an ever-increasing demand to
disseminate information about their climate change related activities, also referred to as
carbon disclosures, to satisfy the concerns of relevant stakeholders (Meng et al., 2014).
Carbon disclosure is attracting increasing attention from scholars, stakeholders and
regulators (e.g., Stanny, 2013; Matsumura et al., 2013). This is due to the fact that
through carbon disclosure, stakeholders such as government and the public can better
monitor firms’ carbon emissions, which are likely to contribute to improved corporate
carbon performance. As a result, corporate carbon disclosures have been steadily
increasing in both size and complexity in the past decade (Peng et al., 2015).

2
Recent years have seen intense societal and scientific debate about climate
change, which often centres on corporations (Howard-Grenville et Al., 2014).
Consequently, businesses have been increasingly asked to provide more information on
their climate change strategies and plans for managing and reducing carbon emissions.
For example, since 2002, Carbon Disclosure Project (CDP), a consortium of over 300
institutional investors with $41 trillion in assets, has asked the world’s 500 largest firms
every year to disclose their GHG emissions, risks, opportunities, and management
strategies. On top of that, mandatory initiatives that aim at increased transparency or
improved emissions management, have recently been introduced at the national level of
many countries. For example, in the US, all facilities that emit a minimum of 25,000
metric tons of CO2 equivalents, are now required to disclose their emissions (U.S.
Environmental Protection Agency, 2012). In the UK, all stock-listed companies must
report their GHG emissions (U.K. Government, 2013). Similar initiatives have been
introduced in many other countries and jurisdictions.
In recent times, businesses have started viewing climate change as an opportunity
rather than a burden (Margolick & Russell, 2004, The World Bank, 2018). The equity
market has started to realize the magnitude of the impact that the transition to a low-
carbon global economy is expected to have on firms’ competitiveness and long-term
valuation (Goldman Sachs Sustain, 2009). Financial markets have also started to reward
companies that are moving ahead on climate change, while those lagging behind are
assigned more risk (Cogan, 2006; Kolk et al., 2008). As a result, an increasing number
of firms have allocated resources to the communication of information on their climate
change activities to interested parties.

3
Existing literature has identified many benefits that businesses can achieve
from recording and subsequent disclosure of their climate change-related activities. In a
meta-analysis, Albertini (2013) confirms a positive relationship between environmental
disclosure and corporate financial performance. Sullivan and Gouldson (2012) find that
proactive climate-related measures and carbon disclosures, as well as the development
of climate-friendly products, can improve a company’s image. Additionally, the pressure
to disclose emissions can lead to improved carbon management which in effect can
reduce energy consumption and energy costs (Matisoff, 2013). Improved carbon
management can also help companies deal with natural (e.g., drought, flood) and
regulatory risks related to climate change. Carbon disclosure also helps investors
estimate a company’s regulatory and natural risks related to climate change
(McLaughlin, 2011). According to Dhaliwal et al. (2011), nonfinancial disclosure, which
includes carbon disclosure, is associated with improved stock performance and cost of
capital. Companies who handle climate change risks and opportunities efficiently, can
position themselves as attractive options for climate-conscious investors (Juravle and
Lewis, 2009). Therefore, carbon disclosure can be used by businesses as a means to
showcase their climate change activities. This chapter is structured as below:
Section 1.2 discusses the motivation for undertaking this research. Section 1.3
outlines the objectives of this research. Section 1.4 discusses the contributions of this
study. Section 1.5 provides the structure of this research, and section 1.6 summarises the
chapter.

4
1.2 Motivation of this study
The study of carbon disclosure is gaining increasing importance in recent years
due to the fact that through carbon disclosure businesses can communicate their climate
change activities to its stakeholders (Hahn et al., 2015). These disclosures can help
stakeholders such as shareholders and creditors to make better investment decisions for a
particular company. Carbon disclosure can also help stakeholders such as regulatory
agencies, institutional investors and the public, to better monitor and regulate a
business’s carbon emissions which are likely to contribute to improved carbon
performance of the business. Improved carbon performance can also affect the financial
performance of the business. Therefore, it is evident that the study of carbon disclosure
and carbon performance, which falls under the broad category of environmental
disclosure and environmental performance, are very important areas of study that
deserve to be well researched. The growing concerns about carbon emission by
businesses, and the increased importance of the study of carbon disclosure and carbon
performance, provide multiple motivations for this study.
Firstly, despite its importance, limited research has been done to investigate the
relationship between carbon disclosure and carbon performance, and the findings of
these research have been largely inconclusive. In addition, most of this research has been
done for specific countries and industries. To address this research gap, this study would
like to investigate the relationships between carbon disclosure, carbon performance and
financial performance, for the top 500 global companies which includes most major
industries.

5
Secondly, in current literature, some studies find that superior carbon performers
make more carbon disclosure, whereas some other studies find that inferior carbon
performers make more carbon disclosure. However, none of the current studies
investigate the disclosure practices of average carbon performers (businesses who are
neither superior carbon performers nor inferior carbon performers). Additionally, to the
best of my knowledge, no study has yet investigated whether there is an interrelation
between environmental disclosure/carbon disclosure and environmental
performance/carbon performance. If an interrelationship between carbon disclosure and
carbon performance can be established, it can help managers of businesses to make
decisions regarding their carbon disclosure and carbon performance activities.
Therefore, this study would like to investigate the carbon disclosure practices of average
carbon performers and to determine if there is any interrelationship that exists between a
business’s carbon disclosure and its carbon performance.
Thirdly, most of the studies that have been done to investigate the relationship
between carbon performance and financial performance, have produced conflicting
results (Rahman et al., 2014). In addition, this study could not find any existing research
that investigates the interrelationship between carbon performance and financial
performance. If an interrelationship between carbon performance and financial
performance can be established that shows the impact of carbon performance on
corporate financial performance and vice versa, it would be very useful for business
managers to assess the impact of any activity they would like to undertake to improve
their carbon performance. This study could not also find any major research that
investigates the relationship between carbon disclosure and financial performance. Also,

6
the relationship between environmental disclosure/corporate social performance
disclosure, and financial performance, is not well researched. Findings of any research
on the relationship between carbon disclosure and company financial performance,
would help firm management to assess the potential benefit of disclosing carbon
activities. This study therefore, intends to investigate the relationship and
interrelationship between carbon performance and financial performance, as well as the
relationship between carbon disclosure and financial performance.
Fourthly, this research could find only a few studies that investigate the
relationship between corporate disclosure and agency cost. However, this study could
not find any existing research that investigates the relationship between carbon
disclosure and agency cost, and between carbon performance and agency cost. It is
important to know whether agency cost is related to carbon disclosure and carbon
performance. Presence or absence of a relationship between agency cost and carbon
disclosure/carbon performance, can explain the motivation or lack of motivation of a
firm manager to disclose their climate change activities and improve their carbon
performance. This study would like to address this research gap by investigating the
relationship between agency cost and carbon disclosure, and between agency cost and
carbon performance.
Finally, there are only a few studies that analyse the trends in carbon disclosure
over the years. The latest trend analysis available has been done until the year 2008. On
the other hand, this study could not find any trend analysis for carbon performance. It is
important for many interested parties to know the trends in improvement of both carbon
disclosure and carbon performance. These facts motivated this study to undertake a trend

7
analysis of carbon disclosure and carbon performance by the 500 largest global firms,
over the years 2011 to 2015.
1.3 Research objectives
Based on the research gap and/or research need identified in the previous section,
this study would like to examine the relationships and interrelationships between carbon
disclosure, carbon performance and financial performance. It also would like to examine
the relationship between agency cost and carbon disclosure, and between agency cost
and carbon performance. Additionally, this research intends to investigate the trends in
improvement of carbon disclosure and carbon performance over the period of this study.
These examinations would be performed by using a cross-sectional sample of the
world’s largest 500 firms that participated in the Carbon Disclosure Project (CDP)
questionnaire survey over the five-year period 2011 to 2015.
The specific objectives of this study are:
1. To examine the relationship (one-way relationship) and interrelationship (both-
way relationship) between carbon disclosure and carbon performance
2. To examine the relationship (one-way relationship) and interrelationship (both-
way relationship) between carbon performance and financial performance
3. To examine the relationship between carbon disclosure and financial
performance
4. To examine the relationship between agency cost and carbon disclosure, and
between agency cost and carbon performance

8
5. To study the trends in improvement of carbon disclosure and carbon performance
over the study period.
Based on the above objectives, the primary research question investigated in this study
is:
How do carbon disclosure, carbon performance, financial performance,
and agency cost influence each other, and what is the trend in carbon
disclosure and carbon performance over the years.
As this study examines the relationship between carbon disclosures, carbon
performance, financial performance and agency cost, these terms will be defined below:
Carbon disclosure: Carbon disclosure includes disclosure by an organisation of
information such as GHG emissions intensity and energy use, participation in emissions
trading schemes, corporate governance and strategy in relation to climate change,
performance against GHG emissions reduction targets, and risks and opportunities
related to the impacts of climate change. In other words, carbon disclosure can be
defined as a set of quantitative and qualitative information that is related to a business’s
past and forecasted carbon emissions levels, its exposure to and financial implications of
climate change associated risk and opportunities, and its past and future actions to
manage these risks and opportunities. This information may be released via the firm’s
annual reports, stand-alone sustainability reports, via the firms’ websites or through
other dissemination channels such as the Carbon Disclosure Project (Cotter et al., 2011).

9
Carbon performance: According to Hoffmann and Busch (2008), corporate carbon
performance is indicated by a firm’s carbon intensity, carbon dependency, carbon
exposure and carbon risk. These indicators are described below:
Carbon intensity: Carbon intensity relates to a company’s physical carbon performance
and describes the extent to which its business activities are based on carbon usage for a
defined scope and fiscal year.
Carbon dependency: Carbon dependency describes the change in a company’s physical
carbon performance within a given time period. The indicator is measured as the
company’s relative performance change from the status quo to the predicted carbon
intensity.
Carbon exposure: Carbon exposure relates to a company’s monetary carbon
performance, and describes the monetary implications of the business activities due to
carbon usage for a defined scope and fiscal year.
Carbon risk: Carbon risk describes the change in a company’s monetary carbon
performance within a given period. The indicator is measured as the relative
performance change from the status quo to the predicted carbon exposure.
Financial performance:
In a broader sense, financial performance refers to the degree to which financial
objectives are being or have been accomplished. It is the process of measuring the
results of a firm's policies and operations in monetary terms. It is used to measure firm's
overall financial health over a given period. The financial performance indicators used in
the study, are discussed in detail in subsequent chapters.

10
Agency cost:
According to Jensen and Meckling (1976), the divergence of action due to the
incomplete alignment of the interests of agents and principals may lead to an agency
problem. The sacrifice of wealth by the principal, and potential costs associated with
monitoring the agents is known as the agency cost. It is also discussed in detail in later
chapters.
1.4 Contribution of this study
This study is likely to contribute to the emerging area of research on carbon
disclosure and carbon performance in a number of ways. This study would like to
conduct a global study, consisting of a large sample drawn from most major industries
covering most major regions of the world, to investigate a one-way as well as both-way
relationship between carbon disclosure and carbon performance. No previous study has
investigated the both-way relationship between carbon disclosure and carbon
performance. Also, most of the previous studies on one-way relationship between carbon
disclosure and carbon performance, have been done with a smaller sample covering
specific countries and specific industries. This research also contributes by conducting a
first-ever study that investigates the disclosure practices of average carbon performers.
Studies have been done in the past to investigate the relationship between carbon
performance and financial performance (for example Matsumura et al., 2013 and
Albertini, 2013). However, no research has yet investigated the interrelationship
between carbon performance and financial performance. This study also contributes by
taking a novel attempt to investigate the interrelationship between carbon performance

11
and financial performance. To the best of my knowledge, no study has yet assessed the
relationship between carbon disclosure and financial performance. This study is the first
ever research to investigate the relationship between carbon disclosure and financial
performance.
By investigating the relationship between carbon disclosure and agency cost
(measured by both Expense Ratio and Asset Utilization Ratio), this study adds to the
scant literature that is currently available in this area. On the other hand, there is no
existing research that has determined the relationship between carbon performance and
agency cost. By taking a first-ever attempt to investigate the relationship between carbon
performance and agency cost, this study contributes greatly to the literature.
While some existing research has done trend analysis of carbon disclosure by
businesses over the years, no study has yet done so for carbon performance. This study
contributes to the literature by investigating the trends in improvement of carbon
disclosure and carbon performance, for the largest firms in the world over a relatively
recent period.
1.5 Structure of the thesis
This thesis consists of eight chapters. The table below provides the chapter-wise
structure of this research:
Chapter 1 This chapter discusses the background, motivation, objectives and
contributions of this study.
Chapter 2 This chapter discusses carbon disclosure reporting frameworks available
globally and regionally. This description provides a contextual framework
12
for this study.
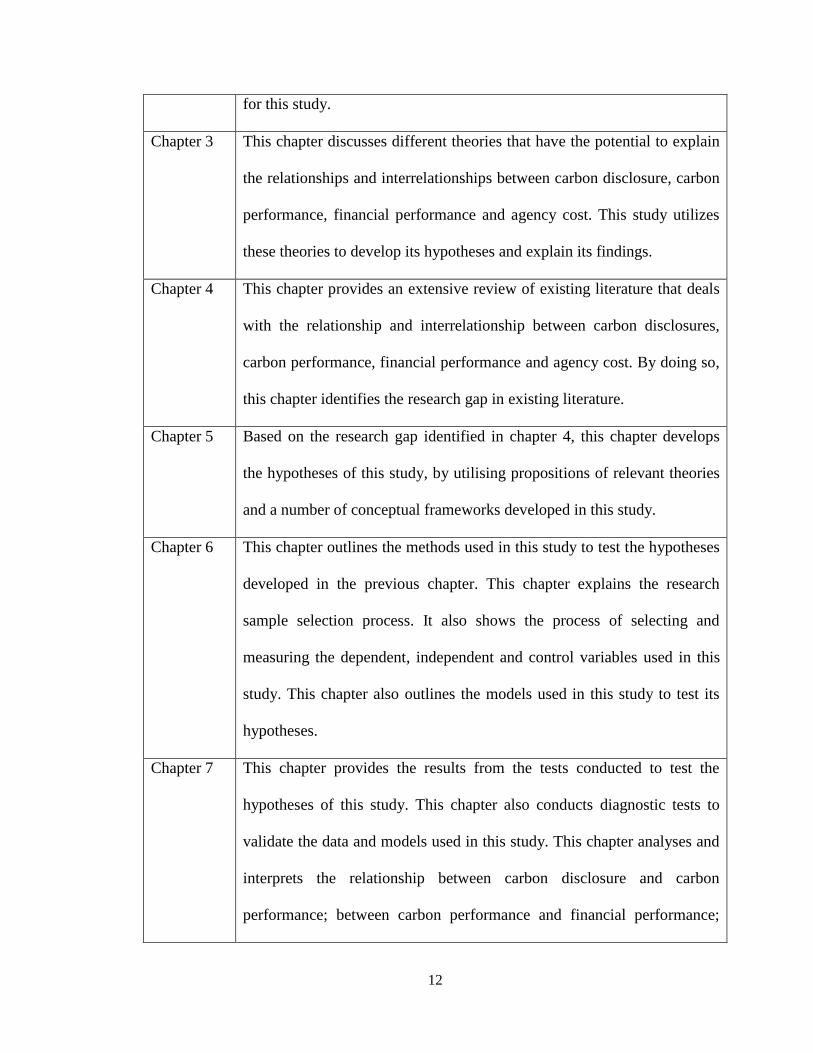
Chapter 3 This chapter discusses different theories that have the potential to explain
the relationships and interrelationships between carbon disclosure, carbon
performance, financial performance and agency cost. This study utilizes
these theories to develop its hypotheses and explain its findings.
Chapter 4 This chapter provides an extensive review of existing literature that deals
with the relationship and interrelationship between carbon disclosures,
carbon performance, financial performance and agency cost. By doing so,
this chapter identifies the research gap in existing literature.
Chapter 5 Based on the research gap identified in chapter 4, this chapter develops
the hypotheses of this study, by utilising propositions of relevant theories
and a number of conceptual frameworks developed in this study.
Chapter 6 This chapter outlines the methods used in this study to test the hypotheses
developed in the previous chapter. This chapter explains the research
sample selection process. It also shows the process of selecting and
measuring the dependent, independent and control variables used in this
study. This chapter also outlines the models used in this study to test its
hypotheses.
Chapter 7 This chapter provides the results from the tests conducted to test the
hypotheses of this study. This chapter also conducts diagnostic tests to
validate the data and models used in this study. This chapter analyses and
interprets the relationship between carbon disclosure and carbon
performance; between carbon performance and financial performance;

13
between carbon disclosure and financial performance; between carbon
disclosure and agency cost and between carbon performance and agency
cost. This chapter also investigates any trends in improvement of carbon
disclosure and carbon performance during the study period.
Chapter 8 This chapter concludes this study with a discussion of this research’s
potential implications, limitations and suggestions for future research.
1.6 Chapter summary
This chapter provides a brief background for the study followed by motivations
for this study. It then provides the objectives and research questions and contributions of
this study. This chapter also provides definitions of certain terms that are integral to
understanding this study. Finally, this chapter provides a structure of this thesis. The
following chapter will discuss certain carbon disclosure reporting frameworks that are
relevant to this study.

14
CHAPTER 2 CARBON DISCLOSURE REPORTING
FRAMEWORKS
2.1 Introduction
As discussed in the previous chapter, one of the primary objectives of this study
is to investigate carbon disclosure practices of Global 500 companies. To do so, it is
important to have an idea about the carbon disclosure reporting frameworks available
globally, regionally or country-wise. Therefore, this section describes carbon emissions
and climate change disclosure practices and frameworks relevant to the sample
companies. This description provides a contextual framework for this study. Most of the
sample companies are from one of the four regions namely: North America, European
Union, the UK and Asia-Pacific. There are only four companies who are outside these
regions (two each from South America and Brazil). The following sections describe the
carbon disclosure reporting frameworks available in these four regions and countries
inside these regions, as applicable. It also describes global reporting frameworks that are
relevant for carbon disclosure. This chapter is structured as below:
Section 2.2 discusses carbon disclosure frameworks available globally. Section
2.3 discusses regional/country-wise carbon disclosure reporting frameworks, and section
2.4 summarises the chapter.

15
2.2 Global carbon disclosure reporting frameworks
The Global Reporting Initiatives (hereafter GRI) and Climate Change Reporting
Framework (hereafter CCRF) are the two most important global carbon disclosure
reporting frameworks that are relevant for this study. They will be described in the
following sections. However, before discussing them, it will be worthwhile to briefly
describe the Kyoto Protocol, which although is not strictly a carbon disclosure
framework, has far-reaching implications on all global, regional and country-wise
carbon reporting frameworks.
The Kyoto Protocol is an international agreement linked to the United Nations
Framework Convention on Climate Change, which commits participating countries by
setting internationally binding emission reduction targets. Recognising that developed
countries are principally responsible for the current high levels of GHG emissions in the
atmosphere as a result of more than 150 years of industrial activity, the Protocol places a
heavier burden on developed nations under the principle of "common but differentiated
responsibilities". The Kyoto Protocol was adopted in Kyoto, Japan, on 11 December
1997, and entered into force on 16 February 2005. Both the Convention and its Protocol
created a framework for the implementation of an array of national climate policies, and
stimulated the creation of the carbon market and new institutional mechanisms that
could provide the foundation for future mitigation efforts. The Protocol has put in place
an accounting and compliance system with a set of rules and regulations. In particular,
the Protocol lays down specific rules concerning the reporting of information by
participating countries that have to demonstrate that they are meeting their
commitments. (United Nations Framework Convention on Climate Change, 2018).

16
2.2.1 Global Reporting Initiatives (GRI)
The GRI is a voluntary disclosure framework that includes disclosure about
climate change and its impact. This framework guides organisations on how they can
report their sustainability performance. The guidelines of this reporting framework
include Performance Indicators and Management Disclosures that companies can adopt
voluntarily to disclose their performance in key sustainability areas, including GHG
emissions and initiatives to reduce them, as well as energy consumption and reduction
initiatives (Cotter et al., 2011).
The GRI has pioneered and developed a comprehensive Sustainability Reporting
Framework that is widely used around the world. The Framework, which includes
Sustainability Reporting Guidelines and Sector Guidance, guides organisations on how
they can report their sustainability performance. The guidelines of this reporting
framework include Performance Indicators and Management Disclosures that companies
can adopt voluntarily to disclose their performance in key sustainability areas including
GHG emissions and initiatives to reduce them, as well as energy consumption and
reduction initiatives.
2.2.1.1 The Sustainability Reporting
The GRI Sustainability Reporting Guidelines assist in the preparation of
sustainability reports by organisations, regardless of their size, sector or location. The
Guidelines offer an international reference for all those interested in the disclosure of
governance approach, and of the environmental, social and economic performance and
impacts of organisations. The Guidelines are useful in the preparation of any type of

17
document which requires such disclosure. The most current generation of the GRI
Guidelines are The G4 Guidelines.
The G4 Guidelines: The G4 guidelines include two different types of Standard
Disclosures: General Standard Disclosures and Specific Standard Disclosures.
GENERAL STANDARD DISCLOSURES: They include disclosure about:
Strategy and Analysis
Organisational Profile
Identified Material Aspects and Boundaries
Stakeholder Engagement
Report Profile
Governance
Ethics and Integrity
SPECIFIC STANDARD DISCLOSURES: These include
Disclosures on Management Approach and
Indicators
(Global Reporting Initiatives, 2013)
2.2.2 Climate Change Reporting Framework (CCRF)
The Climate Disclosure Standard Board’s (hereafter CDSB) Climate Change
Reporting Framework, is a voluntary reporting framework designed to elicit climate
change-related information of value to investors. Created in line with the objectives of
financial reporting and rules on non-financial reporting, the climate change reporting

18
framework seeks to filter out what is required to understand how climate change affects
a company’s financial performance.
The CDSB climate change reporting framework is designed for use by
companies in making disclosures in, or linked to, their mainstream financial reports
about the risks and opportunities that climate change presents to their strategy, financial
performance, and condition. CDSB’s intention is that disclosures that comply with the
climate change reporting framework will be of value to investors. The climate change
reporting framework adopts and relies on relevant provisions of existing standards and
practices, including the Greenhouse Gas Protocol and International Financial Reporting
Standards, as well as reflecting developments in regulatory and voluntary reporting, and
carbon trading rules. The Framework is “standard-ready” for adoption by regulators
contemplating the introduction or development of climate change disclosure practices.
2.2.2.1 Requirements of Climate Change Reporting Framework (CCRF)
The CCRF has specified certain requirements for organisations to follow. The
main requirements are requirements on determination, requirements on preparation,
requirements on presentation, and Requirements on disclosure content. All of the
requirements are to be applied wholly and faithfully, and they shall be read and applied
in conjunction with: Chapter 3, which describes the characteristics of decision useful
information that shall be applied in determining, preparing and presenting disclosures in
accordance with the requirements; Chapter 4, which sets out the type of information that
is useful to investors and is therefore to be considered for disclosure and the guidance
and explanatory material that accompany the requirements.

19
Following is a summary of the above requirements:
Requirements on determination: An organisation shall determine the disclosures to be
made under the CCRF according to the categories of disclosure content that are of value
to investors, and a process that involves a thorough assessment of how climate change has
actually affected or has the potential to affect the organisation’s strategic objectives.
Following are the main requirements related to the determination:
Disclosures shall take account of the content requirements in Chapter 4 of the
CCRF.
Disclosures shall focus on investors as the primary users of information
Disclosures shall bring to bear management’s view of the organisation’s strategy
and objectives.
Disclosures shall comply with regulatory requirements for financial reporting or
corporate disclosure of climate change-related information. Where there is a
conflict between the requirements of CCRF and the regulatory requirements, the
regulatory requirements shall be applied, and the nature and effect of the conflict
disclosed.
Requirements on preparation: Disclosures shall be made on a consistent basis and shall
include the information that is necessary to maximize its value to investors. Following are
the main requirements related to preparation:
Disclosures under the CCRF shall enable investors to assess the future prospects
of the organisation as well as its past performance.
20
Information shall be provided on an annual basis for the same period covered by
the mainstream financial report, or for a period of twelve months ending in that
period.
Subject to the CCRF recommendations about organisational boundaries for
greenhouse gas emissions reporting (described in Chapter 4), disclosures shall be
made to the organization for which consolidated financial statements are prepared.
Disclosures shall include a statement of conformance with the CCRF
requirements. In cases where full conformance has not been possible because of
the organisation’s particular circumstances, the statement shall identify those
requirements with which it has not been possible to conform, in whole or in part,
together with an explanation of the relevant circumstances, information about the
organisation’s stage of conformance, and its plans for full application of the
requirements.
The statement of conformance shall include details of the standards, policies and
organisational boundary used for preparing information under the CCRF, and
confirmation that the standards, policies and organisational boundary, have been
used consistently from one reporting period to the next.
Requirements on presentation: Disclosures shall be presented and communicated to
make them useful for investors. Following are the main requirements related to
presentation:
Disclosures shall be clear and straightforward
Information shall be reported in a place and in such a way as to explain the links
between the organisation’s strategy, operations and climate change impacts.
21
Organisations shall disclose performance measures and indicators used by
management to manage the business, and to track progress against climate change-
related targets.
Disclosures shall explain changes in approach and changes in results from year to
year.
Disclosures shall be consistent with the associated financial statements of the
organisation. Therefore, if financial statements include segment information,
disclosures about climate change shall also reflect that segmentation.
Requirements on disclosure content: The CCRF requirements seek to ensure that
disclosures include information that is essential to an understanding of how climate
change affects management’s objectives, the strategies for meeting those objectives, and
the performance of the organisation. Disclosure shall include the following information:
a) Strategic analysis, risk and governance: Disclosure about strategic analysis shall
include a statement about the long-term and short-term impact climate change
actually and potentially has on the organisation’s strategic objectives.
b) Risks: Disclosure about risks shall include an explanation and qualitative
assessment of the organisation’s exposure to current and anticipated (long-term
and short-term) significant risks associated with climate change.
c) Opportunities: Disclosure about opportunities shall include an explanation and
qualitative assessment of current and anticipated (long-term and short-term)
significant opportunities associated with climate change.
d) Management Actions: Disclosure shall include a description of the organisation’s
long-term and short-term strategy or plan to address climate change-related risks,

22
opportunities and impacts, including targets to reduce GHG emissions, and an
analysis of performance against those targets.
e) Future outlook: Disclosures shall include information about the future outlook,
long-term and short-term, including trends and factors related to climate change
that are likely to affect management’s view of the organisation’s strategy or the
timescales over which achievement of the strategy is typically planned.
f) Governance: Disclosures shall describe the governance processes and
organisational resources that have been assigned to the identification, management
and governing body oversight of climate change-related issues.
g) Greenhouse gas emissions:
Following are the main GHG emissions content requirements:
1. Gross absolute Part 1 and Part 2 GHG emissions shall be calculated by
reference to one or more recognised GHG emissions reporting schemes,
and disclosed in CO2 equivalent metric tonnes.
2. Normalized GHG emissions shall be disclosed for the organisation.
3. GHG emissions results shall be accompanied by contextual disclosures that
include:
the name or names of the recognised GHG emissions reporting
scheme(s) used to calculate GHG emissions
the quantification methodology used for calculating GHG emissions
key assumptions made in the preparation of disclosures
emission factors and/or the source of emission factors used to calculate
GHG emissions from activity data

23
the global warming potentials used and their source
in support of Scope 2 (indirect) GHG emissions results, disclose details
(in KWh, MWh or GWh) of the purchased electricity the organization
has consumed;
a description of the main effects of uncertainty in the calculation of
GHG emissions e.g., data gaps, assumptions, extrapolations,
metering/measurement inaccuracies etc.
a statement on whether and to what extent GHG emissions results have
been verified or assured, internally or by an independent third party
confirmation or otherwise, that Scope 1 and 2 GHG emissions results
relate to activities and sources within the organizational boundaries
GHG emissions results shall be categorised/disaggregated as
appropriate in the circumstances
Movements in GHG emissions results over time, shall be disclosed and
explained
(Climate Disclosure Standard Board, 2013)
This study intends to investigate carbon disclosure practices of Fortune 500
companies. The majority of the firms of this sample are from the following regions:
North America, European Union, UK and Asia-Pacific. The disclosure frameworks for
all these regions are discussed below:
24
2.3 Regional/country-wise carbon disclosure reporting frameworks
The following sections describe regional and country-wise disclosure
frameworks that are relevant and useful for businesses who intend to disclose their
climate change activities:
2.3.1 North America
Carbon disclosure reporting frameworks of United States of America (USA) and Canada
are describe briefly in the following sections:
The United States of America:
In the USA, The Greenhouse Gas Reporting Program (GHGRP) requires reporting
of greenhouse gas data and other relevant information from large GHG emission
sources, fuel and industrial gas suppliers, and CO2 injection sites. This data can be used
by businesses and others to track and compare facilities' greenhouse gas emissions and
identify opportunities to cut pollution, minimise wasted energy, and save money. A
total of 41 categories of reporters are covered by the GHGRP. Facilities determine
whether they are required to report based on the types of industrial operations located at
the facility, their emission levels, or other factors. Facilities are generally required to
submit annual reports if:
GHG emissions from covered sources exceed 25,000 metric tons CO2
equivalent per year
Supply of certain products would result in over 25,000 metric tons CO2
equivalent of GHG emissions, if those products were released, combusted, or
oxidized

25
The facility receives 25,000 metric tons or more of CO2 for underground
injection
Approximately 8,000 facilities are required to report their emissions annually. Total
reported emissions from these facilities are about 3 billion metric tons CO2 equivalent,
which is about 50 percent of total U.S. GHG emissions. Additional GHGs are accounted
for by approximately 1,000 suppliers. In total, data covering 85-90 percent of U.S GHG
emissions are reported (The United States Environmental Protection Agency 2017).
In January 2010, the U.S. Securities and Exchange Commission issued new guidance
clarifying that publicly-traded companies need to disclose financially material impacts
related to climate change. Material impacts may range from compliance costs related to
emissions regulation to the physical impacts of changing weather patterns on operations.
Specifically, the SEC's interpretative guidance highlights the following areas as
examples of where climate change may trigger disclosure requirements:
Impact of Legislation and Regulation: When assessing potential disclosure
obligations, a company should consider whether the impact of certain existing
laws and regulations regarding climate change is material. In certain
circumstances, a company should also evaluate the potential impact of pending
legislation and regulation related to this topic.
Impact of International Accords: A company should consider and disclose
when material, the risks or effects on its business of international accords and
treaties relating to climate change.
Indirect Consequences of Regulation or Business Trends: Legal,
technological, political and scientific developments regarding climate change,
may create new opportunities or risks for companies. For instance, a company

26
may face decreased demand for goods that produce significant greenhouse gas
emissions, or increased demand for goods that result in lower emissions than
competing products. As such, a company should consider for disclosure
purposes, the actual or potential indirect consequences it may face due to climate
change related regulatory or business trends.
Physical Impacts of Climate Change: Companies should also evaluate for
disclosure purposes, the actual and potential material impacts of environmental
matters on their business (US Securities & Exchange Commission, 2015).
Many states in the USA have separately mandated disclosure of GHG emission.
The Global Warming Solutions Act of 2006, is a California State Law that fights global
warming by establishing a comprehensive program to reduce greenhouse gas
emissions from all sources, throughout the state (California Air Resources Board, 2006).
In 2003, New York State proposed and obtained commitments from
nine Northeast states, to form a cap and trade carbon dioxide emissions, under a program
for power generators, called the Regional Greenhouse Gas Initiative (RGGI). This
program was launched on January 1, 2009, with the aim being to reduce the carbon
"budget" of each state's electricity generation sector, to 10 percent below their 2009
allowances, by 2018.
Canada:
The Greenhouse Gas Emissions Reporting Program (GHGRP), collects
information on greenhouse gas emissions annually, from facilities across Canada. It is a
mandatory program for those who meet the requirements. Facilities that emit 50

27
kilotonnes or more of GHGs in carbon dioxide (CO2) equivalent units, per year, must
report their emissions to Environment and Climate Change Canada. Emissions data is
available by gas (in tonnes, and tonnes of CO2 equivalent), for each facility and each
year of data collected (2004-Present). The GHGs included are: carbon dioxide (CO2),
methane (CH4), nitrous oxide (N2O), hydrofluorocarbons (HFC), perfluorocarbons
(PFC) and sulphur hexafluoride (SF6).
Several provincial governments have established substantial programs to reduce
emissions in their respective territories. British Columbia, Manitoba, Ontario and
Quebec, have joined the Western Climate Initiative, a group of 7 states of the Western
United States, whose aim is to establish a common framework for a carbon credit market
Government of Canada, 2017).
2.3.2 European Union
In compliance with the Kyoto protocol, the European Union (EU) pioneered the
first carbon reduction scheme known as the European Union Emissions Trading Scheme
(EU ETS), in 2005, which mandated carbon reduction targets for all European Union
members. The EU ETS is a cornerstone of the EU's policy to combat climate change,
and its key tool for reducing greenhouse gas emissions cost-effectively. It operates in 31
countries (all 28 EU countries plus Iceland, Liechtenstein, and Norway). It limits
emissions from more than 11,000 heavy energy-using installations (power stations &
industrial plants) and airlines operating between these countries, and it covers
around 45% of the EU's greenhouse gas emissions. As per this scheme, all EU members
are asked to report their emissions progress against the United Nations Framework
Convention on Climate Change (UN FCCC) commitments, to the EU commission. The

28
Reporting formats and guidelines are issued under European commission decision
2007/589/EC. These guidelines require the largest EU companies to report about the six
greenhouse gases controlled by the Kyoto protocol. On top of that, EU members should
report their progress against the Kyoto targets every two years (Aguiar 2009).
Additionally, some EU member countries have introduced regulations that require the
disclosure of environmental issues as well as GHG emissions. For instance, the Grenelle
II Act in France, requires firms to include in their annual reports, a section on social and
environmental consequences of their activities (Najah, 2012).
The EU ETS works on the 'cap and trade' principle. A cap is set on the total
amount of certain greenhouse gases that can be emitted by installations covered by the
system. The cap is reduced over time, so that total emissions fall. Within the cap,
companies receive or buy emission allowances which they can trade with one another as
needed. They can also buy limited amounts of international credits from emission-saving
projects around the world. The limit on the total number of allowances available, ensures
that they have a value. After each year, a company must surrender enough allowances to
cover all its emissions, otherwise heavy fines are imposed. If a company reduces its
emissions, it can keep the spare allowances to cover its future needs, or else sell them to
another company that is short of allowances. Trading brings flexibility, that
ensures emissions are cut where it costs least to do so. A robust carbon price also
promotes investment in clean, low-carbon technologies (European Commission, 2017).
2.3.3 The United Kingdom
The government of the United Kingdom (UK), enacted Climate Change Act
2008, to deal with climate change and carbon emissions. The Act attempts to ensure that

29
the net UK carbon account for all six Kyoto greenhouse gases for the year 2050, is at
least 80% lower than the 1990 baseline. The Act aims to enable the United Kingdom to
become a low-carbon economy, by achieving a range of greenhouse gas reduction
targets. An independent Committee on Climate Change, has been created under the Act
to provide advice to the UK Government on these targets. This act covers businesses
that were not considered in the EU ETS. According to this scheme, firms are required to
measure their energy use and emissions, and report them to the government. The Act
requires the Government to set legally binding emissions targets, called carbon budgets,
every five years. It also established an independent expert body, the Committee on
Climate Change (the CCC), to advise Government on the level of those emissions
targets. It also reports to Parliament on progress made on reducing emissions (Najah,
2012).
2.3.4 Asia-Pacific
In the Asian and Pacific regions, most of the sample companies belong to
Australia and Japan. In 2007, Australia introduced a single national framework, for
corporations to report on greenhouse gas emissions, energy use, and energy production.
That framework, known as the National Greenhouse and Energy Reporting (NGER)
Scheme, operates under the National Greenhouse and Energy Reporting Act 2007 (Cth).
Corporations that meet an NGER threshold must register and then report each
year. Information collected through the NGER Scheme provides the basis for assessing
liability under the carbon pricing mechanism. The Clean Energy Regulator administers
the NGER Act. Participation in the NGER scheme has been summarised in seven steps
to assist reporting corporations. The following are the steps:

30
Thresholds: There are two types of thresholds to determine which corporations are
required to participate in the NGER scheme. These are facility thresholds and corporate
group thresholds. As a guide, businesses emitting more than 25,000 tonnes of carbon
dioxide equivalent, or consuming more than 25,000-megawatt hours of electricity, or 2.5
million litres of fuel in a financial year, can expect to be required to report.
Registration: Corporations that meet a threshold must apply for registration.
Data collection: Registered corporations must collect data and keep records about the
greenhouse gas emissions and energy use and production of the members of their group,
so they can report each year. In particular, each registered corporation must keep records
of the activities of the members of its group, that allow it to report accurately under the
NGER Act, and enable the Regulator to ascertain whether the corporation has complied
with its obligations under the NGER Act. Under the NGER Act (section 22, Records to
be kept), corporations are required to keep all records (this would include those that
inform decisions, and the final decisions made relating to the NGER Act), for five years
from the end of the year in which the activities take place.
Reporting: Once registered, corporations are required to report each year that they
remain registered. NGER reports are due by 31 October, following the financial year
reporting period.
Data publication: The Clean Energy Regulator is required to publish a summary of
reported information, by 28 February each year. The Clean Energy Regulator only
publishes information for registered corporations that exceed the publishing threshold.
This snapshot of corporations' greenhouse gas emissions and energy use, is used to
inform government policy development, assist government programs and activities, and
meet Australia's international reporting obligations.

31
Monitoring and compliance: Participants are encouraged to voluntarily comply with
legislative requirements. The NGER Act provides a range of monitoring and
enforcement powers, where required (e.g., penalties).
Audits: The NGER Act provides for greenhouse and energy audits of reporting
corporations registered under the Act. It also requires a Register of Greenhouse and
Energy Auditors. Audits determine if registered corporations are complying with the
NGER Act.
Penalties: Corporations that fail to register and report, or otherwise fail to comply with
their obligations under the NGER Act, may be liable for penalties. The NGER Act
allows for administrative, civil, and/or criminal responses, in relation to contraventions
of the Act. Part 5 of the NGER Act sets out penalty provisions. These include fines of up
to $340,000 (2,000 penalty units) for failure to apply for registration, and daily fines of
up to $17,000 (100 penalty units) for each day of non-compliance. Obligations under the
NGER Act continue, even if the period has expired or the due date has passed (National
Greenhouse and Energy Reporting Act, 2007, Cth).
Japan introduced in 2005 (effective April 2006) the Mandatory Greenhouse Gas
Accounting and Reporting System, based on the revised Act on Promotion of Global
Warming Countermeasures (Act No. 117 of 1998). This system requires specified
entities (which emit GHG emissions above a defined threshold) to calculate their GHG
emissions and report the results to the Government. Industrial companies, commercial
businesses, universities, freight carriers, etc. (as specified in the Law Promoting the
Rational Use of Energy) who consume more than 1,500kl (crude oil equivalent) of
energy per year, or emit more than 3,000t-CO2 per year, must report their GHG emission
levels.

32
The main objective of the system is to promote voluntary emissions-reduction
efforts of emitters, through assessment of the current GHG emission levels. Under this
system, “specified establishment emitters” are considered those that use more than 1,500
kl energy per year by crude oil equivalent for all establishments, and that satisfy the
following requirements:
- Conduct business activities with each establishment emitting 3,000 tons or more
CO2 by type of greenhouse emission gas;
- Employ 21 or more staff in total, for all establishments
The other category “specified transportation emitters,” are considered those that fall in
the transportation sector, including specified freight carriers, specified consigners,
specified passenger carriers, and specified air carriers, under the Act on the Rational Use
of Energy (Industrial Efficiency Policy Database, 2007).
2.4 Chapter summary
This section provides a background for this study, by discussing relevant
institutional frameworks in regards to the carbon disclosure frameworks available across
the globe. Global carbon disclosure frameworks available currently, such as The Global
Reporting Initiatives, that include The Sustainability Reporting guidelines and Climate
Change Reporting Frameworks, are discussed in detail in the first part of this section.
The next part of this section discusses regional/country-wise carbon disclosure reporting
frameworks, available in North America, European Union, United Kingdom and Asia-
Pacific. In North America and Asia-Pacific, relevant frameworks from only USA,
Canada, Australia and Japan respectively, are discussed, as most other counties from

33
these regions do not have any substantial carbon disclosure frameworks. The next
chapter will discuss the theories that are relevant for this study.

34
CHAPTER 3 THEORETICAL BACKGROUND
3.1 Introduction
The previous chapter provides a background and context for this study by
discussing relevant institutional frameworks in regard to the carbon disclosure
frameworks available across the globe. The objective of this chapter is to review
different theories, that have the potential to explain the relationship and interrelationship
between carbon disclosure, carbon performance, financial performance and agency cost.
This study utilises these theories to develop its hypothesis and explain its findings. The
theories discussed in this chapter are Legitimacy Theory, Stakeholder Theory, Voluntary
Disclosure Theory, Signalling Theory, Proprietary Costs Theory, Instrumental
Stakeholder Theory, and Agency Theory. This chapter is structured as below:
Section 3.2 discusses Legitimacy Theory. Section 3.3 discusses Stakeholder
Theory. Section 3.4 discusses Voluntary Disclosure Theory. Section 3.5 discusses
Signalling Theory. Section 3.6 discusses Proprietary Cost Theory. Section 3.7 discusses
Instrumental Stakeholder Theory. Section 3.8 discusses Agency Theory and Section 3.9
summarises the chapter.
There are primarily two types of theories that have been used in prior research to
explain the relationship between corporate performance and voluntary disclosure. They
are categorised as socio-political theories, such as Legitimacy Theory and Stakeholder
Theory, and economic-based theories, such as Signalling Theory and Voluntary
Disclosure Theory.

35
3.2 Legitimacy Theory
As per Cormier and Gordon (2001), the concept of legitimacy originates from the
social contract concept, where an organisation derives its legitimacy from the contract
between it and society. Legitimacy is defined by Lindblom (1994) as a condition or
status which exists when an entity’s value system is congruent with the value system of
the larger social system of which the entity is a part. When a disparity, actual or
potential, exists between the two values systems, there is a threat to the entity’s
legitimacy. Suchman (1995) defines legitimacy as “a generalized perception or
assumption that the actions of an entity are desirable, proper, or appropriate within some
socially constructed system of norms, values, beliefs, and definitions”.
As mentioned earlier, the concept of a social contract is related to Legitimacy
Theory. Companies and other organisations exist at society’s will and are beholden to
some degree to society’s wishes. Legitimacy is accomplished if society perceives that
the company is operating in accordance with the existing norms and values of the
society. Therefore, the organisation will always try to seek the legitimacy that is given
by the society based on the social contract between them. When the organisation feels
that its legitimacy is threatened, it will pursue several strategies to retain this legitimacy.
Therefore, organisations may use social and environmental disclosure as a tool to
deal with society’s demands and needs. By making social and environmental
disclosures, firms attempt to convey a message to several types of stakeholders,
highlighting that they are conforming to their expectations, and persuading them about
their performance in order to maintain their legitimacy (Cotter et al., 2011).

36
As per Hannele (2010), if the organisation is not considered legitimate by the
society, i.e. if a legitimacy gap exists, the organisation may use different strategies to
bridge the gap. The actions taken in such a situation depend on management’s
perceptions of the threats to legitimacy.
As per Lindblom (1994), when management perceives that a legitimacy gap exists, they
will implement different strategies such as:
to correct the behaviour of their organisation realigning it with the desires of
society
to change the perception that society has of their behaviour, but not the
Behaviour itself
to transform the perception that society has of their behaviour, manipulating it,
deceiving it, or simply distracting its attention, and/or
to indoctrinate society with the aim of modifying its expectations and
accommodate them to the organisation’s ends
Legitimacy Theory assumes that businesses may disclose social and
environmental information voluntarily, to legitimise their activities, so as to give the
impression of being socially responsible to the society (Deegan, 2002; O’Donovan,
1999). Therefore, Legitimacy Theory has been used by many previous studies such as
Deegan et al. (2000), Deegan (2002) and Gray et al. (1996), to explain the reasons for
social and environmental disclosure.
When a business feels threatened as a result of its poor performance, it releases
positive information to refine its image and bridge the legitimacy gap (Deegan &
Rankin, 1996; O’Donovan, 2002). In this case, businesses use soft social and

37
environmental disclosure to deal with society’s demands and needs (Freedman & Jaggi,
2005; Lindblom, 1994; Reverte, 2009). By making positive social and environmental
disclosure, businesses indicate to several types of stakeholders, that they are meeting
their expectations (Deegan & Gordon, 1996; Deegan & Rankin, 1996). These firms
release positive social and environmental information, via annual reports (Cho & Patten,
2007; Deegan et al., 2000; O’Donovan, 2002) and corporate websites (Cho & Roberts,
2010), to maintain legitimacy in the eyes of stakeholders.
In summary, when businesses feel there is a lack of legitimacy due to breach of
social contract, they would make positive social and environmental disclosure to retain
legitimacy.
3.3 Stakeholder Theory
Stakeholders have been defined by Freeman and Reed (1983, p.91) as “any
identifiable group or individual who can affect the achievement of an organisation’s
objectives, or is affected by the achievement of an organisation’s objectives”. According
to this definition, many people or organisations can be classified as stakeholders such as
shareholders, creditors, government, media, employees, local communities, local
charities future generation etc. (Deegan & Unerman, 2006). Clarkson (1995, pp 106-
107) divides stakeholders into primary and secondary stakeholders. Primary
stakeholders are defined as “one without whose continuing support the corporation
cannot survive as a going concern”. While secondary stakeholders are defined as “those
who influence or affect, or are influenced or affected by the corporation”. However,
these stakeholders are not engaged in transactions with the corporation, and are not

38
essential for its survival. O’ Dwyer (2005) suggests that the broader ethical perspective
that both primary and secondary stakeholders have particular minimum rights that
should not be violated, can be extended to the notion that all stakeholders also have the
right to be provided with information about how the organisation is affecting them by
means of, for example, pollution, community sponsorship, provision of employment,
safety initiatives etc., even if they choose not to use the information and even if they
cannot directly have an impact on the survival of the organisation.
Stakeholder Theory has two branches: the ethical branch or normative branch,
and the managerial branch or positive branch. Ethical branch argues that all stakeholders
have the right to be treated fairly by an organisation. It also argues that issues of
stakeholder power are not directly relevant. Therefore, the impact of the organisation on
the life experience of a stakeholder should determine the organisation’s responsibility to
that stakeholder, rather than the extent of that stakeholder’s economic power over the
organisation (Deegan & Unerman, 2006). As per Hasnas (1998), the ethical branch of
Stakeholder Theory, states that managers should manage the business for the benefit of
all stakeholders”, rather than for the stockholders only, regardless of whether
stakeholder management leads to improved financial performance or not. According to
the normative Stakeholder Theory, management must give equal consideration to the
interests of all stakeholders, and, when these interests conflict, management should
manage the business in a way so that it attains the optimal balance among them.
Therefore, normative branch of Stakeholder Theory suggests that businesses have true
social responsibilities.
The managerial branch of the Stakeholder Theory, assumes that expectations of
various stakeholders will impact on an organisation’s operating and disclosure policies.
39
However, the organisation will not respond to all stakeholders, rather it will respond to
those that it deems to be powerful (Bailey et al., 2000; Buhr, 2002). Nasi et al. (1997)
suggest that the most powerful stakeholder will be attended to first. This view is
supported by Wallace (1995, p. 87) who argues that the higher the group in the
stakeholder hierarchy, the more clout they have and the more complex their
requirements will be.
According to Gray et al. (1996, p.45) this perspective tends to be more
‘organisation-cantered’. Under this perspective, stakeholders are identified by the
organisation of concern, by reference to the extent to which the organisation believes the
interplay with each group needs to be managed in order to further the interests of the
organisation. The more important the stakeholder to the organisation, the more effort
will be exerted in managing the relationship. Information is a major element that can be
employed by organisations to manage or manipulate the stakeholder in order to gain
their support and approval or to distract their opposition and disapproval.
A stakeholder’s power to influence corporate management is viewed as a
function of the stakeholder’s degree to control over resources required by the
organisation. The more critical the stakeholder resources are to the continued viability
and success of the organisation, the greater the expectation that stakeholder demand will
be addressed. A successful organisation is considered to be one that satisfies the
demands (sometimes conflicting) of various powerful stakeholder groups. Therefore,
the organisations will undertake various activities such as public reporting, to meet the
expectations of important stakeholders. Organisations will have incentives to disclose
information about their activities to respective stakeholder groups, to indicate clearly
that they are conforming with those stakeholder groups (Ullman, 1985).

40
Under ethical branch, firms focus on a broad range of stakeholders and their
various information needs (Gray et al., 1996). However, under the managerial branch,
firms’ management uses disclosure as a tool to deal only with the informational needs of
the various powerful stakeholder groups (Bailey et al., 2000; Reverte, 2009). Therefore,
Stakeholder Theory suggests that businesses would use disclosure practices as an
important tool to maintain their legitimacy, and to meet its stakeholders’ expectations.
3.4 Voluntary Disclosure Theory
Meek et al. (1995, p.555), define voluntary disclosure as “free choices on the part
of company management to provide accounting and other information deemed relevant
to the decision needs of users of their annual reports”. Voluntary disclosure tries to
provide a clear view to stakeholders about the business’s long-term sustainability and
reducing information asymmetry and agency conflicts between managers and investors
(Healy & Palepu, 2001; Boesso & Kumar, 2007).
According to Verrecchia (1983); Dye (1985) and Clarkson et al. (2008),
Voluntary Disclosure Theory assumes that firms with superior environmental
performance will be motivated to disclose information about their good performance
practices, to differentiate themselves from firms with inferior environmental
performance. To achieve these objectives, good performers will disclose verifiable or
actual information about their environmental performance. This type of information is
difficult to mimic by a firm’s counterparts and competitors. Conversely, firms with poor
environmental performance, will prefer to be silent about their performance if outsiders

41
are unable to identify whether the non-disclosure of performance information originates
from poor performance or from high proprietary costs (Verrecchia, 1983).
On a similar note, Clarkson et al. (2008) predict a positive association between
environmental performance and the level of discretionary environmental disclosure. The
reason being, superior environmental performers, will convey their ‘‘type’’ by pointing
to objective environmental performance indicators which are difficult to mimic by
inferior type firms. On the other hand, inferior performers will choose to disclose less or
to be ‘‘silent’’ on their environmental performance, thus being placed in a pool of firms
where investors and other users ascribe the ‘‘average type’’ to that pool.
3.5 Signalling Theory
Signalling Theory can be used to explain the motivation of firms to voluntarily
disclose company information (Bin Abdullah, 2008). Signalling Theory is concerned
with the issue of information asymmetry problems (Akerlof 1970; Levin, 2001; Morris,
1987; Ross, 1977). This theory explains how information asymmetry problems (one
party having more or better information than others) can be reduced by the party with
more information signalling it to others. As part of signalling, companies communicate
firm quality or value through voluntary disclosure, financial accounts and so on. In the
case of voluntary corporate disclosure, managers provide additional information to
investors, to help them make investment decisions (Cotter et al., 2011). Companies with
good performance are likely to disclose more information, to signal their good quality to
investors (Bin Abdullah, 2008).
Signalling Theory was originally developed to clarify the information asymmetry
in the labour market (Spence, 1978). Subsequently, it has been used to explain voluntary

42
corporate disclosures (Ross, 1977). Signalling Theory discusses how to address
problems caused by information asymmetry in any social setting. It suggests that
information asymmetry should be reduced if the party possessing more information can
send signals to interested parties (An et al., 2011). As a result of the information
asymmetry problem, companies signal certain information to investors, to show that they
are better than other companies in the market, for the purpose of attracting investments
and enhancing a favourable reputation (Verrecchia, 1983).
A signal can be an observable action, or an observable structure, which is used to
indicate the hidden characteristics (or quality) of the signaller. The sending of a signal is
usually based on the assumption that it should be favourable to the signaller, e.g.,
indicating a higher quality of its products compared to its competitors (An et al., 2011).
By signalling companies, on the one hand, would make investors and other
stakeholders reassess the value of the company, and then make decisions more
favourable to the company (Whiting & Miller, 2008). On the other hand, the favour of
various stakeholders would make a company obtain more investment, and therefore
reduce the costs of raising capital. There are a number of means for companies to signal
information about themselves. Among those, voluntary disclosure of positive accounting
information is considered to be one of the most effective (Ross, 1979; Watson et al.,
2002 and Xiao et al., 2004). Voluntary disclosure is used for signalling, where
companies would disclose more information than required by mandatory laws and
regulations, in order to signal that they are better (Campbell et al., 2001). To be
effective, the signal must be difficult to be copied by another firm (Morris 1987). One of
the ways, for example, a business can achieve this is to make hard disclosures (Clarkson

43
et al., 2008) regarding its superior environmental performance through discretionary
disclosure channels, by using objective measure.
As signalling and voluntary disclosure theories predict a positive relationship
between environmental performance and environmental disclosure, we can assume that
superior carbon performers would try to distinguish themselves from poor carbon
performers, by making verifiable and hard disclosures to signal their good carbon
performance to various stakeholders.
Contrary to previous theories, Proprietary Costs Theory states that companies
limit voluntary disclosure of relevant information to the financial market because of
disclosure-related costs, such as preparation and competitive costs. (Verrecchia, 1983;
Dye, 1986; Darrough & Stoughton, 1990; Wagenhofer, 1990). As proprietary cost
theory provides a completely different perspective as to why some businesses do not like
to disclose at all regardless of their performance, this theory is discussed below briefly.
3.6 Proprietary Costs Theory
According to Healy and Palepu (2001), firms’ decisions to disclose information
to investors, is influenced by concern that such disclosures can damage their competitive
position in the markets. Studies such as Verrecchia (1983); Darrough and Stoughton
(1990); Wagenhofer (1990); Feltham and Xie (1992); Newman and Sansing (1993);
Darrough (1993); Gigler (1994), conclude that firms have an incentive not to disclose
information that will reduce their competitive position, even if it makes it more costly to
raise additional equity. Therefore, the managers may be unwilling to disclose more

44
information if they believe it contains proprietary information which can be harmful to
their firm (Dye, 1985; Verrecchia, 1983, 1990).
As per Prencipe (2004), proprietary costs theory considers not only the benefits,
but also the costs related to the release of information. Particularly, it states that
companies limit voluntary disclosure when proprietary costs arise from it. These costs
include not only the costs of preparing, disseminating and auditing information, but also
the cost deriving from disclosing information which may be used by competitors and
other parties in a way that is harmful for the reporting company.
Proprietary costs can be divided into two types: internal costs which include the costs of
preparing and disclosing information, and external costs which result from a
consequence of competitors’ action to use the information disclosed for their own
advantage (Prencipe, 2004). Hence, firms have an incentive to voluntarily disclose
certain information if: a) they seek some benefits from this disclosure such as reduction
in the cost of equity capital (Botosan, 1997; Botosan & Plumlee, 2002) or debt capital
(Sengupta, 1998), and the benefits of this disclosure exceeds its costs; or b) the
disclosure of this information does not harm the firm’ share value, and in turn can
facilitate a reduction in information asymmetry problems (Cotter et al, 2011).
3.7 Instrumental Stakeholder Theory
Instrumental Stakeholder Theory suggests that everything else being equal, firms
that practice stakeholder management will perform better in profitability, stability, and
growth etc. terms. It implies “certain” results can be obtained if “certain” behaviours are
adopted (Pesqueux & Damak‐Ayadi, 2005). Donaldson and Preston (1995, p. 71) claim

45
that Instrumental Stakeholder Theory can be “used to identify the connections, or lack of
connections, between stakeholder management, and the achievement of traditional
corporate objectives”. Therefore, Instrumental Stakeholder Theory could be interpreted
as research into the positive or negative links between stakeholder management and
financial performance, and into what would explain these links (Egels-Zandén &
Sandberg, 2010). Donaldson and Preston (1995. p. 67) also describe instrumental
Stakeholder Theory as “the proposition that corporations practicing stakeholder
management will, other things being equal, be relatively successful in conventional
performance terms.
3.8 Agency Theory
Agency theory describes the agency relationships between managers and
shareholders, and between shareholders and debt holders (Jensen & Meckling, 1976 and
Watts and Zimmerman, 1978, 1983). Jensen and Meckling (1976, p.308) define the
agency relationship as “a contract under which one or more persons (the principals)
engage another person (the agent) to perform some service on their behalf, which
involves delegating some decision-making authority to the agent”. Agents correspond to
managers, whereas principals correspond to shareholders, from a company’s
perspective. Agency theory is based on the problems related to the separation of
ownership and control. Agency problem may arise, when the management (agent) make
decisions on behalf of the owners/shareholder (principals).
As per Cotter et al. (2011), providers of capital, such as shareholders and
creditors, delegate strategic and operational decision making to managers. Managers

46
should therefore, act and make decisions that maximise shareholders’ value, and ensure
payment of debts to the creditors. However, as agency theory suggests, managers (the
agents) make use of their position and power for their own benefit, rather than the
benefit of shareholders and creditors (the principals). This agency problem occurs
because of separation of firm ownership and control, and is worsened by information
asymmetry problems between managers and debt holders. This information asymmetry
happens as managers have better knowledge about firm’s future value compared to
shareholders and creditors. This can result in adverse selection and moral hazard
problems, because capital providers are not sure whether managers are acting in their
best interests. Managers, shareholders and creditors all have incentives to pursue their
own interests. Monitoring and bonding devices are the most common tools used by
capital providers to reduce agency and information asymmetry problems. Jensen and
Meckling (1976) have identified three types of costs that arise due to an agency problem.
These costs are Monitoring costs, Bonding cost, and Residual loss. These costs are
briefly described below:
Monitoring Costs:
Monitoring costs are incurred when the shareholders/debt holders (principals) try
to monitor the activities of the management (agents). Jensen and Meckling (1976)
suggest that principal and agent are concerned in maximizing their own interest or
wealth, while agents (decision makers) may not take actions in the best interest of the
owners (principals). Therefore, the principal has to monitor the agents by setting up
monitoring mechanisms. Examples of monitoring devices that are used by shareholders
to ensure managers provide complete information, include the appointment of a board of
47
directors, the use of board committees, and hiring of external auditors who will audit the
financial reports (Cotter et al., 2011). The cost of undertaking the audits and cost of
having a board committee, can be referred to as monitoring costs.
Bonding Costs:
As agents are concerned with maximising their own wealth, a bonding device
needs to be established that will align the interest of the managers (agent) of the firm,
with those of the owners, the shareholders (Henderson et al., 1992). The bonding
devices that could be used are contractual agreements such as debt contracts and
compensation packages provided to managers, that bond managers’ interest to those of
the capital providers. On the other hand, managers have incentives to provide credible
information to shareholders and debt holders, and they do this by preparing audited
financial reports and other disclosures (Watson et al., 2002). Managers are required to
bond themselves to prepare these financial statements, which are costly and referred to
as bonding cost (Mamun et al., 2013). However, Jensen and Meckling (1976) argue that
agents may take action by spending resources in assuring that it would not take actions
which would not have a negative effect on the principal, which is considered as bonding
costs.
Residual Loss:
Even after monitoring and bonding costs are incurred, there may still be a loss to
the principals due to the agents making decisions that are different from those that could
maximize principals’ interest (Williamson, 1988). This loss is recognized as a residual
loss.

48
In summary, the divergence of action due to the incomplete alignment of the
interests of agents and principals, may lead to an agency problem. The sacrifice of
wealth by the principal and potential costs associated with monitoring the agents, is
known as the agency cost.
3.9 Chapter summary
In summary, The Legitimacy Theory suggests that when businesses feel there is
a lack of legitimacy due to a breach of social contract, they would make positive social
and environmental disclosure to retain their legitimacy. Stakeholder Theory suggests
that businesses would use disclosure practices as an important tool to maintain their
legitimacy and to meet its stakeholders’ expectations. Voluntary Disclosure Theory and
Signalling Theory, assume that firms with superior environmental performance will be
motivated to disclose information about their good performance practices, to
differentiate themselves from firms with inferior environmental performance, and to
signal their superior performance to the investors. Instrumental Stakeholder Theory
suggests that everything else being equal, firms that practice stakeholder management
will perform better in profitability, stability, and growth, etc. terms. Agency Theory
suggests managers (the agents) make use of their position and power for their own
benefit, rather than the benefit of shareholders and creditors (the principals). The
sacrifice of wealth by the principal and costs associated with monitoring the agents is
known as the agency cost. These theories will be used in subsequent chapters, to analyse
relevant literature, formulate hypotheses for this study, and interpret the findings of this
study. The next chapter discusses existing literature relevant to this study.
49
CHAPTER 4 LITERATURE REVIEW
4.1 Introduction
The primary objective of this chapter is to provide an extensive review of
existing literature that deal with relationship and interrelationship between carbon
disclosures, carbon performance, financial performance and agency cost. As carbon
disclosure and carbon performance are sub-sets of environmental disclosure and
environmental performance, and there are limited research on carbon disclosure and
carbon performance, this study will also shed light on existing studies that discuss the
relationship between environmental disclosure and environmental performance. This
chapter is structured as below:
Section 4.2 reviews existing research that investigates the relationship between
environmental disclosure/carbon disclosure, and environmental performance/carbon
performance. Section 4.3 provides a review of literature that deal with the relationship
between environmental performance/carbon performance and financial performance.
Section 4.4 discusses prior literature that investigates the interrelationship between
carbon performance and financial performance. Section 4.5 reviews prior literature
relevant to the relationship between carbon disclosure and financial performance.
Section 4.6 deals with the relationship between carbon disclosure/carbon performance
and agency cost. Prior studies that conducted trend analysis for improvement of carbon
disclosure and carbon performance, are discussed in section 4.7. Section 4.8 provides a
summary of the chapter.

50
4.2 Relationship between environmental disclosure/carbon disclosure
and environmental performance/carbon performance
There are vast amount of studies that examine the relationship between
environmental performance and environmental disclosure, however, findings of these
studies had been inconclusive. Some of these studies suggest a negative relationship
between environmental performance and environmental disclosure, while others suggest
a positive relationship. A few studies find no relationship between environmental
performance and environmental disclosure. On the other hand, being a very recent area
of research, there are not many studies that investigate the relationship between carbon
disclosure and carbon performance. The following sections discuss previous studies that
deal with the relationship between environmental performance/carbon performance and
environmental disclosure/carbon disclosure:
4.2.1 Relationship between environmental disclosure and environmental
performance
One of the most important studies that find positive relationship between
environmental performance and environmental disclosure is the study by Clarkson et al.
(2008). This study attempts to investigate a hitherto unresolved research issue in
environmental accounting - the empirical association between the level of corporate
environmental disclosures and corporate environmental performance. The authors revisit
this relation by testing competing predictions from economics based and socio-political
theories of voluntary disclosure, using a more rigorous research design than used in the
previous research. They find that there is a positive association between environmental
performance and the level of discretionary disclosures in environmental and social

51
reports or related web disclosures. In other words, they find superior environmental
performers are more forthcoming in truly discretionary disclosure channels, as predicted
by economics based voluntary disclosure theories. However, the results are inconsistent
with the negative association predicted by socio-political theories.
Al-Tuwaijri et al. (2004) investigate the relationships between economic
performance, environmental performance, and environmental disclosure, after explicitly
considering that these three corporate functions are jointly determined. They find that
good environmental performance is positively associated with good economic
performance. They also suggest that good environmental performance is associated with
more extensive quantifiable environmental disclosures of specific pollution measures
and occurrences.
As mentioned earlier, the theory that explains a positive relationship between
environmental performance and environmental disclosure is the Voluntary Disclosure
Theory. This theory suggests that companies have incentives to disclose ‘good news’ to
differentiate themselves from companies with ‘bad news’, to avoid the adverse selection
problem (Dye, 1986; Verrecchia, 1983). According to Voluntary Disclosure Theory,
businesses are likely to disclose their practices and performance when the perceived
benefits exceed the associated costs; especially when they want to maximise their market
value (Clarkson et al., 1992). There are benefits in disclosing positive information and
costs in disclosing negative information, especially when stakeholders are not aware of
the negative (Li et al., 1997). Voluntary Disclosure Theory, therefore predicts that
companies will selectively disclose positive information, and will disclose more positive
information if their environmental performance is good and they wish to distinguish
themselves from bad or average performers. This, coupled with pressure from some

52
investors and consumers for good environmental performance, would lead to more
positive perceptions of the firm and higher market value. They will also withhold
negative information unless conditions force them to disclose it (Dye, 1985). Bewley
and Li (2000) and Li et al. (1997), have argued that true environmental performance is
not directly observable to investors; thus, companies with superior performance tend to
make direct voluntary disclosures that cannot be easily matched by poor performers
(Clarkson et al., 2008). Hence, this theory predicts a positive association between
environmental performance and the level of discretionary environmental disclosure.
On the other hand, a high number of studies dealing with the relationship
between environmental performance and environmental disclosure, find a negative
relationship between performance and disclosure. These studies suggest companies with
inferior environmental performance make more environmental disclosures.
Clarkson et al. (2011) examine how the environmental information voluntarily disclosed
by a sample of Australian firms, relates to their underlying environmental performance.
They focus on both the level and nature of environmental disclosures found in annual
reports and stand-alone environmental or sustainability reports, and score the disclosures
using an index developed by Clarkson et al. (2008) based on Global Reporting Initiative
(GRI) Guidelines. The study, consistent with predictions of socio-political theories, finds
that firms with greater emissions (a higher pollution propensity) make more
environmental disclosures in total.
Freedman et al. (2004) and Freedman and Stagliano (2008) assess the association
between environmental performance and environmental reporting of US electric utilities
affected by the 1990 Clean Air Act (CAA). The emission of Sulphur Dioxide (SO2) is
used as the measure for environmental performance. From the examination of the annual

53
reports and 10Ks of 38 companies in 1990 and 1995, Freedman et al. (2004) find that
companies with higher SO2 emissions level, greater number of power plants targeted for
SO2 emissions reduction under the CAA and SO2 emissions allowance shortfall,
published greater SO2 emissions disclosure. Freedman and Stagliano (2008), examine
the SO2 emissions disclosure of 32 electric utilities in 1999 and 2001. They consider all
disclosure made in the annual reports, 10Ks and stand-alone reports and on the company
websites. Companies with higher SO2 emissions level that did not meet the SO2
emissions standard and needed more SO2 emissions allowance made extensive SO2
emissions disclosure.
Berthelot et al. (2003) summarise the reasons for an organisation to increase its
environmental disclosure. One of the reasons they find is poor environmental
performance.
Cho and Patten (2007) and Patten (2002a, 2002b), observe that companies with poor
environmental performance would be subject to greater exposure to the potential public
and regulatory scrutiny, than companies with relatively better environmental
performance. Their studies suggest that poor environmental performance leads to higher
level of environmental disclosure.
Deegan and Rankin (1996) investigate the environmental reporting practices of a
sample of 20 Australian companies which were successfully prosecuted by the New
South Wales and Victorian Environmental Protection Authorities, during the period
1990-1993. This study finds that organisations (both prosecuted and non-prosecuted) are
not very willing to provide any information within their annual reports about any
negative environmental implications of their operations. This is consistent with findings
of previous studies. The prosecuted firms provided significantly more positive

54
environmental disclosures than non-prosecuted firms. This implies that firms which have
been prosecuted tend to counter the negative news of their prosecution with positive
news about their environmental initiatives.
Some other prior empirical research such as Brammer and Pavelin (2006); De
Villiers and Van Staden (2009); Gray et al. (1996); Hackston and Milne (1996), provide
evidence on the predisposition of poor environmental performers, to disclose extensive
environmental disclosure and/or highlight positive environmental actions while
suppressing negative environmental effects.
The negative relationship between environmental performance and
environmental disclosure could be explained by Legitimacy Theory and Stakeholder
Theory. According to these theories, businesses with poor carbon performance would
disclose positive but unverifiable information about their environmental performance to
maintain legitimacy, positively influence perceptions of stakeholders, and avoid any
possibility of litigation. Therefore, it can be assumed that companies with inferior
environmental performance would make more environmental disclosure
In additon, there are few studies that find no relationship between environmental
performance and environmental disclosure. By comparing the content analysis ratings of
Environmental Information Disclosure (EID) in annual reports, with environmental
performance ratings obtained from the Council on Economic Priorities (CEP), Ingram
and Frazier (1980) show that there is no association between environmental performance
and EID. After studying the 26 largest CEP-rated companies in the US, based on an EID
index comprising 18 items across four categories, Wiseman (1982) obtains the same
results. Freedman and Wasley (1990) examine 49 CEP-rated companies and found that

55
neither the annual report nor the 10-K environmental report, was indicative of a firm's
actual environmental performance.
Sutantoputra et al. in their 2012 study, identify the level of environmental
disclosure of 53 ASX200 Australian listed companies and test whether better-performing
companies with either lower emissions or more positive Corporate Monitor
environmental ratings, were likely to disclose more information on their environmental
performance. This research finds no evidence that good performers disclose more as a
way of promoting themselves and separating themselves from poor performers, or that
poor environmental performers disclose more by relaying as much positive information
as they can to try to improve their public image.
4.2.2 Relationship between carbon disclosure and carbon performance
As carbon disclosure is a very new area of research, there are not many studies
that investigate the relationship between carbon disclosure and carbon performance.
Some of the most relevant studies are discussed below:
Peng et al. (2015) use hand-collected data from the annual CSRs of listed
companies in China during 2008–2010, to investigate two questions: (i) what factors
cause the companies’ decisions of whether or not to make carbon information disclosure
and (ii) what forces influence the extent to which carbon emission information is
disclosed. In this paper, they examine both external and internal factors, and they find
that companies operating in high-emission sectors are more likely to make carbon
information disclosure and tend to disclose more information. In addition, firms which
have better performance are more willing to make the carbon information disclosure, but
the content of their disclosure does not significantly differ from those with relatively

56
poorer performance. This study also shows that a company may be more likely to make
carbon information disclosure when the number of industry competitors engaging in
carbon information disclosure increases. Finally, the study results suggest that
companies’ decisions of whether to make carbon information disclosure may follow the
moves of their industry peers.
Freedman and Jaggi (2004) examine the association between CO2 emissions and
environmental disclosure. They investigate the disclosure made in the annual reports and
10Ks of 66 US electric utilities. They find that only one-third of emitters made such
disclosures. They observe that companies with a higher level of CO2 emissions provide
more disclosure, and company size (total assets), profitability (return on equity) and
market risk (beta), does not influence the extent of the CO2 emissions disclosure.
Sullivan and Kozak (2006) study the climate change disclosure of European
electricity utilities. They observe that although many of the European electricity utilities
reviewed provided a significant amount of information on their greenhouse gas
emissions and related aspects of their business strategy, the majority did not provide
sufficient information as needed by an institutional investor. Information provided by
the companies did not explain how climate change issues were factored into business
decision making or overall strategy, and most of the company reporting focused on
historic performance rather than on the consideration of future trends in policy and
company emissions.
Alrazi et al. (2010) examine the quality and the determinants of the
environmental reporting published by 51 electric utilities from several countries. They
find that the quality of the reporting was relatively high. The association between
environmental performance and environmental reporting is only significant for CO2

57
emission disclosures in the annual reports (not on websites). Companies from code law
countries produce higher quality environmental information than companies from
common law countries. Law enforcement and company size are positively associated
with CO2 emissions disclosure.
Cotter and Najah (2012) re-investigate the relationship between environmental
performance and carbon and climate change related disclosure. They also examine the
consequence of implementing carbon risk management and disclosure on both investors
and non-investor stakeholders. The results of this study show that carbon risk
management is significantly and positively associated with carbon disclosure quality that
is made via CDP and sustainability reports, and thereby support the economics-based
disclosure theories. Companies with good carbon risk management records disclose such
information to separate themselves from inferior firms. These disclosures assist firms to
reduce information asymmetry problems between the firm and external parties,
especially its investors. This research also finds that while the firms' management has
committed to reduce their carbon emission levels and adopted several strategies to
mitigate climate change risks, these practices have neither reduced the ex-ante cost of
equity capital nor increased the market value. In general, the results suggest that
although investors are gradually becoming more interested in climate change
information; the use of this data among mainstream investors is yet not very common.
The last finding of this study shows that although carbon disclosure is not associated
with non- investor stakeholders’ perceptions, carbon risk management is positively and
significantly associated. This could lead to a conclusion that instead of using disclosures,
firms’ management uses their carbon risk management activities to influence non-
investor stakeholders’ perceptions about these activities.

58
Cotter et al. (2011) investigate three important issues in climate change reporting
in the Australian context. It explores (a) the gaps between regulatory requirements and
authoritative guidance regarding climate disclosure in Australia, (b) reporting practices
in this area, and (c) the demands for increased disclosure and standardization of that
disclosure. The study result indicates that there seems to be a lack of sufficient
disclosure in company reports and websites about several aspects of climate change
impacts and their management. The results also show that the disclosures that are made
tend to lack technical detail and are somewhat skewed towards the more positive aspects
of climate change impacts and management.
Rankin et al. (2011) use institutional governance systems theory to examine
hypothesized links between voluntary Australian corporate GHG disclosures, internal
organizational systems, and private regulation, that guide GHG disclosures as evidence
of reported corporate response to climate change. The study finds evidence of proactive
corporate GHG disclosures within the “market governance system” in existence in
Australia in 2007 where companies operated in a public policy vacuum in relation to
climate change. Results of the two model analyses indicate that firms which disclose
GHG emissions information are more likely to have also implemented an environmental
management system (EMS), have stronger governance systems, make publicly available
disclosures to the CDP, are larger, and operate in either the energy and mining or
industrial sector. When the authors examine the extent and credibility of disclosures by
the sub-sample of 80 firms that disclose GHG emissions data, they find that those firms
are more likely to have an EMS that is ISO 14001-certified, use the Global Reporting
Initiative (GRI) to guide sustainability disclosures, and disclose to the CDP, with those
disclosures being publicly available. In addition, larger firms in the mining and energy
59
and industrial sectors are also more likely to disclose credible GHG emissions
information guided by ISO 14064-1.
4.2.3 Summary of previous studies dealing with the relationship between
environmental disclosure/carbon disclosure and environmental performance
/carbon performance
In summary, findings of previous studies dealing with environmental
disclosure/carbon disclosure and environmental performance/carbon performance, show
inconclusive results. Studies such as Clarkson et al. (2011), Freedman et al. (2004),
Freedman and Stagliano (2008), Berthelot et al. (2003), Cho and Patten (2007), Patten
(2002a, 2002b), and Deegan and Rankin (1996), predict that poor environmental
performance will lead businesses to make higher level of environmental disclosures.
Freedman and Jaggi (2004) predict a negative association between carbon performance
and carbon disclosure. On the other hand, studies such as Clarkson et al (2008), and Al-
Tuwaijri et al. (2004), suggest that superior environmental performers will make more
extensive quantifiable disclosure. Similar results are found from studies that examine
relationship between carbon disclosure and carbon performance. Studies such as Peng et
al. (2015), and Cotter and Najah (2012), predict positive association between carbon
performance and carbon disclosure

60
4.3 Relationship between environmental performance/carbon
performance and financial performance
As mentioned earlier, the study of carbon performance is a relatively new field of
study which falls under the broad area of environmental performance. Therefore, before
discussing the relationship between carbon performance and financial performance, the
relationship between environmental performance and financial performance will be
discussed first. A vast amount of research have been done to predict impact of firm’s
environmental performance on its financial performance. However, these studies largely
produce conflicting findings. While the majority of the studies indicate a positive impact
of firm’s environmental performance on its financial performance, a good number of
studies indicate negative impact and some even show no impact.
The following sections will review existing literature and theories in order to understand
the relationship between environmental performance and financial performance, and
carbon performance and financial performance.
4.3.1 Relationship between environmental performance and financial performance
Jaggi and Freedman (1992) evaluate the impact of pollution performance of pulp
and paper firms in the United States, on their economic and market performance.
Pollution performance measurement is based on a pollution index developed from
pollution emission reports filed with the regional offices of the Environmental Protection
Agency by pulp and paper firms for their individual plants. Economic performance is
measured by Net Income, ROE, ROA, Cash flow/Equity and Cash flow/Assets; market
performance is measured by the PE ratio and systematic risk. The association between

61
the pollution index and economic and market performance variables is tested by the
Pearson Correlation Coefficients. The results of this study indicate that, in the short run,
pollution performance is negatively associated with economic performance, and that the
markets do not reward good pollution performance.
Cordeiro and Sarkis (1997) argue that studies that try to evaluate the relationship
between corporate environmental pro-activism and financial performance by using
historical corporate accounting performance and stock market measures of performance,
do not yield any consistent pattern of relationship between firm’s environmental pro-
activism and financial performance. The authors revisit this relationship using a novel
measure of firm performance: security analyst earnings forecasts. Their study
demonstrates a significant, negative relationship between environmental pro-activism
(using Toxic Release Inventory data) and industry analyst 1- and 5-year earnings-per-
share performance forecasts for a sample of 523 US firms in 1992.
Filbeck and Gorman (2004) utilize data from the Investor Responsibility
Research Centre as well as a proprietary database, to investigate the relationship
between environmental performance and financial performance of electric utilities in the
United States. They chose this sector because, as producers and distributors of energy,
utilities produce substantial amounts of pollution. Their result differs from many of the
earlier studies in that they do not find a positive relationship between holding period
returns and an industry-adjusted measure of environmental performance. They in fact,
find evidence of a negative relationship between financial return and a more pro-active
measure of environmental performance.
Wagner et al. (2002) examine the relationship between the environmental and
economic performance of firms in the European paper manufacturing industry. It

62
initially discusses possible functional relationships between environmental and
economic performance rooted in different theoretical frameworks and links these to
recent empirical and theoretical analyses of the Porter hypothesis. Following this, it
reports the results of an empirical study carried out in the European paper industry.
Findings of the study fit better with ‘traditionalist’ reasoning about the relationship
between environmental and economic performance, which predicts the relationship to be
uniformly negative.
Sarkis and Cordeiro (2001) investigate separately the differential relationships
between pollution prevention and end-of-pipe efficiencies, with a short-run financial
performance which is measured using return on sales (ROS). After controlling for both
firm size and financial leverage, the authors find that for 482 US firms in 1992, pollution
prevention and end-of-pipe efficiencies are both negatively related to ROS, and that this
negative relationship is larger and more significant for pollution prevention efficiencies.
These findings contradict studies that argue waste minimization, recycling,
remanufacturing, and other environmental practices, will greatly enhance the “bottom-
line” for organisations.
As mentioned earlier, the traditional view among scholars regarding
environmental protection, is that it comes at an additional cost imposed on firms, which
may weaken their global competitiveness. This traditional paradigm was challenged by
Professor Michael Porter (Porter, 1991) and his co-author Claas van der Linde (Porter
and van der Linde, 1995). Based on case studies, the authors suggest that pollution is
often a waste of resources, and that a reduction in pollution may lead to an improvement
in the productivity where the resources are used. More stringent but properly designed
environmental regulations (in particular, market-based instruments such as taxes or cap-

63
and-trade emissions allowances) can “trigger innovation that may partially or more than
fully offset the costs of complying with them” in some instances (Porter and van der
Linde, 1995). This view is famously known as the Porter Hypothesis.
Albertini (2013) suggests that although the relationship between corporate
environmental performance and financial performance has received a high degree of
attention in research literature, the results of these studies are still contradictory. This
article integrates prior research studying this relationship, and identifies the potential
moderators that may have played a role in the apparent inconsistent results observed to
date. They conduct a meta-analysis of 52 studies over a 35-year period that confirms a
positive relationship between environmental performance and financial performance.
Moderators’ analysis reveals that the relationship is significantly influenced by the
environmental and financial performance measures, the regional differences, the activity
sector, and the duration of the studies.
Song et al. (2017) examine the relationship between environmental management
and financial performance of Chinese listed firms from 2007 to 2011. Results of the
study indicate that environmental management is significantly positively related to
financial performance in the following year, implying that environmental management
can significantly improve future profitability. However, as environmental investment
consumes capital and resources, results indicate that environmental management is not
significantly related to improved financial performance in the current year – rather, it
will improve the financial performance in the following year.
Salama (2005) argues that conventional estimates of the relationship between
corporate environmental performance and corporate financial performance, are not very
robust as they are typically based on simple ordinary least squares (OLS) regression. In

64
this paper, the author tests whether this relationship holds using median regression
analysis that is more robust to the presence of outliers and unobserved firm
heterogeneity. Based on panel data of 239 British companies, the study finds that the
relationship between corporate environmental performance and corporate financial
performance, is stronger when median regression is used.
Stefan and Paul (2008) aim to review empirical evidence of improvement in
environmental performance causing improvement in economic or financial performance.
Their findings suggest that improvement in environmental performance is likely to help
businesses improve their financial performance, either by increasing revenue or by
reducing costs.
Improvement in environmental performance may help increase in revenue by:
a) Providing firms, selling to the public sector and other businesses, better access to
certain markets. b) Helping firms to differentiate their products given that credible
information about the environmental features of the product is available, consumers are
willing to pay, and there is barrier to imitation and c) helping firms to sell pollution
control technologies when firms already have R&D facilities.
Improvement in environmental performance can help in cost reduction for
a) industries that are highly regulated and scrutinized by the public, such as chemical,
energy, pulp and paper, metallurgy, etc. b) firms that have a flexible production process
c) firms that are in highly competitive industries where optimization of resources is
important d) firms that are in industries where market-based environmental policies are
implemented and d) firms that already have R&D facilities.
Improvement in environmental performance can also help in reducing the cost of
capital for firms with shares traded on stock markets. It can also help in reducing the

65
cost of labour for firms whose emissions may affect their workers’ health, who seek to
attract young, well-educated workers, and which are located in areas where sensitivity to
environmental concerns is important.
Drawing on the resource-based view of the firm, Russo and Fouts (1997) posit
that environmental performance and economic performance are positively linked, and
that industry growth moderates the relationship, with the returns to environmental
performance higher in high-growth industries. They test these hypotheses with an
analysis of 243 firms over two years, using independently developed environmental
ratings. Results indicate that "it pays to be green", and that this relationship strengthens
with industry growth.
On the other hand, Elsayed and Paton (2005) conduct static and dynamic panel
data analysis of the link between the environmental performance of 227 UK firms, and
their financial performance. The results of the study imply that environmental
performance has a neutral impact on firm performance. This finding is consistent with
theoretical work suggesting that firms invest in environmental initiatives until the point
where the marginal cost of such investments equals the marginal benefit.
Iwata and Okada (2011) examine the effects of environmental performance on
financial performance using data from Japanese manufacturing firms from 2004 to 2008.
The authors consider two different environmental issues of waste emission and
greenhouse gas emissions, as proxies for environmental performance. In addition, to
clarify how each financial performance responds to a firm's effort in dealing with
different environmental issues, they utilise many financial performance indices
reflecting various market evaluations. The estimation results of the study show different
effects of each environmental performance on financial performance. Waste emissions

66
do not generally have significant effects on financial performance. On the other hand,
greenhouse gas reduction leads to an increase in financial performance in the whole
sample and in clean industries, although it does not have significant effects on financial
performance in dirty industries. Furthermore, as the firm growth rate increases, the
partial effects of waste emissions on financial performance decrease, whereas the partial
effects of greenhouse gas emissions on financial performance increase.
4.3.2 Relationship between carbon performance and financial performance
Similar to the relationship between environmental performance and financial
performance, existing literature have produced conflicting results regarding the
relationship between carbon performance and financial performance. However, in the
case of the relationship between carbon performance and financial performance, the
majority of the studies predict a positive relationship while a few predict a negative and
mixed or no relationship.
Ennis et al. (2012) analyses the relationship between emissions performance and
financial performance of FTSE 350 companies over the period 2006-2009. They find a
positive relationship between changes in emissions and changes in revenue. This means,
if carbon emission increases and therefore carbon performance decreases, revenue will
increase. They find that emissions levels are not presently drivers of stock prices. They
also find that the financial market is not yet responsive to the carbon performance of
companies.
Using carbon emissions data for 2006 to 2008 that S&P 500 firms disclosed
voluntarily, Matsumura et al. (2013) predict and find a negative association between
carbon emissions and firm value. They find that the capital markets integrate both

67
carbon emissions and the act of voluntary disclosure of this information into their firm
valuations. The markets penalize all firms for their carbon emissions; firms that do not
disclose their carbon emissions face a further penalty for non-disclosure.
The study by Wang et al. (2014) focuses on the relationship between GHG
emissions and financial performance in Australia. Based on the 2010 GHG emission
dataset from 69 Australian public firms listed on the ASX 200, the authors propose new
linear regression models to investigate the relationship between GHG emissions and
Tobin's Q. After carefully controlling for the effect of a number of variables on firm-
level financial performance, they find that Tobin's Q is positively related to GHG
emissions in Australia. Increase in GHG emission would decrease carbon performance.
So, the findings of this study prove a negative relationship between financial
performance and carbon performance. Such a positive relationship between corporate
financial performance and GHG emissions advocates the win–lose reasoning argued in
the literature, that money spent on GHG reductions would possibly harm firm
competitiveness.
On the other hand, Boiral et al. in their 2012 study, aim to propose an integrated
model of the determinants of corporate strategies to reduce GHG emissions and their
impacts on environmental and economic performance, based on a survey of 319
Canadian manufacturing firms. They argue that the analysis of the relationship between
carbon emissions and corporate performance is polarised around two main approaches:
(i) the win-lose approach and (ii) the win-win approach. The first approach suggests that
the efforts that companies make to reduce their carbon emissions lead to costs that are
detrimental to their competitiveness. By contrast, the second approach suggests that
reductions to carbon emissions increase firm competitiveness and thus sustainable

68
competitive advantage. The results of the study, show that, in Canada, the industrial
firms most committed to tackling climate change tend to have better financial
performance than other firms. This confirms, in broad terms, the hypothesis of a win-
win relationship between the commitment to reduce GHG emissions and financial
performance.
Gallego-Álvarez et al. (2015) analyse the impact of the variation in carbon
dioxide emissions on financial and operational performance. By using international data
consisting of 89 companies for the period 2006 to 2009, the findings show a reduction in
emissions that generate a positive impact on financial performance. Overall, this
research shows that companies promote greater environmental behavior in order to
obtain higher financial performance.
Wang et al. (2016) in their study attempt to investigate the relation between
carbon performance and financial performance. They use a sample of US S&P 500
corporations and use emissions reduction to measure carbon performance and Tobin’s Q
to measure financial performance. The results show a positive relation between carbon
performance and financial performance. In addition, they find firms with better financial
performance tend to be more transparent in carbon disclosure. The authors also argue a
higher degree of correlation between carbon performance and financial performance
indicates that managers who have financial and social obligations and who have chosen
carbon projects have not only improved firm green image but have also generated
tangible economic benefit for their organizations.
Nishitani et el. (2014) analyse how a firm’s management of greenhouse gas
emissions affects its economic performance. They use the theoretical model from Cobb–
Douglas production and inverse demand functions, which predict that in conducting

69
GHG emissions management, a firm will enhance its economic performance because it
promotes an increase in demand for its output and improves its productivity. The results
of the study which uses panel data on Japanese manufacturing firms during the period
2007–2008, support the view that a firm’s GHG emissions management enhances a
firm’s economic performance through an increase in demand and improvement in
productivity - however, the latter effect is conditional. Although a firm’s efforts to
maintain lower GHG emissions improves productivity, efforts to reduce GHG emissions
further, does not always improve it, especially for energy-intensive firms. Because firms
attempting to maintain lower GHG emissions are more likely to improve their
productivity, there is a possibility that firms with high GHG emissions can also enhance
economic performance by reducing their emissions in the long term, even if additional
costs are incurred. In addition, better GHG emissions management increases the demand
of environmentally conscious customers because a product’s life cycle GHG emissions
in the upper stream of the supply chain influence those in the lower stream, and
customers evaluate the suppliers’ GHG emissions management in terms of green supply-
chain management.
Nishitani and Kokubu (2012) examine the influence of firms' reductions of
greenhouse gas emissions on firm value, measured by Tobin's Q. In this study, the
authors argue that if the stockholders/investors regard the reduction of GHG emissions
as a form of intangible value, the reduction of GHG emissions will enhance firm value.
To prove this relation more precisely, they analyse not only the effect of the reduction of
GHG emissions on firm value but also that of the market discipline imposed by the
stockholders/investors in terms of the reduction of GHG emissions. Using data on 641
Japanese manufacturing firms in the period 2006-2008, the study finds that firms with

70
strong market discipline imposed by stockholders/investors, are more likely to reduce
GHG emissions, and consequently, firms that reduce more GHG emissions are more
likely to enhance firm value.
Griffin et al. (2012) analyse US and Canadian companies’ disclosures of
greenhouse gas emissions to the Carbon Disclosure Project (CDP) over a number of
years. This study analyses the relationship between voluntary greenhouse gas emission
disclosures and company stock price. The stock price analysis generates two key
findings: one, that greenhouse gas emission levels associate negatively with stock price,
although the valuation effects are more incrementally more pronounced for S&P 500
versus TSE 200 companies and, two, that the negative valuation effects are stronger for
emission-intensive industries such as utilities, energy, and materials.
Delmas and Nairn-Birch (2011) conduct an empirical analysis based on a
longitudinal database including over 1100 US firms across a range of industries for the
period 2004-2008. This study investigates the impact of greenhouse gas emissions on
corporate financial performance, and develops complementary hypotheses based on
accounting and market based corporate performance measures, to represent a short-term
and long-term perspective on financial performance. Their results reveal that increasing
carbon emissions positively impact financial performance when using accounting-based
measures such as ROA, while it has a negative impact on market-based measures of
financial performance such as Tobin’s Q. This implies that carbon performance is
negatively related to financial performance when it is measured by ROA, while carbon
performance is positively related to financial performance when it is measured by
Tobin’s Q.

71
Hart and Ahuja (1996) analyse the relationship between emission reductions and
firm performance by using data from US firms obtained from Standard and Poor's 500
list for 1989 to 1992 and found no unanimity among emission reductions and operational
and financial performance.
4.3.3 Summary of previous studies dealing with the relationship between
environmental performance/carbon performance and financial performance
While the majority of the studies suggest a positive relationship between
environmental performance/carbon performance and financial performance, a large
number of studies predict a negative relationship as well. Jaggi and Freedman (1992)
predict that in the short run, pollution performance is negatively associated with
economic performance and that the markets do not reward good pollution performance.
Cordeiro and Sarkis (1997) demonstrate a significant negative relationship between
environmental pro-activism and industry analyst earnings-per-share. Filbeck and
Gorman (2004) find evidence of a negative relationship between financial return and a
more pro-active measure of environmental performance. Sarkis and Cordeiro (2001) find
that pollution prevention and end-of-pipe efficiencies are both negatively related to
ROS. Ennis et al. (2012) find if carbon emission increases and therefore carbon
performance decreases, revenue will increase. They also find that emissions levels are
not presently drivers of stock prices. According to them, the financial market is not yet
responsive to the carbon performance of companies.
Matsumura et al. (2013) predict and find a negative association between carbon
emissions and firm value. They observe that markets penalise all firms for their carbon
72
emissions. Wang et al. (2014) find that when measured by Tobin’s Q, financial
performance is negatively related to carbon performance.
On the other hand, Porter and van der Linde (1995) suggest that improvement in
environmental performance may lead to an improvement in productivity and can trigger
innovation that may partially or more than fully offset the costs of complying with them
in some instances, and therefore, will improve the financial performance of the firm.
Albertini (2013) and Salama (2005) confirm a positive relationship between
environmental performance and financial performance. Stefan and Paul (2008) suggest
that improvement in environmental performance is likely to help businesses improve
their financial performance either by increasing revenue or by reducing costs. Russo and
Fouts (1997) posit that environmental performance and economic performance are
positively linked, and that industry growth moderates the relationship, with the returns to
environmental performance higher in high-growth industries. Song et al. (2017) indicate
that as environmental investment consumes capital and resources, environmental
management is not significantly related to improved financial performance in the current
year - rather it will improve the financial performance in the following year.
Boiral et al. (2012) predict two possible relationships between carbon
performance and financial performance: the win-lose approach and win-win approach.
Findings of their study confirm a win–win relationship between the commitment to
reduce GHG emissions and financial performance. Gallego-Álvarez et al. (2015) show
that reduction in emissions, which would improve carbon performance, generates a
positive impact on financial performance of a company. Wang et al. (2016) show a
positive relation between carbon performance and financial performance. Nishitani et el.
(2014) support the view that a firm’s GHG emissions management enhances a firm’s

73
economic performance through an increase in demand and improvement in productivity.
Nishitani and Kokubu (2012) suggest that if the stockholders/investors regard the
reduction of GHG emissions as a form of intangible value, the reduction of GHG
emissions will enhance firm value. Griffin et al. (2017) found that if carbon performance
improves, stock price also increases and vice versa. Delmas and Nairn-Birch (2011)
suggest that carbon performance is negatively related to financial performance when it is
measured by ROA while carbon performance is positively related to financial
performance when it is measured by Tobin’s Q.
4.4 Interrelationship between carbon performance and financial
performance
This study could not find any existing study that investigates the interrelationship
between carbon performance and financial performance. However, it found two studies
that deal with the interrelation between environmental performance and financial
performance. Nakao et al. (2007) perform statistical analyses of five years’ financial
data from approximately 300 listed firms of Japan as well as the results of the Nikkei
environmental management surveys. Nikkei environmental management survey is an
annual survey that assesses the environmental management of Japanese companies and
recognizes initiatives toward sustainability in terms of both environment and business
management. The study finds that firm’s environmental performance has a positive
impact on its financial performance and vice versa. However, this tendency for positive
two-way interactions appears to be only a relatively recent phenomenon. The tendency
for realising the positive two-way interactions is not limited to the top-scoring firms in

74
terms of both financial and environmental performance. On the contrary, this is also a
trend that can be observed fairly generally among the firms covered by the Nikkei
environmental management surveys. Indices such as ROA, earnings per share and
Tobin’s Q are all useful in representing the financial performance of the firms. Earnhart
and Lizal (2006) analyse the effects of ownership structure on corporate environmental
performance, and examine the relationship between financial performance and
environmental performance by using an unbalanced panel of Czech firms from 1993 to
1998. Their analysis provides evidence that greater profitability improves environmental
performance by allowing a firm to generate internal financial resources that may be used
for emission-reducing investments.
4.5 Relationship between carbon disclosure and financial performance
This study could not find any major existing research that investigates the
relationship between carbon disclosure and financial performance. Even the relationship
between environmental disclosure/corporate social performance disclosure, and financial
performance are not well researched. The limited research that have been done in this
area have produced conflicting results. Belkaoui (1976) examines the stock market
reaction to pollution disclosure made in annual reports. The study finds that the stock
market return of firms that disclosed environmental information yields higher returns
than those firms that did not. Some researchers such as Berman et al., 1999; Brammer
and Pavalin (2006); Weber et al. (2008) and Tang et al. (2012), argue that there should
be a positive relationship between the disclosure of Corporate Social Responsibility
(CSR) performances and company financial performances. The reasoning is that by

75
reporting and improving their CSR work, companies can receive the reputation as good
company citizens, thus can attract investors as well as other stakeholders. The results of
a study by Chen et al. (2015) show that improved corporate social performance as well
as more transparent disclosures of corporate social performance would have a strong
relationship with improving the internal utilisation of financial resources of the
companies. But such corporate social performance and its disclosures, are not
necessarily improving the company's external financial performances.
On the other hand Freedman and Jaggi (1988) examine the association between
the extent of pollution disclosure and economic performance of firms belonging to four
highly polluted industries - namely paper and pulp, oil refinery, chemical and steel.
Ratios are used to measure economic performance. The results of the study indicate that
there is no association between the extensive of pollution disclosure and economic
performance.
4.6 Relationship between carbon disclosure/carbon performance and
agency cost
There are only a few studies that investigate the relationship between disclosure
and agency cost. Existing literature that deals with this relationship are discussed below:
As explained before, the agency relationship between managers and owners lead to
information asymmetry problem because managers can access information more than
shareholders. According to Barako et al. (2006), voluntary disclosure is used by
managers as a means of mitigating the agency problem, whereby they disclose more
voluntary information to reduce the agency costs. Voluntary disclosure is also used as a

76
means to convince the external users that managers are acting in an optimal way
(Watson et al., 2002). Borghei-Ghomi and Leung (2013), opine that GHG voluntary
disclosure can be regarded as a means by which firms can reduce information
asymmetry about GHG and the subsequent agency costs. Results of their study find a
positive association between the level of GHG voluntary disclosure, firm size and
corporate governance. In other words, it could be inferred that disclosing firms seek to
reduce information asymmetry and the subsequent agency costs. According to Gray et
al. (1995) management has superior information than outsiders, regarding the firms’
operations. Investors demand information for monitoring contracts with companies and
assessing companies’ valuation. As a result, firms will be motivated to disclose
information voluntarily as disclosure may help them to obtain resources on the best
terms and conditions. Richardson and Welker (2011) argue that as per agency theory, the
information asymmetry increases agency costs. Hence, companies may voluntarily
choose to disclose information to reduce both information asymmetry and agency costs.
This study could not find any existing research that investigates the relationship between
carbon performance and agency cost.
4.7 Trends in the improvement of carbon disclosure and carbon
performance
There is lack of research that studies the trends in improvement of carbon
disclosure and carbon performance by businesses over the years. The available studies
are discussed below:

77
Choi et al. (2013) analyse the corporate reaction of Australia’s largest 100 companies
over the period of 2006 to 2008 when the Australian government announced a series of
regulations with regard to carbon emission disclosure. Over their study period, the
percentage of Australian companies providing meaningful information on environmental
factors including carbon emissions had increased substantially from 42% to 67%. In
addition, the quality of that information had also improved in all areas including
assessments of risks and opportunities provided by climate change, detailed disclosures
of carbon emissions, quantification of energy consumption from different sources,
strategies to reduce carbon emissions, and proper accountability for climate change
strategies. The study also reveals that during the study period 1) the number of
companies acknowledging and identifying the risk of climate change has doubled 2)
firms disclosing strategies to achieve a reduction of future carbon emissions has almost
doubled. 3) The number of companies reporting information of the change in carbon
emissions almost trebled and 4) details of carbon emission accountability increased
almost fivefold. Industries showing most significant changes in the disclosure quality,
included Materials, Consumer Staples, Industrials, Financial, and Consumer
Discretionary. The results also showed that larger firms with higher profitability tend to
make more quality disclosures.
The study by Kolk et al. (2008) aims to study corporate responses towards
climate change related to the development of reporting mechanisms for greenhouse
gases, in particular, carbon disclosure. Analysis of responses of this study indicates that
CDP has been successful in using institutional investors to ask firms to disclose
extensive information about their climate change activities. The authors agree that
response rates in terms of numbers of disclosing firms are impressive and growing.

78
However, neither the level of carbon disclosure that CDP promotes nor the more
detailed carbon accounting, provide information that is particularly valuable for
investors, NGOs or policy makers. They also argue that although carbon disclosure as a
project of commensuration, has achieved some progress in technical terms, it has
achieved very little in relation to the cognitive and value dimensions.
Stannay (2013) examines three disclosures (answering the questionnaire,
disclosing emissions and accounting methodology) made to the CDP by S&P 500 firms,
for the years 2006 through 2008. The frequencies of the three disclosures increased from
2006 to 2008. The disclosure patterns over the three years suggest that firms’ disclosures
are routine since once most firms begin to make a disclosure, they continue to do so. The
estimations found that the most significant factor in a firm’s subsequent disclosure
(answering, emissions, and accounting) is its previous disclosure. For the two
disclosures, answering the questionnaire and emissions, that have higher frequencies
during the period, the regulatory proxy is not significant. The finding that the majority of
firms answer the questionnaire, but do not disclose their emissions or how they account
for these emissions, supports and contributes to the legitimacy literature, which predicts
that a firm will answer the questionnaire, but not disclose its GHG emissions or how it
accounts for them. By answering the questionnaire, a firm avoids scrutiny, a primary
motivation for disclosing according to the Legitimacy Theory. In particular, when a firm
answers the questionnaire, it deters the possibility of being targeted by a shareholder
resolution. By making selective disclosures, that is answering the questionnaire, but not
disclosing emissions or accounting methodology, firms circumvent the intent of
voluntary reporting schemes such as the CDP. The ability to avoid potential costs from

79
voluntary schemes suggests a problem in relying on them to address climate change
(King and Lenox, 2000).
Staney and Ely (2008) examine the factors associated with US S&P 500 firms’
decision to disclose information requested by institutional investors through CDP about
the current and projected effects of climate change. The results of the study support
voluntary disclosure theories. It shows that firms subject to more scrutiny because of
their size, previous disclosures, and foreign sales, are more likely to respond to the CDP
questionnaire. During the study period, voluntary disclosure via the CDP questionnaire
increased from 48 to 58% for S&P 500 firms. Out of the 42% firms who did not answer
the questions posed by the CDP, 15% responded but declined to provide any
information, and 22% did not respond all. This lack of response is surprising as the
institutional investors who requested this information have a large ownership interest in
these firms. The study does not find that firms in carbon-intensive industries are more
likely to disclose. It also does not find any positive relation between disclosure and
investment in new assets. This prompts the authors to believe that while companies may
be investing in new assets, they might not be investing in assets that minimize carbon
emissions, or else they would have disclosed this information to institutional investors.
4.7.1 Summary of previous studies dealing with trends in improvement of carbon
disclosure and carbon performance
There are insufficient studies that analyse the trends in improvement of carbon
disclosure over time. Choi et al. (2013) find that over the period of 2006 to 2008 when
the Australian government announced a series of regulations with regard to carbon
emission disclosure, the percentage of Australian companies providing meaningful

80
information on environmental factors including carbon emissions, had increased
substantially from 42% to 67%. Kolk et al. (2008) find that response rates in terms of
numbers of firms disclosing carbon information to CDP, are impressive and growing.
Stannay (2013) examines three disclosures (answering the questionnaire, disclosing
emissions and accounting methodology) made to the CDP by S&P 500 firms for the
years 2006 through 2008. The study finds that frequencies of the three disclosures
increased from 2006 to 2008. Staney and Ely (2008) find that during the study period,
voluntary disclosure via the CDP questionnaire increased from 48 to 58% for S&P 500
firms.
4.8 Chapter summary
This chapter provides a background for this study by discussing existing
literature that investigates the relationship and interrelationship between environmental
disclosure/carbon disclosure and environmental performance/carbon performance;
between environmental performance/carbon performance and financial performance;
between carbon disclosure and financial performance; between carbon disclosure/carbon
performance and agency cost and the trends in improvement of carbon disclosure and
carbon performance. Finding of these studies will be useful in interpreting the results of
this study. The next chapter will develop the hypotheses of this study.

81
CHAPTER 5 HYPOTHESIS DEVELOPMENT
5.1 Introduction
Based on the research gap identified in chapter 4, this chapter develops the
hypotheses of this study by utilising relevant theories and a number of conceptual
frameworks developed in this study. These hypotheses will be tested, and the findings of
the tests will be interpreted in the next chapter. This chapter is structured as below:
Sections 5.2 to 5.4 develop the first three hypotheses of this study concerning the
relationship and interrelationship between carbon disclosure and carbon performance.
Sections 5.5 and 5.6 develop hypotheses that deal with the relationship and
interrelationship between carbon performance and financial performance. Section 7.7
develops a hypothesis that predicts a relationship between carbon disclosure and
financial performance. Sections 5.8 and 5.9 hypothesise relationship between carbon
disclosure and agency cost and between carbon performance and agency cost. Section
5.9 hypothesises trends in improvement of carbon disclosure and carbon performance.
Section 5.10 summarises the chapter.
5.2 Relationship between carbon disclosure and carbon performance
Limited research has been done to investigate the relationship between carbon
disclosure and carbon performance and the findings of this research have been largely
inconclusive. Most of this research has been done for specific countries and on specific
industries. To address this research gap, this study investigates the relationship between

82
carbon disclosure and carbon performance for the top 500 global companies that include
all industries except the financial services sector.
As discussed in the Theoretical Background chapter, socio-political theories such
as Legitimacy Theory and Stakeholder Theory propose a negative relationship between
carbon performance and carbon disclosure. These theories predict that business with
poor environmental performance/carbon performance would make soft and unverifiable
qualitative disclosure about their performance to maintain legitimacy and to satisfy
expectations of various stakeholders. Firms must manage the interests of consumers and
wider society, as well as continue to satisfy their shareholders, and must maintain their
legitimacy to ensure survival. The greater the perceived importance of shareholders'
information needs and community concerns to a business, the higher the level of
environmental/carbon disclosures by the business. Therefore, it can be assumed that
companies with inferior carbon performance would make more carbon disclosure to
satisfy important stakeholders and retain their legitimacy as suggested by Stakeholder
Theory and Legitimacy Theory. Based on these theoretical reasoning of Legitimacy
Theory and Stakeholder Theory, we can hypothesize that the worse the carbon
performance of a business, the more carbon disclosure it is likely to make. Therefore, the
first hypothesis of this study is:
H1 – There is a negative relationship between carbon disclosure and carbon
performance
In contrast to the theories discussed above, economic based Voluntary Disclosure
Theory and Signalling Theory, propose a positive relationship between carbon
disclosure and carbon performance. These theories suggest that companies with good

83
performance are likely to make hard and high-quality verifiable disclosure to signal their
good quality to investors and to differentiate themselves from companies with ‘bad
news’ to avoid the adverse selection problem. In the context of these predictions of
Voluntary Disclosure Theory and Signalling Theory, we can hypothesize that better
carbon performers will make more disclosure. This gives our second hypothesis as
below:
H2- There is a positive relationship between carbon disclosure and carbon
performance
5.3 Interrelationship between carbon disclosure and carbon
performance
As discussed before, many studies have investigated the relationship between
environmental disclosure/carbon disclosure and environmental performance/carbon
performance. However, to the best of my knowledge, the interrelationship between
environmental disclosure/carbon disclosure and environmental performance/carbon
performance, have not been investigated by any prior research. In other words, no study
so far has attempted to find out whether environmental disclosure/carbon disclosure
affects environmental performance/carbon performance, and vice versa. For example,
we know that improved environmental performance/carbon performance may lead to
higher environmental disclosure/carbon disclosure, but we do not know whether higher
environmental disclosure/carbon disclosure as a result of improved environmental
performance/carbon performance in a period, will lead to better environmental
performance/carbon performance in the next period. This study would like to address

84
this research gap by investigating whether there is a both-way relationship between
carbon disclosure and carbon performance.
The theory that can explain a possible interrelation between carbon disclosure
and carbon performance is Instrumental Stakeholder Theory. This theory suggests that
everything else being equal, firms that practice stakeholder management will perform
better in profitability, stability, growth and other conventional performance terms
(Donaldson and Preston, 1995. p. 67).
In line with the propositions of Stakeholder Theory, we already know that
companies would voluntarily make carbon disclosure to satisfy their stakeholders. As
per the propositions of Instrumental Stakeholder Theory, this action by the companies
(satisfying stakeholders by making voluntary carbon disclosure) consequently is likely
to improve carbon performance of these companies. When carbon performance of these
companies improve, they are likely to disclose these information to signal their good
quality to investors as suggested by Signalling Theory. The following diagram shows the
relationship:
Figure 5.1 Interrelationship between carbon disclosure and carbon performance
CD Instrumental Stakeholder Theory CP Signalling Theory CD
CD = Carbon disclosure CP = Carbon performance
Source: developed for this study

85
Based on the above arguments, we can predict a two-way positive relationship
between carbon disclosure and carbon performance where an increase in carbon
disclosure will improve carbon performance (as predicted by Instrumental Stakeholder
Theory) and consequently, improved carbon performance will lead to more carbon
disclosure (as predicted by Signalling Theory). This analysis leads to the next hypothesis
of this study as below:
H3 - Carbon disclosure and carbon performance influence each other positively.
5.4 Disclosure practices of average carbon performers
As discussed in the literature review section, prior studies produce vastly
conflicting findings regarding the relationship between environmental
performance/carbon performance and environmental disclosure/carbon disclosure. Some
studies find that superior environmental performers/carbon performers make more
environmental disclosure/carbon disclosure whereas some other studies find that inferior
environmental performers/carbon performers make more environmental
disclosure/carbon disclosure. However, none of the existing studies predict anything
about the disclosure practices of firms who are neither superior performers nor inferior
performers, i.e., firms who can be considered as average carbon performers. This lack of
previous studies opens up the potential for a new area of research. Therefore, this study
would like to investigate carbon disclosure practices of average carbon performers.
As both superior carbon performers and inferior carbon performers make high
carbon disclosure, we can assume that firms whose carbon performance are neither
superior nor inferior do not make a high level of carbon disclosure. In other words,

86
businesses with superior carbon performance and inferior carbon performance would
make significantly more carbon disclosure than businesses with average carbon
performance. This argument gives rise to the next hypothesis of this study as below:
H4 - Both superior and inferior carbon performers make significantly more carbon
disclosure than average carbon performers.
5.5 Relationship between carbon performance and financial
performance
It is evident from the previous discussion in the literature review section, that the
relationship between carbon performance and financial performance is a contentious
issue. There are strong arguments and evidence to support a negative relationship as well
as a positive relationship between corporate carbon performance and financial
performance. However, in the recent past, the business environment has changed
drastically due to the effects of climate change. Climate change and global warming
have emerged to be one of the most important problems affecting the future of life on
this planet, and it is by, and large agreed that GHG emissions including carbon dioxide
(CO2), are the main cause of climate change and global warming. Business which emits
GHG is one of the major players that contribute to adverse climate change and global
warming. There is immense pressure on businesses from different stakeholders, to
reduce GHG emission and thereby improve their carbon performance. As discussed
earlier, businesses would incur costs to improve their carbon performance. However, the
benefit they would get from improvement in carbon performance, especially in the long

87
run, would outweigh the cost. Reductions in carbon emissions would increase firm
competitiveness and thus sustainable competitive advantage. By GHG emissions
management, a firm will enhance its economic performance as it promotes an increase in
demand for its output and improves its productivity.
Stakeholders of business such as governments, non-governmental organisations,
local communities, consumers, trading partners, employees, investors, financial agencies
and stockholders, are conscious of corporate environmental management including GHG
emission management, especially in developed countries. This would directly or
indirectly influence the financial performance of business. For example, if a firm emits
too much CO2 it may have risk of paying for the extra emission in countries that would
penalise too much CO2 emission, especially in the future. The firm may also suffer from
a loss of trust and reputation from carbon conscious consumers and other stakeholders.
Such risks have negative effects on the evaluation of a firm's future profits. On the other
hand, a firm that actively tries to manage their GHG emission might gain positive
reputation among some stakeholders and may influence them to expect that the firm will
succeed in reducing environmental risks and production costs in the long term, and
thereby would be able to improve its financial performance. Therefore, firms have an
incentive to address various environmental issues against the backdrop of various
stakeholders' interests (Salama, 2004).
The positive relationship predicted between corporate carbon performance and
financial performance can possibly be explained by the propositions of Stakeholder
Theory. This theory, which have been discussed in detail before, argues that by
matching and concentrating on the interests of various stakeholder groups, which will
lead to their satisfaction, managers can increase the efficiency of their organisation’s

88
adaptation to external demands (Orlitzky et al., 2003). Corporate environmental
performance is a kind of corporate investment (McWilliams and Siegel, 2001), and as a
form of corporate investment, it creates opportunities to enhance organisational financial
performance in the future (Jones, 1995).
Based on the above arguments coupled with the reasoning of Stakeholder
Theory, we can predict that improvement of carbon performance of a firm will lead to
improvement in its financial performance, especially in the long run.
Therefore, the next hypothesis of this study is as below:
H5: There is a positive relationship between carbon performance and financial
performance
5.6 Interrelationship between carbon performance and financial
performance
While many studies investigate the relationship between environmental
performance/carbon performance and financial performance, there is no known research
that investigates interrelation between carbon performance and financial performance.
This study has already explained and justified in the previous section that there is a
positive relationship between carbon performance and financial performance, i.e.
improved carbon performance of a business would improve its financial performance.
Now, the study of Nakao et al. (2007) and Earnhart and Lizal (2006), suggest that when
a firm’s financial performance improves, it can generate additional internal financial
resources to improve its environmental performance. In other words, improvement in

89
environmental performance of a business would improve its financial performance, and
consequently, improved financial performance would help to improve its environmental
performance. As there is no known study that investigates interrelationship between
carbon performance and financial performance and as carbon performance is a subset of
environmental performance, we can argue that improvement in carbon performance of a
firm will lead to improvement in its financial performance, and this improvement in
financial performance will allow the firm to invest in emission reduction technologies
and activities which in turn will improve the firm’s carbon performance. This
relationship is shown in the diagram below:
Figure 5.2 Interrelationship between carbon performance and financial
performance
Additional Resources CP
CP = Carbon performance; FP = Financial performance
Source: developed for this study
The above argument leads to the next hypothesis of the study as below:
H6: Carbon performance and financial performance influence each other positively
CP FP

90
5.7 Relationship between carbon disclosure and financial performance
There are numerous studies that deal with the relationship between
environmental disclosure/carbon disclosure and environmental performance/carbon
performance. The majority of these studies find a positive relationship between them
whilst a good number of studies find a negative relationship as well. Similarly, there are
large number of studies that investigate the relationship between environmental
performance/carbon performance and financial performance. In this case also, there are
conflicting results. Whilst the majority of the studies find a positive relationship between
environmental performance/carbon performance and financial performance, many
studies propose a negative relationship. However, there is no known research that
investigates if and how environmental disclosure/carbon disclosure affects the financial
performance of a firm. It would be useful for stakeholders of businesses, if the
relationship between environmental disclosure/carbon disclosure and carbon
performance could be established. Therefore, this study would like address this research
gap by finding out how carbon disclosure of a business affects its financial performance.
In Section 5.3, this study has already explained and justified that, as per the
proposition of Instrumental Stakeholder Theory, if a firm performs stakeholder
management, for example, by making voluntary carbon disclosure, carbon performance
of the firm is likely to improve. On the other hand, section 5.5 of this study explained
and justified that improved carbon performance of a firm is likely to improve its
financial performance. Considering these two arguments, we can suggest that carbon
disclosures will positively affect firms’ future carbon performance. This improved
carbon performance then, will positively affect the firm’s financial performance. If

91
carbon disclosure of a firm positively affects its carbon performance, and carbon
performance positively affects its financial performance, then we can argue that carbon
disclosure of a business will positively affect its financial performance. This predicted
relationship is show in the diagram below:
Figure 5.3 Relationship between carbon disclosure and financial performance
Source: developed for this study
The above arguments lead to the next hypothesis of the study as below:
H7: There is a positive relationship between carbon disclosure and financial
Performance
Carbon disclosure Carbon performance
Carbon performance Financial performance
Carbon disclosure Financial performance

92
5.8 Relationship between carbon disclosure and agency cost
As discussed before, Agency Theory suggests that businesses would use
voluntary disclosure to reduce information asymmetry problems between owners and
managers which subsequently would help them to reduce agency cost. Agency Theory
has been used by several studies in the disclosure literature to explain voluntary
reporting practices. They suggest that disclosure is a means by which companies can
reduce the conflict between owners (principals) and managers (agents), and
subsequently decrease the agency costs. If we apply this principles to explain the
relationship between carbon disclosure and agency cost, we can suggest that if carbon
disclosure of a firm increases, its agency cost will decrease. Therefore, we can
hypothesis that:
H8: There is a negative relationship between carbon disclosure and agency cost
5.9 Relationship between carbon performance and agency cost
To the best of my knowledge, there is no known study that investigates the
relationship between environmental performance/carbon performance and agency cost.
It has already been mentioned before that the divergence of action due to incomplete
alignment of the interests of agents and principals may lead to an agency problem. The
sacrifice of wealth by the principal and potential costs associated with monitoring the
agents is known as the agency cost. It has also been discussed and hypothesized in
section 5.8 (hypothesis 8), that there is a negative relationship between carbon disclosure
and agency cost i.e., if carbon disclosure of a firm increases, its agency cost will
decrease. On the other hand, in section 5.3 of this study, it has been argued and

93
hypothesised (hypothesis 3) that carbon disclosure and carbon performance influence
each other positively, i.e. better carbon performance will lead to higher carbon
disclosure, and increased carbon disclosure will subsequently improve the firm’s carbon
performance.
From hypotheses 3 and 8, we can predict two sets of relations. 1) If carbon
disclosure of a business improves, its carbon performance will subsequently improve
and 2) On the other hand, if a business increases its carbon disclosure, its agency cost
will decrease. Therefore, combining these two arguments, we can predict that if carbon
performance of a business improves, its agency cost will decrease. The following
diagram depicts these relationships:
Figure 5.4 Relationship between carbon performance and agency cost
Source: developed for this study
The above arguments give rise to the next hypothesis of this study as below:
H9: There is a negative relationship between carbon performance and agency cost
Carbon disclosure Carbon performance
Carbon disclosure Agency cost
Carbon performance Agency cost

94
5.10 Trends in improvement of carbon disclosure and carbon
performance over time
Due to increases in regulatory pressure, ever increasing voluntary disclosure
channels and their desire to legitimise their operations, as per Legitimacy Theory, it can
be assumed that carbon emission disclosure by business would increase overtime. On the
other hand, there is no known research that studies the trends in improvement of carbon
performance, i.e. there is a lack of empirical research that tries to find out whether
carbon performance of business has improved over the years. Therefore, this study
would like to find out if carbon disclosure and carbon performance of businesses has
improved over the years. This gives our last hypothesis as below:
H10: There is an improvement of both carbon disclosure and carbon performance by
businesses over time
5.11 Chapter summary
This chapter utilises the research gaps identified in chapter 4, the propositions of
relevant theories, and several conceptual frameworks developed in this study to
formulate hypothesis for this study. Firstly, Socio Political and Economic Based
Theories are used to develop the first two hypotheses of this study, that propose
relationships between carbon disclosure and carbon performance. The next section of
this study uses relevant theories and a conceptual framework developed for this study, to
develop a hypothesis that predicts interrelationship between carbon disclosure and
carbon performance. This chapter then develops hypothesis related to disclosure

95
practices of average carbon performers. The next part of the chapter uses relevant
theories and a conceptual framework developed for this study, to develop hypotheses
that predict relationship and interrelationship between carbon performance and financial
performance. The next section of this study hypothesise a relationship between carbon
disclosure and financial performance based on a conceptual framework developed for
this study. This study then utilises relevant theories to hypothesise a relationship
between carbon disclosure and agency cost. Based on a conceptual framework
developed for this study, the next section develops a hypothesis relating carbon
performance and agency cost. The final section of this chapter proposes a hypothesis
related to the trends of improvement in carbon disclosure and carbon performance over
the study period. Hypotheses formulated in this chapter, will be tested by regression
models that will be developed in the next chapter.

96
CHPATER 6 RESEARCH METHOD
6.1 Introduction
This chapter outlines the methods used in this study to test the hypotheses
developed in previous chapter. This chapter is organized as below: Section 6.2 and 6.3
explain the research sample selection process. Section 6.4 shows the process of selecting
and measuring the dependent and independent variables. Section 6.5 outlines the
methods used to select the control variables for this study, which are used to control the
regression results. Section 6.6 outlines the models used in this study to test its
hypotheses. Finally, section 6.7 summarises the chapter.
6.2 Sample period
This study intends to examine the relationship among carbon disclosure, carbon
performance, financial performance and agency cost, for the world’s largest 500 firms
that participated in the Carbon Disclosure Project (CDP) questionnaire survey over the
years 2011 to 2015. It also intends to study the trends in improvement of carbon
disclosure and carbon performance over the same period. There are multiple reasons for
choosing this study period. The data related to carbon disclosure and carbon
performance of the firms were collected from the CDP database. CDP scoring
methodology was developed in 2008. Initially, it focused on disclosure scores only. CDP
started reporting carbon performance scores from 2010. However, during 2010, the
response rate from companies were not very high. Since 2011, for most of the
companies whose disclosure scores were available, their performance scores were also

97
available. Therefore, the sample period for this study starts in 2011. When I started
collecting data for this study, full data set was available until the end of 2015.
Therefore, the duration of the study ends in 2015.
6.3 Sample selection
The targeted sample for this study are the largest 500 firms worldwide (referred
to as Financial Times Global 500 firms) who participated in CDP during the period 2011
to 2015. These 500 firms are chosen from the FTSE Global Equity Index Series as of 31
December 2015. They are also referred to as G500. These firms were ranked as the
biggest in terms of sales and have a market capitalisation of US $32,387 billion. The
companies are ranked by market capitalisation. The greater the stock market value of a
company, the higher it’s ranking (Financial Times, 2015).
There are multiple reasons for choosing the G500 firms. An important reason is
that these firms responded to CDP carbon disclosure and carbon performance
questionnaire during the study period of 2011 to 2015. CDP is a non-profit organisation,
which represents 534 institutional investors worldwide. CDP was launched in 2000.
Since 2003, it started requesting information relevant to climate change from more than
3,700 firms across the world. This information includes the identification of carbon and
climate change–associated risks and opportunities; the actions taken by firms to manage
and adapt to these risks and opportunities; carbon and greenhouse gas emissions,
actions, and strategies that have been and are taken to mitigate carbon emissions and
finally governance strategies adopted by firms to deal with carbon and climate change
matters. Hence, the CDP’s database is the most comprehensive database of carbon and
98
climate change–related information that is publicly available (Griffin et al., 2017;
Matsumura et al., 2013).
Another reason for choosing G500 firms, is their impact on the economies where
they perform their operations (Jose and Lee, 2007). Some prior research such as
Clarkson et al. (2008) and Patten (2002), have identified small sample size and the
context as the reasons for their studies’ mixed results. Therefore, a large sample like
G500, which includes a wide range of industries and countries, may be able to overcome
these limitations.
From G500 firms, financial firms have been excluded, as their business does not
involve substantial carbon emission. To be included in the sample, firms should have
both a carbon disclosure score and a carbon performance score available, for each of the
years between 2011 and 2015. So, after excluding financial companies and companies
whose carbon disclosure score and carbon performance scores are missing in any of the
years between 2011 to 2015, the final sample constitutes 189 firms. Sample firms have
been classified as per the Global Industry Classification Standard (GICS). The following
table shows the distribution of sample firms based on the GICS as on 31 December
2015.

99
Table 6.1 Distribution of sample firms by sector
Sector No of firms Percentage
Consumer Discretionary 25 13.23
Consumer Staples 28 14.81
Energy 20 10.58
Health Care 23 12.17
Industrials 30 15.87
Information Technology 22 11.64
Materials 17 8.99
Telecommunication Services 14 7.41
Utilities 10 5.29
Total 189 100
Figure 6.1 Sector-wise distribution of sample firms
Consumer Discretionary
13%Consumer
Staples15%
Energy11%
Health Care12%
Industrials16%
Information Technology
12%
Materials9%
Telecommunication Services
7%
Utilities5%

100
Out of 189 sample companies 91 belong to North America, 52 belong to the
European Union, 22 belong to the United Kingdom, 22 are from the countries of Asia-
Pacific, and from the remaining four, 2 are from Brazil and another 2 are from South
Africa. The following table shows the breakdown:
Table 6.2 Distribution of sample firms by regions
Region No. of
firms
Percentage
North America 91 48
European Union 52 28
Asia-Pacific 22 12
United Kingdom 20 11
Others 4 2
Total 189 100
Data sources
The source of carbon disclosure and carbon performance scores is the CDP
database. Financial performance in this study is measured by Return on Asset (ROA)
and Tobin’s Q, and agency cost is measured by Expense Ratio (ER) and Asset
Utilisation Ratio. Data to measure financial performance, agency cost and control
variables, are collected from Thomson Reuters Datastream database.

101
6.4 Measurement of dependent and independent variables
This study uses carbon disclosure, carbon performance, financial performance
and agency cost, as dependent and independent variables. These variables are used
sometimes as dependent variables and at other times as independent variables,
depending on the requirement of the hypothesis being tested. This study uses CDP
Carbon Disclosure Scores as the proxy for carbon disclosure, and CDP Carbon
Performance Scores as the proxy for carbon performance for the sample companies.
CDP prepares Carbon Disclosure Scores and Carbon Performance Scores based on its
climate change scoring methodology. Scoring was developed in 2008 and initially
focused on carbon disclosure. Carbon performance scores were started in 2011. CDP
scoring is closely aligned with its mission to work with market forces to motivate
companies to disclose their impacts on the environment and natural resources and take
action to reduce negative impacts. CDP uses a scoring methodology that incentivise
companies to measure and manage environmental impacts through participation in
CDP’s climate change, water, forests and supply chain programs. The scoring
methodology is a means to assess the responder's progress towards environmental
stewardship as communicated through the company's CDP response. The methodology
ultimately yields a score based on the evaluation. The scoring methodology assess the
level of detail and comprehensiveness in a response, as well as the company's awareness
of environmental issues, and its management methods.
The scoring methodology provides a disclosure score, which assesses the level of
detail and comprehensiveness in disclosure, and a performance score, which assesses the
102
level of action taken on climate change evidenced by the company's CDP response. The
methodology for both the scores is presented below.
6.4.1 Measurement of CDP carbon disclosure scores
Disclosure scores are expressed as a number between 0 and 100. The disclosure
score represents the potential quality in completeness of disclosure and hence it’s likely
usefulness to data users. The disclosure score is a matrix of comprehensiveness of the
responses, good internal data management and understanding of climate change issues
and is a measure of complete transparency on climate change. However, it is important
to understand that disclosure score is not a measure of how green or sustainable a
company is.
In general, the number of points allocated to each question asked in CDP
questionnaire, which is filled in by the respondent companies on a voluntary basis,
depends on the amount of data requested. Some questions have more than one point
attached to a single piece of information where the information is of particularly high
importance, e.g. the gross global Scope 1 emissions figure. Questions which allow text
responses are usually judged according to how many of the required data points they
achieve. At the end of scoring, the number of points a company has been awarded (the
numerator) is divided by the maximum number that could have been awarded (the
denominator). The fraction is then converted to a percentage by multiplying it by 100
and rounded to the nearest whole number as below:
(Points awarded / points attainable) x 100 = Disclosure Score
103
A low disclosure score is not necessarily an indicator of poor performance, but it
suggests a company has insufficient information based on which a judgment of
performance can be made.
6.4.2 Measurement of CDP carbon performance score
Performance points are awarded when a company highlights that it is
undertaking or has undertaken a positive climate change action. Performance points are
awarded for evidence provided in the CDP response of actions considered to contribute
to climate change mitigation, adaptation and transparency. Actions considered to be
more fundamental to progress on combating climate change, are awarded more points.
External verification/assurance of emissions data is rewarded under the performance
scoring, as it is considered that this potentially increases the usefulness of the
information to decision makers, and can act as a pre-qualifier of the data submitted that
should be recognized when evaluating performance. The performance score is solely
based on activities and positions disclosed in CDP questionnaire, that is filled in by
respondent companies on a voluntary basis. It therefore, does not consider actions not
mentioned in CDP response. To receive a performance score, a company must achieve a
minimum disclosure score of 50. This is to ensure that the judgment is based on
sufficient information. Performance scores are converted to percentages in a similar way
to the disclosure score percentage is generated. The percentages are then grouped into
bands of A, A-, B, C, D, E, with A being the best. The numeric equivalent for A and A-
is same. The difference between an A and A- band is whether the company has made to
the A list for two years or not. Below are the numeric equivalents (score out of 100) of
the performance bands for the years 2012-2015. The numeric equivalents for 2011 were

104
slightly different. However, for the sake of simplicity this study uses only 2012-15
scoring methodology.
Performance Band Numeric Equivalents
(score out of 100)
A and A- 86-100
B 61-85
C 41-60
D 21-40
E 0-20
As letter bands are difficult to use in statistical analysis, they have been
converted to numeric values in this study. To find a numeric equivalent of a letter band,
the upper and lower range of the scores of a letter band has been divided by 2 and then
rounded to the nearest whole number. For example, the numeric equivalent of A and A-
= (86+100) / 2 = 93. Similarly other letter bands B, C, D and E have been converted to
numeric equivalents.
Several previous studies use CDP scores as a measure for carbon disclosure and
carbon performance for their sample firms. Ennis et al. (2012) in their study, analyses
the relationship between emissions performance and financial performance of FTSE 350
companies over the period 2006-2009, and uses CDP data to measure emission
performance. In the study titled “Carbon disclosure, carbon performance, and cost of
capital”, He et al. (2013) use CDP scores in measuring carbon disclosure and carbon
105
performance for their sample firms. Luo and Tang (2014) also use CDP data to examine
the relationship between voluntary carbon disclosure and carbon performance. Cotter
and Najah (2012) in their study entitled “Institutional investor influence on global
climate change disclosure practices”, use CDP scoring methodology to calculate
disclosure scores.
6.4.3 Measurement of Financial performance
Return on Asset (ROA) and Tobin’s Q are used as proxies for financial
performance in this study. Several previous studies use ROA and Tobin’s Q as measures
for financial performance. ROA is calculated by dividing a company's annual earnings
by its total assets. It is an indicator of how profitable a company is relative to its total
assets. It gives an idea as to how efficient management is at using its assets to generate
earnings. On the other hand, Tobin's Q or the Q ratio, is the ratio of the market value of a
company's assets (as measured by the market value of its outstanding stock and debt)
divided by the replacement cost of the company's assets (book value). ROA is an
accounting based measures of a firm’s financial performance, while Tobin’s Q is a
market based measures of a firm’s financial performance (Horváthová, 2010). Both
ROA and Tobin’s Q have been chosen as proxies for financial performance in this study,
so that we can examine the relationship between carbon performance and both
accounting based measures of a firm’s financial performance, as well as its market based
measure of financial performance.
Delmas and Nairn-Birch (2011) and Busch and Hoffmann (2011) use both ROA
and Tobin’s Q to measure financial performance. They find that carbon performance is
negatively related to financial performance when it is measured by ROA, whilst it is

106
positively related to financial performance when it is measured by Tobin’s Q. Jaggi and
Freedman (1992) use ROA to measure economic performance while evaluating the
impact of pollution performance of pulp and paper firms in the United States on their
economic and market performance. Hart and Ahuja (1996) use ROA as a measure of
firm performance, in order to analyse the relationship between emission reductions and
firm performance of US firms during the period 1989 to 1992. Russo and Fouts (1997)
also use ROA as proxy for economic performance, in their study to examine relationship
between environmental performance and economic performance. Nakao et al. (2007)
uses ROA to measure financial performance while examining the relationship between
environmental performance and financial performance of Japanese corporations.
Gallego-Álvarez et al. (2015) in their study titled “Carbon emission reduction: the
impact on the financial and operational performance of international companies”, use
ROA to measure financial performance.
On the other hand, several studies explore the relationship between
environmental performance/carbon performance and financial performance, using
Tobin’s Q as an indicator for financial performance. For example, Nishitani and Kokubu
(2012) use Tobin’s Q to measure firm value while examining the relationship between
the reduction of greenhouse gas emissions and firm value. Similarly, Wang et al. (2014)
in their study to determine the relationship between GHG emissions and financial
performance in Australia, use Tobin’s Q to measure financial performance.
6.4.4 Measurement of agency cost
As mentioned earlier in literature review section, the sacrifice of wealth by the
principal (owners of the business) and potential costs associated with monitoring the

107
agents (manager of the business), is known as the agency cost. Agency cost is measured
by Expense Ratio (ER) and Asset Utilization Ratio (AUR) (Rashid, 2015). Expense
Ratio (ER) is the ratio of operating expenses (selling, general, and administrative
expenses, excluding financing expenses and any non-recurring expenses, such as losses
on the sale of assets) to total annual sales (Ang et al., 2000). It measures how effectively
a firm’s management controls operating costs. According to Ang et al. (2000, p. 82),
‘this measure captures excessive expenses including perk consumption’. The second
measure of agency cost is the Asset Utilization Ratio (AUR), or the Asset Turnover
Ratio. It is the ‘proxy for the loss in revenues attributable to inefficient asset utilization’
(Ang et al., 2000, p. 82). It is calculated as the ratio of annual sales to total assets. It is an
efficiency ratio. It measures how effectively a firm’s assets are employed (Ang et al.
2000). A low ER indicates that the management is controlling the operating expenses
and vice versa, whereas a low AUR indicates that the management is using the assets in
a non-cash flow generating venture and vice versa (Singh and Davidson III 2003).
6.5 Selection and measurement of control variables
A number of control variables are used in the hypotheses testing process because
of their potential impact on the dependent variables. The following section explains
these variables and justifies the reasons for their selection as control variables based on
review of relevant literature.
Firm Size: Most voluntary disclosure studies control for a firm’s size as a key
determinant of disclosure level. There are two primary reasons that explain the

108
relationship between voluntary disclosure and firm size. Large firms have the resources
to disseminate detailed information, and these firms are susceptible to a high degree of
public scrutiny (Liu and Anbumozhi, 2009; Stanny and Ely, 2008). Studies such as
Clarkson et al. (2008); Cormier et al. (2005); Freedman and Jaggi (2005); Liu and
Anbumozhi (2009), and Stanny and Ely (2008), support the opinion that voluntary
disclosure is positively associated with firm size. Recent studies such as Prado-Lorenzo
et al. (2009), find that a firm’s size positively influences its disclosure of GHG
emissions information. Choi et al (2013) find in their study, that large firms will engage
more actively in voluntary carbon reporting since they are more visible and also have
more resources to prepare comprehensive disclosures. In this study, firm size is
measured as a natural logarithm of total asset value measured as of the end of fiscal year.
A number of previous studies such as Clarkson et al. (2008) and Sutantoputra et al.
(2012) and King and Lenox (2001), use natural logarithm of total assets as a proxy for
firm size.
Leverage: A number of studies use leverage to control for voluntary disclosures.
Agency costs of debt are higher for firms with relatively more debt in their capital
structure (Jensen and Meckling, 1976). The reason for using leverage to control
disclosure, is that firms with high leverage adopt accounting policies that allow them to
disclose detailed information about their financial, environmental or social performance.
This behavior can be attributed to those fact that firms with high leverage would try to
avoid agency costs which may be imposed by creditors (Clarkson et al., 2008), or they
would try to keep particular stakeholders (investors, creditors) informed in order to
avoid debt-covenants’ breaches (Freedman and Jaggi, 2005). Therefore, firms with high

109
leverage are more likely to provide detailed information about their carbon emissions
and climate change–related risks and opportunities. For this study, leverage is calculated
as a percentage of total debt to total capital.
Firm age: Firm age has been used to control environmental performance by de Villiers
et al (2011). According to Mohana-Neill, (1995) older firms are more likely to possess
the necessary infrastructure to manage environmental issues at a lower cost. Similarly,
Huergo and Jaumandreu (2004) argue that older firms are more likely to engage in
environmental activities. Similar to previous studies such as Wagner and Schaltegger
(2004), firm age, for this study, has been calculated as the natural logarithm of the age of
the firm, starting from the year it was established until the end of 2015.
Growth opportunities: Growth opportunity has been used as a proxy for future growth.
It is measured as ratio of market value of equity to book value of equity (Gaver and
Gaver, 1993; Smith and Watts, 1992). Al-Tuwaijri et al. (2004) argue that as this ratio
measures the difference between the market’s appraisal of firm value and the estimate of
value aggregated accounting transactions, growth opportunities should be positively
related to economic performance. They also use growth as a proxy for intangible assets
associated with innovation (Porter and van der Linde, 1995a), and therefore, argue that
growth is positively related to environmental performance as well.
Capital intensity: Clarkson et al (2008) argue that firms with newer, cleaner
technologies are likely to have a superior environmental performance measure, and it is
reasonable to assume that they will want stakeholders to know about this superior

110
environmental performance in discretionary disclosure channels. For similar reasons,
firms with higher sustaining capital expenditures are expected to have newer equipment
and may want to signal their environmental type through more discretionary disclosures
regarding their environmental performance. It is calculated by dividing total capital
spending by total sales revenue of a company, for a particular year.
Carbon intensity: Carbon intensity is used as a control variable as firms operating in
carbon-emission-intensive industry are subject to more climate change legislation and
regulations, and their carbon disclosure tends to be more open. A binary code of ‘1’ or
‘0’, will be used to indicate industry classification. A firm will receive a score of ‘1’ if it
is considered to be operating in a carbon intensive industry such as materials, energy and
utilities. Firms from other industries are not considered carbon intensive and hence
awarded a score of ‘0’ (Luo and Tang, 2014).
Dividend yield and dividend payout per share: Dividend yield and dividend payout
per share have been used in this study to control for corporate financial performance and
carbon performance. Numerous studies have shown relationship between dividend
payment and corporate financial performance. Denis and Igor (2008) examine cross-
sectional and time-series evidence on the propensity to pay dividends, in several
developed financial markets over the period 1989–2002. Their study find that the
likelihood of paying dividends is associated with firm size, growth opportunities, and
profitability and the propensity to pay dividends is higher among larger, more profitable
firms.

111
Myers and Frank (2004) empirically examine the data for a sample of 483 firms
taken from the Multex Investor Database, to assess the impact of selected financial
variables on the dividend decision. The study uses the firm's dividend payout ratio as the
dependent variable to represent the dividend decision. The Price Earnings Ratio and
sales growth related positively to the dividend payout ratio. Labhane and Mahakud
(2016), examine the determinants of dividend payout ratio for Indian companies during
the period 1994–1995 to 2012–2013. From the trend analysis carried out, the authors
found that the larger and profitable firms have high dividend payout ratio. Petra et al.
(2012) examine the determinants of corporate dividend policy of listed firms in Greece.
The analysis is based on 945 firm year observations of 63 nonfinancial firms which paid
dividends annually from 1993 to 2007. The authors find that size, profitability and
liquidity factors increase the probability to pay dividends.
While firm profitability affects dividend distribution, profitability itself is
affected by the business’s environmental performance. For instance, Richardson et al.
(1999) suggest that socially and environmentally responsible companies are more
profitable. The reasons are (1) companies that voluntary engage in social and
environmental behaviour may avoid the adverse effect of future regulatory costs on their
future cashflows. Social and environmental projects undertaken by firms are seen as
self-regulation acts undertaken (2) it is argued that customers accept more
environmentally sensitive products. Consumers will vote with their money and choose to
pay more for a product sold by firms that support a social and environmental cause for
which they have an affinity. As dividend distribution is related to corporate financial
performance and corporate financial performance is affected by the business’s
environmental performance, we can argue that there is a relationship between corporate

112
carbon performance and dividend distribution. The dividend yield expresses the
dividend per share as a percentage of the share price. On the other hand, dividend payout
per share = dividends per share / earnings per share * 100.
6.6 Models used in this study
All hypotheses that are developed in chapter 5 are tested using Ordinary Least
Square (OLS) regressions. The following models are developed in this study:
Relationship between carbon disclosure and carbon performance:
To test hypotheses 1 and 2 which examines the relationship between carbon
disclosure and carbon performance, this study uses the following model:
CD i,t = α + β1 CP i,t + β2 SIZE i,t + β3 LEV i,t + β4 CAPIN i,t + β5 AGE i,t + β6 GROWTHi,t
+ β7 CINT i,t + β8 DIVYIELD i,t + β9 DIVPAY i,t + εi,t (1)
Interrelation between carbon disclosure and carbon performance:
To test hypothesis 4 which tries to determine the interrelationship between carbon
disclosure and carbon performance, the following models are used:
CP i,t = α + γ1 CD(-1) i,t + γ2 SIZE i,t + γ3 LEV i,t + γ4 CAPIN i,t + γ5 AGE i,t +
γ6 GROWTH i,t + γ7 CINT i,t + γ8 DIVYIELD i,t + γ9 DIVPAY i,t + εi,t (2)
CD i,t = α + γ1 CP(-1) i,t + γ2 SIZE i,t + γ3 LEV i,t + γ4 CAPIN i,t + γ5 AGE i,t +
γ6 GROWTH i,t + γ7 CINT i,t + γ8 DIVYIELD i,t + γ9 DIVPAY i,t + εi,t (3)

113
Relationship between carbon performance and financial performance:
To test hypothesis 5, which examines the relationship between carbon performance and
financial performance, the following regression models have been used:
When financial performance is measured by ROA, the below model is used:
ROA i,t = α + β1 CP i,t + β2 SIZE i,t + β3 LEV i,t + β4 CAPIN i,t + β5 AGE i,t +
β6 GROWTH i,t + β7 CINT i,t + β8 DIVYIELD i,t + β9 DIVPAY i,t + εi,t (4)
When financial performance is measured by Tobin’s Q, the below model is used:
TOBINSQ i,t = α + β1 CP i,t + β2 SIZE i,t + β3 LEV i,t + β4 CAPIN i,t + β5 AGE i,t
+ β6 GROWTH i,t + β7 CINT i,t + β8 DIVYIELD i,t + β9 DIVPAY i,t + εi,t (5)
Interrelation between carbon performance and financial performance:
To test hypothesis 6, which addresses the interrelation between carbon disclosure and
carbon performance, the following regression models are used:
When financial performance is measured by ROA:
ROA i,t = α + γ1 CP(-1) i,t + γ2 SIZE i,t + γ3 LEV i,t + γ4 CAPIN i,t + γ5 AGE i,t +
γ6 GROWTH i,t + γ7 CINT i,t + γ8 DIVYIELD i,t + γ9 DIVPAY i,t + εi,t (6)
CP i,t = α + γ1 ROA(-1) i,t + γ2 SIZE i,t + γ3 LEV i,t + γ4 CAPIN i,t + γ5 AGE i,t +
γ6 GROWTH i,t + γ7 CINT i,t + γ8 DIVYIELD i,t + γ9 DIVPAY i,t + εi,t (7)

114
When financial performance is measured by Tobin’s Q:
TOBINSQ i,t = α + γ1 CP(-1) i,t + γ2 SIZE i,t + γ3 LEV i,t + γ4 CAPIN i,t + γ5 AGE i,t
+ γ6 GROWTH i,t + γ7 CINT i,t + γ8 DIVYIELD i,t + γ9 DIVPAY i,t + εi,t (8)
CP i,t = α + γ1 TOBINSQ(-1) i,t + γ2 SIZE i,t + γ3 LEV i,t + γ4 CAPIN i,t + γ5 AGE i,t +
γ6 GROWTH i,t + γ7 CINT i,t + γ8 DIVYIELD i,t + γ9 DIVPAY i,t + εi,t (9)
Relationship between carbon disclosure and financial performance:
To test hypothesis 7, which examines the relationship between carbon disclosure and
financial performance, the following regression models are used:
When financial performance is measured by ROA:
ROA i,t = α + β1 CD i,t + β2 SIZE i,t + β3 LEV i,t + β4 CAPIN i,t + β5 AGE i,t +
β6 GROWTH i,t + β7 CINT i,t + β8 DIVYIELD i,t + β9 DIVPAY i,t + εi,t (10)
When financial performance is measured by Tobin’s Q:
TOBINSQ i,t = α + β1 CD i,t + β2 SIZE i,t + β3 LEV i,t + β4 CAPIN i,t + β5 AGE i,t +
β6 GROWTH i,t + β7 CINT i,t + β8 DIVYIELD i,t + β9 DIVPAY i,t + εi,t (11)

115
Relationship between carbon disclosure and agency cost:
To test hypothesis 8, which addresses the relationship between carbon disclosure and
agency cost, the following regression models are used:
When agency cost is measured by Expense Ratio:
ER i,t = α + β1 CD i,t + β2 SIZE i,t + β3 LEV i,t + β4 CAPIN i,t + β5 AGE i,t + β6 GROWTHi,t
+ β7 CINT i,t + β8 DIVYIELD i,t + β9 DIVPAY i,t + εi,t (12)
When agency cost is measured by Asset Utilization Ratio:
AUR i,t = α + β1 CD i,t + β2 SIZE i,t + β3 LEV i,t + β4 CAPIN i,t + β5 AGE i,t +
β6 GROWTH i,t + β7 CINT i,t + β8 DIVYIELD i,t + β9 DIVPAY i,t + εi,t (13)
Relationship between carbon performance and agency cost:
To test hypothesis 9, which addresses the relationship between carbon performance and
agency cost, the following regression models are used:
When agency cost is measured by Expense Ratio:
ER i,t = α + β1 CP i,t + β2 SIZE i,t + β3 LEV i,t + β4 CAPIN i,t + β5 AGE i,t + β6 GROWTH i,t
+ β7 CINT i,t + β8 DIVYIELD i,t + β9 DIVPAY i,t + εi,t (14)
When agency cost is measured by Asset Utilisation Ratio:
AUR i,t = α + β1 CP i,t + β2 SIZE i,t + β3 LEV i,t + β4 CAPIN i,t + β5 AGE i,t + β6
GROWTH i,t + β7 CINT i,t + β8 DIVYIELD i,t + β9 DIVPAY i,t + εi,t (15)

116
Trends in improvement of carbon disclosure and carbon performance overtime:
To test hypothesis 10, which intends to examine the trends in improvement of carbon
disclosure and carbon performance over the study period, the following regression
models are used:
To examine improvement of carbon disclosure over time:
CD i,t = α + β1T2 i,t + β2T3 i,t + β3T4 i,t + β4T5 i,t + β5 SIZE i,t + β6 LEV i,t + β7 CAPIN i,t
+ β8 AGE i,t + Β9 GROWTH i,t + β10 CINT i,t + β11 DIVYIELD i,t
+ β12 DIVPAY i,t + εi,t (16)
To examine improvement of carbon performance over time:
CP i,t = α + β1T2 i,t + β2T3 i,t + β3T4 i,t + β4T5 i,t + β5 SIZE i,t + β6 LEV i,t + β7 CAPIN i,t
+ β8 AGE i,t + Β9 GROWTH i,t + β10 CINT i,t + β11 DIVYIELD i,t
+ β12 DIVPAY i,t + εi,t (17)
Where:
CD i,t = CDP carbon disclosure score for firm i for year t
CP i,t = CDP carbon performance score for firm i for year t
SIZE i,t = Firm size for firm i for year t. It is measured as natural logarithm of total asset
value
LEV i,t = Leverage for firm i for year t. It is measured as the ratio of total debt to total
assets
CAPIN i,t = Capital intensity for firm i for year t. It is measured as the ratio of capital
spending divided by total sales revenues
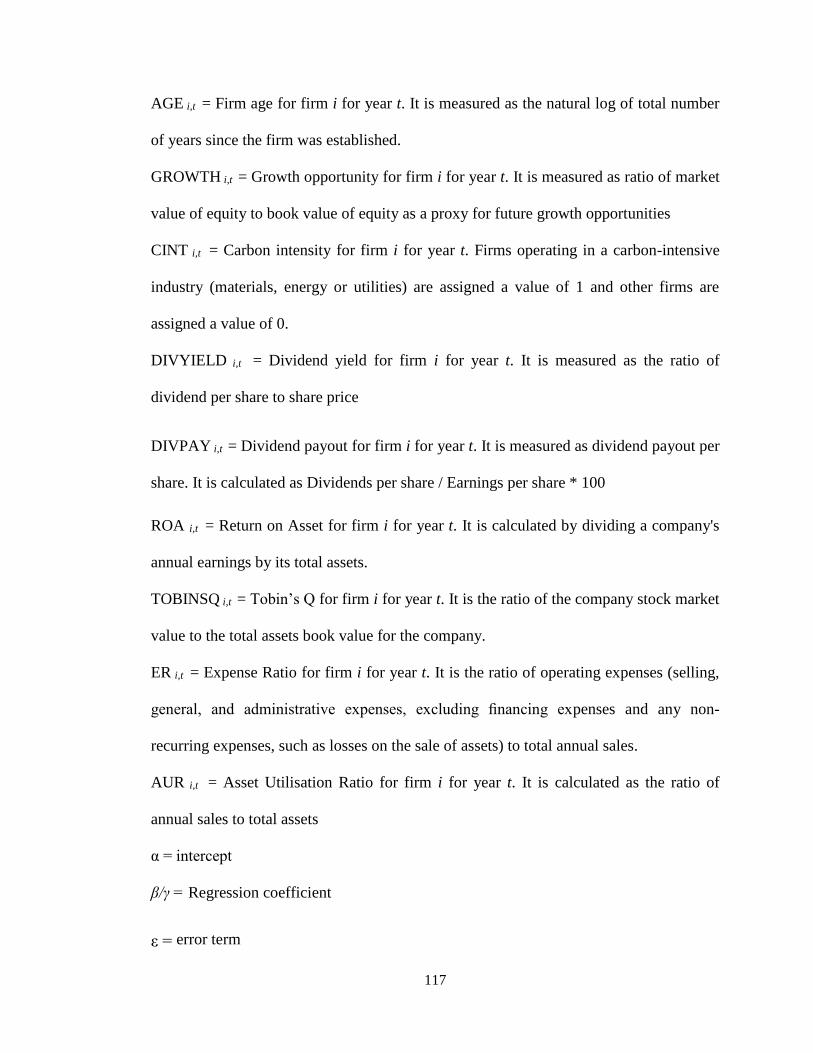
117
AGE i,t = Firm age for firm i for year t. It is measured as the natural log of total number
of years since the firm was established.
GROWTH i,t = Growth opportunity for firm i for year t. It is measured as ratio of market
value of equity to book value of equity as a proxy for future growth opportunities
CINT i,t = Carbon intensity for firm i for year t. Firms operating in a carbon-intensive
industry (materials, energy or utilities) are assigned a value of 1 and other firms are
assigned a value of 0.
DIVYIELD i,t = Dividend yield for firm i for year t. It is measured as the ratio of
dividend per share to share price
DIVPAY i,t = Dividend payout for firm i for year t. It is measured as dividend payout per
share. It is calculated as Dividends per share / Earnings per share * 100
ROA i,t = Return on Asset for firm i for year t. It is calculated by dividing a company's
annual earnings by its total assets.
TOBINSQ i,t = Tobin’s Q for firm i for year t. It is the ratio of the company stock market
value to the total assets book value for the company.
ER i,t = Expense Ratio for firm i for year t. It is the ratio of operating expenses (selling,
general, and administrative expenses, excluding financing expenses and any non-
recurring expenses, such as losses on the sale of assets) to total annual sales.
AUR i,t = Asset Utilisation Ratio for firm i for year t. It is calculated as the ratio of
annual sales to total assets
α = intercept
β/γ = Regression coefficient
ε = error term
118
T = current fiscal year
T-1 = previous fiscal year
T1 = fiscal year 2011
T2 = fiscal year 2012
T3 = fiscal year 2013
T4 = fiscal year 2014 and
T5 = fiscal year 2015
Dummy variables:
Industry sectors and time have been used as dummy variables to control for
industry and time effects. The sample companies are divided into nine sectors such as:
Consumer Discretionary, Consumer Staples, Energy, Health Care, Industrials,
Information Technology, Materials, Telecommunication Services and Utilities.
6.7 Chapter Summary
This chapter outlines the methodologies used in this research and justifications
for using them. Firstly, this chapter discusses the sample selection process followed by
the data sources and justification for using these sources. Secondly, it discusses how this
study measures its dependent, and independent variables. The dependent and
independent variables are carbon disclosure, carbon performance, financial performance
and agency cost. Thirdly, this chapter discusses the control variables, how these
variables are measured and the theoretical reasoning for using them. Finally, the
regression models which are used in this study to test its hypotheses are stated. The next
chapter conducts data analysis and interprets the results.

119
CHAPTER 7 DATA ANALYSIS, RESULTS AND
INTERPRETATION
7.1 Introduction
The objectives of this chapter are to analyse and interpret the relationship
between carbon disclosure and carbon performance; between carbon performance and
financial performance; between carbon disclosure and financial performance; between
carbon disclosure and agency cost and between carbon performance and agency cost.
This chapter also aims to investigate any trends in improvement of carbon disclosure and
carbon performance during the study period. These analyses are done for both full
sample and region wise. However, most of the similar research in this area (for example:
Cotter & Najah, 2012) have termed region-wise analysis as country-wise analysis. To
keep consistency with previous studies, the term country has been used to mean region
in this study. This chapter provides the multiple regression results from the tests
conducted to test the hypotheses of this study. This chapter also conducts normality,
multicollinearity and heteroscedasticity tests to validate the data and the regression
models used in this study. This chapter is organized as below:
Section 7.2 provides the descriptive statistics of this study. Section 7.3 provides
the diagnostics test used to validate the data and regression models used in this research.
Section 7.4 analyses and interprets relationship and interrelationship between carbon
disclosure and carbon performance. Section 7.5 analyses and interprets the relationship
and interrelationship between carbon performance and financial performance. Section
7.6 investigates the relationship between carbon disclosure and financial performance.
The relationship between carbon disclosure and agency cost and between carbon
120
performance and agency cost is analysed and interpreted in Section 7.7. Section 7.8
conducts a trend analysis to investigate any improvement for carbon disclosure and
carbon performance over the study period. Section 7.9 summarizes the chapter. All
hypotheses in the study have been tested both for full sample and country-wise.
7.2 Descriptive statistics
The purpose of this section is to provide the descriptive statistics for the variables
used in this study. It provides descriptive statistics for full sample as well as country-
wise.
7.2.1 Descriptive statistics for dependent, independent and control variables
The following table displays the descriptive statistics for dependent, independent
and control variables for the full sample, for the entire study period (years 2011–2015).

121
Table 7.1 Descriptive statistics for dependent, independent and control variables
N Minimum Maximum Mean Std. Deviation
Carbon Disclosure 944 50.00 100.00 85.81 12.87
Carbon Performance 944 10.00 93.00 66.55 21.07
Return on Asset (%) 945 -148.37 51.24 10.42 9.78
Tobin’s Q 945 0.00 8.13 1.57 1.05
Expense Ratio 945 0.00 0.82 0.25 0.17
Asset Utilisation ratio 945 0.11 4.49 0.78 0.51
Firm Size 945 8.72 12.86 10.68 0.77
Firm Age 945 0.00 5.86 3.96 8.51
Growth Opportunity 945 -7003.03 4139.18 35.40 351.07
Dividend Yield (%) 945 0.00 16.55 2.87 1.81
Dividend Payout per share 945 0.00 99.67 38.54 26.83
Capital Intensity 945 0.00 0.93 0.10 0.11
Carbon Intensity 945 0.00 1.00 0.25 0.43
Leverage 945 0.00 83.87 24.98 13.34
As per the above table, the mean of carbon disclosure score for the whole sample
is 85.81 out of 100. As discussed in previous chapter, carbon disclosure score represents
the potential quality in completeness of disclosure and hence it’s likely usefulness to
data users. The disclosure score is a matrix of comprehensiveness of the responses, good
internal data management and understanding of climate change issues and is a measure
of complete transparency on climate change. Therefore, an average score of 85.81
indicate that the data disclosed by sample companies are of high quality and are useful to
the uses. It also indicates that the sample companies have good level of understanding

122
about climate change related issues and they are disclosing a good amount of data
related to their climate change activities. Carbon disclosure score ranges from a
minimum of 50 to a maximum of 100 among the sample companies. Only those
companies who have a minimum of 50 in disclosure scores are selected in this study, as
companies who get less than 50 are not awarded performance score. Therefore, the
minimum disclosure score of 50 and maximum of 100 indicate huge variation in the
extent of carbon disclosure made by the sample firms.
The mean of carbon performance score for the whole sample is 66.87 out of 100,
which is less than the mean of carbon disclosure score. Carbon performance scores are
awarded to companies for evidence provided in the CDP response of actions considered
to contribute to climate change mitigation, adaptation and transparency. Therefore, the
average score of 66.87 indicate above average carbon performance by the sample
companies. The minimum carbon performance score is 10 and maximum is 93. This
suggest a huge variation among sample companies in regards to their carbon
performance. Return on asset has a mean of 10.42%. Minimum ROA from the sample
companies is -148.37% and maximum is 31.24%. Tobin’s Q has a mean of 1.57% with
a minimum of 0.00% and a maximum of 8.13%. Minimum expense ratio for the sample
firms is 0.00 while the maximum is 0.82. It has a mean of 0.25. Asset utilization ratio
ranges from 0.11 to 4.49 with a mean of 0.78.
7.2.2 Country-wise descriptive statistics for major variables
The following table displays the country-wise descriptive statistics for major
variables for the entire study period (years 2011-2015).

123
Table 7.2 Country-wise descriptive statistics for major variables
Panel A: Carbon disclosure score
Region N Minimum Maximum Mean Std. Deviation
North America 455 50 100 84.25 13.25
EU 259 50 100 88.15 13.01
UK 100 53 100 86.106 10.99
Asia-Pacific 110 54 100 85.48 12.32
Panel B: Carbon performance score
North America 455 10 93 62.83 21.42
EU 259 10 93 72.34 20.72
UK 100 10 93 70.7 19
Asia-Pacific 110 10 93 66.13 19.39
Panel C: Financial Performance measured by ROA
North America 455 -148.37 38 11.63 11.34
EU 259 -8.29 51.24 9.92 8.5
UK 100 -13.65 32.37 9.18 7.33
Asian-Pacific 110 -12.53 21.42 7.8 6.08
Panel D: Financial Performance measured by Tobin’s Q
North America 455 0 6.21 1.8 1
EU 259 0.23 8.13 1.49 1.32
UK 100 0.54 2.84 1.37 0.63
Asia-Pacific 110 0.15 2.47 1.07 0.5

124
The above table presents country wise descriptive statistics for major variables.
Panel A shows that European Union firms have the highest scores in carbon disclosure
with a mean of 88.15, followed by UK (88.15) and Asia-Pacific (85.48). North
American firms have the lowest carbon disclosure score with an average score of 84.25.
This is consistent with CERES (2007) and Doran and Quinn (2009) which suggest that
US firms are behind their counterparts in reporting their exposure to climate change and
carbon emissions.
Panel B shows that EU firms have the best carbon performance scores with an
average score of 72.34 followed by UK (72.34) and Asia-Pacific (66.13). Similar to
carbon disclosure scores, North American firms have the worst carbon performance
scores with a mean of 62.83. Therefore, we can see that better carbon performers make
more carbon disclosure. This is consistent with studies such as Peng et al. (2015) and
Panel E: Agency cost measured by Expense Ratio
North America 455 0 0.82 0.26 0.16
EU 259 0 0.55 0.26 0.15
UK 100 0 0.79 0.26 0.24
Asia-Pacific 110 0.01 0.76 0.21 0.14
Panel F: Agency cost measured by Asset Utilization Ratio
North America 455 0.11 4.49 0.82 0.6
EU 259 0.3 2.17 0.76 0.37
UK 100 0.26 1.43 0.66 0.24
Asia-Pacific 110 0.17 2.71 0.81 0.52

125
Cotter and Najah (2012), who predict a positive association between carbon performance
and carbon disclosure.
Panel C and D indicate that North American firms have the best financial
performance both in terms of ROA and Tobin’s Q. Asia and Pacific has the worst
financial performance. This suggests that carbon performance and financial performance
are negatively associated. This is consistent with many studies such as Jaggi and
Freedman (1992) and Wang et al. (2014).
Panel E shows average Expense Ratios of firms from different regions. Firms
from North America, EU and UK have an average of 0.26 Expense Ratio, whilst Asia-
Pacific has an average Operating Ratio of 0.21. As mentioned earlier, Expense Ratio
(ER) is the ratio of operating expenses (selling, general, and administrative expenses,
excluding financing expenses and any non-recurring expenses, such as losses on the sale
of assets) to total annual sales. It measures how effectively a firm’s management controls
operating costs. Therefore, we can say that companies from Asia-Pacific region are more
effective in controlling operating costs than companies from other regions.
Panel F illustrates the Asset Utilization Ratio (AUR) of companies from different
regions. North American firms have the highest average AUR followed by Asia-Pacific,
EU and UK. As discussed before, AUR is calculated as the ratio of annual sales to total
assets. It measures how effectively a firm’s assets are employed. Therefore, we can
suggest that North American firms are most effective in utilizing their assets followed by
Asia-Pacific, EU and UK.

126
7.3 Diagnostic tests
As explained before, the hypotheses of this study are primarily tested by using
Ordinary Least Squares (OLS) multiple regression model. To perform statistical
analysis, it is necessary that the regression models used in a study meet the assumptions
of statistical analysis, such as:
1. Normality
2. Multicollinearity
3. Heteroscedasticity.
To validate the data and models used in this study Normality, Multicollinearity and
Heteroscedasticity tests have been done. The results are discussed below:
7.3.1 Normality Test
The normality assumption requires that observations be normally distributed in
the population. Although Coakes and Steed (2001) argue that violations of normality are
of little concern when the sample size is large (greater than 30). The Residual
Test/Histogram-Normality Test carried out for all the models used in this study produce
bell-shaped curves which confirms that the data used in this study are normally
distributed.
7.3.2 Multicollinearity test
Multicollinearity refers to high correlations among the independent (or
explanatory) variables. In other words, multicollinearity is present in a data set when the
explanatory variables are significantly correlated with one another. When a high degree

127
of correlation is found among explanatory variables, these variables must be removed.
For all the models used in this study, the correlation coefficients among the independent
(or explanatory) variables are very small (less than 0.50 or negative). Furthermore, the
Variance Inflation Factors (VIFs) of all the variables are less than 2, while it is argued
that VIFs of more than 10 are an indication of Multicollinearity (Dielman, 2001;
Gujarati, 2003; Hills and Adkins, 2003). Therefore, we can conclude that there is no
multicollinearity in any of the models used in this study.
7.3.3 Heteroscedasticity test
The heteroskedasticity assumption requires that the variance of the error be
constant across observations (all levels of explanatory variables) or that the residuals of
the dependent variables be approximately equal or constant. In other words, the data
points will be spread uniformly across the regression line. If the plots of standardized
residuals (ZRESID) against the standardized predicted value (ZPRED) of a model
appear as a funnel or curve shape, it indicates evidence of heteroskedasticity in the
model. The Chi squared statistics and corresponding p value of the Breusch–Pagan–
Godfrey test can also find out whether there heteroskedasticity is present in a model.
Presence of heteroskedasticity has been checked in all models of this study. Whenever
heteroskedasticity has been found in any model it has been corrected by using the
correction technique for unknown heteroskedasticity proposed by White (1980).

128
7.4 Empirical results for the relationship and interrelationship between
carbon disclosure and carbon performance
There are three objectives of this section. Firstly, this section would like to
analyse and interpret the relationship between carbon disclosure and carbon performance
(H1 and H2). Secondly, it would like to analyse and interpret the interrelationship
between carbon disclosure and carbon performance (H3), and thirdly, it would like to
analyse carbon disclosure practices of average carbon performers (H4).
7.4.1 Regression results for the relationship between carbon disclosure and carbon
performance for H1 and H2
This section analyses the relationship between carbon disclosure, carbon
performance and control variables. Table 7.3 (panel A) shows the regression results
between carbon disclosure and carbon performance and between carbon disclosure and
the control variables. The t tests are presented in the parentheses in this table and in all
subsequent relevant tables. The regression results from this table indicate that there is
significant positive relations between carbon disclosure and carbon performance at 1%
significance level. This means firms with better carbon performance would make more
carbon disclosure. This result supports hypothesis 2 which proposes a positive
relationship between carbon performance and carbon disclosure. This finding is in
congruence with the economics-based theories (Voluntary Disclosure Theory and
Signalling Theory) which suggest firms with good performance are likely to disclose
more information to signal their good quality to investors, and to differentiate
129
themselves from companies with ‘bad news’ to avoid the adverse selection problem
(Clarkson et al, 2008; Al-Tuwaijri et al., 2004; Peng et al., 2015; Cotter & Najah 2012).
After testing the control variables, the regression results show that carbon
disclosure is significantly positively related to company size and growth opportunities
(both at 5% significance level) and negatively related to dividend yield (at 1%
significant level). Other explanatory variables such as leverage, capital intensity, firm
age, carbon intensity and dividend payout, do not have any significant influence on firm
carbon disclosure.
These results imply that larger firms would make more carbon disclosure than
smaller firms. This finding is supported by numerous studies which suggest that large
firms have the resources to disseminate detailed information, and these firms are more
visible and are susceptible to a high degree of public scrutiny (Liu & Anbumozhi, 2009;
Stanny & Ely, 2008; Clarkson et al., 2008; Cormier et al., 2005; Freedman & Jaggi
2005; Prado-Lorenzo et al., 2009; Choi et al, 2013). These results also imply that there is
a significant positive relationship between firm’s carbon disclosure and its growth
opportunity, i.e. firms with higher growth opportunities would make more carbon
disclosure. This finding is supported by Dhaliwal et al. (2011) and Wang (2017). In
regards to the relationship between carbon disclosure and dividend yield, the results
suggest that companies with higher dividend yield, i.e. those who pay more dividend per
share, make less carbon disclosure and vice versa. This result contradicts previous
studies such as Richardson et al. (1999) who suggest that socially and environmentally
responsible companies are more profitable and therefore, are likely to pay more
dividend. Needless to say, the analysis results from Table 7.3 do not support
130
hypothesis 1 which proposes a negative relationship between carbon disclosure and
carbon performance.
Adjusted R–squared of 0.59 shows that carbon disclosure is explained by all the
variables (carbon performance, firm size, leverage, capital intensity, firm age, firm
growth opportunity, carbon intensity, dividend yield and dividend payout) to the extent
of 58%. F test implies that the model appears to be good since the p value is less than
1%. Panel B of Table 7.3 shows the regression results between carbon disclosure and
carbon performance and control variables, after controlling the regression equation for
industry and time effects. The relationship between carbon disclosure and carbon
performance remains significantly positive even after controlling for industry and time
effect. However, in the industry and time adjusted regression results,
relationship/significance of relationship between carbon disclosure and some of the
control variables such as firm size, leverage, capital intensity, carbon intensity and
dividend yield, seem to vary across industry and time periods.

131
Table 7.3 Regression results for the relationship between carbon disclosure and
carbon performance
CD i,t = α + β1 CP i,t + β2 SIZE i,t + β3 LEV i,t + β4 CAPIN i,t + β5 AGE i,t + β6 GROWTH
i,t + β7 CINT i,t + β8 DIVYIELD i,t + β9 DIVPAY i,t + εi,t
Panel A Panel B
(Before controlling for
industry and time)
(After controlling for
industry and time)
Intercept 46.944***
(12.509)
48.169***
(15.639)
CP 0.460***
(35.724)
0.424***
(35.911)
SIZE 0.699**
(2.021)
0.082
(0.2774)
LEV 0.092
(4.224)
0.064***
(3.354)
CAPIN -2.998
(-0.913)
-4.226*
(-1.656)
AGE -0.075
(-0.226)
-0.059
(-0.203)
GROWTH 0.000**
(2.219)
0.000***
(2.413)
CINT 1.072
(1.555)
-0.567
(-0.429)
DIVYIELD -0.310***
(-1.949)
-0.111
(-0.762)
DIVPAY -0.007
(-0.667)
-0.003
(-0.422)
Adjusted 0.5908 0.736
R-squared
F-statistic 151.845*** 121.071***
_____________________________________________________________________________________
***, ** and * represent significance levels at 1%, 5% and 10% respectively. t-statistics are provided in
parentheses.
132
7.4.2 Regression results for the interrelationship between carbon disclosure and
carbon performance for H3
The purpose of this section is to analyse the interrelationship between carbon
disclosure and carbon performance. To do so, two models have been used. The first
model is used to analyse the relationship between previous year’s carbon disclosure and
current year’s carbon performance and relevant control variables. The second model is
used to analyse the relationship between previous year’s carbon performance and current
year’s carbon disclosure and relevant control variables. The regression results of first
and second models are shown in Tables 7.4 and Table 7.5 respectively.
Regression results from Table 7.4 (panel A), show that there is a significant
positive relationship between last year’s carbon disclosure and current year’s carbon
performance at 1% significance level. On the other hand, regression results from Table
7.5 (panel A) also show that there is a significant positive relationship (at 1%
significance level) between last year’s carbon performance and current year’s carbon
disclosure. These results indicate that if a firm’s carbon disclosure improves in a year, its
carbon performance is likely to improve next year which is supported by the
propositions of Instrumental Stakeholder Theory. On the other hand, if the carbon
performance of a firm improves in a year, its carbon disclosure is likely to improve next
year which can be explained by the propositions of Signalling Theory. Both these results
hold true when industry and time effects are also considered as shown is Panel B of
Table 7.4 and 7.5. Combining these two results, we can argue that there is a two-way
positive relationship between carbon disclosure and carbon performance, where increase
in carbon disclosure of a firm in a period will improve its carbon performance for the
next period (as predicted by Instrumental Stakeholder Theory), and consequently,

133
improved carbon performance will lead to more carbon disclosure by the firm in the
subsequent period as predicted by Signalling Theory. Therefore, we can conclude that
the above results support hypothesis 3 which proposes that carbon disclosure and carbon
performance influence each other positively.
Table 7.4 (panel A) also shows that, from the control variables, firm size, firm age,
dividend yield and dividend payout are significantly positively related to carbon
performance, while capital intensity, and growth opportunity are significantly
negatively related to carbon performance. This means larger and older firms and firms
who pay more dividend per share would have better carbon performance. Numerous
previous studies predict a positive relationship between firm size and environmental and
carbon disclosure which have been mentioned in the previous section. However, this
study could not find any previous study that predict a relationship between firm size and
carbon performance. However, it can be assumed that larger firms would have more
resources to improve their carbon performance. A number of previous studies support
the positive relationship between firm age and environmental/carbon performance, for
example, Mohana-Neill (1995) suggest that older firms are more likely to possess the
necessary infrastructure to manage environmental issues at a lower cost. Similarly,
Huergo and Jaumandreu (2004) argue that older firms are more likely to engage in
environmental activities.
Many previous studies such as Denis and Igor (2008), Myers and Fr (2004),
Labhane and Mahakud (2016) and Petra et al. (2012), find that dividend distribution is
positively related to corporate financial performance. Richardson et al. (1999) find that
corporate financial performance is positively affected by the business’s environmental

134
performance. Therefore, we can argue that there is a positive relationship between
corporate carbon performance and dividend distribution.
The negative relationship between carbon performance and capital intensity is
contradicted by Clarkson et al. (2008) who argue that firms who would make more
capital spending are likely to have newer, cleaner technologies and consequently, these
firms are likely to have a superior environmental performance measure. The negative
relationship between carbon performance and growth opportunity is also contradicted by
previous studies. Al-Tuwaijri et al. (2004) use growth as a proxy for intangible assets
associated with innovation (Porter & van der Linde, 1995a), and therefore argue that
growth is positively related to environmental performance.
Panel B of Table 7.4 shows the regression results between carbon performance
and control variables after controlling the regression equation for industry and time
effects. Regression results and relationship/significance of relationship between carbon
performance and some of the control variables such as firm leverage, capital intensity,
growth opportunity and dividend payout, seem to vary across industry and time periods.
Table 7.5 shows a positive relationship of firm size and leverage with carbon
disclosure while it shows a negative relationship between carbon disclosure and
leverage. The positive relationship between firm size and carbon disclosure has already
been discussed before. A number of studies such as Clarkson et al. (2008) and Freedman
and Jaggi (2005) support the positive relationship between firm leverage and voluntary
disclosure. However, the negative relationship between carbon disclosure and capital
intensity is contradicted by previous studies such as Clarkson et al. (2008) who suggest
firms with higher sustaining capital expenditures are expected to have newer equipment

135
and may want to signal their environmental type through more discretionary disclosures
regarding their environmental performance.
In Table 7.4, p value of both the models used (before and after controlling for
industry and time effects) are less than 1%. This implies that both these models are
good. Similarly, both the models used in Table 7.5 also appear to be good models, as p
value of their F test is less than 1%.

136
Table 7.4 Regression results for the relationship between previous year’s carbon
disclosure and current year’s carbon performance
CP i,t = α + γ1 CD(-1) i,t + γ2 SIZE i,t + γ3 LEV i,t + γ4 CAPIN i,t + γ5 AGE i,t + γ6
GROWTH i,t + γ7 CINT i,t + γ8 DIVYIELD i,t + γ9 DIVPAY i,t + εi,t
Panel A Panel B
(Before controlling for
industry and time)
(After controlling for
industry and time)
Intercept -33.343***
(-3.681)
-70.549***
(-7.885)
CD(-1) 0.627***
(12.260)
0.883***
(15.438)
SIZE 3.232***
(4.0523)
3.488***
(4.486)
LEV 0.038
(0.786)
-0.007
(-0.160)
CAPIN -13.365**
(-2.162)
-3.940
(-0.625)
AGE 1.712**
(2.347)
1.186*
(1.665)
GROWTH -0.001*
(-1.730)
-0.001
(-1.585)
CINT -2.105
(-1.337)
-6.101
(-1.240)
DIVYIELD 1.371***
(3.447)
1.152***
(2.857)
DIVPAY 0.047**
(2.089)
0.021
(0.988)
Adjusted
R-squared
0.223 0.361
F-statistic 31.081*** 25.240***
_____________________________________________________________________________________
***, ** and * represent significance levels at 1%, 5% and 10% respectively. t-statistics are provided in
parentheses.

137
Table 7.5 Regression results for the relationship between previous year’s carbon
performance and current year’s carbon disclosure
CD i,t = α + γ1 CP(-1) i,t + γ2 SIZE i,t + γ3 LEV i,t + γ4 CAPIN i,t + γ5 AGE i,t + γ6
GROWTH i,t +γ7 CINT i,t + γ8 DIVYIELD i,t + γ9 DIVPAY i,t + εi,t
Panel A Panel B
(Before controlling for
industry and time)
(After controlling for
industry and time)
Intercept
45.3537***
(8.688)
38.794***
(8.732)
CP(-1) 0.268954***
(14.743)
0.246***
(13.964)
SIZE 1.685975***
(3.564)
1.236
(2.844)
LEV 0.10678***
(3.807)
0.074***
(2.941)
CAPIN -7.457043**
(-2.024)
-5.801*
(-1.816)
AGE 0.557975
(1.213)
0.435
(1.050)
GROWTH -0.000243
(-0.623)
-0.000
(-0.545)
CINT 0.417346
(0.427)
-3.589
(-1.090)
DIVYIEL
D
0.144022
(0.650)
0.256
(1.211)
DIVPAY -0.002014
(-0.146)
-0.0031
(-0.263)
Adjusted 0.249599 0.472
R-squared
F-statistic 35.777*** 39.308***
_____________________________________________________________________________ ***, ** and * represent significance levels at 1%, 5% and 10% respectively. t-statistics are provided in
parentheses.

138
7.4.3 Country-wise analysis for the relationship between carbon disclosure and
carbon performance
The sample companies of this study has been divided into five regions, namely:
North America, European Union (EU), the United Kingdom (UK), Asia-Pacific and
Others. Table 7.6 shows the relationship and interrelationship between carbon disclosure
and carbon performance of the first four groups. Others group has been excluded from
the country-wise analysis as this group consisted of only 4 companies. In all of the four
regions, carbon disclosure is significantly positively related to carbon performance, all at
1% significance level. These results are congruent with full sample results. This implies
that in all regions, firms with better carbon performance will make more carbon
disclosure. These findings are supported by a number of previous studies which have
been mentioned before. This finding supports H2.
The proposed relationship in H3 that carbon disclosure and carbon performance
influence each other positively holds true in all regions with a significance level of 1%
except in the UK. Even in the UK, carbon disclosure of the previous year is positively
related to carbon performance of the current year, and carbon performance of the
previous year is positively related to carbon disclosure of the current year. However,
whilst the relationship between previous year’s carbon performance and current year’s
carbon disclosure is statistically significant at 1% level, the relationship between
previous year’s carbon disclosure and current year’s carbon performance is not
statistically significant.
All the models used in Table 7.6 for country-wise analysis are good models as
the p value of their F tests are less than 1%.

139
Table 7.6 Country wise regression results for the relationship and interrelationship between carbon disclosure and
carbon performance
Variable North America
European Union
United Kingdom
Asia-Pacific
CD CP CD
CD CP CD
CD CP CD
CD CP CD
CP 0.456***
0.486***
0.348***
0.434***
(24.235)
(18.671)
(5.930)
(11.417)
CD(-1)
0.665***
0.410***
0.135
0.494***
(9.680)
(3.658)
(0.599)
(2.895)
CP(-1)
0.290***
0.195***
0.220***
0.196***
(10.802)
(5.086)
(3.9470
(3.077)
SIZE 1.176** 2.874** 1.884***
0.338 5.073*** 2.476**
0.540 9.777*** 1.447
0.313 4.356 1.608
(2.511) (2.577) (3.055)
(0.451) (93.188) (2.364)
(0.365) (3.116) (0.797)
(0.264) (1.418) (0.921)
LEV 0.105*** 0.086 0.128***
0.078 0.267** 0.207***
0.258*** 0.395* 0.347***
0.096 -0.135 0.089
(3.195) (1.235) (3.245)
(1.603) (2.234) (2.638)
(3.230) (1.975) (3.769)
(1.372) (-0.912) (0.957)
CAPIN -1.939 -2.257 -2.347
-18.200* -69.465** -50.436***
6.432 -1.057 -9.408
-5.112 -11.530 -8.280
(-0.485) (-0.257) (-0.451)
(-1.701) (-2.565) (-2.993)
(0.365) (-0.026) (-0.498)
(-0.446) (-0.990) (-0.858)
AGE -0.650 0.052 -0.716
0.660 4.248*** 2.418***
-0.070 -2.410 -0.469
-0.940 0.666 -0.595
(-1.248) (0.043) (-0.944)
(1.112) (3.712) (2.936)
(-0.064) (-0.840) (-0.364)
(-0.763) (0.294) (-0.391)
GROWTH 0.000 -0.011 -0.010**
0.304 0.553 0.585
0.001*** -0.002*** 0.000
1.989* 0.357 2.227
(0.051) (-0.671) (-2.486)
(1.152) (0.973) (1.433)
(3.201) (-4.488) (0.287)
(1.849) (0.167) (1.580)
CINT 0.325 -3.267 -1.169
2.532** 1.208 3.553**
-1.571 -3.480 0.720
2.250 0.738 2.355
(0.286) (-1.273) (-0.702)
(2.565) (0.418) (2.261)
(-0.413) (-0.439) (0.173)
(0.710) (0.129) (0.659)
DIVYIELD -1.028*** 1.149 -0.390
0.162 1.771** 0.854
-0.661 -3.928*** -1.428*
-0.884 0.672 -0.849
(-3.288) (1.272) (-0.910)
(0.664) (2.578) (2.090)
(-1.0480 (-2.970) (-1.957)
(-1.631) (0.458) (-0.972)
DIVPAY 0.015 0.068 0.013
0.014 0.063 0.033
-0.020 -0.066 -0.033
-0.074** -0.044 -0.089**
(0.721) (1.570) (0.485)
(0.803) (1.142) (1.168)
(-0.713) (-1.010) (-1.152)
(-2.3640 (-0.624) (-2.338)
Adjusted R2 0.578 0.235 0.274
0.686 0.252 0.290
0.468 0.175 0.283
0.517 0.059 0.134
F-statistic 69.996*** 16.439*** 20.036*** 63.511*** 10.581*** 12.612***
10.692*** 3.310*** 5.307***
13.981*** 1.756*** 2.863***

140
7.4.4 Empirical results for disclosure practices of average carbon performers for
H4
To test this hypothesis, a single factor ANOVA analysis is done where the
average carbon disclosure scores of superior carbon performers, average carbon
performers and inferior carbon performers, are compared for the full sample. Firms who
got A in carbon performance are considered as superior carbon performers. Firms who
got B and C are considered average carbon performers, and firms who got D and E are
considered as inferior carbon performers. To substantiate the findings from ANOVA
analysis, Tukey’s post hoc multiple comparison tests is done. The following tables show
the test outcomes:
ANOVA: Single Factor
SUMMARY
Groups Count Sum
Average carbon
disclosure score Variance
Superior Carbon performers (A) 214 20579 96.163 16.913
Average Carbon performers (B&C) 602 51889 86.194 113.724
Inferior Carbon performers (D&E) 127 8469 66.6857 115.582
ANOVA
Disclosure Score Sum of Squares df Mean Square F Sig.
Between Groups 69480.574 2 34740.287 377.555 0
Within Groups 86492.938 940 92.014
Total 155973.512 942

141
Tukey’s post hoc multiple comparisons
Dependent Variable: Disclosure score
Tukey HSD
Carbon
Performance
Carbon
Performance
Mean
Difference Std. Error Sig.
95% Confidence
Interval
Lower Bound
Upper
Bound
Superior
Average 9.969* 0.763 0 8.18 11.76
Poor 29.479* 1.074 0 26.11 32
Average
Superior -9.969* 0.763 0 -11.76 -8.18
Poor 19.509* 0.937 0 17.31 21.71
Poor
Superior -29.479* 1.074 0 -32 -26.11
Average -19.509* 0.937 0 -21.71 -17.31
The mean difference is significant at the 0.05 level.
Superior (Superior carbon performers) = A
Average (Average carbon performers) = B & C
Poor (Poor carbon performers) = D & E
***, ** and * represent significance levels at 1%, 5% and 10% respectively.
Interpretation of the above tests:
From the descriptive analysis shown in the summary table above, the estimated
average disclosure scores are 96.17, 86.20 and 66.69, for superior, average and poor
carbon performers respectively. This means on average, superior carbon performers

142
make more carbon disclosure than average carbon performers, whereas average carbon
performers make more carbon disclosure than inferior carbon performers. From the
overall F test result from the next table above, we can conclude that there are
significant (F test p- value = 0.000) differences among average disclosure scores of the
three carbon performance group, namely superior, average and inferior performers.
This result is backed by Tukey’s Post hoc multiple comparison test shown in the next
table. From this test, with 95% confidence, it can be concluded that the average
disclosure score of superior performers, exceeds the average disclosure score of
average performers by values between a minimum of 8.18 and a maximum of 11.76.
Similarly, it can be also concluded that the average disclosure score of average
performers exceeds that of the poor performers, by values between a minimum of 17.31
and a maximum of 21.71.
From the above findings of ANOVA and Tukey’s Post hoc multiple comparison
test, we can see a one directional change in the carbon disclosure scores, which implies
that superior carbon performers make more carbon disclosure than average carbon
performers, and average carbon performers make more carbon disclosure than inferior
carbon performers. These findings contradict H4 which suggest that both superior and
inferior carbon performers make significantly more carbon disclosure than average
carbon performers. However, these findings are in congruence with H2 and a number of
studies such as Clarkson et al. (2008); Al-Tuwaijri et al. (2004); Peng et al. (2015) and
Cotter and Najah (2012), who suggest that better carbon performers would make more
carbon disclosure than inferior carbon performers.

143
7.5 Empirical results for the relationship and interrelationship between
carbon performance and financial performance
The purpose of this section is to analyse and interpret the relationship (one-way
relationship) and interrelationship (both-way relationship) between carbon performance
and financial performance. These relationships are hypothesized in H5 and H6.
7.5.1 Regression results for the relationship between carbon performance and
financial performance for H5
This section analyses the relationship between carbon performance and financial
performance. In this study, financial performance is alternatively measured by both
ROA and Tobin’s Q. Table 7.7 shows the regression results between carbon
performance and financial performance when financial performance is measured by
ROA, while Table 7.8 shows the relationship between carbon performance and financial
performance when financial performance is measured by Tobin’s Q.
Panel A of Table 7.7 shows that carbon performance is significantly negatively
related to ROA at 1% significance level. When industry and time effects are considered
(shown in Panel B), the relationship between carbon performance and financial
performance still remains significantly negative (at 5% significance level). This implies
that when carbon performance of a business improves, its financial performance in terms
of return on asset, deteriorates. When financial performance is measured in terms of
Tobin’s Q (as shown in Table 7.8 panel A), there is a negative but insignificant
relationship between carbon performance and Tobin’s Q. However, when industry and
time effects are considered (as shown in Table 7.8 panel B), carbon performance and

144
Tobin’s Q shows a significant negative relationship (at 5% significance level).
Therefore, we can assume that carbon performance affects Tobin’s Q negatively, i.e. if a
firm’s carbon performance improves, the financial performance of that firm, measured in
terms of its Tobin’s Q, would decrease. Combining these two results, we can conclude
that carbon performance and financial performance are not positively related, but rather
they are negatively related, regardless of the way financial performance is measured.
These findings are backed up by numerous previous studies. Jaggi and Freedman (1992)
predict that in the short run, pollution performance is negatively associated with
economic performance and that the markets do not reward good pollution performance.
Cordeiro and Sarkis (1997) demonstrate a significant negative relationship between
environmental proactivism and industry analyst earnings-per-share. Filbeck and Gorman
(2004) find evidence of a negative relationship between financial return and a more pro-
active measure of environmental performance. Sarkis and Cordeiro (2001) find that
pollution prevention and end-of-pipe efficiencies are both negatively related to ROS.
Ennis et al. (2012) find if carbon emission increases and therefore carbon performance
decreases, revenue will increase. They also find that emissions levels are not presently
drivers of stock prices. According to them, financial markets are not yet responsive to
the carbon performance of companies. Matsumura et al. (2013) predict and find a
negative association between carbon emissions and firm value. They observe that
markets penalise all firms for their carbon emissions. Wang et al. (2014) find that when
measured by Tobin’s Q, financial performance is negatively related to carbon
performance.
While testing the control variables of Table 7.7, and after considering industry
and time effects, we find that firm size and dividend payout show a positive relationship

145
with ROA, while capital intensity and dividend yield show a negative relationship with
ROA. When financial performance is measured by Tobin’s Q (as shown in Table 7.8)
and industry and time effects are considered, firm size and divided payout per share are
positively related - and firm age and dividend yield are negatively related to Tobin’s Q.
Numerous previous studies such as Nehring et al. (2009); Adenauer and Heckelei
(2011); Chaddad and Mondelli (2013), hypothesize a direct relationship between
organisational size and financial performance. The arguments used to justify a direct and
positive relationship between profitability and size, focus on the greater resources and
market opportunities of large companies, which can enable economies of scale. Large
companies also have greater negotiating power with customers and suppliers, as well as
easier access to international markets. As mentioned earlier, many previous studies such
as Denis and Igor (2008), Myers and Frank (2004), Labhane and Mahakud (2016) and
Petra et al. (2012), find that dividend distribution is positively related to corporate
financial performance
7.5.2 Country-wise regression results for the relationship between carbon
performance and financial performance
From Table 7.9 we can see that, in all the regions except UK carbon performance
is negatively related to both ROA and Tobin’s Q. However, in North America, the
relationship between carbon performance and Tobin’s Q is significant, while the
relationship between carbon performance and ROA is insignificant. Both in EU and
Asia-Pacific, relationships between carbon performance and ROA are significant.
However, in these regions, the relationships between carbon performance and Tobin’s Q
146
are insignificant. The relationships of carbon performance with ROA and Tobin’s Q
from North America, EU and UK are to some extent similar to the full sample results,
especially in the direction of the relationship. All these regions predict a negative
relationship between carbon performance and ROA, and Tobin’s Q. The UK is the only
region where carbon performance is positively related to both ROA and Tobin’s Q.
However, only the relationship between carbon performance and Tobin’s Q is
significant in this region. All the models used in Table 7.7, Table 7.8 and Table 7.9, are
good models, as the p value of their F tests are less than 1%.
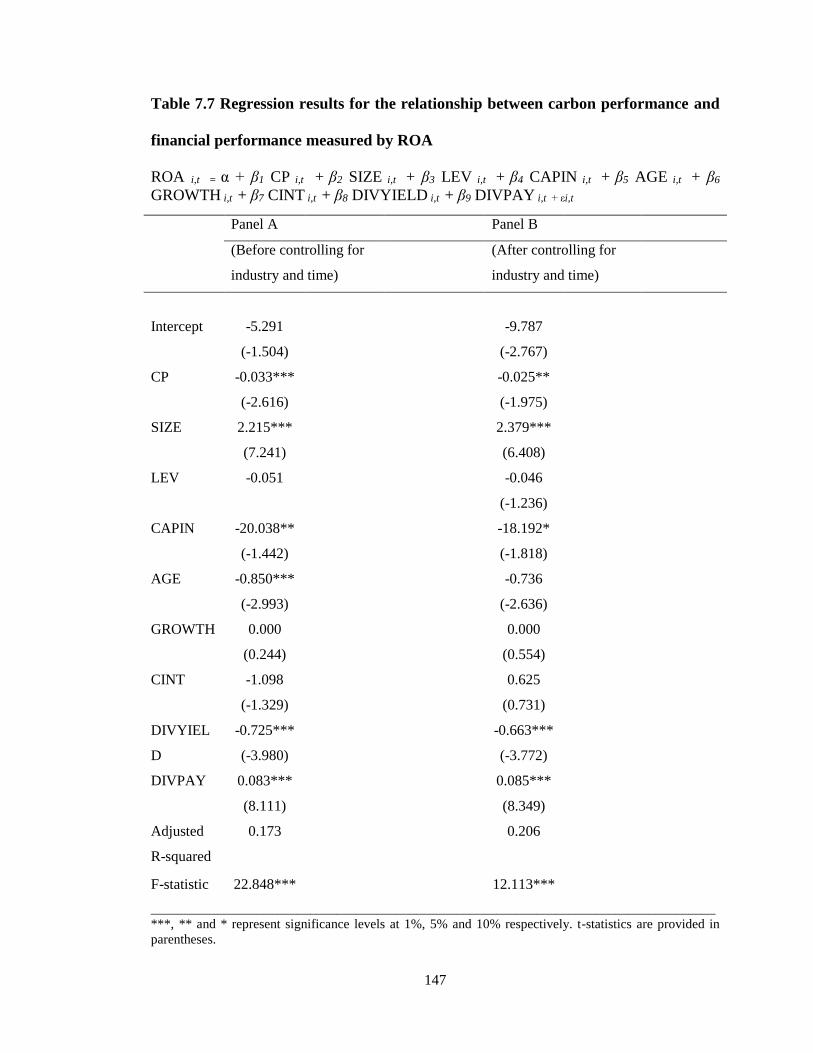
147
Table 7.7 Regression results for the relationship between carbon performance and
financial performance measured by ROA
ROA i,t = α + β1 CP i,t + β2 SIZE i,t + β3 LEV i,t + β4 CAPIN i,t + β5 AGE i,t + β6
GROWTH i,t + β7 CINT i,t + β8 DIVYIELD i,t + β9 DIVPAY i,t + εi,t
Panel A Panel B
(Before controlling for
industry and time)
(After controlling for
industry and time)
Intercept -5.291
(-1.504)
-9.787
(-2.767)
CP -0.033***
(-2.616)
-0.025**
(-1.975)
SIZE 2.215***
(7.241)
2.379***
(6.408)
LEV -0.051 -0.046
(-1.236)
CAPIN -20.038**
(-1.442)
-18.192*
(-1.818)
AGE -0.850***
(-2.993)
-0.736
(-2.636)
GROWTH 0.000
(0.244)
0.000
(0.554)
CINT -1.098
(-1.329)
0.625
(0.731)
DIVYIEL
D
-0.725***
(-3.980)
-0.663***
(-3.772)
DIVPAY 0.083***
(8.111)
0.085***
(8.349)
Adjusted 0.173 0.206
R-squared
F-statistic 22.848*** 12.113***
_____________________________________________________________________________________
***, ** and * represent significance levels at 1%, 5% and 10% respectively. t-statistics are provided in
parentheses.

148
Table 7.8 Regression results for the relationship between carbon performance and
financial performance measured by Tobin’s Q
TOBINSQ i,t = α + β1 CP i,t + β2 SIZE i,t + β3 LEV i,t + β4 CAPIN i,t + β5 AGE i,t + β6
GROWTH i,t + β7 CINT i,t + β8 DIVYIELD i,t + β9 DIVPAY i,t + εi,t
Panel A Panel B
(Before controlling for
industry and time)
(After controlling for
industry and time)
Intercept -0.280
(-0.698)
-0.299
(-0.737)
CP -0.002
(-1.525)
-0.003**
(-2.107)
SIZE 0.252***
(7.525)
0.179***
(5.042)
LEV 0.003
(0.687)
0.001
(0.276)
CAPIN -0.805***
(-3.758)
-0.164
(-0.863)
AGE -0.099***
(-2.768)
-0.101***
(-2.851)
GROWTH 0.000
(1.601)
0.000
(0.375)
CINT -0.301***
(-5.304)
0.075
(0.932)
DIVYIEL
D
-0.172***
(-8.862)
-0.116***
(-5.865)
DIVPAY 0.007***
(5.413)
0.007***
(5.370)
Adjusted 0.174 0.238
R-squared
F-statistic 23.054*** 14.398***
_____________________________________________________________________________________
***, ** and * represent significance levels at 1%, 5% and 10% respectively. t-statistics are provided in
parentheses.

149
Table 7.9 Country wise regression results for the relationship between carbon performance and financial performance
Variable North America
European Union
United Kingdom
Asia-Pacific
ROA Tobin’s Q
ROA Tobin’s Q
ROA Tobin’s Q
ROA Tobin’s Q
CP -0.019 -0.004**
-0.039* -0.000
0.039 0.006**
-0.041* -0.001
(-.968) (-2.026)
(-1.794) (0.1822)
(1.383) (2.367)
(-2.005) (-0.695)
SIZE 1.126*** 0.181***
1.194** -0.015
2.693** 0.358***
3.396*** 0.158***
(2.9420 (4.182)
(2.364) (-0.285)
(2.1920 (4.488)
(5.053) (5.264)
LEV -0.028 0.020***
-0.122*** -0.020***
0.073 0.014***
-0.099** -0.009***
(-.489) (5.026)
(-.3.803) (-.4.245)
(1.156) (2.629)
(-0.2600) (-4.281)
CAPIN -34.494** -1.509***
24.928*** 1.847***
-14.262 0.364
4.992 0.705***
(-2.212) (-5.967)
(4.045) (2.788)
(-0.982) (0.344)
(0.834) (3.163)
AGE -1.309*** -0.215***
0.895** 0.114**
-0.617 -0.021
-0.604 -0.019
(.3.510) (4.464)
(2.244) (2.3620
(-0.812) (-0.335)
(-0.971) (-0.801)
GROWTH 0.011* 0.000
2.396*** 0.441***
0.000 0.000***
3.138*** 0.395***
(1.720) (0.327)
(9.491) (11.511)
(0.370) (2.773)
(5.721) (12.151)
CINT -0.984 -0.327***
1.134* -0.033
0.080 -0.430*
0.742 0.104*
(-.5870 (-0.401)
(1.655) (-0.6280
(0.264) (-1.837)
(0.514) (1.747)
DIVYIELD -1.102*** -0.333***
-0.099 0.023
-1.168** -0.129***
0.261 0.000
(-4.127) (-11.010)
(-.525) (1.248)
(-2.316) (-3.673)
(0.893) (0.0240
DIVPAY 0.101
(5.739)***
0.009***
(4.433)***
0.027**
(2.079)
0.004***
(2.810)
0.112***
(4.715)
0.006***
(3.367)
0.015
(0.937)
0.002**
(2.414)
Adjusted
R2 0.229 0.318
0.620 0.793
0.307 0.495
0.507 0.810
F-statistic 15.944*** 24.515
47.860*** 110.880***
5.879*** 11.792***
13.452*** 52.720***
_____________________________________________________________________________________________________ ***, ** and * represent significance levels at 1%, 5% and 10% respectively. t-statistics are provided in parentheses.
150
7.5.3 Regression results for the interrelationship between financial performance
(measured by ROA) and carbon performance for H6
From Table 7.10, we find that previous year’s carbon performance significantly
negatively affects current year’s ROA at 1% significance level. This relationship
remains valid after controlling for industry and time effects. On the other hand, Table
7.11 shows that although there is a negative relationship between last year’s ROA and
current year’s carbon performance, this relationship is not significant. This relationship
between last year’s ROA and current year’s carbon performance remains the same, even
after controlling for industry and time effects. When these two results are put together,
we can suggest that when financial performance is measured by Return on Asset, there
seems to be no significant interrelationship between carbon performance and financial
performance. These findings negate hypothesis 6. Regression results of Table 7.10 and
7.11, indicate that after controlling for industry and time effects, size and dividend
payout show positive relationship with ROA, while capital intensity, firm age and
dividend yield show negative relationships with ROA. On the other hand, firm size, firm
age, dividend yield, and dividend payout are positively related to carbon performance,
while carbon intensity and capital intensity are negatively related to carbon performance.
Studies related to the positive relationship of firm size, firm age, dividend yield and
dividend payout with carbon performance, have already been discussed before. The
negative relationship between capital intensity and carbon performance is contradicted
by studies such as Clarkson et al. (2008), who argue that firms who would make more
capital spending are likely to have newer, cleaner technologies. Consequently, these
firms are likely to have a superior environmental performance measure. The negative

151
relationship between carbon intensity and carbon performance is supported by Luo et al.
(2014), who suggest that firms from carbon intensive industries inherently emit more
carbon, and therefore carbon intensity would negatively affect firm carbon performance.

152
Table 7.10 Regression results for the relationship between financial performance
measured by ROA of current year and carbon performance of previous year
ROA i,t = α + γ1 CP(-1) i,t + γ2 SIZE i,t + γ3 LEV i,t + γ4 CAPIN i,t + γ5 AGE i,t + γ6
GROWTH i,t + γ7 CINT i,t + γ8 DIVYIELD i,t + γ9 DIVPAY i,t + εi,t
Panel A Panel B
(Before controlling for
industry and time)
(After controlling for
industry and time)
Intercept -4.694
(-1.344)
-8.496**
(-2.438)
CP(-1) -0.045***
(-3.813)
-0.035***
(-2.932)
SIZE 2.247***
(7.143)
2.414***
(6.228)
LEV -0.051
(-1.461)
-0.046
(-1.264)
CAPIN -20.510**
(-2.064)
-18.435*
(-1.828)
AGE -0.878***
(-3.116)
-0.772***
(-2.752)
GROWTH 0.000
(0.396)
0.000
(0.578)
CINT -0.937
(-1.134)
0.859
(0.989)
DIVYIEL
D
-0.770***
(-4.122)
-0.672***
(-3.758)
DIVPAY 0.085***
(8.094)
0.086***
(8.371)
Adjusted 0.178 0.209
R-squared
F-statistic 23.597*** 12.303***
_____________________________________________________________________________________
***, ** and * represent significance levels at 1%, 5% and 10% respectively. t-statistics are provided in
parentheses.

153
Table 7.11 Regression results for the relationship between financial performance
measured by ROA of previous year and carbon performance of current year
CP i,t = α + γ1 ROA(-1) i,t + γ2 SIZE i,t + γ3 LEV i,t + γ4 CAPIN i,t + γ5 AGE i,t + γ6
GROWTH i,t + γ7 CINT i,t + γ8 DIVYIELD i,t + γ9 DIVPAY i,t + εi,t
Panel A Panel B
(Before controlling for
industry and time)
(After controlling for
industry and time)
Intercept 8.306
(0.863)
-0.503
(-0.051)
ROA(-1) -0.005
(-0.067)
-0.020
(-0.298)
SIZE 4.216***
(4.755)
5.014***
(5.290)
LEV 0.088*
(1.690)
0.048
(0.874)
CAPIN -22.359***
(-3.463)
-11.823*
(-1.754)
AGE 1.919**
(2.476)
1.506*
(1.867)
GROWTH -0.002
(-1.055)
-0.001
(-0.864)
CINT -1.492
(-0.858)
-9.952*
(-1.684)
DIVYIEL
D
1.211***
(2.943)
1.605***
(3.722)
DIVPAY 0.069***
(2.787)
0.046*
(1.812)
Adjusted
R-squared 0.081 0.158
F-statistic 10.171*** 9.062***
_____________________________________________________________________________________
***, ** and * represent significance levels at 1%, 5% and 10% respectively. t-statistics are provided in
parentheses.
154
7.5.4 Regression results for the interrelationship between financial performance
(measured by Tobin’s Q) and carbon performance for H6
Table 7.12 shows that there is a negative but insignificant relationship between
carbon performance of last year and financial performance of current year when
financial performance is measured by Tobin’s Q. However, when the results are
controlled by industry and time, this relationship becomes significant. This finding
implies that there is a possibility of a negative relationship between carbon performance
of last year and financial performance of current year when financial performance is
measured by Tobin’s Q. However, this relationship might vary across industries. The
negative relationship between carbon performance and financial performance (measured
by Tobin’s Q), is supported by Wang et al. (2014). On the other hand, Table 7.13 shows
that last year’s financial performance significantly negatively affect current year’s
carbon performance, when financial performance is measured by Tobin’s Q. However,
when industry and time effects are considered, this relationship still remains negative but
becomes insignificant. This again indicates that the relationship between last year’s
financial performance (measured by Tobin’s Q) and current year’s carbon performance,
may vary across industries. The negative relationship between carbon performance and
financial (measured by Tobin’s Q), is supported by Wang et al. (2014), as mentioned
before.
Putting these two findings together, we can see an interrelationship between
carbon performance and financial performance (measured by Tobin’s Q), where carbon
performance and financial performance seem to be affecting each other negatively rather
than positively, as predicted in H6.
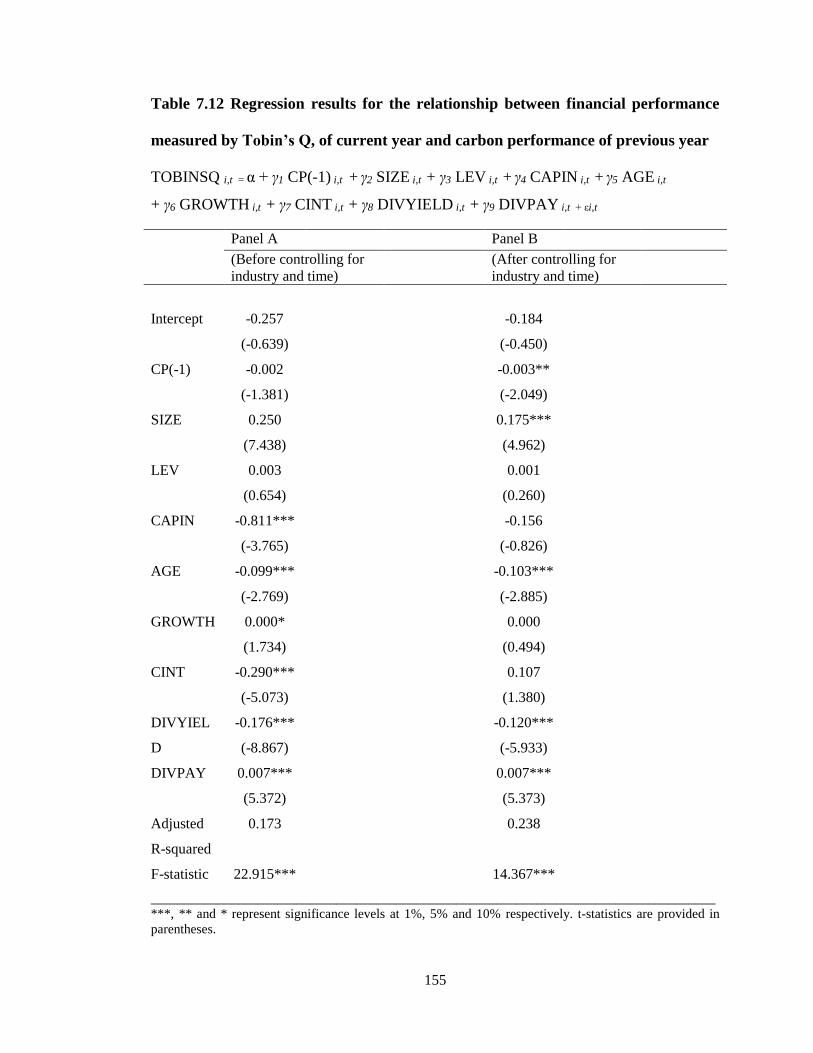
155
Table 7.12 Regression results for the relationship between financial performance
measured by Tobin’s Q, of current year and carbon performance of previous year
TOBINSQ i,t = α + γ1 CP(-1) i,t + γ2 SIZE i,t + γ3 LEV i,t + γ4 CAPIN i,t + γ5 AGE i,t
+ γ6 GROWTH i,t + γ7 CINT i,t + γ8 DIVYIELD i,t + γ9 DIVPAY i,t + εi,t
Panel A Panel B
(Before controlling for
industry and time)
(After controlling for
industry and time)
Intercept -0.257
(-0.639)
-0.184
(-0.450)
CP(-1) -0.002
(-1.381)
-0.003**
(-2.049)
SIZE 0.250
(7.438)
0.175***
(4.962)
LEV 0.003
(0.654)
0.001
(0.260)
CAPIN -0.811***
(-3.765)
-0.156
(-0.826)
AGE -0.099***
(-2.769)
-0.103***
(-2.885)
GROWTH 0.000*
(1.734)
0.000
(0.494)
CINT -0.290***
(-5.073)
0.107
(1.380)
DIVYIEL
D
-0.176***
(-8.867)
-0.120***
(-5.933)
DIVPAY 0.007***
(5.372)
0.007***
(5.373)
Adjusted 0.173 0.238
R-squared
F-statistic 22.915*** 14.367***
_____________________________________________________________________________________
***, ** and * represent significance levels at 1%, 5% and 10% respectively. t-statistics are provided in
parentheses.

156
Table 7.13 Regression results for the relationship between financial performances
measured by Tobin’s Q, of previous year and carbon performance of current year
CP i,t = α + γ1 TOBINSQ(-1) i,t + γ2 SIZE i,t + γ3 LEV i,t + γ4 CAPIN i,t + γ5 AGE i,t +
γ6 GROWTH i,t + γ7 CINT i,t + γ8 DIVYIELD i,t + γ9 DIVPAY i,t + εi,t
Panel A Panel B
(Before controlling for
industry and time)
(After controlling for
industry and time)
Intercept 8.798
(0.919)
-0.202
(-0.021)
TOBINSQ(-
1)
-1.478**
(-2.185)
-0.906
(-1.377)
SIZE 4.441***
(5.052)
5.085***
(5.401)
LEV 0.091*
(1.748)
0.051
(0.921)
CAPIN -23.165***
(-3.595)
-11.939*
(-1.777)
AGE 1.840**
(2.374)
1.483*
(1.843)
GROWTH -0.001
(-0.988)
-0.001
(-0.846)
CINT -1.846
(-1.066)
-9.979*
(-1.696
DIVYIELD 1.038**
(2.457)
1.549***
(3.535)
DIVPAY 0.076***
(3.035)
0.050*
(1.960)
Adjusted
0.0856
R-squared 0.160
F-statistic 10.793*** 9.165***
_____________________________________________________________________________________
***, ** and * represent significance levels at 1%, 5% and 10% respectively. t-statistics are provided in
parentheses.

157
7.5.5 Country-wise regression results for the interrelationship between carbon
performance and financial performance
From Table 7.14, we can see that there is no significant relationship between last
year’s carbon performance and current year’s ROA, in any region except in North
America. Similarly, last year’s ROA does not have any significant relationship with
current year’s carbon performance, in any of the regions. Last year’s carbon
performance does not have any significant relationship with current year’s Tobin’s Q in
any region either. However, last year’s Tobin’s Q is significantly related to current
year’s carbon performance, in both North America and Asia-Pacific. This relationship
does not exist in the EU and UK. In summary, the country wise regression results from
Table 7.14 do not consistently and significantly indicate any interrelationship between
carbon performance and financial performance (measured by both ROA and Tobin’s Q),
in any of the four regions. All the models used in Tables 7.10, 7.11, 7.12, 7.113 and
7.14, are good models as the p value of their F tests are less than 1%.

158
Table 7.14 Country wise regression results for the interrelationship between carbon performance and financial
performance Variable North America European Union United Kingdom Asia-Pacific
ROA CP Tobin's Q CP ROA CP Tobin's Q CP ROA CP Tobin's Q CP ROA CP Tobin's Q CP
CP(-1) -0.039**
-0.027
-0.061
-0.023
(-2.250)
(-1.574)
(-1.226)
(-1.241)
ROA(-1)
0.005
0.203
0.372
-0.375
(0.056)
(1.223)
(1.189)
(0.998)
CP(-1)
-0.003
-0.001
0.001
0.000
(-1.326)
(-0.695)
(0.389)
(0.374)
Tobin's
Q(-1)
-
2.901*** 1.148
2.066
10.231**
(-2.852)
(1.019)
(0.621)
(-2.524)
SIZE 1.184** 3.564*** 0.176*** 3.664*** 1.108*** 6.000*** -0.013 6.321*** 3.748** 9.371*** 0.403*** 9.571*** 3.290*** 5.777 0.153*** 5.648*
(2.968) (2.870) (4.101) (2.977) (2.212) (3.650) (-0.256) (3.881) (2.434) (3.334) (4.570) (2.934) (5.117) (1.651) (5.030) (1.783)
LEV -0.027 0.107 0.020*** 0.142* -0.131*** 0.384*** -0.020*** 0.384*** 0.109* 0.401** 0.016*** 0.421** -0.102*** -0.121 0.009*** -0.115
(-0.479) (1.393) (5.004) (1.800) (-4.157) (3.319) (-4.314) (3.3040 (1.7970 (2.497) (3.122) (2.415) (-2.661) (0.757) (-4.057) (-0.744)
CAPIN -34.736** -8.071 -1.505*** -12.010 25.690*** -96.943*** 1.803*** 94.038*** -10.594 -4.591 0.268 -6.077 5.430 -6.221 0.713*** -2.691
(-2.217) (-0.901) (-5.837) (-1.356) (4.301) (-3.583) (2.767) (-3.4550 (-0.647) (-0.116) (0.236) (-0.146) (0.860) (0.571) (3.224) (-0.251)
AGE -1.298*** -0.241 -0.214*** -0.476 0.766* 4.972*** 0.118** 4.961*** -0.807 -2.520 -0.033 -2.496 -0.596 0.241 -0.020 0.282
(-3.516) (-0.187) (-4.444) (-0.368) (1.955) (4.033) (2.518) (4.036) (-1.037) (-0.861) (-0.529) (-0.877) (-0.9330 (0.110) (-0.806) (0.132)
GROWTH 0.012* -0.009 0.000 -0.011 2.377 0.287*** 0.442*** 0.295 0.000 -0.002*** 0.000** 0.002*** 3.124*** 2.482 0.393*** 4.643*
(1.910) (0.455) (0.4730 (-0.627) (9.449) (0.383) (11.577) (0.380) (0.225) (-4.689) (2.355) (-4.149) (5.606) (1.1930 (12.027) (1.842)
CINT -0.996 -4.174 -0.316*** -4.947* 1.199 2.419* -0.031 2.756 -1.335 -2.741 -0.429* (-2.483) 0.828 1.499 0.102* 2.381
(-0.612) (-1.455) (-3.853) (-1.732) (1.752) (0.846) (-0.589) (0.972) (-0.431) (-0.348) (-1.786) -0.293 (0.570) (0.261) (1.730) (0.425)
DIVYIELD -1.179*** 0.446 -0.338*** -0.162 -0.122 1.819*** 0.024 1.777*** -1.435** -4.137*** -0.150*** 4.109*** 0.154 -0.413 0.002 -0.769
(-4.437) (0.441) (-10.910) (-0.162) (-0.6410 (2.777) (1.3800 (2.7150 (-2.533) (-4.099) (-3.891) (-3.659) (0.417) (0.299) (0.125) (-0.593)
DIVPAY 0.107*** 0.127*** 0.009*** 0.141*** 0.024 0.078* 0.004*** 0.074 0.108*** -0.078 0.005*** -0.079 0.020 -0.074 0.002*** -0.054
(5.499) (2.674) (4.326) (3.057) (1.790) (1.398) (2.859) (1.331) (4.597) (-1.142) (3.161) (-1.214) (1.132) (0.970) (2.359) (-0.761)
Adjusted
R2 0.233 0.070*** 0.314 0.086 0.617 0.197 0.793 0.196 0.323 0.190 0.470 0.173 0.492 -0.027 0.809 0.006
F-statistics 16.248*** 4.789*** 24.056*** 5.737*** 47.022*** 8.019*** 110.531 7.961*** 6.205*** 3.549 10.658*** 3.277*** 12.626*** 0.687 51.933*** 1.074***

159
7.6 Empirical results for the relationship between carbon disclosure
and financial performance
The purpose of this section is to analyse and interpret the relationship between
carbon disclosure and financial performance, which is hypothesized in H7
7.6.1 Regression results for the relationship between carbon disclosure and
financial performance for H7
From Table 7.15, we can see that when financial performance is measured by
ROA, there is a significant negative relationship between carbon disclosure and financial
performance at 1% significance level. This relationship remains the same when industry
and time effects are considered. As mentioned earlier, there is no existing study that
investigates the relationship between carbon disclosure and financial performance.
However, research in related areas such as studies by Belkaoui (1976); Berman et al.
(1999); Brammer and Pavalin (2006); Weber et al. (20080 and Tang et al. (2012), who
investigate the relationship between pollution disclosure/CSR performance disclosure
and financial performance, suggest that there should be a positive relationship between
these variables.
On the other hand, from Table 7.16, we do not find any significant or consistent
relationship between carbon disclosure and financial performance, when financial
performance is measured by Tobin’s Q. This finding is supported by a similar study by
Freedman and Jaggi (1988), who find that there is no association between the
extensiveness of pollution disclosure and economic performance.

160
Therefore, we can conclude that there is a negative relationship between carbon
disclosure and financial performance when financial performance is measured by ROA.
However, there seems to be no significant relationship between carbon disclosure and
financial performance when financial performance is measured by Tobin’s Q.
7.6.2 Country-wise regression results for the relationship between carbon
disclosure and financial performance
From Table 7.17, we can see that there is significant negative relationship
between carbon disclosure and financial performance when financial performance is
measured by ROA in all four regions. This finding is consistent with the full sample
results, which also find significant negative relationship between carbon disclosure and
ROA. However, as in the full sample results, country-wise analysis does not find any
significant relationship between carbon disclosure and financial performance when
financial performance is measured by Tobin’s Q, in any of the four regions.
All the models used in Table 7.15, Table 7.16 and Table 7.17 are good models, as the p
value of their F tests are less than 1%.

161
Table 7.15 Regression results for the relationship between carbon disclosure and
financial performance, measured by ROA
ROA i,t = α + β1 CD i,t + β2 SIZE i,t + β3 LEV i,t + β4 CAPIN i,t + β5 AGE i,t + β6
GROWTH i,t + β7 CINT i,t + β8 DIVYIELD i,t + β9 DIVPAY i,t + εi,t
Panel A Panel B
(Before controlling for
industry and time)
(After controlling for
industry and time)
Intercept -0.337
(-0.094)
-7.049**
(-2.001)
CD -0.103***
(-5.016)
-0.056***
(-2.617)
SIZE 2.349***
(7.392)
2.378***
(6.185)
LEV -0.039
(-1.157)
-0.042
(-1.140)
CAPIN -20.676***
(-2.086)
-18.419*
(-1.833)
AGE -0.829***
(-2.960)
-0.741***
(-2.637)
GROWTH 0.000
(0.323)
0.000
(0.604)
CINT -1.007
(-1.239)
0.603
(0.695)
DIVYIELD -0.741***
(-4.033)
-0.670***
(-3.788)
DIVPAY 0.083***
(8.093)
0.084***
(8.261)
Adjusted
R-squared
0.185 0.207
F-statistic 24.805*** 12.198***
_____________________________________________________________________________________
***, ** and * represent significance levels at 1%, 5% and 10% respectively. t-statistics are provided in
parentheses.

162
Table 7.16 Regression results for the relationship between carbon disclosure and
financial performance, measured by Tobin’s Q
TOBINSQ i,t = α + β1 CD i,t + β2 SIZE i,t + β3 LEV i,t + β4 CAPIN i,t + β5 AGE i,t + β6
GROWTH i,t + β7 CINT i,t + β8 DIVYIELD i,t + β9 DIVPAY i,t + εi,t
Panel A Panel B
(Before controlling for
industry and time)
(After controlling for
industry and time)
Intercept -0.449
(-1.048)
-0.194
(-0.4640
CD 0.002
(1.215)
-0.002
(-0.790)
SIZE 0.234***
(7.122)
0.168***
(4.733)
LEV 0.002
(0.532)
0.001
(0.283)
CAPIN -0.715***
(-3.373)
-0.147
(-0.783)
AGE -0.105***
(-2.942)
-0.104***
(-2.925)
GROWTH 0.000*
(1.770)
0.000
(0.519)
CINT -0.299***
(-5.213)
0.094
(1.139)
DIVYIELD -0.174***
(-8.994)
-0.119***
(-5.953)
DIVPAY 0.006***
(5.215)
0.006***
(5.253)
Adjusted
R-squared
0.173 0.235
F-statistic 22.957*** 14.190***
_____________________________________________________________________________________
***, ** and * represent significance levels at 1%, 5% and 10% respectively. t-statistics are provided in
parentheses.

163
Table 7.17 Country wise regression results for the relationship between carbon
disclosure and financial performance
Variable North America
European Union
United Kingdom
Asia-Pacific
ROA Tobin’s Q
ROA Tobin’s Q
ROA Tobin’s Q
ROA Tobin’s Q
CD -0.116*** 0.002
-0.093*** -0.002
-0.146** 0.005
-0.082** 0.000
(-4.080) (0.913)
(-3.236) (-0.3620
(-2.2100 (1.086)
(-2.3900 (-0.222)
SIZE 1.384*** 0.161***
1.268** -0.012
3.670*** 0.395***
3.395*** 0.156***
(3.310) (3.734)
(2.550) (-0.233)
(2.8460 (4.860)
(5.349) (5.216)
LEV -0.012 0.019***
-0.112*** -0.020***
0.151** 0.014**
-0.091** -0.009***
(-0.224) (4.840)
(-3.5000 (-4.0610
(2.5540 (2.627)
(-2.4650 (-4.1280
CAPIN -34.988** -1.465***
22.607*** 1.789***
-13.617 0.317
4.618 0.708***
(-2.245) (-5.556)
(3.790) (2.7140
(-0.8830 (0.285)
(0.742) (3.222)
AGE -1.391*** -0.212***
0.991** 0.117**
-0.849 -0.030
-0.686 -0.020
(-3.723) (-4.394)
(2.5160 (2.2810
(-1.1200 (-0.487)
(-1.142) (-0.834)
GROWTH 0.011* 0.000
2.429*** 0.442***
0.000 0.000**
3.293*** 0.395***
(1.763) (0.388)
(9.360) (11.4100
(0.227) (2.366)
(6.120) (12.286)
CINT -1.093 -0.307***
1.388** -0.028
-0.561 -0.440*
0.916 0.104*
(-0.684) (-3.714)
(2.0500 (-0.5160
(-0.181) (-1.832)
(0.6180 (1.772)
DIVYIELD -1.208*** -0.332***
-0.071 0.024
-1.618*** -0.141***
0.197 0.001
(-4.649) (-10.615)
(-0.3930 (1.2460
(-3.030) (-4.0190
(0.642) (0.062)
DIVPAY 0.107*** 0.008***
0.029** 0.004***
0.104*** 0.005***
0.009 0.002**
(5.681) (4.117)
(2.2480 (2.760)
(4.560) (3.319)
(0.627) (2.415)
Adjusted
R2 0.244 0.313
0.630 0.793
0.339 0.477
0.516 0.810
F-statistic 17.317*** 23.977***
49.718*** 110.976
6.645*** 11.017
13.916*** 52.525
***, ** and * represent significance levels at 1%, 5% and 10% respectively. t-statistics are provided in parentheses.

164
7.7 Empirical results for the relationship of agency cost with carbon
disclosure and carbon performance
The purpose of this section is to analyse and interpret the relationship between
carbon disclosure and agency cost (H8), and between carbon performance and agency
cost (H9)
7.7.1 Regression results for the relationship between carbon disclosure and agency
cost for H8
Table 7.18 shows a positive but insignificant relationship between carbon
disclosure and agency cost when agency cost is measured by Expense Ratio (ER). Table
7.19 also shows a positive but insignificant relationship between carbon disclosure and
agency cost, when agency cost is measured by Asset Utilization Ratio (AUR). These two
findings together suggest that there is a positive but insignificant relationship between
carbon disclosure and agency cost. These findings contradict H8. Firm size, growth
opportunity, and dividend payout, seem to positively affect ER. On the other hand,
capital intensity, firm age, and carbon intensity, seems to negatively affect ER.
However, after moderating for industry and time effects, it seems that the relationship of
ER to firm size, capital intensity, and dividend payout, vary across industries and time
periods. On the other hand, firm size, leverage, and capital intensity and growth
opportunity, seem to have a negative relationship with AUR. The positive relationship
between firm size and agency cost is supported by Rashid (2015), who argue that larger
firms are likely to achieve economies of scale that may influence their agency cost. As a
firm’s size increases, there is a greater need for monitoring by independent outside
165
directors, and therefore an increase in firm’s size may lead to increased agency cost. The
relationship between growth opportunity and agency cost is supported by McConnell
and Servaes (1990) and Florackis (2008). They argue that the effectiveness of
governance mechanisms in reducing agency problems, is dependent on the firm’s
growth opportunities

166
Table 7.18 Regression results for the relationship between carbon disclosure and
agency cost measured by ER
ER i,t = α + β1 CD i,t + β2 SIZE i,t + β3 LEV i,t + β4 CAPIN i,t + β5 AGE i,t + β6 GROWTHi,t
+ β7 CINT i,t + β8 DIVYIELD i,t + β9 DIVPAY i,t + εi,t
Panel A Panel B
(Before controlling for
industry and time)
(After controlling for
industry and time)
Intercept 0.169**
(2.221)
0.185***
(2.465)
CD 0.001
(1.297)
0.000
(0.562)
SIZE 0.018***
(3.054)
0.005
(0.761)
LEV -0.001
(-1.443)
0.000
(-1.070)
CAPIN -0.218***
(-4.697)
-0.069
(-1.351)
AGE -0.026***
(-4.249)
-0.022***
(-3.902)
GROWTH 0.000*
(2.001)
0.000*
(1.789)
CINT -0.08***
(-6.743)
-0.079**
(-2.240)
DIVYIELD -0.005
(-1.585)
-0.003
(-0.742)
DIVPAY 0.000*
(1.798)
0.000
(1.450)
Adjusted
R-squared
0.149 0.283
F-statistic 19.279*** 17.946***
_____________________________________________________________________________________
***, ** and * represent significance levels at 1%, 5% and 10% respectively. t-statistics are provided in
parentheses.

167
Table 7.19 Regression results for the relationship between carbon disclosure and
agency cost measured by AUR
AUR i,t = α + β1 CD i,t + β2 SIZE i,t + β3 LEV i,t + β4 CAPIN i,t + β5 AGE i,t + β6
GROWTH i,t + β7 CINT i,t + β8 DIVYIELD i,t + β9 DIVPAY i,t + εi,t
Panel A Panel B
(Before controlling for
industry and time)
(After controlling for
industry and time)
Intercept 1.775***
(6.545)
1.641***
(5.482)
CD 0.000
(0.319)
0.002
(1.344)
SIZE -0.071***
(-3.279)
-0.061***
(-2.357)
LEV -0.006***
(-4.949)
-0.008***
(-6.182)
CAPIN -1.674***
(-10.588)
-1.622***
(-10.990)
AGE 0.022
(1.360)
-0.002
(-0.113)
GROWTH 0.000**
(-2.252)
0.000**
(-2.385)
CINT -0.013
(-0.446)
0.165***
(3.326)
DIVYIELD -0.017**
(-2.405)
-0.002
(-0.256)
DIVPAY 0.001
(1.107)
0.000
(0.334)
Adjusted
R-squared
0.185 0.240
F-statistic 24.729*** 14.554***
_____________________________________________________________________________________
***, ** and * represent significance levels at 1%, 5% and 10% respectively. t-statistics are provided in
parentheses.

168
7.7.2 Regression results for the relationship between carbon performance and
agency cost for H9
Regression results from Table 7.20, show that there is a positive relationship
between carbon performance and agency cost, when agency cost is measured by
Expense Ratio. However, this relationship is not statistically significant. The relationship
remains the same when the regression equation is controlled for industry and time effect.
These results indicate that carbon performance does not significantly affect a firm’s
agency cost, when agency cost is measured by Expense Ratio. This finding does not
support H 9.
On the other hand, Table 7.21 shows a significantly negative relationship
between carbon performance and agency cost when agency cost is measured by Asset
Utilization Ratio. These results hold when the results are controlled for industry and
time effect. Therefore, we can conclude from these results that carbon performance of a
business would negatively affect its agency cost when agency cost is measured by Asset
Utilization ratio. In other words, when agency cost is measured by Asset Utilization
ratio, if a firm’s carbon performance improves, its agency cost would decrease and vice
versa. This finding is supported by H9.

169
Table 7.20 Regression results for the relationship between carbon performance and
agency cost measured by ER
ER i,t = α + β1 CP i,t + β2 SIZE i,t + β3 LEV i,t + β4 CAPIN i,t + β5 AGE i,t + β6 GROWTH i,t
+ β7 CINT i,t + β8 DIVYIELD i,t + β9 DIVPAY i,t + εi,t
Panel A Panel B
(Before controlling for
industry and time)
(After controlling for
industry and time)
Intercept 0.194
(2.647)
0.197***
(2.817)
CP 0.000
(0.593)
0.000
(0.417)
SIZE 0.019***
(3.192)
0.005
(0.778)
LEV 0.000
(-1.277)
0.000
(-1.010)
CAPIN -0.222***
(-4.792)
-0.070
(-1.376)
AGE -0.026***
(-4.239)
-0.022***
(-3.927)
GROWTH 0.000**
(2.029)
0.000*
(1.795)
CINT -0.083***
(-6.708)
-0.079**
(-2.242)
DIVYIELD -0.005
(-1.595)
-0.003
(-0.744)
DIVPAY 0.000*
(1.804)
0.000
(1.440)
Adjusted
R-squared
0.147 0.283
F-statistic 19.100*** 17.937***
_____________________________________________________________________________________
***, ** and * represent significance levels at 1%, 5% and 10% respectively. t-statistics are provided in
parentheses.

170
Table 7.21 Regression results for the relationship between carbon performance and
agency cost measured by AUR
AUR i,t = α + β1 CP i,t + β2 SIZE i,t + β3 LEV i,t + β4 CAPIN i,t + β5 AGE i,t + β6
GROWTH i,t + β7 CINT i,t + β8 DIVYIELD i,t + β9 DIVPAY i,t + εi,t
Panel A Panel B
(Before controlling for
industry and time)
(After controlling for
industry and time)
Intercept 1.805***
(7.001)
1.718***
(6.109)
CP -0.002*
(-1.913)
-0.001*
(-1.734)
SIZE -0.064***
(-3.046)
-0.050**
(-2.049)
LEV -0.006***
(-4.877)
-0.008***
(-6.193)
CAPIN -1.714***
(-10.583)
-1.654**
(-11.017)
AGE 0.026
(1.577)
0.001
(0.070)
GROWTH 0.000**
(-2.411)
0.000**
(-2.426)
CINT -0.015
(-0.519)
0.144***
(3.391)
DIVYIELD -0.015**
(-2.127)
0.001
(0.171)
DIVPAY 0.001
(1.353)
0.000
(0.524)
Adjusted
R-squared
0.189 0.242
F-statistic 25.362*** 14.697***
_____________________________________________________________________________________
***, ** and * represent significance levels at 1%, 5% and 10% respectively. t-statistics are provided in
parentheses.

171
Table 7.22 Country wise regression results for the relationship of agency cost with carbon disclosure and carbon
performance
Variable North America European Union United Kingdom Asia-Pacific
ER AUR ER AUR ER AUR ER AUR ER AUR ER AUR ER AUR ER AUR
CD 0.001** 0.000
0.001 0.001
0.001 -0.002
-0.001 0.003
(2.127) (0.114)
(0.830) (0.723)
(-0.370) (-0.659)
(-1.231) (0.922)
CP
0.001* -0.003**
0.000 0.001
-0.001 0.000
0.000 0.003
(1.692) (-2.225)
(0.127) (1.186)
(-0.925) (0.271)
(-0.851) (1.636)
SIZE 0.013* -0.115*** 0.015* -0.104*** 0.036*** -0.110*** 0.038*** -0.112*** 0.006 0.038 0.013 0.027 -0.005 -0.040 -0.005 -0.046
(1.697) (-3.149) (1.876) (-2.948) (3.183) (-4.485) (3.274) (-4.645) (0.148) (1.009) (0.343) (0.715) (-0.601) (-0.890) (-0.629) (-1.042)
LEV 0.001 -0.004* 0.001* -0.003 -0.001 -0.014*** -0.001 -0.014*** -0.003 -0.009*** -0.003 -0.010*** -0.004*** -0.001 -0.005*** -0.001
(1.443) (-1.754) (1.695) (-1.613) (-1.010) (-8.102) (-0.815) (-8.387) (-1.208) (-3.041) (-1.201) (-3.607) (-5.504) (-0.416) (-5.514) (-0.270)
CAPIN -0.095* -1.751*** -0.097* -1.777*** -0.018 -1.015*** -0.053 -0.989*** -0.424 -1.773*** -0.433 -1.781*** -0.491*** -1.872*** -0.486*** -1.873***
(-1.864) (-7.616) (-1.895) (-7.907) (-0.100) (-4.460) (-0.285) (-4.276) (-0.809) (-3.455) (-0.817) (-3.385) (-5.227) (-6.475) (-4.774) (-6.573)
AGE -0.031*** -0.005 -0.032*** -0.006 -0.021** 0.063*** -0.019* 0.061*** -0.058* 0.171*** -0.060* 0.173*** -0.005 0.001 -0.004 -0.003
(-3.696) (-0.177) (-3.727) (-0.2070 (-2.011) (3.363) (-1.868) (3.380) (-1.837) (4.141) (-1.903) (4.336) (-0.309) (0.022) (-0.255) (-0.057)
GROWTH 0.000 0.001*** 0.000 0.001*** 0.010*** 0.069**** 0.011*** 0.069*** 0.000** 0.000 0.000* 0.000 0.017 0.252*** 0.015 0.255***
(-1.337) (3.596) (-1.286) (3.244) (3.029) (6.348) (3.115) (6.448) (2.105) (-1.045) (1.890) (-1.012) (1.468) (2.982) (1.282) (2.958)
CINT -0.090*** -0.051 -0.089*** -0.065 -0.088*** 0.077** -0.086*** 0.078** -0.033 -0.089 -0.035 -0.081 -0.089*** -0.053 -0.091*** -0.050
(-5.173) (-1.0410 (-5.156) (-1.326) (-3.744) (2.205) (-3.622) (2.295) (-0.357) (-0.764) (-0.380) (-0.701) (-3.183) (-0.524) (-3.143) (-0.507)
DIVYIELD -0.015*** -0.048*** -0.017*** -0.047*** -0.004 0.040*** -0.004 0.040*** 0.022 0.021 0.020 0.027 0.026*** -0.034 0.027*** -0.034
(-2.825) (-3.145) (-3.055) (-2.911) (-0.8280 (4.592) (-0.733) (4.518) (1.168) (1.130) (1.016) (1.413) (3.230) (-1.488) (3.376) (-1.467)
DIVPAY 0.000 0.001 0.000 0.001 0.001* 0.000 0.001* 0.000 0.001* 0.000 0.001 0.000 -0.001* 0.001 -0.001 0.001
(0.509) (1.124) (0.547) (1.502) (1.673) (0.293) (1.781) (0.256) (1.685) (0.064) (1.639) (0.163) (-1.6780) (0.703) (-1.521) (0.642)
Adjusted
R2 0.140 0.185 0.136 0.197 0.207 0.542 0.205 0.543 0.149 0.352 0.154 0.350 0.503 0.346 0.499 0.352
F-statistic 9.202*** 12.468*** 8.963*** 13.360*** 8.502*** 34.894*** 8.395*** 35.095*** 2.928*** 6.981*** 3.009*** 6.915*** 13.265*** 7.401*** 13.084*** 7.591***
***, ** and * represent significance levels at 1%, 5% and 10% respectively. t-statistics are provided in parentheses.

172
7.7.3 Country-wise regression results for the relationship of agency cost with
carbon disclosure and carbon performance
From Table 7.22, we can see that, in North America, carbon disclosure
significantly positively affects agency cost, when agency cost is measured by Expense
Ratio. However, carbon disclosure does not have any significant relationship with
agency cost in any other region regardless of whether agency cost is measured by
Expense Ratio or Asset Utilization Ratio. On the other hand, carbon performance
significantly positively affect agency cost in North America, both when agency cost is
measured by Expense Ratio or Asset Utilization Ratio. Carbon performance also does
not have any significant relationship with agency cost in all other regions, whether
agency cost is measured by Expense Ratio or by Asset Utilization Ratio. In summary,
both carbon disclosure and carbon performance significantly positive affect agency cost
only in North America, which contradicts the full sample results.
All the models used in Tables 7.18 to 7.22, are good models as the p value of their F
tests are less than 1%.

173
7.8 Empirical results for the trends in improvement of carbon
disclosure and carbon performance
The purpose of this section is to conduct a trend analysis to assess whether level
of carbon disclosure and carbon performance improved over the study period, which is
hypothesized in H10.
7.8.1 Regression results for the trends in improvement of carbon disclosure and
carbon performance for H10
Table 7.23 shows that level of carbon disclosure has consistently improved from
year 1 to year 5. These improvements are statistically highly significant as all the p
values are less than 1%. When the regression results are controlled for industry effects,
improvement of level of carbon disclosure over the years still remains consistently
positive and statistically highly significant.
On the other hand, Table 7.24 shows that carbon performance does not significantly
improve from year 1 to year 2. Compared to year 1, carbon performance improves
significantly in years 3, 4 and 5. However, while carbon performance increases from
year 1 to year 3 and from year 3 to year 4, it decreases from year 4 to year 5. All these
results are statistically highly significant at 1% significance level. These results remain
the same when they are controlled for industry effect.
In summary, level of carbon disclosure consistently and significantly improved
during the study period. On the other hand, compared to 2011, carbon performance did
not significantly improve in 2012. However, it improved significantly in years 2013,
2014 and 2015, but these improvements were not always consistent.

174
7.8.2 Country-wise trend analysis for improvement of carbon disclosure and
carbon performance
From Table 7.25, we can see that compared to year 1, level of carbon disclosure
keeps improving consistently and significantly over years 2, 3, 4 and 5 in all the regions.
These results are similar to full sample results. On the other hand, similar to full sample
results, carbon performance does not significantly improve in year 2 in comparison to
year 1 in any of the regions. In North America, carbon performance increases from year
1 to year 3 but then keeps decreasing in year 4 and 5. In EU, carbon performance keeps
improving in year 3 and year 4 before decreasing in year 5. In UK, carbon performance
improves in year 3 and then keeps decreasing in year 4 and 5. In Asia-Pacific, carbon
performance keeps improving in years 3 and 4 before decreasing in year 5. All the
models used to assess trends in improvements of carbon disclosure and carbon
performance are good models, as p values of their F test are less than 1.

175
Table 7.23 Regression results for improvement of carbon disclosure from year 1 to 5
CD i,t = α + β1T2 i,t + β2T3 i,t + β3T4 i,t + β4T5 i,t + β5 SIZE i,t + β6 LEV i,t + β7 CAPIN i,t
+ β8 AGE i,t + Β9 GROWTH i,t + β10 CINT i,t + β11 DIVYIELD i,t + β12 DIVPAY i,t + εi,t
Panel A Panel B
(Before controlling for
industry and time)
(After controlling for
industry and time)
Intercept 53.864***
(10.302)
47.852***
(9.091)
T2 6.173***
(4.888)
6.037***
(4.877)
T3 11.292***
(9.369)
11.098***
(9.311)
T4 13.109***
(10.907)
12.943***
(10.908)
T5 18.955***
(17.909)
18.729***
(17.804)
SIZE 1.589***
(3.386)
2.211***
(4.382)
LEV 0.086***
(3.255)
0.085***
(2.932)
CAPIN -14.431***
(-4.288)
-9.176***
(-2.646)
AGE 0.664
(1.555)
0.578
(1.246)
GROWTH 0.000
(-0.104)
0.000
(-0.143)
CINT 0.426
(0.444)
-4.693
(-1.580)
DIVYIELD 0.294
(1.462)
0.535**
(2.337)
DIVPAY 0.020
(1.560)
0.017
(1.287)
Adjusted
R-squared
0.309 0.331
F-statistic 36.170*** 23.171***
***, ** and * represent significance levels at 1%, 5% and 10% respectively. t-statistics are provided in
parentheses.

176
Table 7.24 Regression results for improvement of carbon performance year 1 to 5
CP i,t = α + β1T2 i,t + β2T3 i,t + β3T4 i,t + β4T5 i,t + β5 SIZE i,t + β6 LEV i,t + β7 CAPIN i,t
+ β8 AGE i,t + Β9 GROWTH i,t + β10 CINT i,t + β11 DIVYIELD i,t + β12 DIVPAY i,t + εi,t
Panel A Panel B
(Before controlling for
industry and time)
(After controlling for
industry and time)
Intercept 9.434
(0.997)
-0.748
(-0.076)
T2 3.093
(1.379)
2.880
(1.317)
T3 11.128***
(5.139)
10.812***
(5.081)
T4 12.408***
(5.666)
12.125***
(5.633)
T5 8.108***
(3.673)
7.739***
(3.575)
SIZE 3.560***
(4.146)
5.010***
(5.346)
LEV 0.071
(1.392)
0.048
(0.870)
CAPIN -22.499***
(-3.417)
-11.651*
(-1.733)
AGE 1.837**
(2.434)
1.499*
(1.865)
GROWTH -0.001
(-0.778)
-0.001
(-0.851)
CINT -1.428
(-0.826)
-9.710
(-1.636)
DIVYIELD 1.107***
(2.748)
1.521***
(3.522)
DIVPAY 0.066***
(2.725)
0.048
(1.905)
Adjusted
R squared
0.127 0.159
F-statistic 12.381*** 9.501***
***, ** and * represent significance levels at 1%, 5% and 10% respectively. t-statistics are provided in
parentheses.

177
Table 7.25 Country wise trend analysis for improvement of carbon disclosure and carbon performance
Variable North America
European Union
United Kingdom
Asia-Pacific
CD CP
CD CP
CD CP
CD CP
T2 7.138*** 4.225
5.771** 0.487
4.569 6.791
7.512** 5.177
(3.946) (1.347)
(2.357) (0.112)
(1.517) (1.004)
(2.144) (0.759)
T3 11.925*** 12.095***
10.274*** 9.483**
11.516*** 11.871*
13.492*** 13.911**
(6.824) (3.923)
(4.384) (2.250)
(4.072) (1.983)
(4.368) (2.117)
T4 12.439*** 9.470***
14.088*** 14.688***
11.769*** 10.967*
16.187*** 19.308***
(6.837) (2.888)
(6.311) (3.812)
(4.334) (1.864)
(5.175) (3.033)
T5 19.608*** 6.863**
18.016*** 9.570**
19.275*** 6.767
20.651*** 11.454*
(12.384) (2.032)
(8.367) (2.346)
(7.732) (1.028)
(7.201) (1.754)
SIZE 1.132* 3.003**
3.053*** 5.710***
3.983*** 9.753***
1.491*** 4.018
(1.703) (2.363)
(3.409) (3.684)
(3.190) (3.458)
(0.959) (1.375)
LEV 0.058 0.088
0.262*** 0.363***
0.357*** 0.441**
0.087 -0.100
(1.494) (1.138)
(3.869) (3.367
(5.171) (2.484)
(1.078) (-0.652)
CAPIN -7.455 -8.804
-75.380*** -99.908***
2.572 -8.880
-3.146 -2.000
(-1.594) (-1.019)
(-5.239) (-3.975)
(0.166) (-0.213)
(-0.484) (-0.150)
AGE -0.479 -0.147
2.557*** 4.673***
-1.706 -2.915
-0.749 0.771
(-0.674) (-0.118)
(3.206) (3.633)
(-1.406) (-0.994)
(-0.751) (0.380)
GROWTH 0.001 -0.008
0.386 0.477
0.000 -0.002***
1.892* 1.257
(0.099) (-0.364)
(1.036) (0.882)
(-0.694) (-2.820)
(1.740) (0.585)
CINT -1.933 -4.411
3.699*** 2.470
-1.378 -2.856
1.276 0.177
(-1.158) (-1.552)
(2.890) (0.906)
(-0.426) (-0.342)
(0.419) (0.028)
DIVYIELD -0.090 0.571
0.997*** 1.825***
-2.487*** -4.345***
-1.509*** -1.442
(-0.198) (0.613)
(2.968) (2.621)
(-4.890) (-3.888)
(-2.952) (-1.197)
DIVPAY 0.046* 0.113**
0.036 0.067
-0.009 -0.050
-0.081*** -0.059
(1.839) (2.520)
(1.363) (1.259)
(-0.358) (-0.713)
(-2.684) (-0.763)
Adjusted R2 0.289 0.102
0.431 0.262
0.535 0.182
0.387 0.076
F-statistic 16.382*** 5.294***
17.310*** 8.615***
10.504*** 2.836***
6.730*** 1.749*
***, ** and * represent significance levels at 1%, 5% and 10% respectively. t-statistics are provided in parentheses.
178
7.9 Chapter summary
This chapter provides the empirical results obtained from testing the hypotheses
of this study. Result of this chapter indicate that carbon disclosure and carbon
performance are significantly positively related, which supports H2 but negates H1. This
finding is in congruence with the economics-based theories, Voluntary Disclosure
Theory, and Signalling Theory. This finding supports studies such as Clarkson et al.,
2008; Al-Tuwaijri et al., 2004; Peng et al., 2015 and Cotter and Najah 2012. In country-
wise analysis also, carbon disclosure is significantly positively related to carbon
performance in all of the four regions. This implies that in all regions, firms with better
carbon performance make more carbon disclosure.
Results of this chapter also indicate that there is a two-way positive relationship
between carbon disclosure and carbon performance, where increase in carbon disclosure
of a firm will improve its carbon performance (as predicted by Instrumental Stakeholder
Theory), and consequently, improved carbon performance will lead to more carbon
disclosure by the firm in the subsequent period, as predicted by Signalling Theory.
These results support hypothesis 3 which proposes that carbon disclosure and carbon
performance influence each other positively. The both-way positive relationship between
carbon disclosure and carbon performance, holds true in all regions. However, while the
relationship is significant in North America, EU and Asia-Pacific, it is insignificant in
the UK.
Results found from investigating disclosure practices of average carbon
performers conducted in this study, indicate that superior carbon performers make more
carbon disclosure than average carbon performers, and average carbon performers make

179
more carbon disclosure than inferior carbon performers. These findings contradict H4
which suggest that both superior and inferior carbon performers make significantly more
carbon disclosure than average carbon performers.
Results of this study also show that when financial performance is measured by
Return on Asset, it has a negative relationship with the firm’s carbon performance.
When financial performance is measured by Tobin’s Q, it also has a negative
relationship with the firm’s carbon performance. Therefore, we can conclude from
these results that carbon performance and financial performance influence each other
negatively regardless of the way financial performance is measured. These findings
negate H5. This finding is backed by numerous previous studies such as Jaggi and
Freedman (1992), Cordeiro and Sarkis (1997), Filbeck and Gorman (2004), Sarkis and
Cordeiro (2001), and Wang et al. (2014). In country-wise analysis, we find that carbon
performance is negatively related to both ROA and Tobin’s Q in all regions except the
UK.
Results also suggest that, when financial performance is measured by Return on
Asset, there seems to be no significant interrelationship between carbon performance
and financial performance. However, there is a significant negative interrelationship
between carbon performance and financial performance when financial performance is
measured by Tobin’s Q. However, this relationship might vary across industries. The
country-wise regression results do not consistently and significantly indicate any
interrelationship between carbon performance and financial performance, regardless of
the way it is measured in any of the four regions.
Results from this study also indicate that when financial performance is
measured by ROA, there is a significant negative relationship between carbon disclosure

180
and financial performance. This finding is contradicted by studies by Belkaoui (1976);
Berman et al. (1999); Brammer and Pavalin (2006); Weber et al. (20080 and Tang et al.
(2012). Results also indicate that there is no significant or consistent relationship
between carbon disclosure and financial performance when financial performance is
measured by Tobin’s Q. This finding is supported by Freedman and Jaggi (1988). In
country-wise analysis, this study finds that there is significant negative relationship
between carbon disclosure and financial performance when financial performance is
measured by ROA in all four regions. However, there is no significant relationship
between carbon disclosure and financial performance, when financial performance is
measured by Tobin’s Q, in any region.
The next set of results of this study indicate that there is a positive but
insignificant relationship between carbon disclosure and agency cost when agency cost
is measured by Expense Ratio. When agency cost is measured by Asset Utilization
Ratio, there is still a positive but insignificant relationship between carbon disclosure
and agency cost. Results also indicate that there is a positive relationship between
carbon performance and agency cost when agency cost is measured by Expense Ratio.
However, this relationship is not statistically significant. When agency cost is measured
by Asset Utilization Ratio, we find a significantly negative relationship between carbon
performance and agency cost. Therefore, we can conclude that carbon performance of a
business would negatively affect its agency cost when agency cost is measured by Asset
Utilization ratio. In other words, when agency cost is measured by Asset Utilization
ratio, if a firm’s carbon performance improves, its agency cost would decrease. Country-
wise analysis shows that both carbon disclosure and carbon performance significantly
positive affect agency cost, only in North America. We don’t find any significant and
181
consistent relationship between agency cost and carbon disclosure/carbon performance,
in any other region.
Results of this study also show that level of carbon disclosure for the sample
companies have significantly and consistently improved during the study period. On the
other hand, compared to 2011, carbon performance did not significantly improve in
2012. However, it improved significantly in years 2013, 2014 and 2015 but these
improvements were not always consistent. In country-wise analysis, we can see that
compared to year 1, level of carbon disclosure keeps improving consistently and
significantly over years 2, 3, 4 and 5 in all the regions. However, the study could not
find any consistent and significant trend in increase or decrease of carbon performance
of the sample companies, in any of the regions during the study period.
182
CHAPTER 8 CONCLUSIONS AND IMPLICATIONS
8.1 Introduction
This chapter concludes the thesis and summarises the major findings from
Chapter 7. Section 8.2 outlines the conclusions about the research objectives/questions
developed in chapter 1. Section 8.3 discusses several implications of this study on theory
and practice. Section 8.4 discusses the limitations of this study, and finally section 8.5
identifies a number of areas for future research.
8.2 Conclusions about research objectives
As mentioned in chapter 1, the specific objectives of this study are:
1. To examine the relationship and interrelationship between carbon disclosure and
carbon performance
2. To examine the relationship and interrelationship between carbon performance
and financial performance
3. To examine the relationship between carbon disclosure and financial
performance
4. To examine the relationship between agency cost and carbon disclosure and
between agency cost and carbon performance
5. To study the trends in improvement of carbon disclosure and carbon performance
over the study period.
Sections 8.2.1 to 8.2.6 discuss the conclusions about the above research objectives based
on the analysis conducted in previous chapter.
183
8.2.1 Relationship and interrelationship between carbon disclosure and carbon
performance
Results obtained from testing the hypotheses regarding the relationship between
carbon disclosure and carbon performance indicate that carbon disclosure and carbon
performance are significantly positively related. This finding is supported by the
economics-based theories (Voluntary Disclosure Theory and Signalling Theory) which
suggest that firms with good performance are likely to disclose more information to
signal their good quality to investors, and to differentiate themselves from companies
with ‘bad news’ to avoid the adverse selection problem (Clarkson et al, 2008; Al-
Tuwaijri et al., 2004; Peng et al., 2015; Cotter & Najah 2012). Naturally, this finding
contradicts many studies that suggest a negative relationship between
environmental/carbon disclosure and carbon performance as predicted by Stakeholder
and Legitimacy Theories. This positive relationship between carbon disclosure and
carbon performance, remains significantly positive, even after controlling the regression
results for industry and time effect. This indicates that these findings are robust.
In country-wise analysis also, carbon disclosure is significantly positively related
to carbon performance in all of the four regions, namely: North America, EU, UK and
Asia-Pacific. This implies that in all regions, firms with better carbon performance make
more carbon disclosure.
Many studies have investigated the relationship between environmental
disclosure/carbon disclosure and environmental performance/carbon performance.
However, to the best of my knowledge, no study has yet investigated whether there is
an interrelation between environmental disclosure/carbon disclosure, and
environmental performance/carbon performance. This study tests a hypothesis that

184
proposes a both-way relationship between carbon disclosure and carbon performance.
Results from testing this hypothesis indicate that there is a two-way positive
relationship between carbon disclosure and carbon performance, whereby increase in
carbon disclosure of a firm in a period will improve its carbon performance (supported
by Instrumental Stakeholder Theory), and consequently, improved carbon performance
will lead to more carbon disclosure by the firm in the subsequent period (supported by
Signalling Theory). These results are robust as the findings remain the same even after
controlling them for industry, time and dummy variables. The both-way positive
interrelationship between carbon disclosure and carbon performance holds true in all
regions except UK.
The empirical results for disclosure practices of average carbon performers
conducted in this study indicate that superior carbon performers make more carbon
disclosure than average carbon performers, and average carbon performers make more
carbon disclosure than inferior carbon performers.
8.2.2. Relationship and interrelationship between carbon performance and
financial performance
Results of this study indicate that carbon performance is negatively related to
both accounting based measure (ROA) as well as market based measure (Tobin’s Q),
of a firm’s financial performance. This finding is backed by some of the studies such as
Jaggi and Freedman (1992), Cordeiro and Sarkis (1997), Filbeck and Gorman (2004),
Sarkis and Cordeiro (2001) and Wang et al. (2014). However, this finding contradicts a
large number of existing studies such as Porter and van der Linde (1995), Albertini
(2013), Salama (2005), Stefan and Paul (2008), Russo and Fouts (1997), Song et al.

185
(2017), Boiral et al. (2012), Gallego-Álvarez et al. (2015), Wang et al. (2016),
Nishitani et el. (2014), Nishitani and Kokubu (2012) and Griffin et al. (2017).
In country-wise analysis, this study finds that carbon performance is negatively related
to both accounting based measure as well as market based measure of a firm’s financial
performance, in all regions except the UK. These results can be considered robust as
they have been controlled for industry and time effect.
While many studies investigate the relationship between environmental
performance/carbon performance and financial performance, there is no known research
that investigates interrelation between carbon performance and financial performance.
This study proposes a positive both-way relationship between carbon performance and
financial performance whereby improvement in carbon performance of a firm will lead
to improvement in its financial performance, and this improvement in financial
performance will allow the firm to invest in emission reduction technologies and
activities, which in turn will improve the firm’s future carbon performance.
Results from this study suggest that accounting based measure of firm financial
performance does not have any significant interrelationship with its carbon
performance. However, market based measure of firm financial performance and carbon
performance influence each other negatively. However, this relationship might vary
across industries. There is no significant interrelationship between carbon performance
and any of the measures of firm financial performance, in any of the four regions.

186
8.2.3 Relationship between carbon disclosure and financial performance
There is no existing research that investigates the relationship between carbon
disclosure and financial performance. Even the relationship between environmental
disclosure/corporate social performance disclosure, and financial performance are not
well researched. The limited research that has been done in this area has produced
conflicting results. The results of this study indicate that there is a significant negative
relationship between carbon disclosure and accounting based measure of firm financial
performance. This finding is contradicted by studies such as Belkaoui (1976); Berman et
al. (1999); Brammer and Pavalin (2006); Weber et al. (2008) and Tang et al. (2012),
who suggest that relationship between pollution disclosure/CSR performance disclosure
and financial performance should be positive. Findings of the study also indicate that
there is no significant or consistent relationship between carbon disclosure and market
measure of financial performance. This finding is supported by Freedman and Jaggi
(1988), who find that there is no association between the extensiveness of pollution
disclosure and economic performance. Therefore, we can conclude that there is a
negative relationship between carbon disclosure and accounting based measure of a
firm’s financial performance. However, there seems to be no significant relationship
between carbon disclosure and market based measure of a firm’s financial performance.
In country-wise analysis, this study finds that there is significant negative relationship
between carbon disclosure and accounting measure of firm financial performance in all
four regions. However, there is no significant relationship between carbon disclosure
and market measure of firm financial performance in any of the four regions.

187
8.2.4 Relationship of agency cost with carbon disclosure and carbon performance
Results of this study indicate that there is a positive but insignificant relationship
between carbon disclosure and agency cost both when agency cost is measured by
Expense Ratio or by Asset Utilization Ratio. Results also indicate that carbon
performance does not significantly affect a firm’s agency cost when agency cost is
measured by Expense Ratio. However, when agency cost is measured by Asset
Utilization Ratio, we find a significantly negative relationship between carbon
performance and agency cost. Therefore, we can conclude from these results that carbon
performance of a business would negatively affect its agency cost when agency cost is
measured by Asset Utilization ratio. In other words, when agency cost is measured by
Asset Utilization ratio, if a firm’s carbon performance improves, its agency cost would
decrease. Country-wise analysis shows that both carbon disclosure and carbon
performance significantly positive affect agency cost only in North America. We don’t
find any significant and consistent relationship between agency cost and carbon
disclosure/carbon performance in any other region.
8.2.5 Trends in improvement of carbon disclosure and carbon performance over
time
Results of this study show that the level of carbon disclosure for the sample
companies have significantly and consistently improved during the study period. On the
other hand, compared to 2011, carbon performance did not significantly improve in
2012. However, it improved significantly in years 2013, 2014 and 2015, but these
improvements were not always consistent. In country-wise analysis, we can see that
compared to year 1, level of carbon disclosure keeps improving consistently and

188
significantly over years 2, 3, 4 and 5 in all the regions. However, the study could not
find any consistent and significant trend in increase or decrease of carbon performance
of the sample companies, in any of the regions during the study period.
8.3 Implications of this study
This study investigates many aspects of the relationship and interrelationships
between carbon disclosure, carbon performance and financial performance which have
never been investigated before. Unlike most previous studies, this study investigates the
above relationships globally by taking a sample of 500 largest global companies across
most major industry sectors and from all major regions of the world. Additionally,
country-wise analysis has been done to test the above mentioned relationships. By doing
so, this study produces a number of first ever findings that make a valuable contribution
to the literature. These findings also have several implications for future policy and
practice in this area.
8.3.1 Implications for literature
Most of the studies that investigate the relationship between carbon disclosure
and carbon performance have been done for specific countries and on specific industries.
This study investigates this relationship on a global scale covering all major industries
except financial services. This study also investigates interrelationship between carbon
disclosure and carbon performance and disclosure practices of average carbon
performers, which have not been done by any previous research. Findings of this study
indicate that there is significant positive relationship between carbon disclosure and

189
carbon performance. This means firms with better carbon performance would make
more carbon disclosure. This finding supports economics-based theories (Voluntary
Disclosure Theory and Signalling Theory) which suggest firms with good performance
are likely to disclose more information. However, this finding contradicts the
assumptions of Stakeholder Theory and Legitimacy Theory, which suggest that
companies with inferior carbon performance would make more carbon disclosure, to
satisfy important stakeholders and retain their legitimacy. These findings supplement
and add to the body of limited literature in this area.
Confirming the predictions of Instrumental Stakeholder Theory and Signalling
Theory, findings of this study also suggest that carbon disclosure and carbon
performance influence each other positively, i.e., there is a positive two-way relationship
between carbon disclosure and carbon performance. As a first ever finding, this result is
likely to be of great value to future researchers in this area.
This research investigates the relationship between carbon performance and both
accounting based measure of financial performance, as well as market based measure of
financial performance. Results suggest that carbon performance and financial
performance are negatively related to each other regardless of the way financial
performance is measured. Future researchers would find this result interesting as it
contradicts most of the previous research which proposed a positive relationship
between environmental disclosure/carbon disclosure and environmental
performance/carbon performance.
As a novel attempt, this study investigates a both-way relationship between
carbon performance and financial performance. Results indicate that accounting based
measure of firm financial performance does not have any significant interrelationship
190
with its carbon performance. However, market based measure of firm financial
performance and carbon performance, influence each other negatively. These new
findings open up possibilities for new research in this under researched area.
Although a handful of previous studies investigate the relationship between
environmental disclosure and economic performance, no study has yet assessed the
relationship between carbon disclosure and financial performance. As another novel
attempt, this study investigates the relationship between carbon disclosure and financial
performance. Results indicate that there is a significant negative relationship between
carbon disclosure and accounting based measure of financial performance. However,
there is no significant or consistent relationship between carbon disclosure and market
based measure of financial performance. These new findings would add great value to
the scant literature that deal with the relationship between environmental
disclosure/carbon disclosure and financial performance.
The relationship between carbon disclosure and agency cost has not been studied
by any previous research. Similarly, there is no existing research that investigates the
relationship between carbon performance and agency cost. As another novel attempt,
this study comprehensively investigates both these relationships by using both measures
of agency cost namely, Expense Ratio and Asset Utilization Ratio. Results indicate that
there is no significant relationship between carbon disclosure and agency cost,
regardless of whether agency cost is measured by Expense Ratio or by Asset Utilization
Ratio. Carbon performance also does not have any relationship with agency cost when it
is measured by Expense Ratio. However, when measured by Asset Utilization Ratio,
there is a significant positive relationship between Agency cost and carbon performance.

191
Therefore, we can suggest that if carbon performance of a business improves, its agency
cost will decrease. These new findings should be valuable to future researchers as well.
While a few studies have conducted trend analysis of carbon disclosure for
certain companies, no study has yet conducted a trend analysis for carbon performance.
This study also adds to the existing literature by conducting a trend analysis for both
carbon disclosure and carbon performance for a global sample over a recent period.
Finally, unlike most previous studies, this study conducts country-wise analysis
for all of its hypotheses which produces many interesting and novel findings. Many of
these findings are likely to add much value to the literature.
8.3.2 Implications for policy and practice
In addition to the above mentioned contributions, findings of this research are
likely to have important implications for policy makers and practitioners. Stakeholders
of businesses such as managers, shareholders, institutional investors, regulators and so
on, can use results of this study to better understand the relationship and
interrelationship between carbon disclosure and carbon performance, between carbon
performance and financial performance, between carbon disclosure and financial
performance, and between agency cost and carbon disclosure/carbon performance. This
understanding will help them to make better business decisions.
As mentioned earlier, as a novel attempt, this study finds that carbon disclosure
and carbon performance influence each other positively. This implies that increase in
carbon disclosure of a firm will improve its carbon performance, and consequently,
improved carbon performance will lead to more carbon disclosure by the firm in the

192
subsequent period. This finding can be very useful to business managers to make
decisions regarding their carbon disclosure and carbon performance activities. This
finding will encourage managers to increase carbon disclosure of their businesses as
increased carbon disclosure is likely to improve the carbon performance of their
business. Improved carbon performance is likely to make the business more attractive to
potential investors. It would also improve the image of the business to stakeholders such
as customers and the general public.
This study also comes up with a first ever finding that carbon performance and
financial performance influence each other negatively. This means, if a firm improves its
carbon performance it will negatively affect its financial performance which
consequently will negatively affect its future carbon performance. This finding can help
business managers to assess the impact of any carbon performance activities they would
like to undertake.
This study also finds that there is a negative relationship between carbon
disclosure and financial performance, i.e. if a business improves its carbon disclosure, its
financial performance will worsen. This finding will help firms’ management assess the
potential benefit of disclosing carbon activities.
The findings of the study also indicate that there is no relationship between
agency cost and carbon disclosure. However, it finds that carbon performance positively
affects agency cost, i.e. if a firm improves its carbon performance, its agency cost would
decrease. These findings should be of great interest to several stakeholders of
businesses, particularly the shareholders, institutional investors and creditors, who can
decrease agency cost by compelling the managers to improve carbon performance of the
business.

193
8.4 Research limitations
Despite the fact that this study is one of the first and the most comprehensive
study to investigate the relationship and interrelationship between carbon disclosure,
carbon performance and financial performance, it still has some limitations. Firstly, the
carbon performance scores used in this study, which are taken from CDP, originally
were in letter bands such as A, A-, B, C, D and E. As letter bands are difficult to use in
statistical analysis, they have been converted to numeric values in this study. To find a
numeric equivalent of a letter band, the upper and lower range of the scores of a letter
band have been divided by 2 and then rounded to the nearest whole number. For
example, the numeric equivalent of A or A- = (86+100) / 2 = 93. Due to this conversion,
for example, all the companies who had a CDP performance score of A or A-, are
assigned carbon performance score of 93 in this study. The same has been done to
convert other letter bands. Due to the approximate conversions of letter bands to
numeric scores, carbon performance scores used in this study may not be arithmetically
100% accurate.
This study has been done for multiple years, and country-wise analysis has been
done for all the research questions. However, one of the limitations is that no industry-
wise or sector-wise analysis has been done in this study.
8.5 Suggestions for future research
There are several opportunities for future research that can enhance the findings
of this study. Firstly, further research can be done by conducting an industry-wise

194
analysis regarding the relationship and interrelationship between carbon disclosure,
carbon performance, financial performance and agency cost.
Secondly, while investigating the relationship between carbon disclosure and
carbon performance, future researchers can go into more depth by analysing the carbon
disclosure practices of businesses in terms of hard disclosure and soft disclosure as done
by Clarkson et al. (2008) for environmental disclosure. Previous research has indicated
that both inferior and superior environmental performers make extensive carbon
disclosure. However, superior performers make verifiable hard disclosure so that others
cannot mimic their performance, as suggested by Voluntary Disclosure and Signalling
Theory. On the other hand, poor environmental performers make soft unverifiable
disclosure to satisfy various stakeholders and maintain legitimacy as supported by
Stakeholder and Legitimacy Theory. Therefore, a new study of carbon disclosure
practices in terms of hard and soft disclosure is likely to add great value to the existing
literature.

195
REFERENCES
Akerlof, G 1970, The market for "Lemons": quality uncertainty and the market
mechanism, The Quarterly Journal of Economics, vol. 84, no. 3, pp. 488-500
Albertini, E., 2013. Does environmental management improve financial performance? A
meta-analytical review. Organization & Environment, 26(4), pp.431-457
Al Mamun, A., Yasser, Q.R. and Rahman, M.A., 2013. A discussion of the suitability of
only one vs. more than one theory for depicting corporate governance. Modern
Economy, 4(1), pp.37-48.
Alrazi, B., de Villiers, C. and van Staden, C., 2010. The environmental reporting of
electric utilities: An international comparison. In 9th CSEAR Australasian
Conference, Albury Wodonga, Australia.
Al-Tuwaijri, S.A., Christensen, T.E. and Hughes, K.E., 2004. The relations among
environmental disclosure, environmental performance, and economic
performance: a simultaneous equations approach. Accounting, organizations and
society, 29(5), pp.447-471.
Ang, J.S., Cole, R.A. and Lin, J.W., 2000. Agency costs and ownership structure. The
Journal of Finance, 55(1), pp.81-106.
An, Y., Davey, H. and Eggleton, I.R., 2011. Towards a comprehensive theoretical
framework for voluntary IC disclosure. Journal of Intellectual Capital, 12(4),
pp.571-585.
Archel, P., Husillos, J., Larrinaga, C. and Spence, C., 2009. Social disclosure,
Legitimacy Theory and the role of the state. Accounting, auditing &
accountability journal, 22(8), pp.1284-1307.

196
Bae Choi, B., Lee, D. and Psaros, J., 2013. An analysis of Australian company carbon
emission disclosures. Pacific Accounting Review, 25(1), pp.58-79.
Bailey, D., Harte, G. and Sugden, R., 2000. Corporate disclosure and the deregulation of
international investment. Accounting, Auditing & Accountability Journal, 13(2),
pp.197-218.
Barako, D.G., Hancock, P. and Izan, H.Y., 2006. Factors influencing voluntary
corporate disclosure by Kenyan companies. Corporate Governance: an
international review, 14(2), pp.107-125.
Belkaoui, A., 1976. The impact of the disclosure of the environmental effects of
organizational behaviour on the market. Financial management, pp.26-31.
Berthelot, S., Cormier, D. and Magnan, M., 2003. Environmental disclosure research:
review and synthesis. Journal of Accounting Literature, 22, p.1.
Bewley, K. and Li, Y., 2000. Disclosure of environmental information by Canadian
manufacturing companies: a voluntary disclosure perspective. In Advances in
Environmental Accounting & Management (pp. 201-226). Emerald Group
Publishing Limited
Bin Abdullah, A. and Nor Izah Ku Ismail, K., 2008. Disclosure of voluntary accounting
ratios by Malaysian listed companies. Journal of Financial Reporting and
Accounting, 6(1), pp.1-20.
Boesso, G. and Kumar, K., 2007. Drivers of corporate voluntary disclosure: A
framework and empirical evidence from Italy and the United States. Accounting,
Auditing & Accountability Journal, 20(2), pp.269-296.

197
Boiral, O., Henri, J.F. and Talbot, D., 2012. Modelling the impacts of corporate
commitment on climate change. Business Strategy and the Environment, 21(8),
pp.495-516.
Borghei-Ghomi, Z. and Leung, P., 2013. An empirical analysis of the determinants of
greenhouse gas voluntary disclosure in Australia. Accounting and Finance
Research, 2(1), p.110.
Botosan, C.A., 1997. Disclosure level and the cost of equity capital. Accounting review,
pp.323-349.
Botosan, C.A. and Plumlee, M.A., 2002. A re‐examination of disclosure level and the
expected cost of equity capital. Journal of accounting research, 40(1), pp.21-40.
Brammer, S. and Pavelin, S., 2006. Voluntary environmental disclosures by large UK
companies. Journal of Business Finance & Accounting, 33(7‐8), pp.1168-1188.
Busch, T. and Hoffmann, V.H., 2011. How hot is your bottom line? Linking carbon and
financial performance. Business & Society, 50(2), pp.233-265.
Buhr, N., 2002. A structuration view on the initiation of environmental reports. Critical
Perspectives on Accounting, 13(1), pp.17-38.
California Air Resources Board 2006 accessed on 21 August 2017,
(https://www.arb.ca.gov)
Campbell, D., Shrives, P. and Bohmbach‐Saager, H., 2001. Voluntary disclosure of
mission statements in corporate annual reports: signaling what and to
whom? Business and society review, 106(1), pp.65-87.
CERES 2007, Climate risk disclosure by the S&P 500, viewed 25 November 2009,
<http://www.ceres.org/resources/reports/climate-risk-disclosure-by-the-s-p-
500/view>.

198
Chaddad, F.R. and Mondelli, M.P., 2013. Sources of firm performance differences in the
US food economy. Journal of Agricultural Economics, 64(2), pp.382-404.
Chen, L., Feldmann, A. and Tang, O., 2015. The relationship between disclosures of
corporate social performance and financial performance: Evidences from GRI
reports in manufacturing industry. International Journal of Production
Economics, 170, pp.445-456.
Cho, C.H. and Patten, D.M., 2007. The role of environmental disclosures as tools of
legitimacy: A research note. Accounting, organizations and society, 32(7),
pp.639-647.
Cho, C.H. and Roberts, R.W., 2010. Environmental reporting on the internet by
America's Toxic 100: Legitimacy and self-presentation. International Journal of
Accounting Information Systems, 11(1), pp.1-16.
Clarkson, P.M., Dontoh, A., Richardson, G. and Sefcik, S.E., 1992. The voluntary
inclusion of earnings forecasts in IPO prospectuses. Contemporary Accounting
Research, 8(2), pp.601-616.
Clarkson, M.E., 1995. A stakeholder framework for analysing and evaluating corporate
social performance. Academy of management review, 20(1), pp.92-117.
Clarkson, P, Li, Y, Richardson, G & Vasvari, F 2008, 'Revisiting the relation between
environmental performance and environmental disclosure: an empirical analysis',
Accounting, Organization and Society, vol. 33, no. 4-5, pp. 303-27
Climate Change Reporting Framework – Edition 1.1 by The Climate Disclosure
Standards Board (CDSB) Reporting Framework 2012, August 05, 2014
(http://www.cdsb.net/cdsb-reporting-framework)
Coakes, S. J., & Steed, G. L. (2001). SPSS analysis without Anguish. Sydney: Wiley

199
Cogan, D. C. (2006). Corporate Governance and Climate Change: Making the
Connection. Boston, MA: Ceres.
Comyns, B., 2016. Determinants of GHG reporting: an analysis of global oil and gas
companies. Journal of business ethics, 136(2), pp.349-369.
Cordeiro, J.J. and Sarkis, J., 1997. Environmental proactivism and firm performance:
evidence from security analyst earnings forecasts. Business Strategy and the
Environment, 6(2), pp.104-114.
Cormier, D. and Gordon, I.M., 2001. An examination of social and environmental
reporting strategies. Accounting, Auditing & Accountability Journal, 14(5),
pp.587-617.
Cormier, D., Magnan, M. and Van Velthoven, B., 2005. Environmental disclosure
quality in large German companies: economic incentives, public pressures or
institutional conditions? European accounting review, 14(1), pp.3-39.
Corporations Act 2001 Canberra: Commonwealth of Australia.
Cotter, J., Lokman, N. and Najah, M.M., 2011. Voluntary disclosure research: which
theory is relevant? The Journal of Theoretical Accounting Research, 6(2), p.77.
Cotter, J. and Najah, M.M., 2012. Institutional investor influence on global climate
change disclosure practices. Australian journal of management, 37(2), pp.169-
187.
Cotter, J., Najah, M. and Sophie Wang, S., 2011. Standardized reporting of climate
change information in Australia. Sustainability accounting, management and
policy journal, 2(2), pp.294-321.
200
Cunningham, B., Nikolai, L., Bazley, J., Kavanagh, M., Slaughter, G. & Simmons, S.
(2012). Accounting: Information for Business Decisions. Melbourne: Cengage
Learning Australia Pty Ltd.
Darrough, MN & Stoughton, NM 1990 ‘Financial disclosure policy in an entry game’,
Journal of Accounting and Economics, 12, pp. 219–243.
De Aguiar, T.R., 2009. Corporate disclosure of greenhouse gas emissions: a UK
study (Doctoral Thesis, University of St Andrews).
Deegan, C., 2002. Introduction: The legitimising effect of social and environmental
disclosures–a theoretical foundation. Accounting, Auditing & Accountability
Journal, 15(3), pp.282-311.
Deegan, C. and Blomquist, C., 2006. Stakeholder influence on corporate reporting: An
exploration of the interaction between WWF-Australia and the Australian
minerals industry. Accounting, Organizations and Society, 31(4-5), pp.343-372.
Deegan, C. and Gordon, B., 1996. A study of the environmental disclosure practices of
Australian corporations. Accounting and business research, 26(3), pp.187-199.
Deegan, C. and Rankin, M., 1996. Do Australian companies report environmental news
objectively? An analysis of environmental disclosures by firms prosecuted
successfully by the Environmental Protection Authority. Accounting, auditing &
accountability journal, 9(2), pp.50-67.
Deegan, C., Rankin, M. and Voght, P. (2000), “Firms’ disclosure reactions to major
social incidents: Australian evidence”, Accounting Forum, Vol. 24 No. 1, pp.
101-30.
Deegan, C & Unerman, J 2006, Financial Accounting Theory, McGraw-Hill Education,
London

201
Delmas, M.A. and Nairn-Birch, N.S., 2011. Is the tail wagging the dog? An empirical
analysis of corporate carbon footprints and financial performance. Institute of the
Environment and Sustainability, University of California, Los Angeles, Los
Angeles.
Denis, D.J. and Osobov, I., 2008. Why do firms pay dividends? International evidence
on the determinants of dividend policy. Journal of Financial economics, 89(1),
pp.62-82.
De Villiers, C. and Van Staden, C., 2009. Good, bad and crisis firms: how much and
where they disclose environmental information. Accounting & finance
association of Australia and New Zealand (AFAANZ), Adelaide. July.
Dhaliwal, D.S., Li, O.Z., Tsang, A. and Yang, Y.G., 2011. Voluntary nonfinancial
disclosure and the cost of equity capital: The initiation of corporate social
responsibility reporting. The Accounting Review, 86(1), pp.59-100.
Donaldson, T. and Preston, L.E., 1995. The Stakeholder Theory of the corporation:
Concepts, evidence, and implications. Academy of Management Review, 20(1),
pp.65-91.
Doran, K & Quinn, E 2009, 'Climate change risk disclosure: a sector by sector analysis
of SEC 10-K filings from 1995–2008', North Carolina Journal of International
Law and Commercial Regulation, vol. 34, pp. 721-67.
Dye, R.A., 1985. Disclosure of non-proprietary information. Journal of accounting
research, pp.123-145.
Earnhart, D. and Lizal, L., 2006. Effects of ownership and financial performance on
corporate environmental performance. Journal of Comparative
Economics, 34(1), pp.111-129.

202
Egels‐Zandén, N. and Sandberg, J., 2010. Distinctions in descriptive and instrumental
Stakeholder Theory: A challenge for empirical research. Business Ethics: A
European Review, 19(1), pp.35-49.
Elsayed, K. and Paton, D., 2005. The impact of environmental performance on firm
performance: static and dynamic panel data evidence. Structural change and
economic dynamics, 16(3), pp.395-412.
Ennis, C., Kottwitz, J., Lin, S.X. and Markusson, N., 2012. Exploring the relationships
between carbon disclosure and performance in FTSE 350 companies (Doctoral
thesis, Working paper).
European commission 2017 accessed on 30 August, 2017
(https://ec.europa.eu/clima/policies/ets_en)
Filbeck, G. and Gorman, R.F., 2004. The relationship between the environmental and
financial performance of public utilities. Environmental and Resource
Economics, 29(2), pp.137-157.
Financial Times, 2017, accessed on 05 June 2016 (https://www.ft.com/ft500)
Florackis, C., 2008. Agency costs and corporate governance mechanisms: Evidence for
UK firms. International Journal of Managerial Finance, 4(1), pp.37-59.
Freedman, M. and Jaggi, B., 2005. Global warming, commitment to the Kyoto protocol,
and accounting disclosures by the largest global public firms from polluting
industries. The International Journal of Accounting, 40(3), pp.215-232.
Freedman, M., Jaggi, B. and Stagliano, A.J., 2003. Pollution disclosures by electric
utilities: an evaluation at the start of the first phase of 1990 Clean Air Act.
In Advances in Environmental Accounting & Management (pp. 59-100).
Emerald Group Publishing Limited.
203
Freedman, M. and Stagliano, A.J., 2008. Environmental disclosures: electric utilities and
Phase 2 of the Clean Air Act. Critical Perspectives on Accounting, 19(4),
pp.466-486.
Freedman, M. and Wasley, C., 1990. The association between environmental
performance and environmental disclosure in annual reports and 10Ks. Advances
in public interest accounting, 3(2), pp.183-193.
Freeman, R.E. and Reed, D.L., 1983. Stockholders and stakeholders: A new perspective
on corporate governance. California management review, 25(3), pp.88-106.
Gallego-Álvarez, I., Segura, L. and Martínez-Ferrero, J., 2015. Carbon emission
reduction: the impact on the financial and operational performance of
international companies. Journal of Cleaner Production, 103, pp.149-159.
Gaver, J.J. and Gaver, K.M., 1993. Additional evidence on the association between the
investment opportunity set and corporate financing, dividend, and compensation
policies. Journal of Accounting and economics, 16(1-3), pp.125-160
Gigler, F., 1994. Self-enforcing voluntary disclosures. Journal of Accounting Research,
pp.224-240.
Government of Canada 2017, accessed on 20 August 2017, (https://www.canada.ca)
Global Climate disclosure Framework for Electric Utilities, viewed August 15, 2014
(http://www.iigcc.org/publications/publication/global-climate-disclosure-
framework-for-electric-utility-companies)
Goldman Sachs Sustain. 2009. Change is coming: A framework for climate change: A
defining issue of the 21st century. http://www.goldmansachs. com/our-
thinking/topics/environment-and-energy/change-is-coming-a-framework-for-
climate-change.pdf [June 27, 2012].

204
Gray, R., Kouhy, R. and Lavers, S., 1995. Corporate social and environmental reporting:
a review of the literature and a longitudinal study of UK disclosure. Accounting,
Auditing & Accountability Journal, 8(2), pp.47-77.
Gray, R., Owen, D. and Adams, C., 1996. Accounting & accountability: changes and
challenges in corporate social and environmental reporting. Prentice Hall.
Griffin, P.A., Lont, D.H. and Sun, E.Y., 2017. The relevance to investors of greenhouse
gas emission disclosures. Contemporary Accounting Research, 34(2), pp.1265-
1297.
Hackston, D. and Milne, M.J., 1996. Some determinants of social and environmental
disclosures in New Zealand companies. Accounting, Auditing & Accountability
Journal, 9(1), pp.77-108.
Henderson, S; Graham, P and Brown, R; 1992 “Financial Accounting Theory: Its Nature
and Development,” 2nd Edition, Longman Cheshire, Melbourne
Hahn, R., Reimsbach, D. and Schiemann, F., 2015. Organizations, climate change, and
transparency: Reviewing the literature on carbon disclosure. Organization &
Environment, 28(1), pp.80-102.
Hart, S.L. and Ahuja, G., 1996. Does it pay to be green? An empirical examination of
the relationship between emission reduction and firm performance. Business
strategy and the Environment, 5(1), pp.30-37.
Hasnas, J., 1998. The normative theories of business ethics: A guide for the
perplexed. Business Ethics Quarterly, 8(1), pp.19-42.
Healy, P.M. and Palepu, K.G., 2001. Information asymmetry, corporate disclosure, and
the capital markets: A review of the empirical disclosure literature. Journal of
accounting and economics, 31(1), pp.405-440.
205
He, Y., Tang, Q. and Wang, K., 2013. Carbon disclosure, carbon performance, and cost
of capital. China Journal of Accounting Studies, 1(3-4), pp.190-220.
Hills, R. C., & Adkins, L. C. (2003). Collinearity. In B. Baltagi (Ed.), A companion to
theoretical econometrics. Oxford: Blackwell Publishing.
Hoffmann, V. H & Busch, T. 2008, ‘Corporate Carbon Performance Indicators’, Journal
of Industrial Ecology, Vol.12, No.4, pp.505-520.
Horváthová, E., 2010. Does environmental performance affect financial performance? A
meta-analysis. Ecological Economics, 70(1), pp.52-59.
Howard-Grenville, J., Buckle, S. J., Hoskins, B. J., & George, G. (2014). Climate
change and management. Academy of Management Journal, 57, 615-623.
Huergo, E. and Jaumandreu, J., 2004. How does probability of innovation change with
firm age? Small Business Economics, 22(3), pp.193-207.
Industrial Efficiency Policy Database 2007 accessed on September 2017,
(http://iepd.iipnetwork.org/policy/mandatory-ghg-emissions-reporting)
Ingram, R.W. and Frazier, K.B., 1980. Environmental performance and corporate
disclosure. Journal of accounting research, pp.614-622.
Iwata, H. and Okada, K., 2011. How does environmental performance affect financial
performance? Evidence from Japanese manufacturing firms. Ecological
Economics, 70(9), pp.1691-1700.
Jaggi, B. and Freedman, M., 1992. An examination of the impact of pollution
performance on economic and market performance: pulp and paper
firms. Journal of Business Finance & Accounting, 19(5), pp.697-713.

206
Jensen, M.C. and Meckling, W.H., 1976. Theory of the firm: Managerial behaviour,
agency costs and ownership structure. Journal of financial economics, 3(4),
pp.305-360.
Jeswani, H.K., Wehrmeyer, W. and Mulugetta, Y. (2008), “How warm is the corporate
response to climate change? Evidence from Pakistan and the UK”, Business
Strategy and the Environment, Vol. 17 No. 1, pp. 46-60.
Jose, A. and Lee, S.M., 2007. Environmental reporting of global corporations: A content
analysis based on website disclosures. Journal of Business Ethics, 72(4), pp.307-
321.
Jones, T.M., 1995. Instrumental Stakeholder Theory: A synthesis of ethics and
economics. Academy of management review, 20(2), pp.404-437.
Juravle, C., & Lewis, A. (2009). The role of championship in the mainstreaming of
sustainable investment (SI): What can we learn from SI pioneers in the United
Kingdom? Organization & Environment, 22, 75-98.
King, A.A. and Lenox, M.J., 2001. Does it really pay to be green? An empirical study of
firm environmental and financial performance: An empirical study of firm
environmental and financial performance. Journal of Industrial Ecology, 5(1),
pp.105-116.
King, A.A. and Lenox, M.J., 2000. Industry self-regulation without sanctions: The
chemical industry's responsible care program. Academy of management
journal, 43(4), pp.698-716.
Kolk, A., Levy, D. and Pinkse, J., 2008. Corporate responses in an emerging climate
regime: The institutionalization and commensuration of carbon
disclosure. European Accounting Review, 17(4), pp.719-745.

207
Labhane, N.B. and Mahakud, J., 2016. Determinants of Dividend Policy of Indian
Companies: A Panel Data Analysis. Paradigm, 20(1), pp.36-55.
Levin, J., 2001. Information and the Market for Lemons. RAND Journal of Economics,
pp.657-666.
Lindblom, C.K., 1994, April. The implications of organizational legitimacy for
corporate social performance and disclosure. In Critical perspectives on
accounting conference, New York (Vol. 120).
A., Hoepner, A.G., Patten, D.M. and Figge, F., 2015. Does stakeholder pressure
influence corporate GHG emissions reporting? Empirical evidence from
Europe. Accounting, Auditing & Accountability Journal, 28(7), pp.1047-1074.
Liu, Y., Zhou, Z., Zhang, X., Xu, X., Chen, H. and Xiong, Z. (2015), “Net global
warming potential and greenhouse gas intensity from the double rice system with
integrated soil-crop system management: a three-year field study”, Atmospheric
Environment, Vol. 116, pp. 92-101.
Liu, X. and Anbumozhi, V., 2009. Determinant factors of corporate environmental
information disclosure: an empirical study of Chinese listed companies. Journal
of cleaner production, 17(6), pp.593-600.
Li, Y., Richardson, G.D. and Thornton, D.B., 1997. Corporate disclosure of
environmental liability information: Theory and evidence. Contemporary
Accounting Research, 14(3), pp.435-474.
Lopez‐Valeiras, E., Gomez‐Conde, J. and Fernandez‐Rodriguez, T., 2016. Firm Size and
Financial Performance: Intermediate Effects of
Indebtedness. Agribusiness, 32(4), pp.454-465.

208
Luo, L. and Tang, Q., 2014. Does voluntary carbon disclosure reflect underlying carbon
performance? Journal of Contemporary Accounting & Economics, 10(3),
pp.191-205.
Mäkelä, H. and Näsi, S., 2010. Social responsibilities of MNCs in downsizing
operations: A Finnish forest sector case analysed from the stakeholder, social
contract and Legitimacy Theory point of view. Accounting, Auditing &
Accountability Journal, 23(2), pp.149-174.
Margolick, M., & Russell, D. (2004). Corporate greenhouse gas reduction targets.
Arlington VA: Pew Centre on Global Climate Change/Global Change Strategies
International.
Matisoff, D. C. (2013). Different rays of sunlight: Understanding information disclosure
and carbon transparency. Energy Policy, 55, pp, 579-592.
Matsumura, E.M., Prakash, R. and Vera-Muñoz, S.C., 2013. Firm-value effects of
carbon emissions and carbon disclosures. The Accounting Review, 89(2),
pp.695-724.
McWilliams, A. and Siegel, D., 2001. Corporate social responsibility: A theory of the
firm perspective. Academy of management review, 26(1), pp.117-127.
Meek, G.K., Roberts, C.B. and Gray, S.J., 1995. Factors influencing voluntary annual
report disclosures by US, UK and continental European multinational
corporations. Journal of international business studies, 26(3), pp.555-572.
Meng, X.H., Zeng, S.X., Shi, J.J., Qi, G.Y. and Zhang, Z.B. (2014), “The relationship
between corporate environmental performance and environmental disclosure: an
empirical study in China”, Journal of Environmental Management, Vol. 145, pp.
357-367.

209
Mohan-Neill, S.I., 1995. The influence of firm's age and size on its environmental
scanning activities. Journal of Small Business Management, 33(4), p.10.
Morris, R.D., 1987. Signalling, agency theory and accounting policy choice. Accounting
and business Research, 18(69), pp.47-56.
Myers, M. and Frank, B., 2004. The determinants of corporate dividend
policy. Academy of Accounting and Financial Studies Journal, 8(3), pp.17-28.
Najah, M.M.S., 2012. Carbon risk management, carbon disclosure and stock market
effects: An international perspective (Doctoral Thesis, University of Southern
Queensland).
Nakao, Y., Amano, A., Matsumura, K., Genba, K. and Nakano, M., 2007. Relationship
between environmental performance and financial performance: an empirical
analysis of Japanese corporations. Business Strategy and the Environment, 16(2),
pp.106-118.
Nasi, J., Nasi, S., Phillips, N. and Zyglidopoulos, S., 1997. The evolution of corporate
social responsiveness: An exploratory study of Finnish and Canadian forestry
companies. Business & Society, 36(3), pp.296-321.
National Greenhouse and Energy Reporting Act 2007 (Commonwealth of Australia)
Nishitani, K. and Kokubu, K., 2012. Why does the reduction of greenhouse gas
emissions enhance firm value? The case of Japanese manufacturing
firms. Business Strategy and the Environment, 21(8), pp.517-529.
Nishitani, K., Kaneko, S., Komatsu, S. and Fujii, H., 2014. How does a firm’s
management of greenhouse gas emissions influence its economic performance?
Analysing effects through demand and productivity in Japanese manufacturing
firms. Journal of Productivity Analysis, 42(3), pp.355-366.

210
O'Donovan, G., 1999. Managing legitimacy through increased corporate environmental
reporting: an exploratory study. Interdisciplinary Environmental Review, 1(1),
pp.63-99.
O’Donovan, G., 2002. Environmental disclosures in the annual report: Extending the
applicability and predictive power of Legitimacy Theory. Accounting, Auditing
& Accountability Journal, 15(3), pp.344-371.
O'Dwyer, B., 2005. Stakeholder democracy: challenges and contributions from social
accounting. Business Ethics: A European Review, 14(1), pp.28-41.
Orlitzky, M., Schmidt, F.L. and Rynes, S.L., 2003. Corporate social and financial
performance: A meta-analysis. Organization studies, 24(3), pp.403-441.
Patten, D.M., 2002. The relation between environmental performance and environmental
disclosure: a research note. Accounting, organizations and Society, 27(8),
pp.763-773.
Patten, DM 2002a ‘Media exposure, public policy pressure, and environmental
disclosure: an examination of the impact of TRI data availability’, Accounting
Forum, 26(2), 152-171.
Patten, DM 2002b. The relation between environmental performance and environmental
disclosure: a research note, Accounting, Organizations and Society, 27, 763-773.
Peng, J., Sun, J. and Luo, R., 2015. Corporate voluntary carbon information disclosure:
Evidence from China's listed companies. The World Economy, 38(1), pp.91-109
Pesqueux, Y. and Damak-Ayadi, S., 2005. Stakeholder Theory in perspective. Corporate
Governance: The international journal of business in society, 5(2), pp.5-21.
Porter, M.E., 1991. Towards a dynamic theory of strategy. Strategic management
journal, 12(S2), pp.95-117.

211
Porter, M.E. and Van der Linde, C., 1995a. Green and competitive: ending the
stalemate. Harvard business review, 73(5), pp.120-134.
Prado-Lorenzo, J.M., Rodríguez-Domínguez, L., Gallego-Alvarez, I. and García-
Sánchez, I.M., 2009. Factors influencing the disclosure of greenhouse gas
emissions in companies world-wide. Management Decision, 47(7), pp.1133-
1157.
Prencipe, A., 2004. Proprietary costs and determinants of voluntary segment disclosure:
evidence from Italian listed companies. European Accounting Review, 13(2),
pp.319-340.
Rankin, M., Windsor, C. and Wahyuni, D., 2011. An investigation of voluntary
corporate greenhouse gas emissions reporting in a market governance system:
Australian evidence. Accounting, Auditing & Accountability Journal, 24(8),
pp.1037-1070.
Rashid, A., 2015. Revisiting agency theory: Evidence of board independence and agency
cost from Bangladesh. Journal of Business Ethics, 130(1), pp.181-198.
Rahman, N.R.A., Rasid, S.Z.A. and Basiruddin, R., 2014. Exploring the relationship
between carbon performance, carbon reporting and firm performance: A
conceptual paper. Procedia-Social and Behavioral Sciences, 164, pp.118-125.
Reverte, C., 2009. Determinants of corporate social responsibility disclosure ratings by
Spanish listed firms. Journal of Business Ethics, 88(2), pp.351-366.
Richardson, A.J., Welker, M. and Hutchinson, I.R., 1999. Managing capital market
reactions to corporate social responsibility. International Journal of Management
Reviews, 1(1), pp.17-43

212
Ross, S.A., 1977. The determination of financial structure: the incentive-signalling
approach. The bell journal of economics, pp.23-40.
Russo, M.V. and Fouts, P.A., 1997. A resource-based perspective on corporate
environmental performance and profitability. Academy of management
Journal, 40(3), pp.534-559.
Salama, A., 2005. A note on the impact of environmental performance on financial
performance. Structural change and economic dynamics, 16(3), pp.413-421.
Sarkis, J. and Cordeiro, J.J., 2001. An empirical evaluation of environmental efficiencies
and firm performance: pollution prevention versus end-of-pipe
practice. European Journal of Operational Research, 135(1), pp.102-113.
Shehata, N.F., 2014. Theories and Determinants of Voluntary Disclosure. Accounting
and Finance Research, 3(1), p.18.
Singh, M. and Davidson III, W.N., 2003. Agency costs, ownership structure and
corporate governance mechanisms. Journal of Banking & Finance, 27(5),
pp.793-816.
Smith, C.W. and Watts, R.L., 1992. The investment opportunity set and corporate
financing, dividend, and compensation policies. Journal of financial
Economics, 32(3), pp.263-292.
Smith, JA, Morreale, M & Miriani ME 2008 ‘Climate change disclosure: Moving
towards a brave new world,’ Capital Markets Law Journal, 3(4), pp. 469-485
Song, H., Zhao, C. and Zeng, J., 2017. Can environmental management improve
financial performance: An empirical study of A-shares listed companies in
China? Journal of Cleaner Production, 141, pp.1051-1056.

213
Spence, M. (1973). Job market signalling, Quarterly Journal of Economics, 87(3), pp.
355–374Stanny, E., 2013. Voluntary disclosures of emissions by US
firms. Business Strategy and the Environment, 22(3), pp.145-158.
Stanny, E. and Ely, K., 2008. Corporate environmental disclosures about the effects of
climate change. Corporate Social Responsibility and Environmental
Management, 15(6), pp.338-348.
Stefan, A. and Paul, L., 2008. Does it pay to be green? A systematic overview. The
Academy of Management Perspectives, 22(4), pp.45-62.
Stern, N. (2006). The Stern Review on the Economics of Climate Change, Cambridge
University Press, Cambridge, MA.
Suchman, M.C., 1995. Managing legitimacy: Strategic and institutional approaches.
Academy of management review, 20(3), pp.571-610.
Sullivan, R. and Kozak, J., 2006. The climate change disclosures of European electricity
utilities. Insight Investment, London, 10.
Sullivan, R., & Gouldson, A. (2012). Does voluntary carbon reporting meet investors’
needs? Journal of Cleaner Production, 36, 60-67.
Sutantoputra, A.W., Lindorff, M. and Johnson, E.P., 2012. The relationship between
environmental performance and environmental disclosure. Australasian journal
of environmental management, 19(1), pp.51-65.
Tang, Z., Hull, C.E. and Rothenberg, S., 2012. How corporate social responsibility
engagement strategy moderates the CSR–financial performance
relationship. Journal of Management Studies, 49(7), pp.1274-1303.
Tilling, M.V., 2004. Some thoughts on Legitimacy Theory in social and environmental
accounting. Social and Environmental Accountability Journal, 24(2), pp.3-7.

214
The Global Reporting Initiatives, viewed August 01, 2014, (www.globalreporting.org)
The World Bank, viewed April 26, 2018, (http://www.worldbank.org)
U.K. Government. (2013) The Companies Act 2006 (Strategic Report and Directors’
Report) Regulations 2013. London, England: The Stationery Office
Ullmann, A.A., 1985. Data in search of a theory: A critical examination of the
relationships among social performance, social disclosure, and economic
performance of US firms. Academy of management review, 10(3), pp.540-557.
United Nations (1992), “United Nations Framework Convention on Climate Change”,
available at: http://unfccc.int/resource/docs/convkp/conveng.pdf (accessed 20
August 2015).
United Nations Framework Convention on Climate Change, accessed on 31 March 2018
(http://unfccc.int/kyoto_protocol)
United States Environmental Protection Agency 2017, accessed on 17 June 2017,
(https://www.epa.gov)
EPA, A., 2011. Inventory of US greenhouse gas emissions and sinks: 1990-2009.
Environmental Protection Agency, Washington DC.
US Securities & Exchange Commission 2017, accessed on 10 July 2015,
(https://www.sec.gov)
Verrecchia, R., 1983 ‘Discretionary disclosure’, Journal of Accounting and Economics,
5, pp. 179–194.
Wagenhofer, A., 1990 ‘Voluntary disclosure with a strategic opponent’, Journal of
Accounting and Economics, vol. 2, issue 4, pp. 341–363.

215
Wagner, M. and Schaltegger, S., 2004. The effect of corporate environmental strategy
choice and environmental performance on competitiveness and economic
performance: an empirical study of EU manufacturing. European Management
Journal, 22(5), pp.557-572.
Wallace, G.W., 1995. Balancing conflicting stakeholder requirements. The Journal for
Quality and Participation, 18(2), p.84.
Wang, L., Li, S. and Gao, S., 2014. Do greenhouse gas emissions affect financial
performance? –an empirical examination of Australian public firms. Business
Strategy and the Environment, 23(8), pp.505-519.
Watson, A., Shrives, P. and Marston, C., 2002. Voluntary disclosure of accounting ratios
in the UK. The British Accounting Review, 34(4), pp.289-313.
Watts, R.L. and Zimmerman, J.L., 1978. Towards a positive theory of the determination
of accounting standards. Accounting review, pp.112-134.
Weber, M., 2008. The business case for corporate social responsibility: A company-level
measurement approach for CSR. European Management Journal, 26(4), pp.247-
261.
Weinhofer, G. and Hoffman, V.H. (2010), “Mitigating climate change – how do
corporate strategies differ?” Business Strategy and the Environment, Vol. 19 No.
2, pp. 77-89.
White, H., 1980. A heteroskedasticity-consistent covariance matrix estimator and a
direct test for heteroskedasticity. Econometrica: Journal of the Econometric
Society, pp.817-838.

216
Whiting, R.H. and Miller, J.C., 2008. Voluntary disclosure of intellectual capital in New
Zealand annual reports and the “hidden value”. Journal of Human Resource
Costing & Accounting, 12(1), pp.26-50.
Wiseman, J., 1982. An evaluation of environmental disclosures made in corporate
annual reports. Accounting, Organizations and Society, 7(1), pp.53-63.
Williamson, O.E., 1988. Corporate finance and corporate governance. The journal of
finance, 43(3), pp.567-591.
Xiao, J.Z., Yang, H. and Chow, C.W., 2004. The determinants and characteristics of
voluntary Internet-based disclosures by listed Chinese companies. Journal of
accounting and Public Policy, 23(3), pp.191-225.
Recommended