Can Brazil Qualify for the Investment Grade League?
Shelly Shetty Senior Director
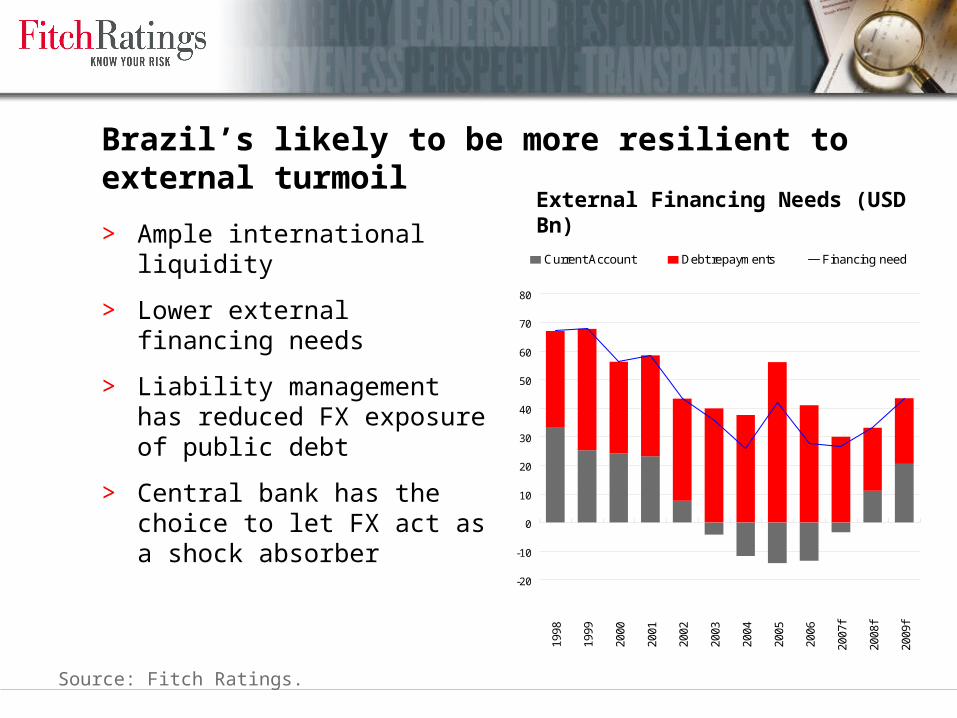
Agenda
Brazil’s Macro Picture
Brazil’s Credit Dynamics
Brazil versus India: Comparing Two of the BRICs

Agenda
Brazil’s Macro Picture
Brazil’s Credit Dynamics
Brazil versus India: Comparing Two of the BRICs

Brazil in a Snapshot
2003 2004 2005 2006 2007 2008 2009
Real GDP growth (%) 1.1 5.7 2.9 3.7 5.4 4.3 4.1
Consumer prices (ann. avg. % change)
14.3 6.1 5.7 2.7 3.7 4.0 4.0
CXR (% change) 18.7 28.7 22.3 18.8 19.4 8.4 8.5
CAB (% of GDP) 0.7 1.7 1.6 1.2 0.3 -0.7 -1.2
Govt. balance (% of GDP) -5.8 -3.4 -3.6 -3.5 -2.4 -2.3 -2.2
Source: Fitch Ratings.
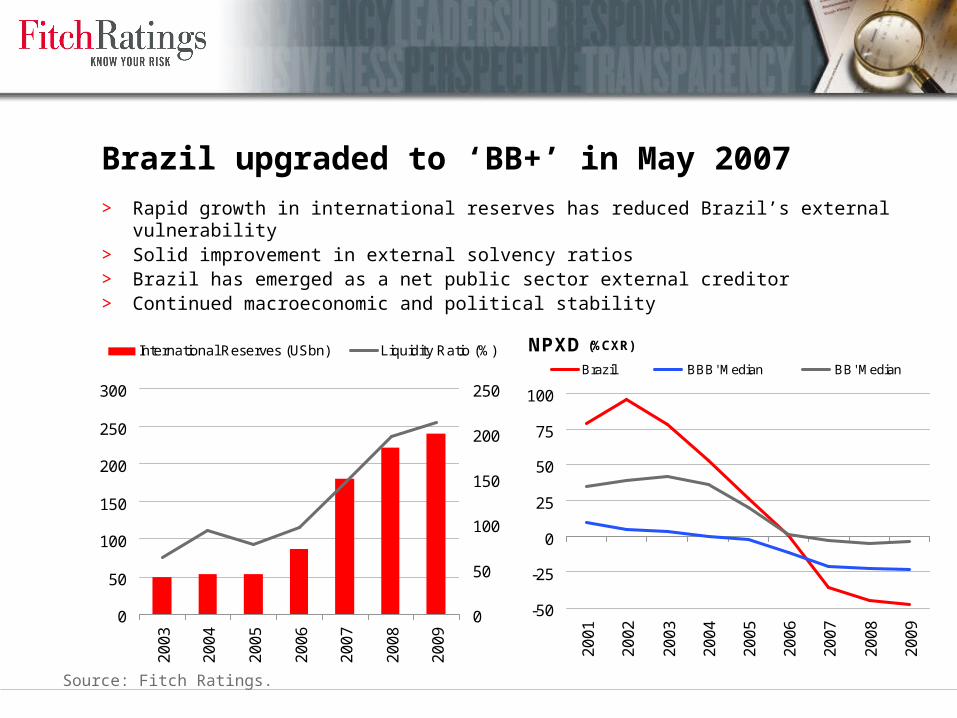
Brazil’s likely to be more resilient to external turmoil
> Ample international liquidity
> Lower external financing needs
> Liability management has reduced FX exposure of public debt
> Central bank has the choice to let FX act as a shock absorber
-20
-10
0
10
20
30
40
50
60
70
80
1998
1999
2000
2001
2002
2003
2004
2005
2006
2007
f
2008
f
2009
f
Current Account Debt repayments Financing need
External Financing Needs (USD Bn)
Source: Fitch Ratings.

Brazil Exports to Major Markets
Note: Europe – EU & Eastern Europe countries, Latin America – Aladi & MercosurSource: Ministerio do Desenvolvimento, Industria e Comercio Exterior.
20072001
In 2007, Brazil exported
USD$11bn to China, up from
USD$2bn in 2001.
Europe35%
Middle East4%US
30%
Asia15%
Latin America
12%
Africa4%
Brazil’s more diversified export base provides cushion

Agenda
Brazil’s Macro Picture
Brazil’s Credit Dynamics
Brazil versus India: Comparing Two of the BRICs
Brazil upgraded to ‘BB+’ in May 2007
0
50
100
150
200
250
300
20
03
20
04
20
05
20
06
20
07
20
08
20
09
0
50
100
150
200
250
International Reserves (USbn) Liquidity Ratio (%)
(US bn) (%)
NPXD (%CXR)
-50
-25
0
25
50
75
100
20
01
20
02
20
03
20
04
20
05
20
06
20
07
20
08
20
09
Brazil 'BBB' Median 'BB' Median
> Rapid growth in international reserves has reduced Brazil’s external vulnerability> Solid improvement in external solvency ratios> Brazil has emerged as a net public sector external creditor> Continued macroeconomic and political stability
Source: Fitch Ratings.

What is slowing Brazil’s ascent to Investment Grade?
> A heavy public debt burden
> Unfavorable domestic debt profile
> Weaker growth prospects compared with IG Sovereigns
> Public debt dynamics not improving fast enough
Brazil Key Indicators 2008BBB
Median
Real GDP growth (%, 5 yr avg) 4.4 5.3
GDP per capita (USD) 8,031 7,286
Consumer prices (% change) 4.0 5.7
CAB (% of GDP) -0.7 -1.5
Govt. balance (% of GDP) -2.7 -1.7
Govt. debt (% of GDP) 65.2 24.9
Govt. debt (% of revenue) 171.5 102.5
Net external debt (% of CXR) -13.7 9.6
Net public external debt (% of CXR) -45.4 -25.6
External debt service (% of CXR) 18.2 10.1
Liquidity ratio (%) 196.2 161.2
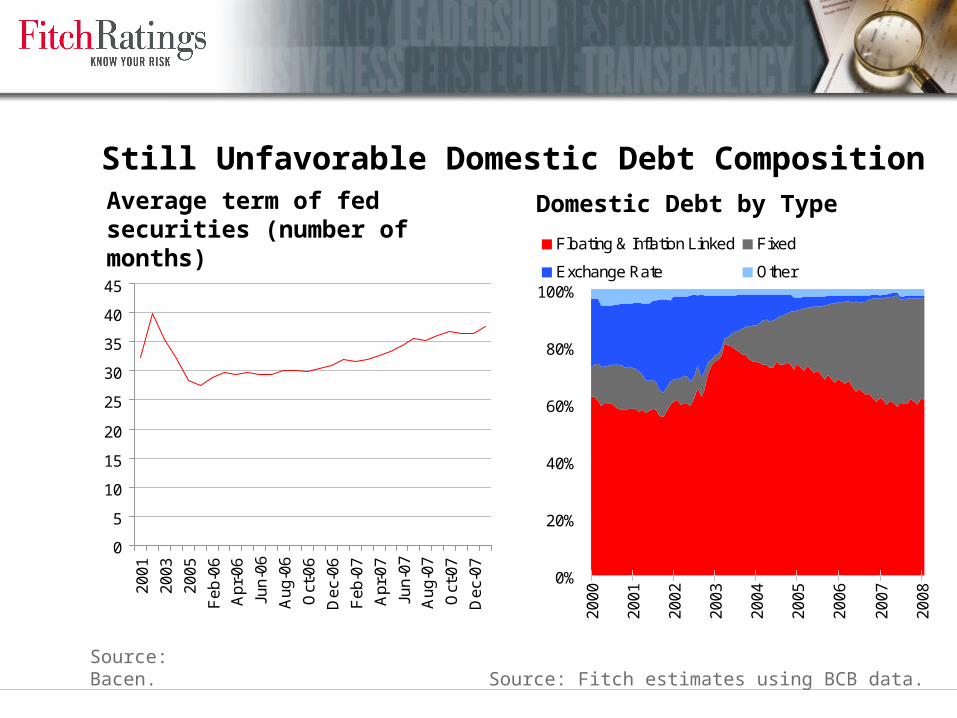
Still Unfavorable Domestic Debt Composition
0
5
10
15
20
25
30
35
40
45
20
01
20
03
20
05
Fe
b-0
6
Ap
r-0
6
Jun
-06
Au
g-0
6
Oct
-06
De
c-0
6
Fe
b-0
7
Ap
r-0
7
Jun
-07
Au
g-0
7
Oct
-07
De
c-0
7
Average term of fed securities (number of months)
Source: Bacen.
0%
20%
40%
60%
80%
100%
20
00
20
01
20
02
20
03
20
04
20
05
20
06
20
07
20
08
Floating & Inflation Linked Fixed
Exchange Rate Other
Domestic Debt by Type
Source: Fitch estimates using BCB data.
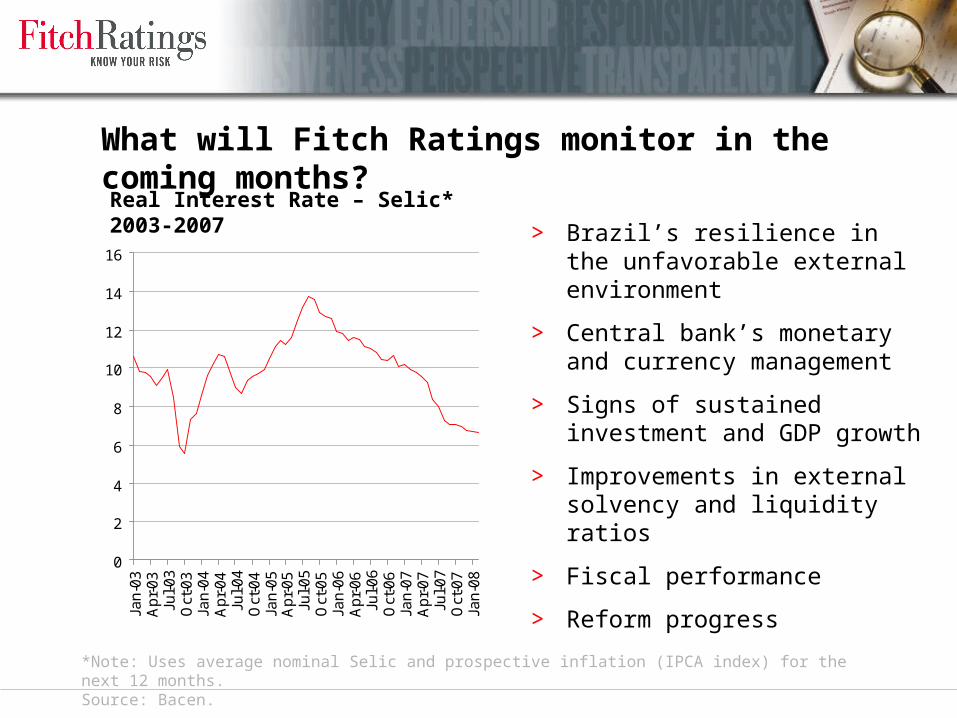
> Brazil’s resilience in the unfavorable external environment
> Central bank’s monetary and currency management
> Signs of sustained investment and GDP growth
> Improvements in external solvency and liquidity ratios
> Fiscal performance
> Reform progress
Real Interest Rate – Selic*2003-2007
0
2
4
6
8
10
12
14
16
Jan
-03
Ap
r-0
3Ju
l-0
3O
ct-0
3Ja
n-0
4A
pr-
04
Jul-
04
Oct
-04
Jan
-05
Ap
r-0
5Ju
l-0
5O
ct-0
5Ja
n-0
6A
pr-
06
Jul-
06
Oct
-06
Jan
-07
Ap
r-0
7Ju
l-0
7O
ct-0
7Ja
n-0
8
*Note: Uses average nominal Selic and prospective inflation (IPCA index) for the next 12 months. Source: Bacen.
What will Fitch Ratings monitor in the coming months?
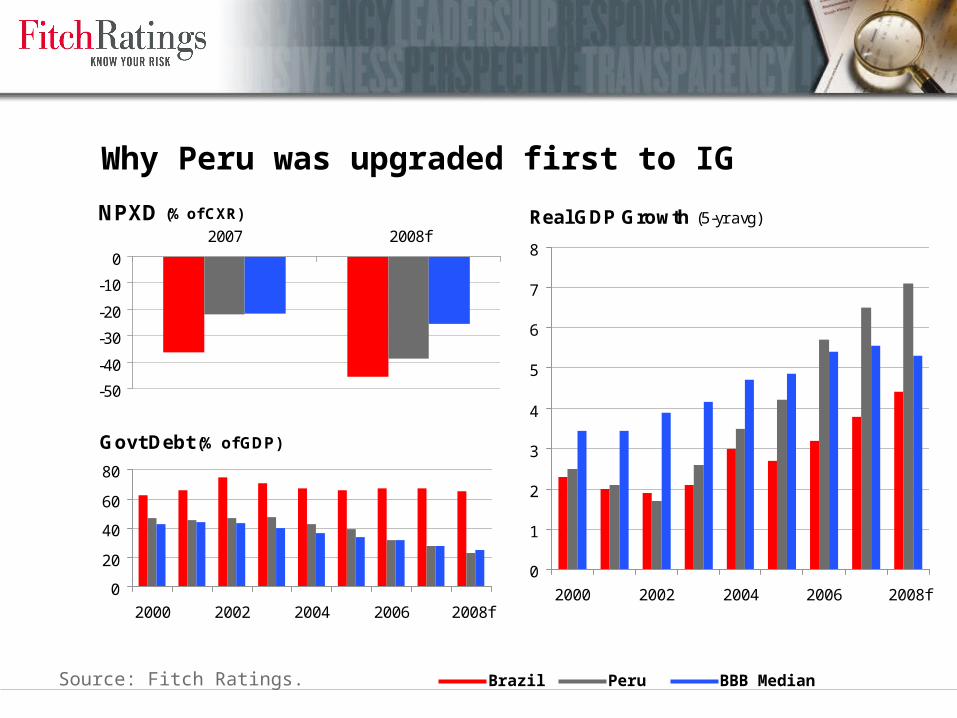
Why Peru was upgraded first to IG
NPXD (% of CXR)
-50
-40
-30
-20
-10
0
2007 2008f
Govt Debt (% of GDP)
0
20
40
60
80
2000 2002 2004 2006 2008f
Real GDP Growth (5-yr avg)
0
1
2
3
4
5
6
7
8
2000 2002 2004 2006 2008f
Brazil Peru BBB MedianSource: Fitch Ratings.
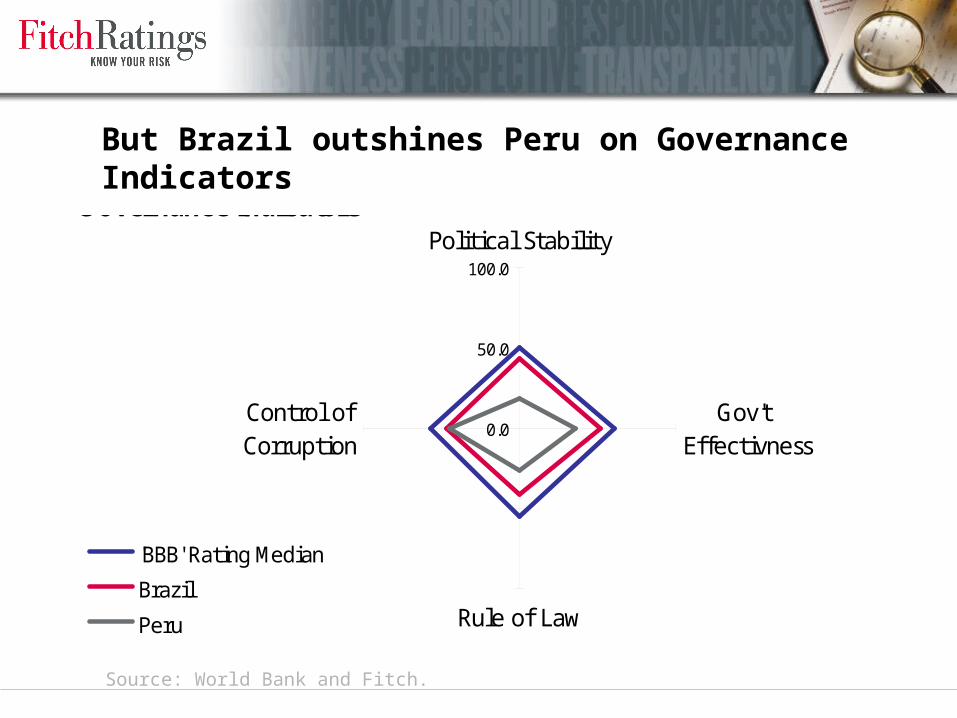
But Brazil outshines Peru on Governance Indicators
Source: World Bank and Fitch.
Governance Indicators
0.0
50.0
100.0
Political Stability
Gov't Effectivness
Rule of Law
Control ofCorruption
'BBB' Rating Median
Brazil
Peru

Agenda
Brazil’s Macro Picture
Brazil’s Credit Dynamics
Brazil versus India: Comparing Two of the BRICs
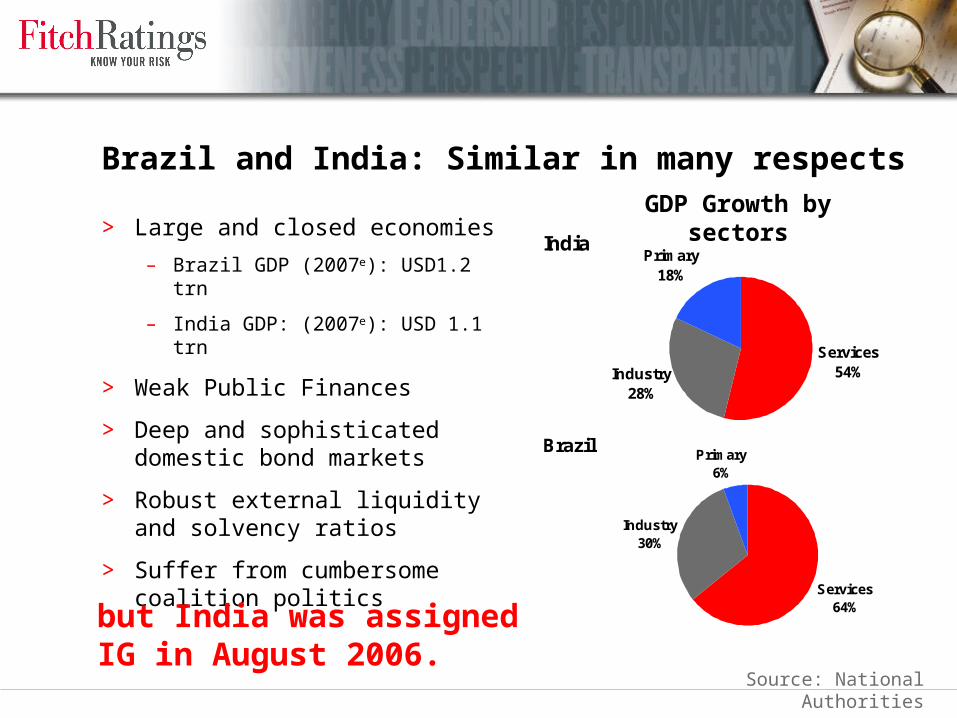
Brazil and India: Similar in many respects
> Large and closed economies
– Brazil GDP (2007e): USD1.2 trn
– India GDP: (2007e): USD 1.1 trn
> Weak Public Finances
> Deep and sophisticated domestic bond markets
> Robust external liquidity and solvency ratios
> Suffer from cumbersome coalition politics
IndiaPrimary
18%
Industry28%
Services54%
but India was assigned IG in August 2006.
BrazilPrimary
6%
Industry30%
Services64%
GDP Growth by sectors
Source: National Authorities
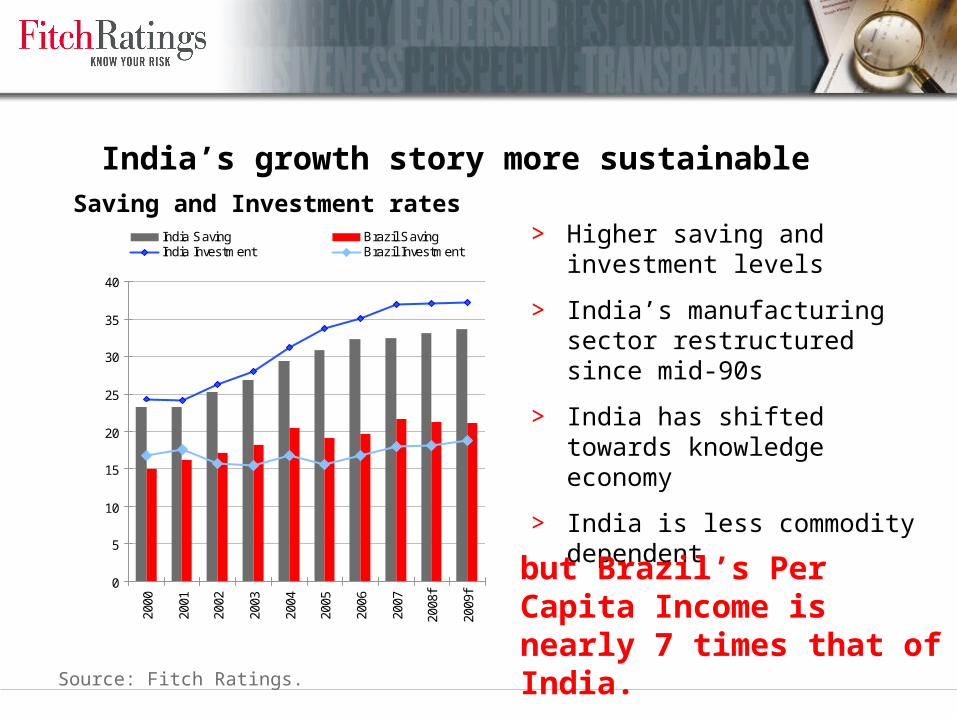
India’s growth story more sustainable
0
5
10
15
20
25
30
35
40
2000
2001
2002
2003
2004
2005
2006
2007
2008
f
2009
f
India Saving Brazil SavingIndia Investment Brazil Investment
> Higher saving and investment levels
> India’s manufacturing sector restructured since mid-90s
> India has shifted towards knowledge economy
> India is less commodity dependent
but Brazil’s Per Capita Income is nearly 7 times that of India.
Saving and Investment rates
Source: Fitch Ratings.
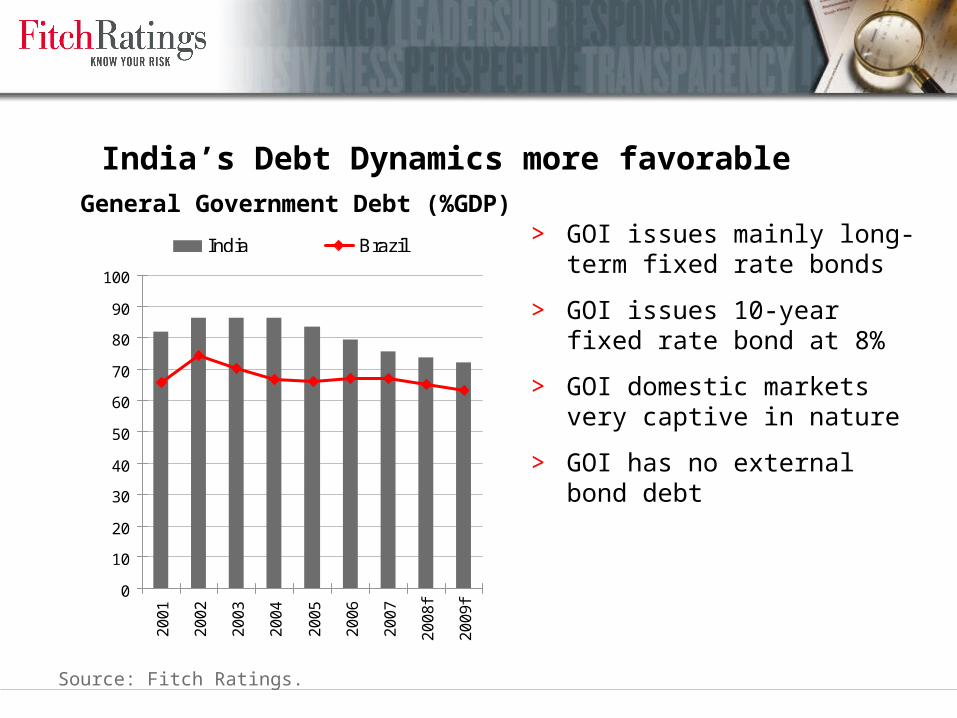
India’s Debt Dynamics more favorable
> GOI issues mainly long-term fixed rate bonds
> GOI issues 10-year fixed rate bond at 8%
> GOI domestic markets very captive in nature
> GOI has no external bond debt
0
10
20
30
40
50
60
70
80
90
100
20
01
20
02
20
03
20
04
20
05
20
06
20
07
20
08
f
20
09
f
India Brazil
General Government Debt (%GDP)
Source: Fitch Ratings.
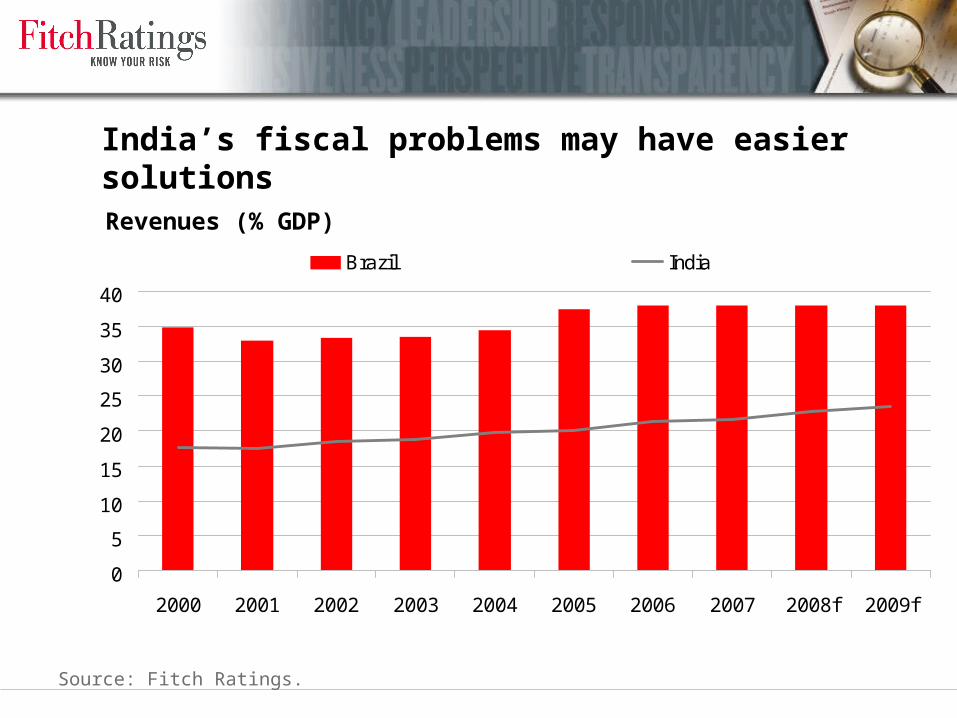
India’s fiscal problems may have easier solutions
0
5
10
15
20
25
30
35
40
2000 2001 2002 2003 2004 2005 2006 2007 2008f 2009f
Brazil India
Source: Fitch Ratings.
Revenues (% GDP)

External strengths: India’s international reserves more robust
0
5
10
15
20
25
30
20
01
20
02
20
03
20
04
20
05
20
06
20
07
20
08
f
20
09
f
Brazil India
0
50
100
150
200
250
300
350
20
01
20
02
20
03
20
04
20
05
20
06
20
07
20
08
f
20
09
f
Brazil India
International Liquidity ratio (%) International Reserves/GDP (%)
Source: Fitch Ratings.
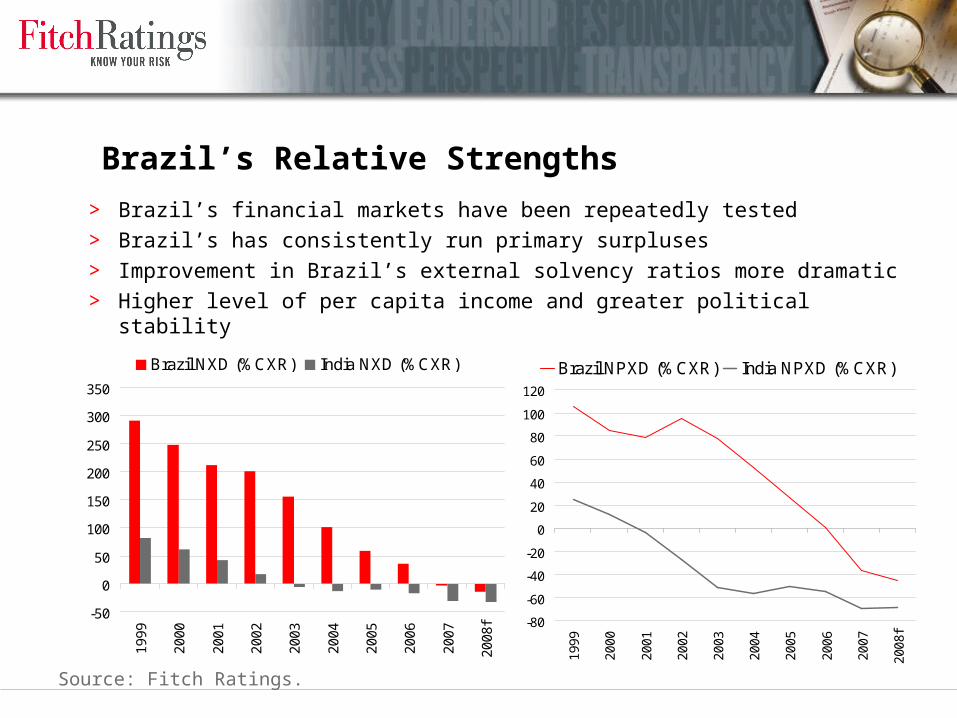
Brazil’s Relative Strengths
> Brazil’s financial markets have been repeatedly tested> Brazil’s has consistently run primary surpluses> Improvement in Brazil’s external solvency ratios more dramatic> Higher level of per capita income and greater political stability
-50
0
50
100
150
200
250
300
350
1999
2000
2001
2002
2003
2004
2005
2006
2007
2008
f
Brazil NXD (%CXR) India NXD (%CXR)
-80
-60
-40
-20
0
20
40
60
80
100
120
1999
2000
2001
2002
2003
2004
2005
2006
2007
2008
f
Brazil NPXD (%CXR) India NPXD (%CXR)
Source: Fitch Ratings.

Fitch Ratingswww.fitchratings.com
New YorkOne State Street PlazaNew York, NY 10004+1 212 908 0500+1 800 75 FITCH
Fitch Group Fitch Ratings Fitch Solutions Algorithmics
London101 Finsbury PavementLondonEC2A 1RS44 20 7417 4222
Singapore6 Temasek Blvd.#35-03/04/05Suntec Tower FourSingapore 038986+65 6336 6801
Recommended