CALIFORNIA ENERGY COMMISSIONdn
Partnerships for Clean Energy DevelopmentUSDOE/Office of Weatherization and
International Programs (OWIP) Project Opportunities Workshop
Terry Surles
California Energy Commission
September 9, 2003

CALIFORNIA ENERGY COMMISSIONdn
California in Context
Size of the economy Gross state product in 2000 was about $1.35
trillion Population
Population grew from about 30 million in 1990 to about 34.5 million in 2002
History of encouraging economic growth, while maintaining an aggressive record for environmental protection

CALIFORNIA ENERGY COMMISSIONdn
GDP (2000)
0 1,000 2,000 3,000 4,000 5,000
U.S.
Japan
Germany
U.K.
CALIFORNIA
France
China
Italy
Canada
Mexico
Spain
GDP (2001) [billions of current U.S. dollars]
0010,100
GDP (2001)

CALIFORNIA ENERGY COMMISSIONdn
California has Established a $62M/yr Public Interest Energy Research Program
(PIER)
Economy:AffordableSolutions
Quality:Reliable and
AvailableEnvironment:Protect and
Enhance
California’s Energy Future

CALIFORNIA ENERGY COMMISSIONdn
California Must be Prepared to Face the Same Issues as Others Must
Economics Resource Competition New technology market
penetration Lifecycle analysis State/Federal laws
Environment Impact of new technologies Climate change Sustainable practices
Security Peak demand/demand response Infrastructure interdependencies
Energy Costs Fundamentally Affect our Overall Economy

CALIFORNIA ENERGY COMMISSIONdn
PIER Must Address Future Market Scenarios: A Goal is to Provide Greater
End-User choiceRegulated
De-regulated
De-centralizedCentralized
Status Quo • New energy systems
• Same players
Supermarket of Choices
• Same energy systems
• New players

CALIFORNIA ENERGY COMMISSIONdn
Policy and RD&D Must Be Linked in Order to
Provide Benefits to the State
Benefits to State and Citizens
California Issues
Related State Activities Collaborations

CALIFORNIA ENERGY COMMISSIONdn
Our Success is Coupled to the Successes of our Technology Partnerships
Universities – UCOP, standard contract Industries – funding, obtaining co-funding,
pushing deployment Federal – Departments of Energy, Commerce,
Agriculture National Laboratories – LBNL, NREL, LLNL,
ORNL, NETL, SNL, ANL State – ARB, CDF, DWR, DOGGR, CFA, CPA,
CPUC, DGS

CALIFORNIA ENERGY COMMISSIONdn
RD&D Activities Should Connect with Synergistic State Regulatory, Incentive,
and Subsidy Programs
Buildings – Titles 20 and 24 Renewables – Renewable portfolio standard (RPS) Environmentally-Preferred Advanced Generation –
2007 ARB rules on distributed generation emissions Energy Systems Integration – CPUC/CEC initiatives
in demand response/dynamic pricing, distributed energy resources, and transmission and distribution systems
Environmental – Impacts/opportunities related to RPS, state initiatives (AB 1493) in climate change

CALIFORNIA ENERGY COMMISSIONdn
$ External Funding Into State (in $ Millions)
$112.7
$22.7$6.5$15.6$2.1
$11.3
$42.5
$12
020406080
100120
CALIFORNIA ENERGY COMMISSIONdn
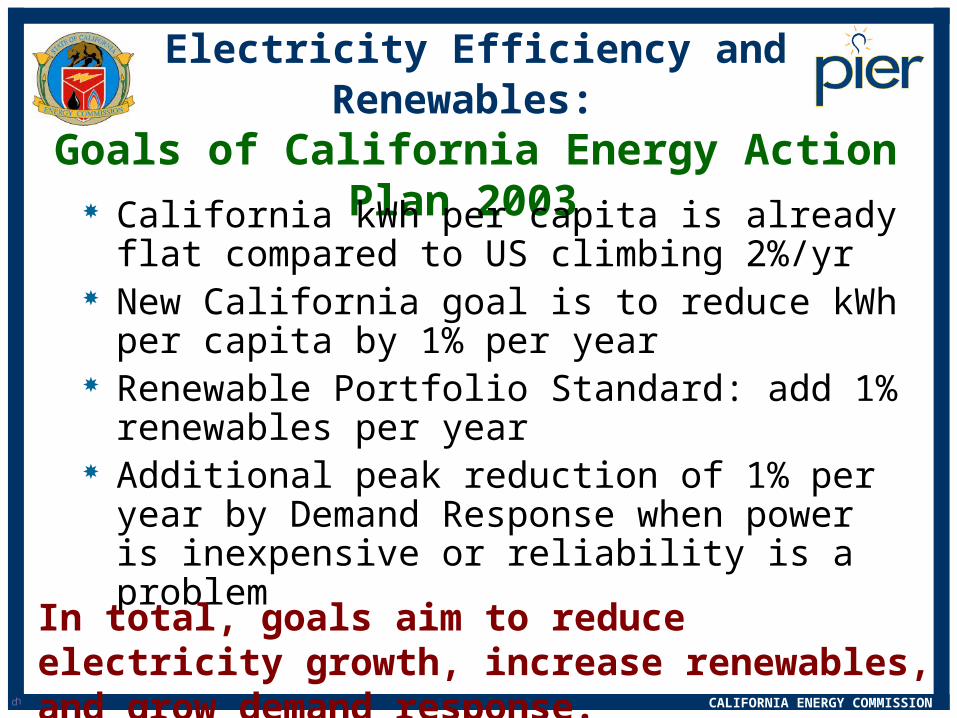
Electricity Efficiency and Renewables: Goals of California Energy Action Plan 2003
California kWh per capita is already flat compared to US climbing 2%/yr
New California goal is to reduce kWh per capita by 1% per year
Renewable Portfolio Standard: add 1% renewables per year
Additional peak reduction of 1% per year by Demand Response when power is inexpensive or reliability is a problem
In total, goals aim to reduce electricity growth, increase renewables, and grow demand response.

CALIFORNIA ENERGY COMMISSIONdn
20
30
40
50
60
70
80
90
100
110
1972 1976 1980 1984 1988 1992 1996 2000
Year
Ind
ex (
1972
= 1
00)
Effective Dates of National Standards
=
Effective Dates of State Standards
=
Refrigerators
Central A/C
Gas Furnaces
Impact of Standards on Efficiency of Three Appliances
75%
60%
25%
Source: S. Nadel, ACEEE, in ECEEE 2003 Summer Study, www.eceee.org

CALIFORNIA ENERGY COMMISSIONdn
(Sources: EIA and California Department of Finance)
-7.0%
-6.0%
-5.0%
-4.0%
-3.0%
-2.0%
-1.0%
0.0%
1.0%
19
81
19
82
19
83
19
84
19
85
19
86
19
87
19
88
19
89
19
90
19
91
19
92
19
93
19
94
19
95
19
96
19
97
19
98
19
99
20
00
Average = -1.0% -4.5% -3.9%
Annual Rate of Change in Energy/Gross State Product for California

CALIFORNIA ENERGY COMMISSIONdn
IEA (Energy/Purchasing Power Parity) and EIA (Energy/Market Exchange Rate)
-10%
-8%
-6%
-4%
-2%
0%
2%
19
81
19
82
19
83
19
84
19
85
19
86
19
87
19
88
19
89
19
90
19
91
19
92
19
93
19
94
19
95
19
96
19
97
19
98
19
99
20
00
20
01
IEA data EIA data
- 4.8% Average = - 5.0% - 5.3%
Annual Rate of Change in Energy/GDP for China

CALIFORNIA ENERGY COMMISSIONdn
Annual Rate of Change in Energy/GDP for the World
IEA (Energy/Purchasing Power Parity) and EIA (Energy/Market Exchange Rate)
-4%
-3%
-2%
-1%
0%
1%
2%
19
81
19
82
19
83
19
84
19
85
19
86
19
87
19
88
19
89
19
90
19
91
19
92
19
93
19
94
19
95
19
96
19
97
19
98
19
99
20
00
20
01
IEA data EIA data
note: Russia not included until 1992 in IEA data and 1993 in EIA data
- 1.3% - 1.3%Average = - 0.7%

CALIFORNIA ENERGY COMMISSIONdn
PIER Buildings Program HighlightsBerkeley Lamp
Model partnership between CEC/DOE/California utilities PIER funded Phase 1 to develop
task/ambient lamp concept DOE funded Phase 2 to develop specific
lamp configuration PIER was instrumental in moving
technology into the marketplace via coordination with utility Emerging Technology Coordinating Council
Project is both a technical success and a customer success

CALIFORNIA ENERGY COMMISSIONdn
Total Electricity Use, per capita, 1960 - 2001
0
2,000
4,000
6,000
8,000
10,000
12,000
14,0001
96
0
19
62
19
64
19
66
19
68
19
70
19
72
19
74
19
76
19
78
19
80
19
82
19
84
19
86
19
88
19
90
19
92
19
94
19
96
19
98
20
00
KW
h
12,000
8,000
7,000
California
U.S.
kWh

CALIFORNIA ENERGY COMMISSIONdn
PowerLight’s PowerGuard
PowerLight’s insulated 30 year roof system reduces building air
conditioning loads while it’s PV surface generates electricity during hot and
expensive peak summer hours
While California is known for its hot dry summers, that same solar resource provides a clean, safe and reliable way
to generate electricity

CALIFORNIA ENERGY COMMISSIONdn
The Yolo County Success
Accomplishments Is opening the way for landfill gas
electricity systems to be more widely used in California
• Accelerates gas production from over 30 years to less than 10 years, making landfill electricity more competitive
• Reduces volume of landfill which can extend landfill life by 20 percent
• Significantly reduces the chance for groundwater pollution from leachate release
Has become the leading bioreactor project within EPA’s XL Program and will strongly influence landfill regulations across the country
CEC’s Role Through the CEC’s R&D programs,
we’re bringing bioreactor technology from concept to reality
Control cell without bioreactor
Enhanced bioreactor cell

CALIFORNIA ENERGY COMMISSIONdn
Xonon Cool Combustion System - Catalytica Energy Systems, Inc.
Description: Gas turbine combustion system
that controls combustion temperature to prevent the formation of NOX
Benefits: Lower NOX emissions without
SCR Allows deployment of smaller
turbines for DG Expandable to large, central
station turbines Use with Kawasaki turbine

CALIFORNIA ENERGY COMMISSIONdn
President’s Commission on Critical Infrastructure Protection Highlights Vulnerabilities and Interdependencies
Electricity
TransportationWaterNatural Gas

CALIFORNIA ENERGY COMMISSIONdn
CEC/PIER is Already Providing a Stream of Products Consistent with
the California Energy Action Plan (CEAP)
Optimize efficiency,Reduce demand
Ensure power supply meet RPS
Upgrade T&D structure
Promote DG
Ensure reliablesupply of NG
CEAP Goal PIER Issue
Reduce per capitaenergy use
MEET RPS
T&D System must be reliable and congestion-free
Peak demand reduction Low emissions DGReliable, affordable DG
Meet marketplace needs
Products

CALIFORNIA ENERGY COMMISSIONdn
Successful Relationships Are Critical to Enhancement of Our Activities
Success in connecting with peers in DOE and other agencies Collaborative funding Enhanced CEC visibility: Making a difference on a national
level Maintaining ties with successful private sector firms
Stream of products to market Markets must include other states and countries
Tying our programs to other state activities and regulations Political strength of programs, i.e. ARB, ADF, DWR, SVMB Linkage of R&D to implementation: i.e. CEC Efficiency, CEC
Renewables, CEC energy Export Program

CALIFORNIA ENERGY COMMISSIONdn
Driving to a Sustainable Future:The “E”s are Linked
Environment Energy Economics Equity Education
Recommended