8/2/2019 By the Numbers: What Government Costs in North Carolina Cities and Counties FY 2010
http://slidepdf.com/reader/full/by-the-numbers-what-government-costs-in-north-carolina-cities-and-counties 1/46
By The NumBers
Wt Gvrnmnt Csts nNrt Crn Cts nd Cunt
FY 2010
MiChae l loWeY
Mrc 2012
O L I C Y R E P O R T

8/2/2019 By the Numbers: What Government Costs in North Carolina Cities and Counties FY 2010
http://slidepdf.com/reader/full/by-the-numbers-what-government-costs-in-north-carolina-cities-and-counties 2/46
By The NumbersWhat Government Costs in North Carolina Cities and Counties
FY 2010
MICHAEL LOWREY
March 2012
2 Foreword
3 Executive Summary
4 Introduction
6 Rankings o N.C. Counties by
Combined Local Tax & Fee Burden10 Rankings o N.C. Counties by
Combined Property Tax Burden
11 Appendix A: County-by-County Data
28 Appendix A Summary
30 Characteristics o N.C. Counties
32 Appendix B: Local Cost o Government by Municipality and Population
42 Appendix C: Utilities Provided by Municipalities withPopulations o 5,000+
43 Appendix D: AFIR Line Items Used in Analysis

8/2/2019 By the Numbers: What Government Costs in North Carolina Cities and Counties FY 2010
http://slidepdf.com/reader/full/by-the-numbers-what-government-costs-in-north-carolina-cities-and-counties 3/46
2
j o h n l o c k e f o u n d a t i o n
by the numbers | FOReWORD
The economic recession that hit ull orce in 2008 was declared ocially over in June 2009 when
the country experienced two quarters o very slow growth. But a troubled housing sector and a still-sluggish
economy with high unemployment have contributed to the scal crises acing many cities and counties in
North Carolina. As always, this edition o By the Numbers (BTN) is must reading or government ocials
and taxpayers alike. It highlights what kinds o scal problems ace local governments in an economy tha
grows only very slowly. With the acts given here, county commissioners and city council members can
easily compare their area’s tax burden to similarly situated cities or counties. For taxpayers, BTN is a starting
point or questions about taxes and spending, enabling them to hold their elected and appointed ocials
accountable. This year, as in previous years, policy analyst Michael Lowrey continues the meticulous data
collection and reporting that make BTN an essential touchstone or discussions o city and county nance
in North Carolina.
As always, readers should consider the numbers presented here in context. Cities and counties dier
in many ways, making cross-comparisons tricky. For example, not all cities provide solid waste service,recreation acilities, or convention centers. In addition, property tax revenue bases dier. Some coastal and
mountain cities and counties have large numbers o part-time residents with seasonal homes; they are not
counted in the population gures, but they still pay property taxes. The dierences matter, so we recom-
mend that readers make comparisons with cities and counties with similar demographics.
There is no doubt that the recession has reduced local revenues. Its impact continues to be refected
in the period covered in this report, Fiscal Year 2010. The median county revenue per capita was down
slightly rom an infation-adjusted $1,304 to $1,242 per capita. That gure represents a signicant burden
or a amily o our o $4,970, especially given the high levels o state and ederal taxation and still-elevated
unemployment levels.
The John Locke Foundation urges local government ocials and taxpayers to continue to ask key questions: What is the proper role o local government? What are essential services, and what are unnecessary
rills? North Carolina’s amilies must ace those kinds o questions every day in determining what are the
essential expenses and unnecessary rills or their own households. Most people would probably agree tha
local government’s core services are re, police, and sanitation. But would they agree that core services also
include taxpayers’ subsidies to gol courses, convention centers, whitewater parks, and even restaurants?
Especially in times o economic recession, these questions become even more important. While BTN does
not answer these questions, it provides a baseline or discussing them. We at the John Locke Foundation
believe that a lively public debate is healthy, and we are glad to provide this report to help oster and
inorm that debate.
Dr. Michael Sanera
Director o Research and Local Government Studies
John Locke Foundation
fw

8/2/2019 By the Numbers: What Government Costs in North Carolina Cities and Counties FY 2010
http://slidepdf.com/reader/full/by-the-numbers-what-government-costs-in-north-carolina-cities-and-counties 4/46
3
p o l i c y r e p o r t
exv s
Counties and towns are critical levels o gov-
ernment in North Carolina, providing or admin-
istering many services while taking in billions o
dollars o revenue. This is especially true as the
state government has increasingly shited more
taxing authority to localities to make up or money
kept by the state. While the importance o county and
municipal government is great, obtaining compara-
tive data is dicult. To help address this problem,
By The Numbers provides inormation on how
much local government costs in every city and
county in North Carolina.
Methodology Using the most recent data available on prop-
erty taxes, sales taxes, and miscellaneous taxes and
ees rom the State Treasurer’s Annual Financial
Inormation Report (AFIR), this report calculated
county and municipal tax and ee burdens in two
ways: 1) as a percentage o income (or counties),
and 2) per capita (or counties and municipalities).
We then constructed a set o rankings to view the
cost o local government more clearly.
Although this analysis is by no means denitive,it gives citizens more useul inormation or grap-
pling with this complicated issue.
Findings North Carolina collected $21 billion in state tax
and ee revenues or Fiscal Year 2010 (rom July
1, 2009 to June 30, 2010), the latest year or which
data are available. This represented 6.4 percent o
the personal income o the state’s citizens. In addi-
tion, local governments collected an additional
$14.8 billion in property, sales, and other taxes andees, representing another 4.5 percent o personal
income. Combined, they represent a state and local
tax and ee burden o 10.9 percent. Federal collec-
tions raise the total tax burden on North Carolinians
to approximately 28.9 percent o personal income,
on average.
Nominal (non–infation adjusted) local govern-
ment revenues were essentially the same in FY 2010
as compared with the previous year. This is not to
say that all revenue sources were essential fat. Sales
revenues were down some $300 million, which was
made up mainly by additional property tax receipts.
This continues the pattern seen since the onset o
the Great Recession, which has seen property tax
receipts increase by over $1.25 billion per year while
sales tax revenues have dropped by some $700 mil-
lion a year since FY 2007.
Local tax and ee collections per-capita stood
at $1,242.47 in the median county in FY 2010,
compared with an infation-adjusted $1,320.98 the
year previous. That amounts to 4.08 percent o per-
capita personal income in the median county, down
rom 2009 when it was 4.33 percent o per-capita
personal income.
The impact o the Great Recession was not elt
equally throughout North Carolina however. In
the median county in the state, nominal per-capita
personal income actually was up slightly rom 2008
to 2009 ($30,427 to $30,494). The state’s major
urban areas — and Mecklenburg County in particular
— saw sharp declines in per-capita personal income,
resulting in an $800 drop in PCPI statewide. As a result, the statewide local tax burden remained the
same at 4.52 percent o personal income in both FY
2010 as in 2009.
It is important to note that incomes vary among
counties and within counties over time, and this
can aect the rankings. Counties o similar size and
tax collections can vary in their burden because
o dierences in per-capita incomes. Dierences
among counties can also refect the rate and extent
o annexation, which places more taxpayers onto
municipal tax rolls.Furthermore, data in this report are subject to
other reporting issues, which include revisions o
per-capita personal income estimates and localities
ling their required AFIR reports in an untimely
manner. For that reason, the gures or previous
years in this edition o By The Numbers may not
exactly match those reported in previous editions. As
such, the current edition’s gures take precedence.
by the numbers | eXeCUTIVe SUMMARY

8/2/2019 By the Numbers: What Government Costs in North Carolina Cities and Counties FY 2010
http://slidepdf.com/reader/full/by-the-numbers-what-government-costs-in-north-carolina-cities-and-counties 5/46
4
j o h n l o c k e f o u n d a t i o n
The nances o North Carolina’s counties and
municipalities remain a critical public-policy issue.
The state’s persistent budgetary diculties continueto place a heavy burden on local governments and,
by extension, local taxpayers. At the same time,
the current recession has impacted the amount o
revenues localities receive rom sales taxes and sec-
ondary revenues sources. While local governments
did obtain more revenue rom property taxes in FY
2010 than they had previously, continuing real estate
market corrections are likely to limit the ability o
many localities to obtain additional revenue rom
this source.
Calculating burdens
Local governments in North Carolina are
required to le audited nancial statements with
the Department o State Treasurer each year. By
The Numbers (BTN) builds upon this inormation,
which is available online at www.nctreasurer.com/
DSTHome/StateAndLocalGov/AuditingAndReporting/
AFIR.htm.
BTN examines property taxes, sales taxes, and
total local government collections o all taxes and
ees or counties and municipalities or FY 2010, the
latest year or which data are available. For each o
the three categories, a revenue-per-capita gure was
computed. Countywide gures were also calculated
as a percentage o per-capita personal income. The
specic line-item codes used or each category are
listed in Appendix D (page 43).
The amount that the average citizen in each
North Carolina county pays or local government,
county and municipal, is presented as a dollar
amount and a percentage o income on pages 6
though 10.
Appendix A (pages 11-31) ocuses on counties
by themselves, including data on property taxes,
sales taxes, and total county collections, both per
capita and as a percentage o per-capita personal
income. Counties are also ranked against each other.
Summary data (page 28) and a list o municipalities
in each county can also be ound in Appendix A.
Appendix B (page 32-41) presents combined
municipal and county tax burdens. Municipalities are
sorted by population and ranked in our population
ranges (under 1,000; 1,000–4,999; 5,000–24,999; and25,000 and over). Appendix B also gives data on prop
erty, sales, and total local tax and ee collections.
Appendix C (page 42) indicates whether munici
palities with populations o 5,000 and above operate
water and sewer systems or operate electrical systems
or sell natural gas.
Readers will immediately notice the relatively
high per-capita property taxes in many resort com
munities in North Carolina. Given the nature o
the data, that is not surprising. Second homes and
resorts certainly do appear on local tax registers
Because owners or renters only rarely live in these
dwellings year-round, however, such localities typi
cally have small permanent populations. High tax
values divided by a small permanent population wil
produce a high per-capita tax burden. Thereore
these numbers are not necessarily comparable to
other tax-burden statistics.
A common comment about BTN is that it neces
sarily categorizes communities with higher sales-tax
revenues as being high-tax communities. While
sales-tax revenues are (largely) what they are, locali
ties retain the discretion to determine their overal
revenues by altering their property-tax rates and
the other taxes and ees they collect. Thus higher
sales-tax revenues allow a community to lower its
property-tax rates, provide more services, or both.
While BTN shows the cost o local government
it does not attempt to measure the quantity or quality
o services provided in exchange or those dollars
Nor does the report consider the additional out-o
pocket costs to individuals or services that their
local government may not provide. In unincorpo
rated areas, or example, homeowners may have to
contract privately or garbage pickup, while those
living in a town or city may well receive this service
paid or through their municipal property and other
taxes. Municipalities may also use some o their tax
dollars to provide a higher quality o re protection
which may translate into lower homeowners insur
ance rates.
by the numbers | INTRODUCTION
i: Local Fiscal Policy Is a Statewide Issue

8/2/2019 By the Numbers: What Government Costs in North Carolina Cities and Counties FY 2010
http://slidepdf.com/reader/full/by-the-numbers-what-government-costs-in-north-carolina-cities-and-counties 6/46
p o l i c y r e p o r t
Importantly, this means that whether a jurisdic-
tion is ranked high or low in cost o government is
not the end o the debate over scal policy—
it ismerely the beginning. Citizens o North Carolina’s
cities and counties must decide whether the services
they receive are worth the price they and their ellow
taxpayers (residential and business) are paying in
local taxes and ees.
For comparison, we have included a ull set o
results or counties and rankings or municipalities
or FY 2010. To make air comparisons, gures or
earlier scal years have been adjusted or infation.
Readers may obtain actual collections in FY 2009 by
multiplying the listing by .9878. For FY 2008 partial
results are included; the corresponding multiplier
to adjust or infation is 1.0049.
Local tax burden down Based upon data available in February 2012,
the typical resident o the median county in North
Carolina paid $1,242 in taxes and ees to county
and municipal governments during FY 2010. This
accounted or 4.08 percent o personal income.
Collections in FY 2009 were an infation-adjusted
$1,321 per capita.
The average North Carolinian actually pays
more, though, than the typical resident o the median
county. Many o the state’s more populous counties
also have above-average local tax and ee burdens;
when that dynamic is actored in, a state average
would amount to 4.52 percent o personal income.
Unortunately, two counties — Hoke and
Sampson — and 53 municipalities did not le their
AFIR reports in a timely manner and thus are not
included. Harnett County provied only some o the
data the state requires. Complete reporting would
result in a somewhat higher combined city/county
median tax burden.
Combined city/county taxes Dare County residents paid the highest amount
in taxes and ees to local government ($3,926 per
capita). The counties o Mecklenburg ($2,460),
Currituck ($2,398), Orange ($2,219), and Durham
($2,156) also ranked in the top ve in revenue col-
lected per capita.
Residents in the counties o Caswell ($770),Greene ($801), Gates ($814), ($817), Alexander
($857), and Yancey ($857) paid the lowest average
amounts in taxes and ees to local governments.
Looking at the local tax burden as a percentage
o personal income yielded somewhat dierent
results. Dare County again lead the way with county
and municipal revenue accounting or 10.46 percent
o per-capita personal income. Second through th
were the counties o Hyde (7.23 percent o per-
capita personal income, Brunswick (6.90 percent),
Currituck (6.74 percent), and Mecklenburg (5.77
percent).
By comparison, taxes and ees collected by
local governments accounted or 2.47 percent o
per-capita personal income in Onslow County.
Next lowest were Caswell and Jones counties at
2.58 percent and 2.87 percent o per-capita personal
income respectively. In 42 counties, total collec-
tions were at our percent o per-capita personal
income or less.
Among the 35 cities with populations over
25,000, Charlotte again had the highest combined
city/county tax and ee collections per capita. Chapel
Hill, Wilmington, Asheville, and Mooresville were
also in the top ve. The lowest per-capita collections
were in Jacksonville, ollowed by Thomasville,
Indian Trail, Asheboro, and Goldsboro.
by the numbers | INTRODUCTION
FISCAL MEDIAN AVERAGE STATEWIDEYEAR COUNTY COUNTY AVERAGE
2008 4.49% 4.8% 4.76%
2009 4.30% 4.3% 4.2%
2010 4.08% 4.26% 4.2%
l tx b f y

8/2/2019 By the Numbers: What Government Costs in North Carolina Cities and Counties FY 2010
http://slidepdf.com/reader/full/by-the-numbers-what-government-costs-in-north-carolina-cities-and-counties 7/46
6
j o h n l o c k e f o u n d a t i o n
2010 combined 2010 2009 combined 2009 % change 2008 combined 2008county local burden rank local burden rank 2009–2010 local burden rank
N.C.Median $1,242.47 — $1,320.98 — -4.27% $1,323.78 —
higher burden — upper Quartile
Dar $3,926.10 1 $4,094.21 1 -4.11% $4,129.04 1
Mclnburg $2,459.99 2 $2,510.68 2 -2.02% $2,673.81 2
Currituc $2,397.81 3 $2,394.76 3 0.13% $2,385.93 4
Orang $2,219.26 4 $2,219.83 5 -0.03% $2,154.66 6
Durham $2,156.48 5 $2,158.43 6 -0.09% $2,170.34 5
Brunswic $2,154.36 6 $2,313.64 4 -6.88% $2,406.78 3
Hyd $2,050.55 7 $2,116.05 7 -3.10% $2,130.44 8
Guilord $1,941.44 8 $2,005.07 8 -3.17% $1,997.70 10
Wa $1,887.83 9 $1,971.81 9 -4.26% $1,952.18 11
Cabarrus $1,850.18 10 $1,885.55 11 -1.88% $1,818.59 14
Cartrt $1,844.37 11 $1,899.85 10 -2.92% $1,950.31 12
Nw Hanovr $1,836.03 12 $1,862.32 12 -1.41% $2,154.15 7
Watauga $1,827.65 13 $1,606.59 18 13.76% $1,856.25 13
Forsyth $1,795.21 14 $1,714.60 15 4.70% $1,799.01 15
Wilson $1,793.46 15 $1,796.11 13 -0.15% $1,687.10 17
Pitt $1,760.94 16 $1,583.27 20 11.22% $1,462.31 32
Buncomb $1,666.52 17 $1,722.42 14 -3.25% $1,752.68 16
Moor $1,594.53 18 $1,649.57 17 -3.34% $1,657.98 18
Macon $1,557.45 19 $1,601.35 19 -2.74% $1,574.04 23
Chowan $1,543.31 20 $1,541.24 25 0.13% $1,524.45 28
edgcomb $1,510.82 21 $1,467.08 33 2.98% $1,432.98 38
Transylvania $1,509.70 22 $1,543.49 24 -2.19% $1,581.99 20
Union $1,497.85 23 $1,561.36 21 -4.07% $1,567.14 24
Chatham $1,495.19 24 $1,558.31 22 -4.05% $1,556.40 26
aVerage burden — second and third Quartiles
L $1,488.34 25 $1,556.89 23 -4.40% $1,566.74 25
Cumbrland $1,483.16 26 $1,409.36 38 5.24% $1,391.96 41
Catawba $1,474.01 27 $1,527.78 28 -3.52% $1,575.85 21
Gaston $1,462.72 28 $1,536.70 26 -4.81% $1,535.94 27
Irdll $1,430.51 29 $1,525.78 29 -6.24% $1,585.87 19
Haywood $1,425.59 30 $1,467.18 32 -2.83% $1,457.15 33
Pol $1,424.02 31 $1,677.60 16 -15.12% $1,440.83 36
Nash $1,417.71 32 $1,320.69 50 7.35% $1,366.99 44
Cravn $1,412.10 33 $1,470.55 31 -3.97% $1,463.35 31
Tyrrll $1,401.53 34 $1,444.06 34 -2.95% $1,479.23 30
Alamanc $1,384.55 35 $1,436.71 35 -3.63% $1,484.04 29
Pasquotan $1,379.04 36 $1,500.83 30 -8.11% $1,388.08 42
Warrn $1,367.48 37 $1,310.46 55 4.35% $1,275.51 57
Avry $1,359.61 38 $1,535.83 27 -11.47% $1,575.72 22
Bladn $1,359.20 39 $1,400.09 40 -2.92% $2,106.50 9
Lnoir $1,358.22 40 $1,344.73 46 1.00% $1,328.30 49
Vanc $1,356.05 41 $1,409.11 39 -3.77% $1,405.90 40
Northampton $1,343.82 42 $1,383.56 43 -2.87% $1,438.50 37
Lincoln $1,335.46 43 $1,395.17 41 -4.28% $1,354.14 46
Bauort $1,292.33 44 $1,414.99 37 -8.67% $1,415.47 39
Martin $1,284.06 45 $1,333.71 47 -3.72% $1,281.46 54
Johnston $1,282.18 46 $1,367.50 44 -6.24% $1,448.27 34
Stanly $1,268.86 47 $1,331.75 48 -4.72% $1,276.80 55
Rowan $1,262.11 48 $1,321.26 49 -4.48% $1,341.32 48
r n.c. c c l tx & f b p p
by the numbers | RANkINGS OF N.C. COUNTIeS BY COMBINeD LOCAL TAX & Fee BURDeN
8/2/2019 By the Numbers: What Government Costs in North Carolina Cities and Counties FY 2010
http://slidepdf.com/reader/full/by-the-numbers-what-government-costs-in-north-carolina-cities-and-counties 8/46
7
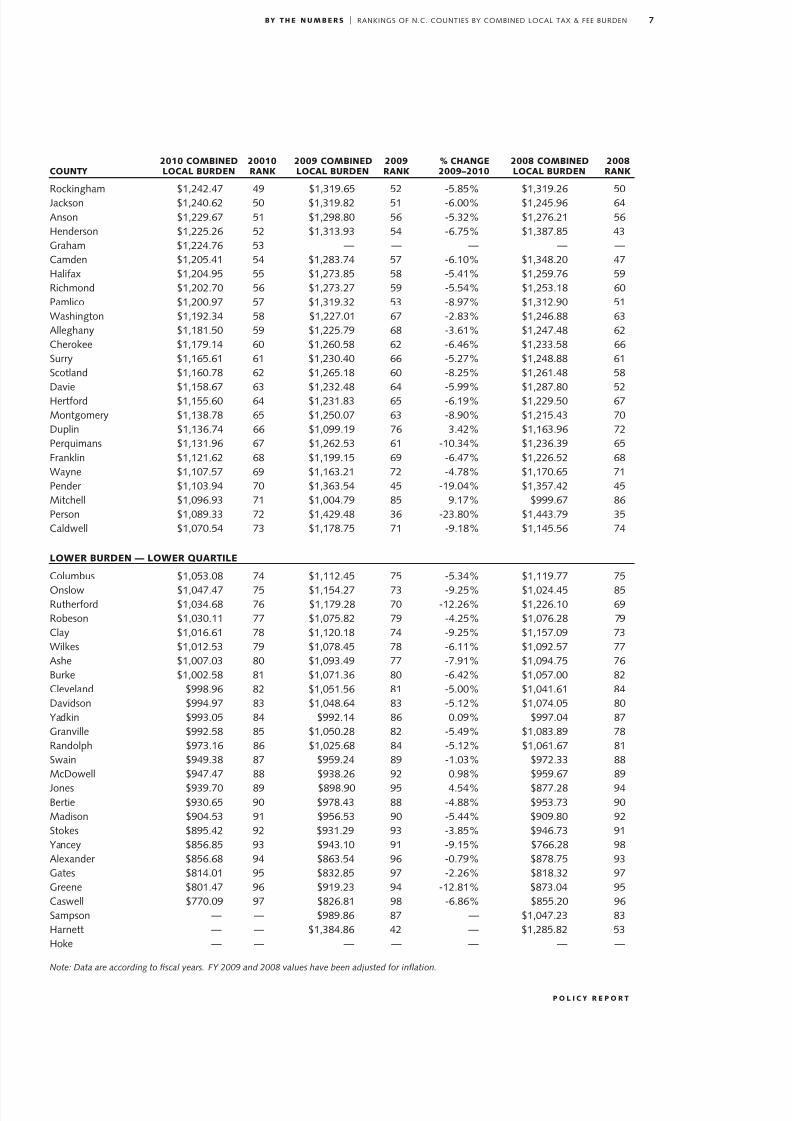
p o l i c y r e p o r t
2010 combined 20010 2009 combined 2009 % change 2008 combined 2008county local burden rank local burden rank 2009–2010 local burden rank
Rocingham $1,242.47 49 $1,319.65 52 -5.85% $1,319.26 50
Jacson $1,240.62 50 $1,319.82 51 -6.00% $1,245.96 64
Anson $1,229.67 51 $1,298.80 56 -5.32% $1,276.21 56
Hndrson $1,225.26 52 $1,313.93 54 -6.75% $1,387.85 43
Graham $1,224.76 53 — — — — —
Camdn $1,205.41 54 $1,283.74 57 -6.10% $1,348.20 47
Haliax $1,204.95 55 $1,273.85 58 -5.41% $1,259.76 59
Richmond $1,202.70 56 $1,273.27 59 -5.54% $1,253.18 60
Pamlico $1,200.97 57 $1,319.32 53 -8.97% $1,312.90 51
Washington $1,192.34 58 $1,227.01 67 -2.83% $1,246.88 63
Allghany $1,181.50 59 $1,225.79 68 -3.61% $1,247.48 62
Chro $1,179.14 60 $1,260.58 62 -6.46% $1,233.58 66
Surry $1,165.61 61 $1,230.40 66 -5.27% $1,248.88 61
Scotland $1,160.78 62 $1,265.18 60 -8.25% $1,261.48 58
Davi $1,158.67 63 $1,232.48 64 -5.99% $1,287.80 52Hrtord $1,155.60 64 $1,231.83 65 -6.19% $1,229.50 67
Montgomry $1,138.78 65 $1,250.07 63 -8.90% $1,215.43 70
Duplin $1,136.74 66 $1,099.19 76 3.42% $1,163.96 72
Prquimans $1,131.96 67 $1,262.53 61 -10.34% $1,236.39 65
Franlin $1,121.62 68 $1,199.15 69 -6.47% $1,226.52 68
Wayn $1,107.57 69 $1,163.21 72 -4.78% $1,170.65 71
Pndr $1,103.94 70 $1,363.54 45 -19.04% $1,357.42 45
Mitchll $1,096.93 71 $1,004.79 85 9.17% $999.67 86
Prson $1,089.33 72 $1,429.48 36 -23.80% $1,443.79 35
Caldwll $1,070.54 73 $1,178.75 71 -9.18% $1,145.56 74
loWer burden — loWer Quartile
Columbus $1,053.08 74 $1,112.45 75 -5.34% $1,119.77 75
Onslow $1,047.47 75 $1,154.27 73 -9.25% $1,024.45 85Ruthrord $1,034.68 76 $1,179.28 70 -12.26% $1,226.10 69
Robson $1,030.11 77 $1,075.82 79 -4.25% $1,076.28 79
Clay $1,016.61 78 $1,120.18 74 -9.25% $1,157.09 73
Wils $1,012.53 79 $1,078.45 78 -6.11% $1,092.57 77
Ash $1,007.03 80 $1,093.49 77 -7.91% $1,094.75 76
Bur $1,002.58 81 $1,071.36 80 -6.42% $1,057.00 82
Clvland $998.96 82 $1,051.56 81 -5.00% $1,041.61 84
Davidson $994.97 83 $1,048.64 83 -5.12% $1,074.05 80
Yadin $993.05 84 $992.14 86 0.09% $997.04 87
Granvill $992.58 85 $1,050.28 82 -5.49% $1,083.89 78
Randolph $973.16 86 $1,025.68 84 -5.12% $1,061.67 81
Swain $949.38 87 $959.24 89 -1.03% $972.33 88
McDowll $947.47 88 $938.26 92 0.98% $959.67 89
Jons $939.70 89 $898.90 95 4.54% $877.28 94Brti $930.65 90 $978.43 88 -4.88% $953.73 90
Madison $904.53 91 $956.53 90 -5.44% $909.80 92
Stos $895.42 92 $931.29 93 -3.85% $946.73 91
Yancy $856.85 93 $943.10 91 -9.15% $766.28 98
Alxandr $856.68 94 $863.54 96 -0.79% $878.75 93
Gats $814.01 95 $832.85 97 -2.26% $818.32 97
Grn $801.47 96 $919.23 94 -12.81% $873.04 95
Caswll $770.09 97 $826.81 98 -6.86% $855.20 96
Sampson — — $989.86 87 — $1,047.23 83
Harntt — — $1,384.86 42 — $1,285.82 53
Ho — — — — — — —
Note: Data are according to scal years. FY 2009 and 2008 values have been adjusted or infation.
by the numbers | RANkINGS OF N.C. COUNTIeS BY COMBINeD LOCAL TAX & Fee BURDeN
8/2/2019 By the Numbers: What Government Costs in North Carolina Cities and Counties FY 2010
http://slidepdf.com/reader/full/by-the-numbers-what-government-costs-in-north-carolina-cities-and-counties 9/46
8
j o h n l o c k e f o u n d a t i o n
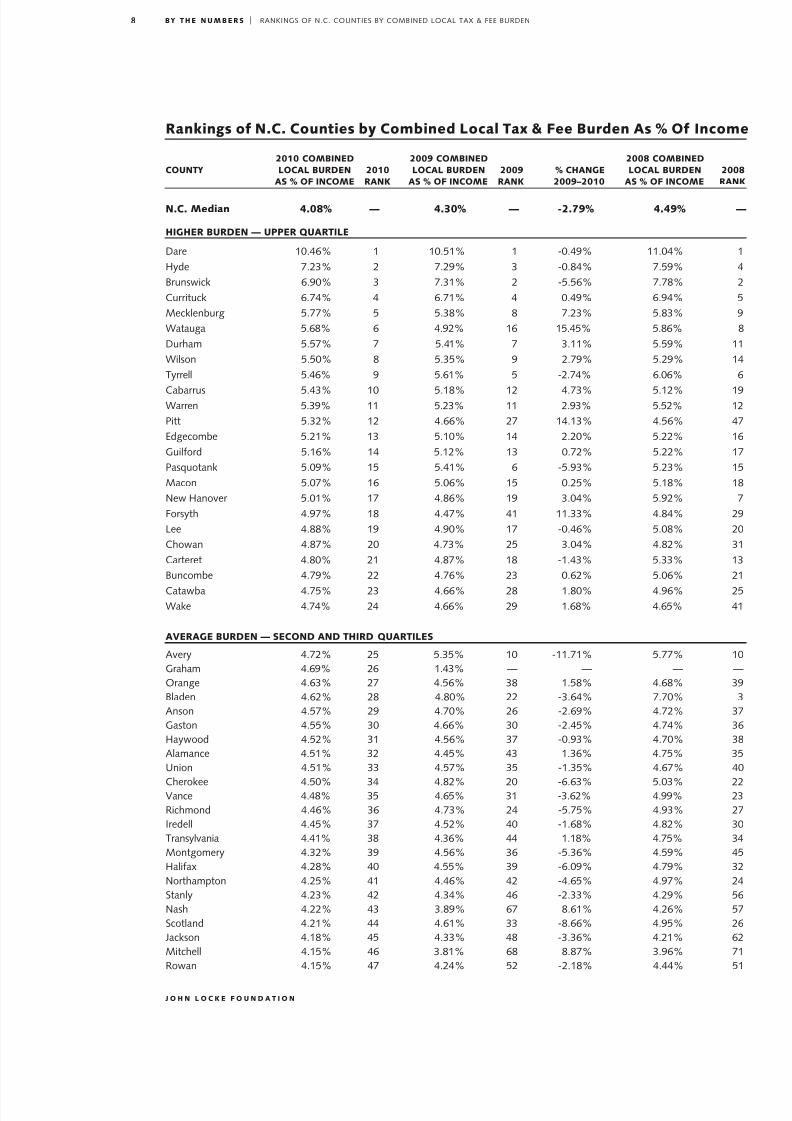
r n.c. c c l tx & f b a % o i
2010 combined 2009 combined 2008 combinedcounty local burden 2010 local burden 2009 % change local burden 2008
as % of income rank as % of income rank 2009–2010 as % of income rank
n.c. m 4.08% — 4.30% — -2.79% 4.49% —
higher burden — upper Quartile
Dar 10.46% 1 10.51% 1 -0.49% 11.04% 1
Hyd 7.23% 2 7.29% 3 -0.84% 7.59% 4
Brunswic 6.90% 3 7.31% 2 -5.56% 7.78% 2
Currituc 6.74% 4 6.71% 4 0.49% 6.94% 5
Mclnburg 5.77% 5 5.38% 8 7.23% 5.83% 9
Watauga 5.68% 6 4.92% 16 15.45% 5.86% 8
Durham 5.57% 7 5.41% 7 3.11% 5.59% 11
Wilson 5.50% 8 5.35% 9 2.79% 5.29% 14
Tyrrll 5.46% 9 5.61% 5 -2.74% 6.06% 6
Cabarrus 5.43% 10 5.18% 12 4.73% 5.12% 19Warrn 5.39% 11 5.23% 11 2.93% 5.52% 12
Pitt 5.32% 12 4.66% 27 14.13% 4.56% 47
edgcomb 5.21% 13 5.10% 14 2.20% 5.22% 16
Guilord 5.16% 14 5.12% 13 0.72% 5.22% 17
Pasquotan 5.09% 15 5.41% 6 -5.93% 5.23% 15
Macon 5.07% 16 5.06% 15 0.25% 5.18% 18
Nw Hanovr 5.01% 17 4.86% 19 3.04% 5.92% 7
Forsyth 4.97% 18 4.47% 41 11.33% 4.84% 29
L 4.88% 19 4.90% 17 -0.46% 5.08% 20
Chowan 4.87% 20 4.73% 25 3.04% 4.82% 31
Cartrt 4.80% 21 4.87% 18 -1.43% 5.33% 13
Buncomb 4.79% 22 4.76% 23 0.62% 5.06% 21
Catawba 4.75% 23 4.66% 28 1.80% 4.96% 25Wa 4.74% 24 4.66% 29 1.68% 4.65% 41
aVerage burden — second and third Quartiles
Avry 4.72% 25 5.35% 10 -11.71% 5.77% 10
Graham 4.69% 26 1.43% — — — —
Orang 4.63% 27 4.56% 38 1.58% 4.68% 39
Bladn 4.62% 28 4.80% 22 -3.64% 7.70% 3
Anson 4.57% 29 4.70% 26 -2.69% 4.72% 37
Gaston 4.55% 30 4.66% 30 -2.45% 4.74% 36
Haywood 4.52% 31 4.56% 37 -0.93% 4.70% 38
Alamanc 4.51% 32 4.45% 43 1.36% 4.75% 35
Union 4.51% 33 4.57% 35 -1.35% 4.67% 40
Chro 4.50% 34 4.82% 20 -6.63% 5.03% 22Vanc 4.48% 35 4.65% 31 -3.62% 4.99% 23
Richmond 4.46% 36 4.73% 24 -5.75% 4.93% 27
Irdll 4.45% 37 4.52% 40 -1.68% 4.82% 30
Transylvania 4.41% 38 4.36% 44 1.18% 4.75% 34
Montgomry 4.32% 39 4.56% 36 -5.36% 4.59% 45
Haliax 4.28% 40 4.55% 39 -6.09% 4.79% 32
Northampton 4.25% 41 4.46% 42 -4.65% 4.97% 24
Stanly 4.23% 42 4.34% 46 -2.33% 4.29% 56
Nash 4.22% 43 3.89% 67 8.61% 4.26% 57
Scotland 4.21% 44 4.61% 33 -8.66% 4.95% 26
Jacson 4.18% 45 4.33% 48 -3.36% 4.21% 62
Mitchll 4.15% 46 3.81% 68 8.87% 3.96% 71
Rowan 4.15% 47 4.24% 52 -2.18% 4.44% 51
by the numbers | RANkINGS OF N.C. COUNTIeS BY COMBINeD LOCAL TAX & Fee BURDeN

8/2/2019 By the Numbers: What Government Costs in North Carolina Cities and Counties FY 2010
http://slidepdf.com/reader/full/by-the-numbers-what-government-costs-in-north-carolina-cities-and-counties 10/46
9
p o l i c y r e p o r t
2010 combined 2009 combined 2008 combined
county local burden 2010 local burden 2009 % change local burden 2008
as % of income rank as % of income rank 2009–2010 as % of income rank
Moor 4.14% 48 4.11% 58 0.69% 4.31% 55
Rocingham 4.08% 49 4.29% 50 -4.92% 4.54% 48
Johnston 4.07% 50 4.15% 55 -1.77% 4.48% 50
Lnoir 4.06% 51 4.02% 63 0.81% 4.23% 59
Robson 4.04% 52 4.19% 54 -3.54% 4.51% 49
Martin 4.03% 53 4.26% 51 -5.37% 4.40% 54
Hrtord 4.03% 54 4.36% 45 -7.59% 4.63% 42
Allghany 4.03% 55 4.15% 56 -2.82% 4.41% 53
Lincoln 4.00% 56 4.12% 58 -3.00% 4.22% 61
Bauort 3.97% 57 4.33% 47 -8.36% 4.57% 46
Washington 3.91% 58 4.10% 60 -4.69% 4.43% 52
Duplin 3.90% 59 3.76% 70 3.58% 4.22% 60
Ruthrord 3.86% 60 4.30% 49 -10.33% 4.59% 44
Franlin 3.84% 61 4.03% 61 -4.78% 4.16% 66Cravn 3.84% 62 3.98% 64 -3.62% 4.19% 64
Caldwll 3.83% 63 4.13% 57 -7.37% 4.15% 67
Surry 3.82% 64 3.98% 65 -3.95% 4.25% 58
Prquimans 3.77% 65 4.21% 53 -10.44% 4.20% 63
Pndr 3.74% 66 4.57% 34 -18.16% 4.78% 33
McDowll 3.67% 67 3.59% 76 2.26% 3.85% 75
Clay 3.62% 68 3.95% 66 -8.46% 4.18% 65
Pol 3.59% 69 4.03% 62 -10.89% 3.62% 81
Granvill 3.57% 70 3.70% 73 -3.71% 4.03% 68
Cumbrland 3.56% 71 3.39% 87 5.12% 3.67% 80
Prson 3.55% 72 4.63% 32 -23.34% 4.90% 28
Columbus 3.53% 73 3.70% 72 -4.69% 3.97% 70
loWer burden — loWer QuartileWayn 3.50% 74 3.62% 74 -3.53% 3.86% 73
Chatham 3.49% 75 3.54% 79 -1.52% 3.57% 84
Ash 3.47% 76 3.71% 71 -6.44% 3.85% 74
Yancy 3.45% 77 3.77% 69 -8.44% 3.22% 94
Camdn 3.41% 78 3.60% 75 -5.24% 4.03% 69
Randolph 3.39% 79 3.50% 81 -3.29% 3.74% 78
Bur 3.37% 80 3.54% 78 -4.78% 3.60% 82
Hndrson 3.37% 81 3.51% 80 -3.91% 3.91% 72
Clvland 3.36% 82 3.45% 83 -2.43% 3.60% 83
Swain 3.34% 83 3.44% 84 -2.77% 3.70% 79
Pamlico 3.30% 84 3.59% 77 -7.96% 3.76% 77
Yadin 3.30% 85 3.26% 91 1.18% 3.43% 89
Madison 3.25% 86 3.40% 85 -4.50% 3.39% 91
Davi 3.24% 87 3.33% 89 -2.90% 3.57% 85Wils 3.23% 88 3.40% 86 -5.00% 3.53% 86
Davidson 3.08% 89 3.20% 92 -3.57% 3.44% 88
Gats 3.05% 90 3.13% 93 -2.77% 3.27% 93
Grn 3.02% 91 3.46% 82 -12.74% 3.41% 90
Brti 3.02% 92 3.31% 90 -8.68% 3.47% 87
Stos 3.01% 93 3.09% 94 -2.54% 3.31% 92
Alxandr 2.96% 94 2.88% 95 2.82% 2.98% 96
Jons 2.87% 95 2.81% 97 2.34% 2.92% 97
Caswll 2.58% 96 2.73% 98 -5.51% 3.04% 95
Onslow 2.47% 97 2.83% 96 -12.87% 2.79% 98
Harntt — — 4.81% 21 — 4.61% 43
Ho — — — — — — —
Sampson — — 3.38% 88 — 3.81% 76
by the numbers | RANkINGS OF N.C. COUNTIeS BY COMBINeD LOCAL TAX & Fee BURDeN

8/2/2019 By the Numbers: What Government Costs in North Carolina Cities and Counties FY 2010
http://slidepdf.com/reader/full/by-the-numbers-what-government-costs-in-north-carolina-cities-and-counties 11/46
10
j o h n l o c k e f o u n d a t i o n
r n.c. c c p tx b
c o u n
t y
c o m
b i n e d
p r o p
e r t y
t a X
b u r d
e n a s %
o f i n
c o m e
r a n k
c o m
b i n e d
p r o p
e r t y
t a X
b u r d
e n p e r
c a p i
t a
r a
n.c. m 2.27% — $691.17 —
Dar 5.24% 1 $1,965.89 1
Brunswic 3.82% 2 $1,192.99 5
Hyd 3.74% 3 $1,059.64 13
Watauga 3.36% 4 $1,080.98 12
Cabarrus 3.35% 5 $1,140.40 8
Mclnburg 3.33% 6 $1,420.87 2
Avry 3.31% 7 $954.64 19
Durham 3.30% 8 $1,276.13 4
Warrn 3.26% 9 $826.29 31
Currituc 3.23% 10 $1,148.91 6
Tyrrll 3.05% 11 $784.68 35
Guilord 3.04% 12 $1,144.47 7
Nw Hanovr 3.04% 13 $1,113.92 9
Orang 2.96% 14 $1,418.37 3
Macon 2.92% 15 $897.17 22
Union 2.88% 16 $957.03 17
Jacson 2.88% 17 $854.22 28
Cartrt 2.86% 18 $1,097.94 10
L 2.83% 19 $864.48 26
Transylvania 2.82% 20 $964.98 15
Pitt 2.81% 21 $930.66 20
Irdll 2.79% 22 $896.24 23
Buncomb 2.77% 23 $962.10 16
Forsyth 2.75% 24 $992.80 14Wa 2.75% 25 $1,094.45 11
Yancy 2.72% 26 $675.78 53
Haywood 2.72% 27 $859.09 27
Wilson 2.68% 28 $874.56 25
Gaston 2.61% 29 $839.35 30
Chro 2.58% 30 $674.77 54
edgcomb 2.51% 31 $728.11 41
Chowan 2.51% 32 $795.75 34
Catawba 2.49% 33 $772.59 37
Pndr 2.48% 34 $733.10 40
Northampton 2.47% 35 $781.88 36
Graham 2.47% 36 $644.98 60
Bladn 2.46% 37 $723.52 42
Allghany 2.45% 38 $717.96 45Haliax 2.44% 39 $688.59 50
Lincoln 2.40% 40 $799.94 33
Camdn 2.39% 41 $846.47 29
Moor 2.36% 42 $909.72 21
Prson 2.35% 43 $720.74 43
Rowan 2.34% 44 $710.92 47
Alamanc 2.33% 45 $716.09 46
Mitchll 2.33% 46 $615.32 64
Clay 2.30% 47 $648.00 58
Anson 2.28% 48 $613.22 65
Franlin 2.27% 49 $664.73 57
Montgomry 2.27% 50 $597.72 73
n.c. m 2.27% — $691.17 —
Richmond 2.26% 51 $610.19 66
Pol 2.25% 52 $893.20 24
Pasquotan 2.23% 53 $604.65 71
Ash 2.23% 54 $647.63 59
Chatham 2.23% 55 $955.68 18
Ruthrord 2.23% 56 $597.68 74
Rocingham 2.22% 57 $677.17 52
Scotland 2.21% 58 $609.12 68
Pamlico 2.21% 59 $803.80 32
Granvill 2.19% 60 $609.12 69
Johnston 2.16% 61 $679.91 51
Lnoir 2.15% 62 $719.33 44
Caldwll 2.15% 63 $600.28 72
Yadin 2.13% 64 $640.60 61
Stanly 2.12% 65 $634.44 62
Martin 2.10% 66 $668.22 55
Nash 2.07% 67 $693.74 49
Harntt 2.06% 68 $565.88 81
Bauort 2.05% 69 $667.77 56
Hndrson 2.05% 70 $745.58 38
Vanc 2.02% 71 $609.50 67
Hrtord 2.00% 72 $574.81 78
Randolph 2.00% 73 $573.47 79
Davi 1.98% 74 $707.97 48Columbus 1.96% 75 $585.06 75
Madison 1.96% 76 $544.42 87
Prquimans 1.90% 77 $570.99 80
Gats 1.90% 78 $506.53 91
Davidson 1.88% 79 $607.67 70
Duplin 1.87% 80 $545.86 86
Stos 1.87% 81 $555.75 84
Washington 1.85% 82 $563.65 83
Surry 1.85% 83 $563.79 82
Wils 1.84% 84 $578.78 77
Wayn 1.84% 85 $582.54 76
Bur 1.84% 86 $546.02 85
Clvland 1.80% 87 $534.72 89
McDowll 1.79% 88 $462.48 92
Cumbrland 1.78% 89 $739.14 39
Robson 1.77% 90 $450.88 95
Cravn 1.68% 91 $619.82 63
Jons 1.64% 92 $537.34 88
Alxandr 1.56% 93 $451.50 94
Grn 1.55% 94 $411.17 97
Brti 1.50% 95 $462.22 93
Caswll 1.40% 96 $418.14 96
Swain 1.27% 97 $361.84 98
Onslow 1.20% 98 $511.52 90
Ho Did not submitted AFIR data
Sampson Did not submitted AFIR data
c o u n
t y
c o m b
i n e d
p r o p
e r t y
t a X
b u r d
e n a s %
o f i n
c o m e
r a n k
c o m
b i n e d
p r o p
e r t y
t a X
b u r d
e n p e r
c a p i
t a
r a n k
by the numbers | RANkINGS OF N.C. COUNTIeS BY COMBINeD PROPeRTY TAX BURDeN

8/2/2019 By the Numbers: What Government Costs in North Carolina Cities and Counties FY 2010
http://slidepdf.com/reader/full/by-the-numbers-what-government-costs-in-north-carolina-cities-and-counties 12/46
11
p o l i c y r e p o r t
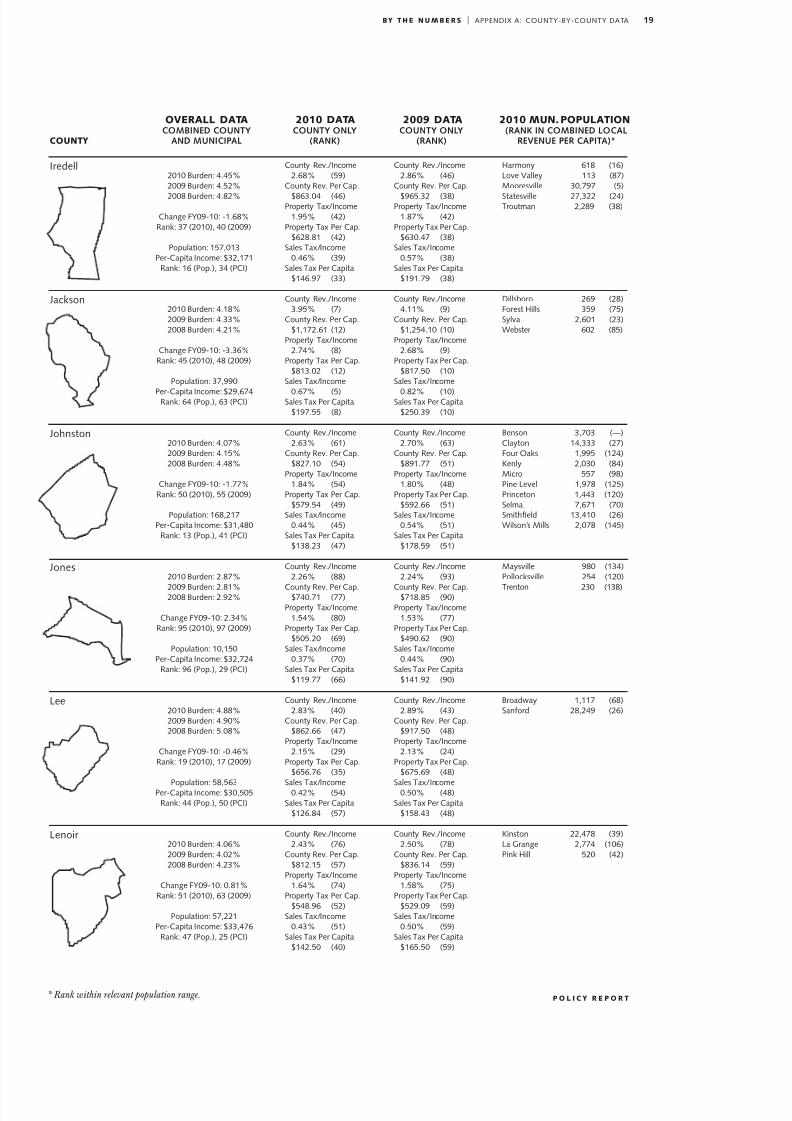
by the numbers | APPeNDIX A: COUNTY-BY-COUNTY DATA
oVerall data 2010 data 2009 data 2010 mun. population COMBINEDCOUNTY COUNTYONLY COUNTYONLY (RANKINCOMBINEDLOCAL
county ANDMUNICIPAL (RANK) (RANK) REVENUEPERCAPITA)*
* Rank within relevant population range.
Alamanc
Alxandr
Allghany
Anson
Ash
Avry
2010 Burdn: 4.51%2009 Burdn: 4.45%
2008 Burdn: 4.75%
Chang FY09-10: 1.36%Ran: 32 (2010), 43 (2009)
Population: 148,338Pr-Capita Incom: $30,671
Ran: 18 (Pop.), 48 (PCI)
2010 Burdn: 2.96%2009 Burdn: 2.88%2008 Burdn: 2.98%
Chang FY09-10: 2.82%Ran: 94 (2010), 95 (2009)
Population: 37,316
Pr-Capita Incom: $28,976Ran: 65 (Pop.), 71 (PCI)
2010 Burdn: 4.03%2009 Burdn: 4.15%2008 Burdn: 4.41%
Chang FY09-10: -2.82%Ran: 55 (2010), 56 (2009)
Population: 11,258Pr-Capita Incom: $29,325
Ran: 94 (Pop.), 66 (PCI)
2010 Burdn: 4.57%
2009 Burdn: 4.70%2008 Burdn: 4.72%
Chang FY09-10: -2.69%Ran: 29 (2010), 26 (2009)
Population: 25,275Pr-Capita Incom: $26,879
Ran: 74 (Pop.), 88 (PCI)
2010 Burdn: 3.47%2009 Burdn: 3.71%2008 Burdn: 3.85%
Chang FY09-10: -6.44%Ran: 76 (2010), 71 (2009)
Population: 26,491Pr-Capita Incom: $29,019Ran: 73 (Pop.), 69 (PCI)
2010 Burdn: 4.72%2009 Burdn: 5.35%2008 Burdn: 5.77%
Chang FY09-10: -11.71%Ran: 25 (2010), 10 (2009)
Population: 18,303Pr-Capita Incom: $28,806
Ran: 86 (Pop.), 73 (PCI)
County Rv./Incom2.28% (86)
County Rv. Pr Cap.
$699.12 (84)Proprty Tax/Incom
1.48% (85)Proprty Tax Pr Cap.
$455.09 (83)Sals Tax/Incom
0.37% (69)Sals Tax Pr Capita
$112.29 (75)
County Rv./Incom2.50% (70)
County Rv. Pr Cap.$723.73 (81)
Proprty Tax/Incom1.50% (83)
Proprty Tax Pr Cap.$434.46 (89)
Sals Tax/Incom
0.46% (38)Sals Tax Pr Capita
$133.65 (50)
County Rv./Incom3.52% (14)
County Rv. Pr Cap.$1,030.80 (24)
Proprty Tax/Incom2.33% (16)
Proprty Tax Pr Cap.$683.53 (30)
Sals Tax/Incom0.46% (37)
Sals Tax Pr Capita$135.86 (49)
County Rv./Incom2.79% (44)
County Rv. Pr Cap.$750.78 (75)Proprty Tax/Incom
1.97% (41)Proprty Tax Pr Cap.
$528.88 (58)Sals Tax/Incom
0.36% (76)Sals Tax Pr Capita
$96.24 (92)
County Rv./Incom2.96% (33)
County Rv. Pr Cap.$858.32 (48)
Proprty Tax/Incom2.02% (38)
Proprty Tax Pr Cap.$585.69 (47)
Sals Tax/Incom0.54% (23)Sals Tax Pr Capita
$156.22 (24)
County Rv./Incom4.08% (5)
County Rv. Pr Cap.$1,176.71 (10)
Proprty Tax/Incom3.07% (5)
Proprty Tax Pr Cap.$885.66 (8)
Sals Tax/Incom0.68% (3)
Sals Tax Pr Capita$197.30 (9)
County Rv./Incom2.33% (90)
County Rv. Pr Cap.
$752.82 (81)Proprty Tax/Incom
1.42% (86)Proprty Tax Pr Cap.
$457.86 (81)Sals Tax/Incom
0.49% (81)Sals Tax Pr Capita
$157.93 (81)
County Rv./Incom2.44% (81)
County Rv. Pr Cap.$733.97 (86)
Proprty Tax/Incom1.32% (94)
Proprty Tax Pr Cap.$396.64 (86)
Sals Tax/Incom
0.56% (86)Sals Tax Pr Capita
$168.65 (86)
County Rv./Incom3.61% (16)
County Rv. Pr Cap.$1,068.45 (25)
Proprty Tax/Incom2.29% (17)
Proprty Tax Pr Cap.$677.45 (25)
Sals Tax/Incom0.62% (25)
Sals Tax Pr Capita$183.27 (25)
County Rv./Incom2.89% (44)
County Rv. Pr Cap.$797.49 (73)Proprty Tax/Incom
1.93% (39)Proprty Tax Pr Cap.
$532.76 (73)Sals Tax/Incom
0.49% (73)Sals Tax Pr Capita
$134.94 (73)
County Rv./Incom3.18% (30)
County Rv. Pr Cap.$937.57 (44)
Proprty Tax/Incom2.00% (33)
Proprty Tax Pr Cap.$590.15 (44)
Sals Tax/Incom0.72% (44)Sals Tax Pr Capita
$211.85 (44)
County Rv./Incom4.30% (4)
County Rv. Pr Cap.$1,235.83 (11)
Proprty Tax/Incom3.02% (5)
Proprty Tax Pr Cap.$867.90 (11)
Sals Tax/Incom0.90% (11)
Sals Tax Pr Capita$259.65 (11)
Alamanc 709 (137)Burlington 52,156 (28)elon 7,913 (76)
Gibsonvill 5,980 (31)Graham 15,043 (72)Grnlvl 2,510 (—)Haw Rivr 2,068 (89)Mban 10,106 (30)Ossip 480 (158)Swpsonvill 1,264 (161)
Taylorsvill 1,931 (94)
Sparta 1,798 (64)
Ansonvill 607 (153)Lilsvill 436 (59)
McFarlan 83 (157)Morvn 552 (—)Pachland 534 (160)Polton 2,992 (155)Wadsboro 5,489 (75)
Jrson 1,442 (76)Lansing 150 (—)Wst Jrson 1,212 (25)
Bannr el 972 (15)Crossnor 284 (48)el Par 447 (37)Grandathr Villag 83 (53)Nwland 695 (20)Sugar Mountain 247 (—)
A P P E N
D
I x A

8/2/2019 By the Numbers: What Government Costs in North Carolina Cities and Counties FY 2010
http://slidepdf.com/reader/full/by-the-numbers-what-government-costs-in-north-carolina-cities-and-counties 13/46
12
j o h n l o c k e f o u n d a t i o n
oVerall data 2010 data 2009 data 2010 mun. population COMBINEDCOUNTY COUNTYONLY COUNTYONLY (RANKINCOMBINEDLOCAL
county ANDMUNICIPAL (RANK) (RANK) REVENUEPERCAPITA)*
by the numbers | APPeNDIX A: COUNTY-BY-COUNTY DATA
Bauort
Brti
Bladn
Brunswic
Buncomb
Bur
2010 Burdn: 3.97%2009 Burdn: 4.33%
2008 Burdn: 4.57%
Chang FY09-10: -8.36%Ran: 57 (2010), 47 (2009)
Population: 47,393Pr-Capita Incom: $32,542
Ran: 53 (Pop.), 31 (PCI)
2010 Burdn: 3.02%2009 Burdn: 3.31%2008 Burdn: 3.47%
Chang FY09-10: -8.68%Ran: 92 (2010), 90 (2009)
Population: 20,114
Pr-Capita Incom: $30,835Ran: 82 (Pop.), 45 (PCI)
2010 Burdn: 4.62%2009 Burdn: 4.80%2008 Burdn: 7.70%
Chang FY09-10: -3.64%Ran: 28 (2010), 22 (2009)
Population: 32,043Pr-Capita Incom: $29,407
Ran: 69 (Pop.), 65 (PCI)
2010 Burdn: 6.90%
2009 Burdn: 7.31%2008 Burdn: 7.78%
Chang FY09-10: -5.56%Ran: 3 (2010), 2 (2009)
Population: 107,127Pr-Capita Incom: $31,222
Ran: 25 (Pop.), 43 (PCI)
2010 Burdn: 4.79%2009 Burdn: 4.76%2008 Burdn: 5.06%
Chang FY09-10: 0.62%Ran: 22 (2010), 23 (2009)
Population: 230,421Pr-Capita Incom: $34,774Ran: 7 (Pop.), 21 (PCI)
2010 Burdn: 3.37%2009 Burdn: 3.54%2008 Burdn: 3.60%
Chang FY09-10: -4.78%Ran: 80 (2010), 78 (2009)
Population: 89,653Pr-Capita Incom: $29,710
Ran: 31 (Pop.), 61 (PCI)
County Rv./Incom2.48% (74)
County Rv. Pr Cap.
$805.55 (59)Proprty Tax/Incom
1.78% (59)Proprty Tax Pr Cap.
$578.41 (50)Sals Tax/Incom
0.46% (36)Sals Tax Pr Capita
$151.14 (30)
County Rv./Incom2.20% (91)
County Rv. Pr Cap.$677.92 (89)
Proprty Tax/Incom1.39% (92)
Proprty Tax Pr Cap.$429.45 (90)
Sals Tax/Incom
0.24% (96)Sals Tax Pr Capita
$74.67 (97)
County Rv./Incom3.45% (17)
County Rv. Pr Cap.$1,013.70 (29)
Proprty Tax/Incom2.13% (30)
Proprty Tax Pr Cap.$625.54 (43)
Sals Tax/Incom0.44% (42)
Sals Tax Pr Capita$130.65 (54)
County Rv./Incom3.91% (10)
County Rv. Pr Cap.$1,220.55 (6)Proprty Tax/Incom
3.01% (6)Proprty Tax Pr Cap.
$938.41 (6)Sals Tax/Incom
0.45% (40)Sals Tax Pr Capita
$140.60 (41)
County Rv./Incom3.11% (26)
County Rv. Pr Cap.$1,080.96 (18)
Proprty Tax/Incom2.07% (34)
Proprty Tax Pr Cap.$721.44 (24)
Sals Tax/Incom0.55% (22)Sals Tax Pr Capita
$190.01 (11)
County Rv./Incom2.05% (95)
County Rv. Pr Cap.$608.96 (97)
Proprty Tax/Incom1.44% (89)
Proprty Tax Pr Cap.$428.27 (91)
Sals Tax/Incom0.16% (98)
Sals Tax Pr Capita$48.23 (98)
County Rv./Incom2.63% (70)
County Rv. Pr Cap.
$857.18 (56)Proprty Tax/Incom
1.76% (55)Proprty Tax Pr Cap.
$574.67 (56)Sals Tax/Incom
0.61% (56)Sals Tax Pr Capita
$199.55 (56)
County Rv./Incom2.41% (84)
County Rv. Pr Cap.$713.61 (93)
Proprty Tax/Incom1.46% (85)
Proprty Tax Pr Cap.$433.33 (93)
Sals Tax/Incom
0.41% (93)Sals Tax Pr Capita
$122.13 (93)
County Rv./Incom3.63% (15)
County Rv. Pr Cap.$1,058.72 (29)
Proprty Tax/Incom2.13% (23)
Proprty Tax Pr Cap.$621.65 (29)
Sals Tax/Incom0.60% (29)
Sals Tax Pr Capita$174.38 (29)
County Rv./Incom4.20% (7)
County Rv. Pr Cap.$1,329.74 (5)Proprty Tax/Incom
3.08% (4)Proprty Tax Pr Cap.
$973.89 (5)Sals Tax/Incom
0.61% (5)Sals Tax Pr Capita
$194.30 (5)
County Rv./Incom3.12% (31)
County Rv. Pr Cap.$1,128.43 (17)
Proprty Tax/Incom1.99% (35)
Proprty Tax Pr Cap.$718.05 (17)
Sals Tax/Incom0.63% (17)Sals Tax Pr Capita
$226.24 (17)
County Rv./Incom2.17% (95)
County Rv. Pr Cap.$656.11 (97)
Proprty Tax/Incom1.42% (87)
Proprty Tax Pr Cap.$428.72 (97)
Sals Tax/Incom0.24% (97)
Sals Tax Pr Capita$73.63 (97)
Aurora 570 (—)Bath 307 (—)Blhavn 1,963 (—)
Chocowinity 711 (62)Pantgo 174 (81)Washington 10,114 (25)Washington Par 444 (91)
Aswvill 165 (173)Aulandr 824 (83)Colrain 208 (109)klord 249 (175)Lwiston Woodvill 554 (131)Powllsvill 244 (171)Roxobl 260 (170)Windsor 3,214 (149)
Bladnboro 1,605 (42)Clarton 730 (23)Dublin 246 (27)east Arcadia 519 (—)elizabthtown 3,621 (31)Tar Hl 101 (93)Whit La 583 (11)
BRUNSWICk COUNTYBald Had Island 264 (1)Blvill 1,488 (59)Boiling Spring Las 4,372 (48)Bolivia 177 (52)
Calabash 1,831 (36)Carolina Shors 3,127 (60)Caswll Bach 511 (12)Holdn Bach 964 (10)Lland 13,408 (32)Navassa 1,973 (—)Northwst 882 (45)Oa Island 8,594 (3)Ocan Isl Bach 520 (5)Sandy Cr 304 (35)Shallott 1,998 (13)Southport 3,143 (21)St. Jams 3,051 (44)Sunst Bach 3,434 (14)Varnamtown 611 (54)
BUNCOMBe COUNTYAshvill 79,973 (4)Biltmor Forst 1,556 (12)
Blac Mountain 8,526 (23)Montrat 701 (13)Wavrvill 3,319 (17)Woodfn 6,020 (55)
Connlly Springs 1,938 (168)Drxl 1,920 (151)Gln Alpin 1,349 (154)Hildbran 1,774 (158)Morganton 17,058 (59)Rhodhiss 903 (159)Ruthrord Collg 1,306 (164)Valds 4,592 (105)

8/2/2019 By the Numbers: What Government Costs in North Carolina Cities and Counties FY 2010
http://slidepdf.com/reader/full/by-the-numbers-what-government-costs-in-north-carolina-cities-and-counties 14/46
13
p o l i c y r e p o r t
by the numbers | APPeNDIX A: COUNTY-BY-COUNTY DATA
oVerall data 2010 data 2009 data 2010 mun. population COMBINEDCOUNTY COUNTYONLY COUNTYONLY (RANKINCOMBINEDLOCAL
county ANDMUNICIPAL (RANK) (RANK) REVENUEPERCAPITA)*
* Rank within relevant population range.
Cabarrus
Caldwll
Camdn
Cartrt
Caswll
Catawba
2010 Burdn: 5.43%2009 Burdn: 5.18%
2008 Burdn: 5.12%
Chang FY09-10: 4.73%Ran: 10 (2010), 12 (2009)
Population: 174,255Pr-Capita Incom: $34,083
Ran: 12 (Pop.), 23 (PCI)
2010 Burdn: 3.83%2009 Burdn: 4.13%2008 Burdn: 4.15%
Chang FY09-10: -7.37%Ran: 63 (2010), 57 (2009)
Population: 80,130
Pr-Capita Incom: $27,969Ran: 33 (Pop.), 81 (PCI)
2010 Burdn: 3.41%2009 Burdn: 3.60%2008 Burdn: 4.03%
Chang FY09-10: -5.24%Ran: 78 (2010), 75 (2009)
Population: 9,732Pr-Capita Incom: $35,379
Ran: 97 (Pop.), 20 (PCI)
2010 Burdn: 4.80%
2009 Burdn: 4.87%2008 Burdn: 5.33%
Chang FY09-10: -1.43%Ran: 21 (2010), 18 (2009)
Population: 64,712Pr-Capita Incom: $38,455
Ran: 39 (Pop.), 10 (PCI)
2010 Burdn: 2.58%2009 Burdn: 2.73%2008 Burdn: 3.04%
Chang FY09-10: -5.51%Ran: 96 (2010), 98 (2009)
Population: 23,571Pr-Capita Incom: $29,830Ran: 78 (Pop.), 58 (PCI)
2010 Burdn: 4.75%2009 Burdn: 4.66%2008 Burdn: 4.96%
Chang FY09-10: 1.80%Ran: 23 (2010), 28 (2009)
Population: 157,002Pr-Capita Incom: $31,052
Ran: 17 (Pop.), 44 (PCI)
County Rv./Incom3.02% (31)
County Rv. Pr Cap.
$1,028.81 (25)Proprty Tax/Incom
2.26% (20)Proprty Tax Pr Cap.
$771.64 (19)Sals Tax/Incom
0.47% (35)Sals Tax Pr Capita
$160.16 (21)
County Rv./Incom2.40% (81)
County Rv. Pr Cap.$671.13 (91)
Proprty Tax/Incom1.69% (67)
Proprty Tax Pr Cap.$473.22 (81)
Sals Tax/Incom
0.33% (84)Sals Tax Pr Capita
$92.69 (94)
County Rv./Incom3.10% (28)
County Rv. Pr Cap.$1,095.29 (16)
Proprty Tax/Incom2.39% (14)
Proprty Tax Pr Cap.$846.47 (9)
Sals Tax/Incom0.28% (94)
Sals Tax Pr Capita$99.99 (88)
County Rv./Incom2.91% (34)
County Rv. Pr Cap.$1,119.34 (14)Proprty Tax/Incom
2.02% (39)Proprty Tax Pr Cap.
$775.38 (18)Sals Tax/Incom
0.49% (29)Sals Tax Pr Capita
$189.72 (12)
County Rv./Incom2.31% (85)
County Rv. Pr Cap.$688.38 (88)
Proprty Tax/Incom1.35% (94)
Proprty Tax Pr Cap.$402.92 (94)
Sals Tax/Incom0.33% (85)Sals Tax Pr Capita
$97.57 (90)
County Rv./Incom2.82% (42)
County Rv. Pr Cap.$875.06 (43)
Proprty Tax/Incom1.74% (63)
Proprty Tax Pr Cap.$538.98 (53)
Sals Tax/Incom0.55% (20)
Sals Tax Pr Capita$170.01 (16)
County Rv./Incom2.98% (36)
County Rv. Pr Cap.
$1,084.37 (20)Proprty Tax/Incom
2.17% (22)Proprty Tax Pr Cap.
$788.99 (20)Sals Tax/Incom
0.51% (20)Sals Tax Pr Capita
$183.93 (20)
County Rv./Incom2.64% (69)
County Rv. Pr Cap.$754.05 (80)
Proprty Tax/Incom1.70% (62)
Proprty Tax Pr Cap.$484.52 (80)
Sals Tax/Incom
0.54% (80)Sals Tax Pr Capita
$153.94 (80)
County Rv./Incom3.25% (23)
County Rv. Pr Cap.$1,160.32 (15)
Proprty Tax/Incom2.20% (20)
Proprty Tax Pr Cap.$784.74 (15)
Sals Tax/Incom0.37% (15)
Sals Tax Pr Capita$133.12 (15)
County Rv./Incom3.02% (34)
County Rv. Pr Cap.$1,178.78 (14)Proprty Tax/Incom
2.03% (31)Proprty Tax Pr Cap.
$791.52 (14)Sals Tax/Incom
0.58% (14)Sals Tax Pr Capita
$226.48 (14)
County Rv./Incom2.46% (80)
County Rv. Pr Cap.$743.88 (84)
Proprty Tax/Incom1.36% (92)
Proprty Tax Pr Cap.$410.09 (84)
Sals Tax/Incom0.48% (84)Sals Tax Pr Capita
$144.96 (84)
County Rv./Incom2.76% (57)
County Rv. Pr Cap.$905.78 (49)
Proprty Tax/Incom1.68% (66)
Proprty Tax Pr Cap.$549.20 (49)
Sals Tax/Incom0.54% (49)
Sals Tax Pr Capita$178.11 (49)
Concord 81,365 (12)Harrisburg 6,348 (18)kannapolis 44,891 (25)
Midland 3,410 (87)Mount Plasant 1,632 (40)
Cajah’s Mountain 2,884 (166)Cdar Roc 323 (139)Gamwll 3,882 (167)Granit Falls 4,999 (113)Hudson 3,144 (131)Lnoir 19,071 (66)Sawmills 5,123 (88)
No incorporatd municipalitis.
Atlantic Bach 1,820 (5)Bauort 4,048 (18)
Bogu 680 (105)Cap Cartrt 1,500 (39)Cdar Point 898 (36)emrald Isl 3,982 (11)Indian Bach 88 (2)Morhad City 8,830 (10)Nwport 4,214 (50)Pltir 560 (104)Pin knoll Shors 1,634 (9)
Milton 112 (—)Yancyvill 2,229 (156)
Brooord 439 (57)Catawba 755 (30)Clarmont 1,123 (—)Conovr 8,110 (40)Hicory 41,149 (16)Long Viw 5,002 (56)Maidn 3,466 (53)Nwton 13,819 (47)

8/2/2019 By the Numbers: What Government Costs in North Carolina Cities and Counties FY 2010
http://slidepdf.com/reader/full/by-the-numbers-what-government-costs-in-north-carolina-cities-and-counties 15/46
14
j o h n l o c k e f o u n d a t i o n
oVerall data 2010 data 2009 data 2010 mun. population COMBINEDCOUNTY COUNTYONLY COUNTYONLY (RANKINCOMBINEDLOCAL
county ANDMUNICIPAL (RANK) (RANK) REVENUEPERCAPITA)*
by the numbers | APPeNDIX A: COUNTY-BY-COUNTY DATA
Chatham
Chro
Chowan
Clay
Clvland
Columbus
2010 Burdn: 3.49%2009 Burdn: 3.54%
2008 Burdn: 3.57%
Chang FY09-10: -1.52%Ran: 75 (2010), 79 (2009)
Population: 62,482Pr-Capita Incom: $42,870
Ran: 41 (Pop.), 2 (PCI)
2010 Burdn: 4.50%2009 Burdn: 4.82%2008 Burdn: 5.03%
Chang FY09-10: -6.63%Ran: 34 (2010), 20 (2009)
Population: 27,090
Pr-Capita Incom: $26,185Ran: 72 (Pop.), 94 (PCI)
2010 Burdn: 4.87%2009 Burdn: 4.73%2008 Burdn: 4.82%
Chang FY09-10: 3.04%Ran: 20 (2010), 25 (2009)
Population: 14,818Pr-Capita Incom: $31,666
Ran: 88 (Pop.), 38 (PCI)
2010 Burdn: 3.62%
2009 Burdn: 3.95%2008 Burdn: 4.18%
Chang FY09-10: -8.46%Ran: 68 (2010), 66 (2009)
Population: 10,538Pr-Capita Incom: $28,119
Ran: 95 (Pop.), 80 (PCI)
2010 Burdn: 3.36%2009 Burdn: 3.45%2008 Burdn: 3.60%
Chang FY09-10: -2.43%Ran: 82 (2010), 83 (2009)
Population: 98,628Pr-Capita Incom: $29,692Ran: 28 (Pop.), 62 (PCI)
2010 Burdn: 3.53%2009 Burdn: 3.70%2008 Burdn: 3.97%
Chang FY09-10: -4.69%Ran: 73 (2010), 72 (2009)
Population: 56,309Pr-Capita Incom: $29,822
Ran: 48 (Pop.), 59 (PCI)
County Rv./Incom2.76% (47)
County Rv. Pr Cap.
$1,183.32 (9)Proprty Tax/Incom
2.11% (31)Proprty Tax Pr Cap.
$903.35 (7)Sals Tax/Incom
0.30% (90)Sals Tax Pr Capita
$129.06 (56)
County Rv./Incom4.06% (6)
County Rv. Pr Cap.$1,063.16 (20)
Proprty Tax/Incom2.44% (12)
Proprty Tax Pr Cap.$637.98 (39)
Sals Tax/Incom
0.65% (7)Sals Tax Pr Capita
$171.36 (14)
County Rv./Incom3.52% (13)
County Rv. Pr Cap.$1,113.63 (15)
Proprty Tax/Incom2.20% (26)
Proprty Tax Pr Cap.$697.70 (29)
Sals Tax/Incom0.50% (28)
Sals Tax Pr Capita$156.82 (22)
County Rv./Incom3.45% (16)
County Rv. Pr Cap.$971.08 (33)Proprty Tax/Incom
2.30% (18)Proprty Tax Pr Cap.
$648.00 (36)Sals Tax/Incom
0.55% (19)Sals Tax Pr Capita
$154.70 (27)
County Rv./Incom2.27% (87)
County Rv. Pr Cap.$673.03 (90)
Proprty Tax/Incom1.40% (90)
Proprty Tax Pr Cap.$416.81 (92)
Sals Tax/Incom0.35% (80)Sals Tax Pr Capita
$102.52 (85)
County Rv./Incom2.60% (62)
County Rv. Pr Cap.$775.95 (66)
Proprty Tax/Incom1.72% (65)
Proprty Tax Pr Cap.$511.58 (64)
Sals Tax/Incom0.36% (74)
Sals Tax Pr Capita$107.08 (80)
County Rv./Incom2.80% (51)
County Rv. Pr Cap.
$1,233.09 (12)Proprty Tax/Incom
2.09% (27)Proprty Tax Pr Cap.
$919.27 (12)Sals Tax/Incom
0.38% (12)Sals Tax Pr Capita
$165.46 (12)
County Rv./Incom4.12% (8)
County Rv. Pr Cap.$1,076.87 (22)
Proprty Tax/Incom2.43% (12)
Proprty Tax Pr Cap.$634.41 (22)
Sals Tax/Incom
0.85% (22)Sals Tax Pr Capita
$221.41 (22)
County Rv./Incom3.43% (20)
County Rv. Pr Cap.$1,116.23 (18)
Proprty Tax/Incom2.04% (30)
Proprty Tax Pr Cap.$664.00 (18)
Sals Tax/Incom0.58% (18)
Sals Tax Pr Capita$189.98 (18)
County Rv./Incom3.76% (12)
County Rv. Pr Cap.$1,065.73 (26)Proprty Tax/Incom
2.29% (18)Proprty Tax Pr Cap.
$648.20 (26)Sals Tax/Incom
0.82% (26)Sals Tax Pr Capita
$231.25 (26)
County Rv./Incom2.40% (86)
County Rv. Pr Cap.$731.64 (87)
Proprty Tax/Incom1.38% (91)
Proprty Tax Pr Cap.$422.00 (87)
Sals Tax/Incom0.44% (87)Sals Tax Pr Capita
$135.67 (87)
County Rv./Incom2.78% (54)
County Rv. Pr Cap.$835.40 (60)
Proprty Tax/Incom1.78% (49)
Proprty Tax Pr Cap.$533.05 (60)
Sals Tax/Incom0.47% (60)
Sals Tax Pr Capita$140.22 (60)
Goldston 361 (44)Pittsboro 2,443 (24)Silr City 8,713 (35)
Andrws 1,913 (—)Murphy 1,627 (20)
ednton 5,166 (21)
Haysvill 523 (—)
CLeVeLAND COUNTYBlwood 1,059 (169)Boiling Springs 4,301 (152)Casar 305 (190)earl 236 (184)Fallston 620 (188)Grovr 699 (150)kings Mountain 10,783 (74)kingstown 819 (179)Lattimor 624 (186)Lawndal 640 (182)Moorsboro 317 (192)
Pattrson Springs 604 (191)Polvill 545 (189)Shlby 20,793 (71)Waco 329 (187)
Boardman 196 (—)Bolton 483 (94)Brunswic 1,088 (142)Crro Gordo 244 (147)Chadbourn 2,122 (101)Fair Blu 1,226 (127)La Waccamaw 1,287 (75)Sandyfld 349 (—)Tabor City 3,958 (132)Whitvill 5,125 (44)

8/2/2019 By the Numbers: What Government Costs in North Carolina Cities and Counties FY 2010
http://slidepdf.com/reader/full/by-the-numbers-what-government-costs-in-north-carolina-cities-and-counties 16/46
1
p o l i c y r e p o r t
by the numbers | APPeNDIX A: COUNTY-BY-COUNTY DATA
oVerall data 2010 data 2009 data 2010 mun. population COMBINEDCOUNTY COUNTYONLY COUNTYONLY (RANKINCOMBINEDLOCAL
county ANDMUNICIPAL (RANK) (RANK) REVENUEPERCAPITA)*
* Rank within relevant population range.
Cravn
Cumbrland
Currituc
Dar
Davidson
Davi
2010 Burdn: 3.84%2009 Burdn: 3.98%
2008 Burdn: 4.19%
Chang FY09-10: -3.62%Ran: 62 (2010), 64 (2009)
Population: 100,261Pr-Capita Incom: $36,798
Ran: 27 (Pop.), 13 (PCI)
2010 Burdn: 3.56%2009 Burdn: 3.39%2008 Burdn: 3.67%
Chang FY09-10: 5.12%Ran: 71 (2010), 87 (2009)
Population: 321,071
Pr-Capita Incom: $41,627Ran: 5 (Pop.), 5 (PCI)
2010 Burdn: 6.74%2009 Burdn: 6.71%2008 Burdn: 6.94%
Chang FY09-10: 0.49%Ran: 4 (2010), 4 (2009)
Population: 23,815Pr-Capita Incom: $35,569
Ran: 77 (Pop.), 19 (PCI)
2010 Burdn: 10.46%
2009 Burdn: 10.51%2008 Burdn: 11.04%
Chang FY09-10: -0.49%Ran: 1 (2010), 1 (2009)
Population: 34,355Pr-Capita Incom: $37,526
Ran: 68 (Pop.), 12 (PCI)
2010 Burdn: 3.08%2009 Burdn: 3.20%2008 Burdn: 3.44%
Chang FY09-10: -3.57%Ran: 89 (2010), 92 (2009)
Population: 159,947Pr-Capita Incom: $32,263Ran: 14 (Pop.), 32 (PCI)
2010 Burdn: 3.24%2009 Burdn: 3.33%2008 Burdn: 3.57%
Chang FY09-10: -2.90%Ran: 87 (2010), 89 (2009)
Population: 41,752Pr-Capita Incom: $35,784
Ran: 61 (Pop.), 18 (PCI)
County Rv./Incom2.08% (93)
County Rv. Pr Cap.
$765.02 (71)Proprty Tax/Incom
1.20% (96)Proprty Tax Pr Cap.
$440.75 (87)Sals Tax/Incom
0.35% (77)Sals Tax Pr Capita
$130.19 (55)
County Rv./Incom1.99% (96)
County Rv. Pr Cap.$828.95 (53)
Proprty Tax/Incom1.27% (95)
Proprty Tax Pr Cap.$527.77 (59)
Sals Tax/Incom
0.33% (86)Sals Tax Pr Capita
$136.14 (48)
County Rv./Incom6.05% (3)
County Rv. Pr Cap.$2,150.71 (2)
Proprty Tax/Incom3.23% (3)
Proprty Tax Pr Cap.$1,148.91 (2)
Sals Tax/Incom0.81% (2)
Sals Tax Pr Capita$287.94 (2)
County Rv./Incom6.47% (1)
County Rv. Pr Cap.$2,428.12 (1)Proprty Tax/Incom
3.83% (1)Proprty Tax Pr Cap.
$1,436.33 (1)Sals Tax/Incom
1.12% (1)Sals Tax Pr Capita
$419.08 (1)
County Rv./Incom2.07% (94)
County Rv. Pr Cap.$666.31 (92)
Proprty Tax/Incom1.48% (87)
Proprty Tax Pr Cap.$477.32 (80)
Sals Tax/Incom0.32% (88)Sals Tax Pr Capita
$101.64 (86)
County Rv./Incom2.49% (71)
County Rv. Pr Cap.$891.83 (42)
Proprty Tax/Incom1.78% (58)
Proprty Tax Pr Cap.$638.46 (38)
Sals Tax/Incom0.34% (81)
Sals Tax Pr Capita$122.26 (63)
County Rv./Incom2.27% (92)
County Rv. Pr Cap.
$837.92 (58)Proprty Tax/Incom
1.23% (95)Proprty Tax Pr Cap.
$455.39 (58)Sals Tax/Incom
0.47% (58)Sals Tax Pr Capita
$173.94 (58)
County Rv./Incom1.96% (97)
County Rv. Pr Cap.$813.30 (69)
Proprty Tax/Incom1.18% (96)
Proprty Tax Pr Cap.$490.92 (69)
Sals Tax/Incom
0.35% (69)Sals Tax Pr Capita
$145.91 (69)
County Rv./Incom6.00% (3)
County Rv. Pr Cap.$2,140.18 (2)
Proprty Tax/Incom3.13% (3)
Proprty Tax Pr Cap.$1,116.87 (2)
Sals Tax/Incom0.89% (2)
Sals Tax Pr Capita$318.37 (2)
County Rv./Incom6.52% (1)
County Rv. Pr Cap.$2,539.13 (1)Proprty Tax/Incom
3.74% (1)Proprty Tax Pr Cap.
$1,458.29 (1)Sals Tax/Incom
1.20% (1)Sals Tax Pr Capita
$467.88 (1)
County Rv./Incom2.19% (94)
County Rv. Pr Cap.$718.44 (91)
Proprty Tax/Incom1.47% (84)
Proprty Tax Pr Cap.$480.76 (91)
Sals Tax/Incom0.42% (91)Sals Tax Pr Capita
$138.74 (91)
County Rv./Incom2.59% (72)
County Rv. Pr Cap.$956.80 (40)
Proprty Tax/Incom1.73% (57)
Proprty Tax Pr Cap.$640.99 (40)
Sals Tax/Incom0.44% (40)
Sals Tax Pr Capita$162.83 (40)
Bridgton 315 (26)Cov City 416 (178)Dovr 457 (154)
Havloc 23,739 (82)Nw Brn 26,611 (23)Rivr Bnd 3,162 (139)Trnt Woods 4,465 (134)Vancboro 919 (115)
Falcon 350 (142)Fayttvill 207,779 (29)Godwin 180 (—)Hop Mills 14,559 (60)Lindn 143 (123)Spring La 13,175 (52)Stdman 970 (103)Wad 650 (132)
No incorporatd municipalitis.
Duc 504 (4)kill Dvil Hills 6,875 (1)
kitty Haw 3,481 (7)Manto 1,044 (2)Nags Had 3,131 (1)Southrn Shors 2,616 (8)
Dnton 1,740 (102)Lxington 21,420 (69)Midway 4,557 (163)Thomasvill 27,364 (33)Wallburg 2,977 (162)
Brmuda Run 1,548 (41)Coolm 980 (84)Mocsvill 4,640 (54)

8/2/2019 By the Numbers: What Government Costs in North Carolina Cities and Counties FY 2010
http://slidepdf.com/reader/full/by-the-numbers-what-government-costs-in-north-carolina-cities-and-counties 17/46
16
j o h n l o c k e f o u n d a t i o n
oVerall data 2010 data 2009 data 2010 mun. population COMBINEDCOUNTY COUNTYONLY COUNTYONLY (RANKINCOMBINEDLOCAL
county ANDMUNICIPAL (RANK) (RANK) REVENUEPERCAPITA)*
by the numbers | APPeNDIX A: COUNTY-BY-COUNTY DATA
Duplin
Durham
edgcomb
Forsyth
Franlin
Gaston
2010 Burdn: 3.90%2009 Burdn: 3.76%
2008 Burdn: 4.22%
Chang FY09-10: 3.58%Ran: 59 (2010), 70 (2009)
Population: 53,659Pr-Capita Incom: $29,155
Ran: 50 (Pop.), 68 (PCI)
2010 Burdn: 5.57%2009 Burdn: 5.41%2008 Burdn: 5.59%
Chang FY09-10: 3.11%Ran: 7 (2010), 7 (2009)
Population: 266,132
Pr-Capita Incom: $38,692Ran: 6 (Pop.), 8 (PCI)
2010 Burdn: 5.21%2009 Burdn: 5.10%2008 Burdn: 5.22%
Chang FY09-10: 2.20%Ran: 13 (2010), 14 (2009)
Population: 51,327Pr-Capita Incom: $28,973
Ran: 52 (Pop.), 72 (PCI)
2010 Burdn: 4.97%
2009 Burdn: 4.47%2008 Burdn: 4.84%
Chang FY09-10: 11.33%Ran: 18 (2010), 41 (2009)
Population: 355,575Pr-Capita Incom: $36,091
Ran: 4 (Pop.), 17 (PCI)
2010 Burdn: 3.84%2009 Burdn: 4.03%2008 Burdn: 4.16%
Chang FY09-10: -4.78%Ran: 61 (2010), 61 (2009)
Population: 59,191Pr-Capita Incom: $29,228Ran: 43 (Pop.), 67 (PCI)
2010 Burdn: 4.55%2009 Burdn: 4.66%2008 Burdn: 4.74%
Chang FY09-10: -2.45%Ran: 30 (2010), 30 (2009)
Population: 207,234Pr-Capita Incom: $32,171
Ran: 8 (Pop.), 34 (PCI)
County Rv./Incom2.83% (49)
County Rv. Pr Cap.
$825.74 (63)Proprty Tax/Incom
1.65% (67)Proprty Tax Pr Cap.
$482.90 (63)Sals Tax/Incom
0.53% (63)Sals Tax Pr Capita
$153.82 (63)
County Rv./Incom2.69% (65)
County Rv. Pr Cap.$1,076.03 (23)
Proprty Tax/Incom2.04% (29)
Proprty Tax Pr Cap.$814.62 (23)
Sals Tax/Incom
0.46% (23)Sals Tax Pr Capita
$183.13 (23)
County Rv./Incom2.76% (58)
County Rv. Pr Cap.$794.43 (75)
Proprty Tax/Incom1.64% (71)
Proprty Tax Pr Cap.$470.15 (75)
Sals Tax/Incom0.44% (75)
Sals Tax Pr Capita$126.36 (75)
County Rv./Incom2.43% (83)
County Rv. Pr Cap.$933.45 (46)
Proprty Tax/Incom1.71% (59)
Proprty Tax Pr Cap.$656.63 (46)
Sals Tax/Incom0.43% (46)
Sals Tax Pr Capita$166.07 (46)
County Rv./Incom3.19% (28)
County Rv. Pr Cap.$949.27 (42)
Proprty Tax/Incom2.02% (32)
Proprty Tax Pr Cap.$601.26 (42)
Sals Tax/Incom0.56% (42)Sals Tax Pr Capita
$166.35 (42)
County Rv./Incom2.79% (53)
County Rv. Pr Cap.$920.88 (47)
Proprty Tax/Incom1.88% (41)
Proprty Tax Pr Cap.$619.64 (47)
Sals Tax/Incom0.45% (47)
Sals Tax Pr Capita$148.70 (47)
Bulavill 1,091 (74)Calypso 445 (110)Faison 781 (—)
Grnvrs 589 (—)knansvill 1,256 (—)Magnolia 1,014 (121)Ros Hill 1,396 (66)Tachy 417 (88)Wallac 3,588 (65)Warsaw 3,224 (90)
Durham 234,140 (6)
Conto 343 (152)Lggtt 62 (126)MacClsfld 401 (76)Pintops 1,259 (115)Princvill 2,412 (—)Spd 59 (116)Tarboro 10,292 (46)Whitars 757 (60)
Bthania 397 (64)Clmmons 18,695 (80)
krnrsvill 22,997 (22)Lwisvill 13,993 (79)Rural Hall 2,903 (92)Tobaccovill 2,796 (150)Walrtown 5,042 (78)Winston-Salm 235,073 (14)
Bunn 406 (—)Cntrvill 110 (167)Franlinton 2,523 (—)Louisburg 3,711 (62)Youngsvill 1,245 (32)
Blmont 10,461 (45)Bssmr City 5,637 (54)Chrryvill 5,795 (65)Cramrton 3,504 (47)Dallas 4,033 (—)Gastonia 75,280 (27)High Shoals 812 (—)Lowll 2,779 (85)McAdnvill 606 (39)Mount Holly 11,787 (41)Ranlo 3,369 (129)Spncr Mountain 53 (165)Stanly 3,272 (70)
County Rv./Incom2.69% (57)
County Rv. Pr Cap.
$784.71 (65)Proprty Tax/Incom
1.67% (72)Proprty Tax Pr Cap.
$486.33 (78)Sals Tax/Incom
0.40% (58)Sals Tax Pr Capita
$117.09 (68)
County Rv./Incom2.73% (51)
County Rv. Pr Cap.$1,054.46 (21)
Proprty Tax/Incom2.09% (33)
Proprty Tax Pr Cap.$810.01 (13)
Sals Tax/Incom
0.40% (56)Sals Tax Pr Capita
$156.60 (23)
County Rv./Incom2.82% (41)
County Rv. Pr Cap.$818.07 (55)
Proprty Tax/Incom1.86% (52)
Proprty Tax Pr Cap.$538.90 (54)
Sals Tax/Incom0.29% (92)
Sals Tax Pr Capita$83.60 (95)
County Rv./Incom2.55% (67)
County Rv. Pr Cap.$919.21 (38)
Proprty Tax/Incom1.82% (56)
Proprty Tax Pr Cap.$658.28 (34)
Sals Tax/Incom0.39% (61)
Sals Tax Pr Capita$139.87 (42)
County Rv./Incom3.15% (25)
County Rv. Pr Cap.$920.68 (37)
Proprty Tax/Incom2.16% (27)
Proprty Tax Pr Cap.$631.72 (41)
Sals Tax/Incom0.42% (53)Sals Tax Pr Capita
$123.78 (60)
County Rv./Incom2.70% (55)
County Rv. Pr Cap.$868.75 (45)
Proprty Tax/Incom1.91% (44)
Proprty Tax Pr Cap.$613.98 (44)
Sals Tax/Incom0.34% (82)
Sals Tax Pr Capita$109.29 (79)

8/2/2019 By the Numbers: What Government Costs in North Carolina Cities and Counties FY 2010
http://slidepdf.com/reader/full/by-the-numbers-what-government-costs-in-north-carolina-cities-and-counties 18/46
17
p o l i c y r e p o r t
by the numbers | APPeNDIX A: COUNTY-BY-COUNTY DATA
oVerall data 2010 data 2009 data 2010 mun. population COMBINEDCOUNTY COUNTYONLY COUNTYONLY (RANKINCOMBINEDLOCAL
county ANDMUNICIPAL (RANK) (RANK) REVENUEPERCAPITA)*
* Rank within relevant population range.
Gats
Graham
Granvill
Grn
Guilord
Haliax
2010 Burdn: 3.05%2009 Burdn: 3.13%
2008 Burdn: 3.27%
Chang FY09-10: -2.77%Ran: 90 (2010), 93 (2009)
Population: 11,814Pr-Capita Incom: $26,724
Ran: 93 (Pop.), 90 (PCI)
2010 Burdn: 4.69%2009 Burdn: 1.43%
2008 Burdn: —
Chang FY09-10: —Ran: 26 (2010), — (2009)
Population: 8,327
Pr-Capita Incom: $26,089Ran: 98 (Pop.), 95 (PCI)
2010 Burdn: 3.57%2009 Burdn: 3.70%2008 Burdn: 4.03%
Chang FY09-10: -3.71%Ran: 70 (2010), 73 (2009)
Population: 57,434Pr-Capita Incom: $27,831
Ran: 46 (Pop.), 82 (PCI)
2010 Burdn: 3.02%
2009 Burdn: 3.46%2008 Burdn: 3.41%
Chang FY09-10: -12.74%Ran: 91 (2010), 82 (2009)
Population: 21,384Pr-Capita Incom: $26,520
Ran: 79 (Pop.), 91 (PCI)
2010 Burdn: 5.16%2009 Burdn: 5.12%2008 Burdn: 5.22%
Chang FY09-10: 0.72%Ran: 14 (2010), 13 (2009)
Population: 475,953Pr-Capita Incom: $37,658Ran: 3 (Pop.), 11 (PCI)
2010 Burdn: 4.28%2009 Burdn: 4.55%2008 Burdn: 4.79%
Chang FY09-10: -6.09%Ran: 40 (2010), 39 (2009)
Population: 55,173Pr-Capita Incom: $28,173
Ran: 49 (Pop.), 79 (PCI)
County Rv./Incom2.75% (48)
County Rv. Pr Cap.
$735.36 (79)Proprty Tax/Incom
1.90% (45)Proprty Tax Pr Cap.
$506.53 (67)Sals Tax/Incom
0.39% (60)Sals Tax Pr Capita
$103.95 (82)
County Rv./Incom3.92% (9)
County Rv. Pr Cap.$1,023.30 (26)
Proprty Tax/Incom2.29% (19)
Proprty Tax Pr Cap.$596.71 (46)
Sals Tax/Incom
0.59% (11)Sals Tax Pr Capita
$153.02 (29)
County Rv./Incom2.58% (63)
County Rv. Pr Cap.$718.00 (82)
Proprty Tax/Incom1.89% (48)
Proprty Tax Pr Cap.$524.86 (61)
Sals Tax/Incom0.35% (79)
Sals Tax Pr Capita$96.62 (91)
County Rv./Incom2.34% (84)
County Rv. Pr Cap.$620.23 (94)
Proprty Tax/Incom1.48% (86)
Proprty Tax Pr Cap.$392.47 (95)
Sals Tax/Incom0.37% (67)
Sals Tax Pr Capita$99.02 (89)
County Rv./Incom2.49% (72)
County Rv. Pr Cap.$936.49 (35)
Proprty Tax/Incom1.89% (47)
Proprty Tax Pr Cap.$711.99 (27)
Sals Tax/Incom0.35% (78)Sals Tax Pr Capita
$131.84 (53)
County Rv./Incom2.85% (38)
County Rv. Pr Cap.$801.72 (62)
Proprty Tax/Incom1.87% (50)
Proprty Tax Pr Cap.$526.46 (60)
Sals Tax/Incom0.44% (46)
Sals Tax Pr Capita$122.62 (62)
County Rv./Incom2.77% (56)
County Rv. Pr Cap.
$736.91 (85)Proprty Tax/Incom
1.77% (52)Proprty Tax Pr Cap.
$469.36 (85)Sals Tax/Incom
0.56% (85)Sals Tax Pr Capita
$148.26 (85)
Data not available
Graham County had notsubmittd th AFIR rportor FY 2009 that was du toth Stat Traurr’s ofc onOct. 31, 2009.
County Rv./Incom2.57% (74)
County Rv. Pr Cap.$729.00 (88)
Proprty Tax/Incom1.74% (56)
Proprty Tax Pr Cap.$492.49 (88)
Sals Tax/Incom0.49% (88)
Sals Tax Pr Capita$138.81 (88)
County Rv./Incom2.59% (73)
County Rv. Pr Cap.$687.01 (94)
Proprty Tax/Incom1.49% (82)
Proprty Tax Pr Cap.$395.18 (94)
Sals Tax/Incom0.54% (94)
Sals Tax Pr Capita$143.56 (94)
County Rv./Incom2.51% (76)
County Rv. Pr Cap.$983.75 (36)
Proprty Tax/Incom1.85% (45)
Proprty Tax Pr Cap.$723.79 (36)
Sals Tax/Incom0.40% (36)Sals Tax Pr Capita
$157.59 (36)
County Rv./Incom2.96% (38)
County Rv. Pr Cap.$829.02 (62)
Proprty Tax/Incom1.77% (53)
Proprty Tax Pr Cap.$493.76 (62)
Sals Tax/Incom0.59% (62)
Sals Tax Pr Capita$165.32 (62)
Gatsvill 293 (—)
Robbinsvill 749 (22)Santtlah 73 (14)
Crdmoor 3,296 (55)Oxord 9,447 (63)Stm 382 (107)Stovall 397 (114)
Hoorton 487 (—)Snow Hill 1,696 (146)
Walstonburg 232 (141)
Grnsboro 268,917 (10)High Point 102,214 (13)Jamstown 3,410 (35)Oa Ridg 4,949 (137)Plasant Gardn 5,356 (86)Sdalia 682 (129)Stosdal 3,885 (153)Summrfld 8,051 (87)
Whitstt 769 (155)
enfld 2,221 (116)Haliax 331 (97)Hobgood 381 (124)Littlton 666 (77)Roano Rapids 16,572 (51)Scotland Nc 2,182 (—)Wldon 1,712 (33)

8/2/2019 By the Numbers: What Government Costs in North Carolina Cities and Counties FY 2010
http://slidepdf.com/reader/full/by-the-numbers-what-government-costs-in-north-carolina-cities-and-counties 19/46
18
j o h n l o c k e f o u n d a t i o n
oVerall data 2010 data 2009 data 2010 mun. population COMBINEDCOUNTY COUNTYONLY COUNTYONLY (RANKINCOMBINEDLOCAL
county ANDMUNICIPAL (RANK) (RANK) REVENUEPERCAPITA)*
by the numbers | APPeNDIX A: COUNTY-BY-COUNTY DATA
Harntt
Haywood
Hndrson
Hrtord
Ho
Hyd
County Rv./Incom Incomplete data
County Rv. Pr Cap.
Incomplete dataProprty Tax/Incom
1.78% (57)Proprty Tax Pr Cap.
$491.01 (76)Sals Tax/Incom
0.40% (59)Sals Tax Pr Capita
$109.60 (78)
County Rv./Incom3.23% (22)
County Rv. Pr Cap.$1,017.83 (28)
Proprty Tax/Incom2.23% (24)
Proprty Tax Pr Cap.$703.73 (28)
Sals Tax/Incom
0.57% (13)Sals Tax Pr Capita
$180.46 (13)
County Rv./Incom2.57% (64)
County Rv. Pr Cap.$934.29 (36)
Proprty Tax/Incom1.75% (62)
Proprty Tax Pr Cap.$637.08 (40)
Sals Tax/Incom0.43% (52)
Sals Tax Pr Capita$154.58 (28)
County Rv./Incom2.40% (80)
County Rv. Pr Cap.$688.68 (87)
Proprty Tax/Incom1.59% (78)
Proprty Tax Pr Cap.$454.78 (84)
Sals Tax/Incom0.50% (26)
Sals Tax Pr Capita$143.33 (39)
Data not available
Ho County had notsubmittd th AFIR rportor FY 2010 that was du toth Stat Traurr’s ofc onOct. 31, 2010.
County Rv./Incom6.17% (2)
County Rv. Pr Cap.$1,750.03 (3)
Proprty Tax/Incom3.74% (2)
Proprty Tax Pr Cap.$1,059.64 (3)
Sals Tax/Incom0.68% (4)
Sals Tax Pr Capita$191.83 (10)
County Rv./Incom3.52% (17)
County Rv. Pr Cap.
$1,014.62 (33)Proprty Tax/Incom
1.50% (80)Proprty Tax Pr Cap.
$432.72 (33)Sals Tax/Incom
0.53% (33)Sals Tax Pr Capita
$152.43 (33)
County Rv./Incom3.21% (27)
County Rv. Pr Cap.$1,033.73 (32)
Proprty Tax/Incom2.11% (25)
Proprty Tax Pr Cap.$678.00 (32)
Sals Tax/Incom
0.60% (32)Sals Tax Pr Capita
$193.96 (32)
County Rv./Incom2.70% (64)
County Rv. Pr Cap.$1,010.65 (34)
Proprty Tax/Incom1.72% (58)
Proprty Tax Pr Cap.$643.65 (34)
Sals Tax/Incom0.54% (34)
Sals Tax Pr Capita$201.57 (34)
County Rv./Incom2.71% (62)
County Rv. Pr Cap.$766.20 (78)
Proprty Tax/Incom1.70% (64)
Proprty Tax Pr Cap.$478.84 (78)
Sals Tax/Incom0.65% (78)
Sals Tax Pr Capita$184.24 (78)
Data not available
Ho County had notsubmittd th AFIR rportor FY 2009 that was du toth Stat Traurr’s ofc onOct. 31, 2009.
County Rv./Incom6.28% (2)
County Rv. Pr Cap.$1,823.38 (3)
Proprty Tax/Incom3.72% (2)
Proprty Tax Pr Cap.$1,078.82 (3)
Sals Tax/Incom1.10% (3)
Sals Tax Pr Capita$319.88 (3)
Angir 4,465 (—)Coats 2,180 (—)Dunn 10,377 (—)
erwin 5,051 (—)Lillington 3,300 (—)
Canton 4,097 (29)Clyd 1,401 (51)Maggi Vally 1,602 (16)Waynsvill 10,144 (15)
Flat Roc 3,318 (123)Fltchr 6,531 (49)Hndrsonvill 13,135 (28)Laurl Par 2,290 (52)Mills Rivr 6,539 (—)
Ahosi 5,189 (67)Cofld 323 (113)
Como 71 (82)Harrllsvill 97 (140)Murrsboro 2,622 (122)Winton 957 (143)
Raord 4,412 (—)
No incorporatd municipalitis.
2010 Burdn: —2009 Burdn: 4.81%
2008 Burdn: 4.61%
Chang FY09-10: —Ran: — (2010), 21 (2009)
Population: 112,844Pr-Capita Incom: $27,514
Ran: 24 (Pop.), 85 (PCI)
2010 Burdn: 4.52%2009 Burdn: 4.56%2008 Burdn: 4.70%
Chang FY09-10: -0.93%Ran: 31 (2010), 37 (2009)
Population: 58,028
Pr-Capita Incom: $31,552Ran: 45 (Pop.), 40 (PCI)
2010 Burdn: 3.37%2009 Burdn: 3.51%2008 Burdn: 3.91%
Chang FY09-10: -3.91%Ran: 81 (2010), 80 (2009)
Population: 105,221Pr-Capita Incom: $36,355
Ran: 26 (Pop.), 15 (PCI)
2010 Burdn: 4.03%
2009 Burdn: 4.36%2008 Burdn: 4.63%
Chang FY09-10: -7.59%Ran: 54 (2010), 45 (2009)
Population: 24,010Pr-Capita Incom: $28,673
Ran: 75 (Pop.), 76 (PCI)
2010 Burdn: —2009 Burdn: 0.44%
2008 Burdn: —
Chang FY09-10: —Ran: — (2010), — (2009)
Population: 46,134Pr-Capita Incom: $28,997Ran: 56 (Pop.), 70 (PCI)
2010 Burdn: 7.23%2009 Burdn: 7.29%2008 Burdn: 7.59%
Chang FY09-10: -0.84%Ran: 2 (2010), 3 (2009)
Population: 5,391Pr-Capita Incom: $28,370
Ran: 99 (Pop.), 78 (PCI)
8/2/2019 By the Numbers: What Government Costs in North Carolina Cities and Counties FY 2010
http://slidepdf.com/reader/full/by-the-numbers-what-government-costs-in-north-carolina-cities-and-counties 20/46
19
p o l i c y r e p o r t
by the numbers | APPeNDIX A: COUNTY-BY-COUNTY DATA
oVerall data 2010 data 2009 data 2010 mun. population COMBINEDCOUNTY COUNTYONLY COUNTYONLY (RANKINCOMBINEDLOCAL
county ANDMUNICIPAL (RANK) (RANK) REVENUEPERCAPITA)*
* Rank within relevant population range.
Irdll
Jacson
Johnston
Jons
L
Lnoir
2010 Burdn: 4.45%2009 Burdn: 4.52%
2008 Burdn: 4.82%
Chang FY09-10: -1.68%Ran: 37 (2010), 40 (2009)
Population: 157,013Pr-Capita Incom: $32,171
Ran: 16 (Pop.), 34 (PCI)
2010 Burdn: 4.18%2009 Burdn: 4.33%2008 Burdn: 4.21%
Chang FY09-10: -3.36%Ran: 45 (2010), 48 (2009)
Population: 37,990
Pr-Capita Incom: $29,674Ran: 64 (Pop.), 63 (PCI)
2010 Burdn: 4.07%2009 Burdn: 4.15%2008 Burdn: 4.48%
Chang FY09-10: -1.77%Ran: 50 (2010), 55 (2009)
Population: 168,217Pr-Capita Incom: $31,480
Ran: 13 (Pop.), 41 (PCI)
2010 Burdn: 2.87%
2009 Burdn: 2.81%2008 Burdn: 2.92%
Chang FY09-10: 2.34%Ran: 95 (2010), 97 (2009)
Population: 10,150Pr-Capita Incom: $32,724
Ran: 96 (Pop.), 29 (PCI)
2010 Burdn: 4.88%2009 Burdn: 4.90%2008 Burdn: 5.08%
Chang FY09-10: -0.46%Ran: 19 (2010), 17 (2009)
Population: 58,563Pr-Capita Incom: $30,505Ran: 44 (Pop.), 50 (PCI)
2010 Burdn: 4.06%2009 Burdn: 4.02%2008 Burdn: 4.23%
Chang FY09-10: 0.81%Ran: 51 (2010), 63 (2009)
Population: 57,221Pr-Capita Incom: $33,476
Ran: 47 (Pop.), 25 (PCI)
Harmony 618 (16)Lov Vally 113 (87)Moorsvill 30,797 (5)
Statsvill 27,322 (24)Troutman 2,289 (38)
Dillsboro 269 (28)Forst Hills 359 (75)Sylva 2,601 (23)Wbstr 602 (85)
Bnson 3,703 (—)Clayton 14,333 (27)Four Oas 1,995 (124)knly 2,030 (84)Micro 557 (98)Pin Lvl 1,978 (125)Princton 1,443 (120)Slma 7,671 (70)Smithfld 13,410 (26)Wilson’s Mills 2,078 (145)
Maysvill 980 (134)Pollocsvill 254 (120)
Trnton 230 (138)
Broadway 1,117 (68)Sanord 28,249 (26)
kinston 22,478 (39)La Grang 2,774 (106)Pin Hill 520 (42)
County Rv./Incom2.68% (59)
County Rv. Pr Cap.
$863.04 (46)Proprty Tax/Incom
1.95% (42)Proprty Tax Pr Cap.
$628.81 (42)Sals Tax/Incom
0.46% (39)Sals Tax Pr Capita
$146.97 (33)
County Rv./Incom3.95% (7)
County Rv. Pr Cap.$1,172.61 (12)
Proprty Tax/Incom2.74% (8)
Proprty Tax Pr Cap.$813.02 (12)
Sals Tax/Incom
0.67% (5)Sals Tax Pr Capita
$197.55 (8)
County Rv./Incom2.63% (61)
County Rv. Pr Cap.$827.10 (54)
Proprty Tax/Incom1.84% (54)
Proprty Tax Pr Cap.$579.54 (49)
Sals Tax/Incom0.44% (45)
Sals Tax Pr Capita$138.23 (47)
County Rv./Incom2.26% (88)
County Rv. Pr Cap.$740.71 (77)
Proprty Tax/Incom1.54% (80)
Proprty Tax Pr Cap.$505.20 (69)
Sals Tax/Incom0.37% (70)
Sals Tax Pr Capita$119.77 (66)
County Rv./Incom2.83% (40)
County Rv. Pr Cap.$862.66 (47)
Proprty Tax/Incom2.15% (29)
Proprty Tax Pr Cap.$656.76 (35)
Sals Tax/Incom0.42% (54)Sals Tax Pr Capita
$126.84 (57)
County Rv./Incom2.43% (76)
County Rv. Pr Cap.$812.15 (57)
Proprty Tax/Incom1.64% (74)
Proprty Tax Pr Cap.$548.96 (52)
Sals Tax/Incom0.43% (51)
Sals Tax Pr Capita$142.50 (40)
County Rv./Incom2.86% (46)
County Rv. Pr Cap.
$965.32 (38)Proprty Tax/Incom
1.87% (42)Proprty Tax Pr Cap.
$630.47 (38)Sals Tax/Incom
0.57% (38)Sals Tax Pr Capita
$191.79 (38)
County Rv./Incom4.11% (9)
County Rv. Pr Cap.$1,254.10 (10)
Proprty Tax/Incom2.68% (9)
Proprty Tax Pr Cap.$817.50 (10)
Sals Tax/Incom
0.82% (10)Sals Tax Pr Capita
$250.39 (10)
County Rv./Incom2.70% (63)
County Rv. Pr Cap.$891.77 (51)
Proprty Tax/Incom1.80% (48)
Proprty Tax Pr Cap.$592.66 (51)
Sals Tax/Incom0.54% (51)
Sals Tax Pr Capita$178.59 (51)
County Rv./Incom2.24% (93)
County Rv. Pr Cap.$718.85 (90)
Proprty Tax/Incom1.53% (77)
Proprty Tax Pr Cap.$490.62 (90)
Sals Tax/Incom0.44% (90)
Sals Tax Pr Capita$141.92 (90)
County Rv./Incom2.89% (43)
County Rv. Pr Cap.$917.50 (48)
Proprty Tax/Incom2.13% (24)
Proprty Tax Pr Cap.$675.69 (48)
Sals Tax/Incom0.50% (48)Sals Tax Pr Capita
$158.43 (48)
County Rv./Incom2.50% (78)
County Rv. Pr Cap.$836.14 (59)
Proprty Tax/Incom1.58% (75)
Proprty Tax Pr Cap.$529.09 (59)
Sals Tax/Incom0.50% (59)
Sals Tax Pr Capita$165.50 (59)

8/2/2019 By the Numbers: What Government Costs in North Carolina Cities and Counties FY 2010
http://slidepdf.com/reader/full/by-the-numbers-what-government-costs-in-north-carolina-cities-and-counties 21/46
20
j o h n l o c k e f o u n d a t i o n
oVerall data 2010 data 2009 data 2010 mun. population COMBINEDCOUNTY COUNTYONLY COUNTYONLY (RANKINCOMBINEDLOCAL
county ANDMUNICIPAL (RANK) (RANK) REVENUEPERCAPITA)*
by the numbers | APPeNDIX A: COUNTY-BY-COUNTY DATA
Lincoln
Macon
Madison
Martin
McDowll
Mclnburg
2010 Burdn: 4.00%2009 Burdn: 4.12%
2008 Burdn: 4.22%
Chang FY09-10: -3.00%Ran: 56 (2010), 58 (2009)
Population: 75,702Pr-Capita Incom: $33,375
Ran: 35 (Pop.), 26 (PCI)
2010 Burdn: 5.07%2009 Burdn: 5.06%2008 Burdn: 5.18%
Chang FY09-10: 0.25%Ran: 16 (2010), 15 (2009)
Population: 34,494
Pr-Capita Incom: $30,699Ran: 67 (Pop.), 46 (PCI)
2010 Burdn: 3.25%2009 Burdn: 3.40%2008 Burdn: 3.39%
Chang FY09-10: -4.50%Ran: 86 (2010), 85 (2009)
Population: 20,846Pr-Capita Incom: $27,823
Ran: 81 (Pop.), 83 (PCI)
2010 Burdn: 4.03%
2009 Burdn: 4.26%2008 Burdn: 4.40%
Chang FY09-10: -5.37%Ran: 53 (2010), 51 (2009)
Population: 23,855Pr-Capita Incom: $31,833
Ran: 76 (Pop.), 36 (PCI)
2010 Burdn: 3.67%2009 Burdn: 3.59%2008 Burdn: 3.85%
Chang FY09-10: 2.26%Ran: 67 (2010), 76 (2009)
Population: 44,742Pr-Capita Incom: $25,797Ran: 58 (Pop.), 96 (PCI)
2010 Burdn: 5.77%2009 Burdn: 5.38%2008 Burdn: 5.83%
Chang FY09-10: 7.23%Ran: 5 (2010), 8 (2009)
Population: 894,290Pr-Capita Incom: $42,644
Ran: 1 (Pop.), 3 (PCI)
County Rv./Incom3.16% (24)
County Rv. Pr Cap.
$1,053.70 (22)Proprty Tax/Incom
2.21% (25)Proprty Tax Pr Cap.
$737.13 (21)Sals Tax/Incom
0.43% (48)Sals Tax Pr Capita
$144.16 (37)
County Rv./Incom3.93% (8)
County Rv. Pr Cap.$1,206.95 (7)
Proprty Tax/Incom2.54% (10)
Proprty Tax Pr Cap.$778.78 (17)
Sals Tax/Incom
0.66% (6)Sals Tax Pr Capita
$204.00 (5)
County Rv./Incom2.78% (45)
County Rv. Pr Cap.$774.57 (67)
Proprty Tax/Incom1.77% (60)
Proprty Tax Pr Cap.$493.58 (75)
Sals Tax/Incom0.38% (66)
Sals Tax Pr Capita$105.42 (81)
County Rv./Incom2.68% (58)
County Rv. Pr Cap.$854.44 (51)
Proprty Tax/Incom1.68% (70)
Proprty Tax Pr Cap.$533.31 (55)
Sals Tax/Incom0.52% (25)
Sals Tax Pr Capita$166.52 (19)
County Rv./Incom2.70% (54)
County Rv. Pr Cap.$697.28 (85)
Proprty Tax/Incom1.60% (77)
Proprty Tax Pr Cap.$411.63 (93)
Sals Tax/Incom0.57% (14)Sals Tax Pr Capita
$146.86 (34)
County Rv./Incom3.00% (32)
County Rv. Pr Cap.$1,278.03 (5)
Proprty Tax/Incom2.23% (23)
Proprty Tax Pr Cap.$952.49 (5)
Sals Tax/Incom0.49% (33)
Sals Tax Pr Capita$208.84 (3)
County Rv./Incom4.21% (6)
County Rv. Pr Cap.
$1,101.05 (19)Proprty Tax/Incom
2.84% (7)Proprty Tax Pr Cap.
$740.86 (19)Sals Tax/Incom
0.72% (19)Sals Tax Pr Capita
$187.43 (19)
County Rv./Incom4.01% (10)
County Rv. Pr Cap.$1,268.84 (8)
Proprty Tax/Incom2.47% (11)
Proprty Tax Pr Cap.$781.99 (8)
Sals Tax/Incom
0.77% (8)Sals Tax Pr Capita
$243.02 (8)
County Rv./Incom2.94% (40)
County Rv. Pr Cap.$825.54 (64)
Proprty Tax/Incom1.77% (51)
Proprty Tax Pr Cap.$497.02 (64)
Sals Tax/Incom0.51% (64)
Sals Tax Pr Capita$142.41 (64)
County Rv./Incom2.76% (59)
County Rv. Pr Cap.$934.18 (45)
Proprty Tax/Incom1.70% (61)
Proprty Tax Pr Cap.$575.86 (45)
Sals Tax/Incom0.56% (45)
Sals Tax Pr Capita$190.44 (45)
County Rv./Incom2.38% (87)
County Rv. Pr Cap.$744.47 (83)
Proprty Tax/Incom1.33% (93)
Proprty Tax Pr Cap.$415.71 (83)
Sals Tax/Incom0.62% (83)Sals Tax Pr Capita
$192.46 (83)
County Rv./Incom2.84% (48)
County Rv. Pr Cap.$1,324.19 (7)
Proprty Tax/Incom2.06% (28)
Proprty Tax Pr Cap.$960.86 (7)
Sals Tax/Incom0.49% (7)
Sals Tax Pr Capita$230.62 (7)
Lincolnton 11,543 (29)
Franlin 3,899 (28)Highlands 985 (7)
Hot Springs 677 (—)Mars Hill 1,938 (95)Marshall 841 (65)
Bar Grass 91 (145)evrtts 176 (135)
Hamilton 459 (128)Hassll 67 (156)Jamsvill 448 (106)Oa City 351 (—)Parml 266 (—)Robrsonvill 1,578 (81)Williamston 5,649 (42)
Marion 7,481 (34)Old Fort 983 (92)
Charlott 711,349 (1)Cornlius 24,847 (6)Davidson 10,822 (16)Huntrsvill 41,216 (11)Matthws 29,209 (20)Mint Hill 21,048 (36)Pinvill 7,747 (4)

8/2/2019 By the Numbers: What Government Costs in North Carolina Cities and Counties FY 2010
http://slidepdf.com/reader/full/by-the-numbers-what-government-costs-in-north-carolina-cities-and-counties 22/46
21
p o l i c y r e p o r t
by the numbers | APPeNDIX A: COUNTY-BY-COUNTY DATA
oVerall data 2010 data 2009 data 2010 mun. population COMBINEDCOUNTY COUNTYONLY COUNTYONLY (RANKINCOMBINEDLOCAL
county ANDMUNICIPAL (RANK) (RANK) REVENUEPERCAPITA)*
* Rank within relevant population range.
Mitchll
Montgomry
Moor
Nash
Nw Hanovr
Northampton
2010 Burdn: 4.15%2009 Burdn: 3.81%
2008 Burdn: 3.96%
Chang FY09-10: 8.87%Ran: 46 (2010), 68 (2009)
Population: 15,976Pr-Capita Incom: $26,418
Ran: 87 (Pop.), 92 (PCI)
2010 Burdn: 4.32%2009 Burdn: 4.56%2008 Burdn: 4.59%
Chang FY09-10: -5.36%Ran: 39 (2010), 36 (2009)
Population: 27,983
Pr-Capita Incom: $26,375Ran: 71 (Pop.), 93 (PCI)
2010 Burdn: 4.14%2009 Burdn: 4.11%2008 Burdn: 4.31%
Chang FY09-10: 0.69%Ran: 48 (2010), 59 (2009)
Population: 86,945Pr-Capita Incom: $38,539
Ran: 32 (Pop.), 9 (PCI)
2010 Burdn: 4.22%
2009 Burdn: 3.89%2008 Burdn: 4.26%
Chang FY09-10: 8.61%Ran: 43 (2010), 67 (2009)
Population: 95,804Pr-Capita Incom: $33,557
Ran: 29 (Pop.), 24 (PCI)
2010 Burdn: 5.01%2009 Burdn: 4.86%2008 Burdn: 5.92%
Chang FY09-10: 3.04%Ran: 17 (2010), 19 (2009)
Population: 194,054Pr-Capita Incom: $36,662Ran: 10 (Pop.), 14 (PCI)
2010 Burdn: 4.25%2009 Burdn: 4.46%2008 Burdn: 4.97%
Chang FY09-10: -4.65%Ran: 41 (2010), 42 (2009)
Population: 21,018Pr-Capita Incom: $31,598
Ran: 80 (Pop.), 39 (PCI)
County Rv./Incom3.30% (19)
County Rv. Pr Cap.
$872.94 (44)Proprty Tax/Incom
2.10% (32)Proprty Tax Pr Cap.
$554.14 (51)Sals Tax/Incom
0.65% (8)Sals Tax Pr Capita
$171.11 (15)
County Rv./Incom2.86% (37)
County Rv. Pr Cap.$754.81 (73)
Proprty Tax/Incom2.02% (37)
Proprty Tax Pr Cap.$532.66 (56)
Sals Tax/Incom
0.38% (63)Sals Tax Pr Capita
$100.27 (87)
County Rv./Incom2.38% (82)
County Rv. Pr Cap.$916.37 (39)
Proprty Tax/Incom1.68% (69)
Proprty Tax Pr Cap.$646.24 (37)
Sals Tax/Incom0.37% (68)
Sals Tax Pr Capita$143.79 (38)
County Rv./Incom2.21% (90)
County Rv. Pr Cap.$739.97 (78)
Proprty Tax/Incom1.50% (82)
Proprty Tax Pr Cap.$503.92 (70)
Sals Tax/Incom0.37% (71)
Sals Tax Pr Capita$122.74 (61)
County Rv./Incom3.27% (21)
County Rv. Pr Cap.$1,197.26 (8)
Proprty Tax/Incom2.26% (21)
Proprty Tax Pr Cap.$828.09 (11)
Sals Tax/Incom0.56% (17)Sals Tax Pr Capita
$204.90 (4)
County Rv./Incom3.27% (20)
County Rv. Pr Cap.$1,033.72 (23)
Proprty Tax/Incom2.25% (22)
Proprty Tax Pr Cap.$712.05 (26)
Sals Tax/Incom0.25% (95)
Sals Tax Pr Capita$80.19 (96)
County Rv./Incom3.03% (33)
County Rv. Pr Cap.
$797.22 (74)Proprty Tax/Incom
1.59% (74)Proprty Tax Pr Cap.
$418.21 (74)Sals Tax/Incom
0.82% (74)Sals Tax Pr Capita
$215.43 (74)
County Rv./Incom2.82% (50)
County Rv. Pr Cap.$773.48 (77)
Proprty Tax/Incom1.86% (44)
Proprty Tax Pr Cap.$510.69 (77)
Sals Tax/Incom
0.52% (77)Sals Tax Pr Capita
$142.83 (77)
County Rv./Incom2.43% (82)
County Rv. Pr Cap.$977.41 (37)
Proprty Tax/Incom1.70% (63)
Proprty Tax Pr Cap.$681.20 (37)
Sals Tax/Incom0.45% (37)
Sals Tax Pr Capita$180.48 (37)
County Rv./Incom2.11% (96)
County Rv. Pr Cap.$717.08 (92)
Proprty Tax/Incom1.40% (89)
Proprty Tax Pr Cap.$475.25 (92)
Sals Tax/Incom0.46% (92)
Sals Tax Pr Capita$154.61 (92)
County Rv./Incom3.28% (22)
County Rv. Pr Cap.$1,257.42 (9)
Proprty Tax/Incom2.17% (21)
Proprty Tax Pr Cap.$831.69 (9)
Sals Tax/Incom0.63% (9)Sals Tax Pr Capita
$239.98 (9)
County Rv./Incom3.47% (18)
County Rv. Pr Cap.$1,075.36 (24)
Proprty Tax/Incom2.32% (16)
Proprty Tax Pr Cap.$720.95 (24)
Sals Tax/Incom0.39% (24)
Sals Tax Pr Capita$121.28 (24)
Barsvill 354 (24)Spruc Pin 2,020 (71)
Bisco 1,774 (—)Candor 847 (66)Mount Gilad 1,411 (99)Star 808 (90)Troy 4,297 (100)
Abrdn 5,301 (20)Camron 280 (34)Carthag 2,334 (45)Foxfr Villag 582 (19)Pinblu 1,403 (57)Pinhurst 12,119 (17)Robbins 1,332 (61)Southrn Pins 12,657 (19)Taylortown 994 (58)Vass 825 (46)Whispring Pins 2,542 (56)
Baily 735 (32)Castalia 383 (—)
Dortchs 890 (172)Middlsx 890 (70)Momyr 304 (162)Nashvill 4,947 (63)Rd Oa 3,058 (159)Rocy Mount 59,641 (22)Sharpsburg 2,645 (135)Spring Hop 1,328 (77)
Carolina Bach 5,987 (2)kur Bach 2,230 (15)Wilmington 102,207 (3)Wrightsvill Bach 2,696 (4)
Conway 696 (50)Garysburg 1,203 (93)Gaston 945 (55)Jacson 675 (63)Lasr 90 (89)Rich Squar 840 (43)Saboard 640 (73)Svrn 252 (25)Woodland 797 (40)

8/2/2019 By the Numbers: What Government Costs in North Carolina Cities and Counties FY 2010
http://slidepdf.com/reader/full/by-the-numbers-what-government-costs-in-north-carolina-cities-and-counties 23/46
22
j o h n l o c k e f o u n d a t i o n
oVerall data 2010 data 2009 data 2010 mun. population COMBINEDCOUNTY COUNTYONLY COUNTYONLY (RANKINCOMBINEDLOCAL
county ANDMUNICIPAL (RANK) (RANK) REVENUEPERCAPITA)*
by the numbers | APPeNDIX A: COUNTY-BY-COUNTY DATA
Onslow
Orang
Pamlico
Pasquotan
Pndr
Prquimans
2010 Burdn: 2.47%2009 Burdn: 2.83%
2008 Burdn: 2.79%
Chang FY09-10: -12.87%Ran: 97 (2010), 96 (2009)
Population: 179,455Pr-Capita Incom: $42,463
Ran: 11 (Pop.), 4 (PCI)
2010 Burdn: 4.63%2009 Burdn: 4.56%2008 Burdn: 4.68%
Chang FY09-10: 1.58%Ran: 27 (2010), 38 (2009)
Population: 132,272
Pr-Capita Incom: $47,925Ran: 21 (Pop.), 1 (PCI)
2010 Burdn: 3.30%2009 Burdn: 3.59%2008 Burdn: 3.76%
Chang FY09-10: -7.96%Ran: 84 (2010), 77 (2009)
Population: 12,838Pr-Capita Incom: $36,348
Ran: 92 (Pop.), 16 (PCI)
2010 Burdn: 5.09%
2009 Burdn: 5.41%2008 Burdn: 5.23%
Chang FY09-10: -5.93%Ran: 15 (2010), 6 (2009)
Population: 41,845Pr-Capita Incom: $27,075
Ran: 60 (Pop.), 86 (PCI)
2010 Burdn: 3.74%2009 Burdn: 4.57%2008 Burdn: 4.78%
Chang FY09-10: -18.16%Ran: 66 (2010), 34 (2009)
Population: 53,095Pr-Capita Incom: $29,520Ran: 51 (Pop.), 64 (PCI)
2010 Burdn: 3.77%2009 Burdn: 4.21%2008 Burdn: 4.20%
Chang FY09-10: -10.44%Ran: 65 (2010), 53 (2009)
Population: 12,980Pr-Capita Incom: $29,990
Ran: 91 (Pop.), 56 (PCI)
County Rv./Incom1.51% (97)
County Rv. Pr Cap.
$643.21 (93)Proprty Tax/Incom
0.91% (98)Proprty Tax Pr Cap.
$386.64 (96)Sals Tax/Incom
0.31% (89)Sals Tax Pr Capita
$133.19 (51)
County Rv./Incom2.78% (46)
County Rv. Pr Cap.$1,332.01 (4)
Proprty Tax/Incom2.16% (28)
Proprty Tax Pr Cap.$1,034.53 (4)
Sals Tax/Incom
0.24% (97)Sals Tax Pr Capita
$113.44 (73)
County Rv./Incom2.71% (52)
County Rv. Pr Cap.$984.80 (32)
Proprty Tax/Incom2.04% (36)
Proprty Tax Pr Cap.$742.82 (20)
Sals Tax/Incom0.38% (62)
Sals Tax Pr Capita$138.32 (46)
County Rv./Incom3.07% (29)
County Rv. Pr Cap.$830.35 (52)
Proprty Tax/Incom1.70% (66)
Proprty Tax Pr Cap.$460.91 (82)
Sals Tax/Incom0.54% (24)
Sals Tax Pr Capita$145.05 (36)
County Rv./Incom3.10% (27)
County Rv. Pr Cap.$916.10 (40)
Proprty Tax/Incom2.31% (17)
Proprty Tax Pr Cap.$682.46 (31)
Sals Tax/Incom0.40% (57)Sals Tax Pr Capita
$119.30 (67)
County Rv./Incom2.68% (60)
County Rv. Pr Cap.$804.36 (60)
Proprty Tax/Incom1.77% (61)
Proprty Tax Pr Cap.$531.91 (57)
Sals Tax/Incom0.32% (87)
Sals Tax Pr Capita$95.44 (93)
County Rv./Incom1.50% (98)
County Rv. Pr Cap.
$611.67 (98)Proprty Tax/Incom
0.81% (98)Proprty Tax Pr Cap.
$332.05 (98)Sals Tax/Incom
0.40% (98)Sals Tax Pr Capita
$163.74 (98)
County Rv./Incom2.78% (55)
County Rv. Pr Cap.$1,352.73 (4)
Proprty Tax/Incom2.10% (26)
Proprty Tax Pr Cap.$1,024.23 (4)
Sals Tax/Incom
0.29% (4)Sals Tax Pr Capita
$142.08 (4)
County Rv./Incom2.94% (41)
County Rv. Pr Cap.$1,078.95 (21)
Proprty Tax/Incom1.98% (36)
Proprty Tax Pr Cap.$726.45 (21)
Sals Tax/Incom0.59% (21)
Sals Tax Pr Capita$217.99 (21)
County Rv./Incom3.23% (25)
County Rv. Pr Cap.$895.33 (50)
Proprty Tax/Incom1.57% (76)
Proprty Tax Pr Cap.$434.08 (50)
Sals Tax/Incom0.64% (50)
Sals Tax Pr Capita$178.73 (50)
County Rv./Incom3.34% (21)
County Rv. Pr Cap.$996.15 (35)
Proprty Tax/Incom2.36% (15)
Proprty Tax Pr Cap.$703.97 (35)
Sals Tax/Incom0.54% (35)Sals Tax Pr Capita
$161.75 (35)
County Rv./Incom2.92% (42)
County Rv. Pr Cap.$875.23 (53)
Proprty Tax/Incom1.80% (47)
Proprty Tax Pr Cap.$540.68 (53)
Sals Tax/Incom0.49% (53)
Sals Tax Pr Capita$145.91 (53)
Holly Ridg 1,469 (34)Jacsonvill 81,612 (34)North Topsail Bach 930 (9)
Richlands 1,148 (118)Swansboro 2,306 (43)
Carrboro 19,891 (8)Chapl Hill 56,778 (2)Hillsborough 6,751 (5)
Allianc 784 (149)Arapaho 423 (—)Bayboro 1,283 (141)Grantsboro 848 (146)Msic 237 (117)Minnsott Bach 363 (51)Orintal 857 (29)Stonwall 279 (68)Vandmr 276 (100)
elizabth City 20,406 (50)
Atinson 266 (21)Burgaw 4,279 (69)St. Hlna 504 (122)Sur City 1,856 (—)Topsail Bach 596 (8)Watha 197 (125)
Hrtord 2,203 (165)Winall 610 (—)

8/2/2019 By the Numbers: What Government Costs in North Carolina Cities and Counties FY 2010
http://slidepdf.com/reader/full/by-the-numbers-what-government-costs-in-north-carolina-cities-and-counties 24/46
23
p o l i c y r e p o r t
by the numbers | APPeNDIX A: COUNTY-BY-COUNTY DATA
oVerall data 2010 data 2009 data 2010 mun. population COMBINEDCOUNTY COUNTYONLY COUNTYONLY (RANKINCOMBINEDLOCAL
county ANDMUNICIPAL (RANK) (RANK) REVENUEPERCAPITA)*
* Rank within relevant population range.
Prson
Pitt
Pol
Randolph
Richmond
Robson
2010 Burdn: 3.55%2009 Burdn: 4.63%
2008 Burdn: 4.90%
Chang FY09-10: -23.34%Ran: 72 (2010), 32 (2009)
Population: 38,272Pr-Capita Incom: $30,688
Ran: 62 (Pop.), 47 (PCI)
2010 Burdn: 5.32%2009 Burdn: 4.66%2008 Burdn: 4.56%
Chang FY09-10: 14.13%Ran: 12 (2010), 27 (2009)
Population: 158,541
Pr-Capita Incom: $33,089Ran: 15 (Pop.), 28 (PCI)
2010 Burdn: 3.59%2009 Burdn: 4.03%2008 Burdn: 3.62%
Chang FY09-10: -10.89%Ran: 69 (2010), 62 (2009)
Population: 19,355Pr-Capita Incom: $39,659
Ran: 84 (Pop.), 7 (PCI)
2010 Burdn: 3.39%
2009 Burdn: 3.50%2008 Burdn: 3.74%
Chang FY09-10: -3.29%Ran: 79 (2010), 81 (2009)
Population: 142,467Pr-Capita Incom: $28,717
Ran: 19 (Pop.), 75 (PCI)
2010 Burdn: 4.46%2009 Burdn: 4.73%2008 Burdn: 4.93%
Chang FY09-10: -5.75%Ran: 36 (2010), 24 (2009)
Population: 46,847Pr-Capita Incom: $26,959Ran: 54 (Pop.), 87 (PCI)
2010 Burdn: 4.04%2009 Burdn: 4.19%2008 Burdn: 4.51%
Chang FY09-10: -3.54%Ran: 52 (2010), 54 (2009)
Population: 131,080Pr-Capita Incom: $25,511
Ran: 22 (Pop.), 98 (PCI)
County Rv./Incom3.55% (12)
County Rv. Pr Cap.
$1,089.33 (17)Proprty Tax/Incom
2.35% (15)Proprty Tax Pr Cap.
$720.74 (25)Sals Tax/Incom
0.49% (32)Sals Tax Pr Capita
$150.47 (31)
County Rv./Incom2.41% (79)
County Rv. Pr Cap.$796.94 (63)
Proprty Tax/Incom1.50% (84)
Proprty Tax Pr Cap.$495.97 (74)
Sals Tax/Incom
0.45% (41)Sals Tax Pr Capita
$147.52 (32)
County Rv./Incom2.70% (56)
County Rv. Pr Cap.$1,070.92 (19)
Proprty Tax/Incom1.97% (40)
Proprty Tax Pr Cap.$781.25 (16)
Sals Tax/Incom0.29% (93)
Sals Tax Pr Capita$114.04 (71)
County Rv./Incom2.16% (92)
County Rv. Pr Cap.$619.62 (95)
Proprty Tax/Incom1.52% (81)
Proprty Tax Pr Cap.$437.02 (88)
Sals Tax/Incom0.36% (75)
Sals Tax Pr Capita$102.87 (84)
County Rv./Incom2.75% (50)
County Rv. Pr Cap.$740.83 (76)
Proprty Tax/Incom1.85% (53)
Proprty Tax Pr Cap.$497.49 (73)
Sals Tax/Incom0.43% (49)Sals Tax Pr Capita
$116.26 (70)
County Rv./Incom2.41% (78)
County Rv. Pr Cap.$614.57 (96)
Proprty Tax/Incom1.38% (93)
Proprty Tax Pr Cap.$353.23 (97)
Sals Tax/Incom0.48% (34)
Sals Tax Pr Capita$121.33 (64)
County Rv./Incom3.72% (13)
County Rv. Pr Cap.
$1,146.89 (16)Proprty Tax/Incom
2.36% (13)Proprty Tax Pr Cap.
$728.93 (16)Sals Tax/Incom
0.64% (16)Sals Tax Pr Capita
$197.82 (16)
County Rv./Incom2.36% (88)
County Rv. Pr Cap.$801.61 (71)
Proprty Tax/Incom1.49% (81)
Proprty Tax Pr Cap.$505.89 (71)
Sals Tax/Incom
0.45% (71)Sals Tax Pr Capita
$151.93 (71)
County Rv./Incom3.18% (29)
County Rv. Pr Cap.$1,325.45 (6)
Proprty Tax/Incom1.91% (40)
Proprty Tax Pr Cap.$795.14 (6)
Sals Tax/Incom0.39% (6)
Sals Tax Pr Capita$163.33 (6)
County Rv./Incom2.28% (91)
County Rv. Pr Cap.$668.08 (96)
Proprty Tax/Incom1.52% (79)
Proprty Tax Pr Cap.$446.26 (96)
Sals Tax/Incom0.49% (96)
Sals Tax Pr Capita$143.18 (96)
County Rv./Incom2.98% (37)
County Rv. Pr Cap.$800.70 (72)
Proprty Tax/Incom1.94% (38)
Proprty Tax Pr Cap.$521.90 (72)
Sals Tax/Incom0.58% (72)Sals Tax Pr Capita
$157.01 (72)
County Rv./Incom2.61% (71)
County Rv. Pr Cap.$671.66 (95)
Proprty Tax/Incom1.42% (88)
Proprty Tax Pr Cap.$363.92 (95)
Sals Tax/Incom0.67% (95)
Sals Tax Pr Capita$173.40 (95)
Roxboro 8,933 (—)
Aydn 4,987 (78)Bthl 1,824 (114)Falland 119 (118)Farmvill 4,715 (10)Fountain 586 (101)Grnvill 82,569 (7)Griton 2,386 (126)Grimsland 456 (111)Simpson 497 (—)
Wintrvill 9,154 (64)
Columbus 1,066 (30)Saluda 567 (17)Tryon 1,777 (22)
Archdal 9,858 (77)Ashboro 25,321 (31)
Franlinvill 1,430 (160)Librty 2,898 (128)Ramsur 1,755 (96)Randlman 4,487 (73)Sagrov 258 (69)Staly 368 (176)Trinity 7,016 (89)
Dobbins Hights 875 (144)ellrb 974 (99)Hamlt 5,820 (57)Homan 699 (166)Norman 71 (151)Rocingham 9,484 (62)
ROBeSON COUNTYFairmont 2,763 (136)Lumbr Bridg 121 (164)Lumbrton 23,039 (53)Maritta 159 (183)Maxton 2,523 (133)McDonald 129 (181)Orrum 76 (185)Parton 551 (136)Pmbro 2,837 (97)Proctorvill 128 (174)Raynham 93 (180)Rd Springs 3,497 (119)Rnnrt 355 (—)Rowland 1,174 (107)St. Pauls 2,368 (103)

8/2/2019 By the Numbers: What Government Costs in North Carolina Cities and Counties FY 2010
http://slidepdf.com/reader/full/by-the-numbers-what-government-costs-in-north-carolina-cities-and-counties 25/46
24
j o h n l o c k e f o u n d a t i o n
oVerall data 2010 data 2009 data 2010 mun. population COMBINEDCOUNTY COUNTYONLY COUNTYONLY (RANKINCOMBINEDLOCAL
county ANDMUNICIPAL (RANK) (RANK) REVENUEPERCAPITA)*
by the numbers | APPeNDIX A: COUNTY-BY-COUNTY DATA
Rocingham
Rowan
Ruthrord
Sampson
Scotland
Stanly
2010 Burdn: 4.08%2009 Burdn: 4.29%
2008 Burdn: 4.54%
Chang FY09-10: -4.92%Ran: 49 (2010), 50 (2009)
Population: 91,878Pr-Capita Incom: $30,435
Ran: 30 (Pop.), 53 (PCI)
2010 Burdn: 4.15%2009 Burdn: 4.24%2008 Burdn: 4.44%
Chang FY09-10: -2.18%Ran: 47 (2010), 52 (2009)
Population: 140,495
Pr-Capita Incom: $30,444Ran: 20 (Pop.), 52 (PCI)
2010 Burdn: 3.86%2009 Burdn: 4.30%2008 Burdn: 4.59%
Chang FY09-10: -10.33%Ran: 60 (2010), 49 (2009)
Population: 63,821Pr-Capita Incom: $26,820
Ran: 40 (Pop.), 89 (PCI)
2010 Burdn: —
2009 Burdn: 3.38%2008 Burdn: 3.81%
Chang FY09-10: —Ran: — (2010), 88 (2009)
Population: 65,406Pr-Capita Incom: $28,778
Ran: 38 (Pop.), 74 (PCI)
2010 Burdn: 4.21%2009 Burdn: 4.61%2008 Burdn: 4.95%
Chang FY09-10: -8.66%Ran: 44 (2010), 33 (2009)
Population: 36,926Pr-Capita Incom: $27,544Ran: 66 (Pop.), 84 (PCI)
2010 Burdn: 4.23%2009 Burdn: 4.34%2008 Burdn: 4.29%
Chang FY09-10: -2.33%Ran: 42 (2010), 46 (2009)
Population: 60,079Pr-Capita Incom: $29,965
Ran: 42 (Pop.), 57 (PCI)
County Rv./Incom2.47% (75)
County Rv. Pr Cap.
$752.30 (74)Proprty Tax/Incom
1.67% (71)Proprty Tax Pr Cap.
$508.15 (65)Sals Tax/Incom
0.36% (72)Sals Tax Pr Capita
$109.84 (76)
County Rv./Incom2.41% (77)
County Rv. Pr Cap.$734.31 (80)
Proprty Tax/Incom1.72% (64)
Proprty Tax Pr Cap.$523.12 (62)
Sals Tax/Incom
0.34% (83)Sals Tax Pr Capita
$103.21 (83)
County Rv./Incom2.88% (35)
County Rv. Pr Cap.$772.39 (70)
Proprty Tax/Incom1.89% (46)
Proprty Tax Pr Cap.$507.85 (66)
Sals Tax/Incom0.55% (21)
Sals Tax Pr Capita$146.83 (35)
Data not available
Sampson County had notsubmittd th AFIR rportor FY 2010 that was duto th Stat Traurr’s o-fc on Oct. 31, 2010.
County Rv./Incom2.87% (36)
County Rv. Pr Cap.$789.77 (64)
Proprty Tax/Incom1.88% (49)
Proprty Tax Pr Cap.$519.17 (63)
Sals Tax/Incom0.57% (15)Sals Tax Pr Capita
$155.97 (25)
County Rv./Incom2.53% (69)
County Rv. Pr Cap.$757.11 (72)
Proprty Tax/Incom1.67% (73)
Proprty Tax Pr Cap.$499.20 (71)
Sals Tax/Incom0.38% (64)
Sals Tax Pr Capita$113.88 (72)
County Rv./Incom2.65% (67)
County Rv. Pr Cap.
$815.86 (68)Proprty Tax/Incom
1.64% (68)Proprty Tax Pr Cap.
$505.09 (68)Sals Tax/Incom
0.49% (68)Sals Tax Pr Capita
$152.07 (68)
County Rv./Incom2.51% (77)
County Rv. Pr Cap.$782.52 (76)
Proprty Tax/Incom1.71% (60)
Proprty Tax Pr Cap.$533.28 (76)
Sals Tax/Incom
0.44% (76)Sals Tax Pr Capita
$135.80 (76)
County Rv./Incom3.00% (35)
County Rv. Pr Cap.$822.60 (65)
Proprty Tax/Incom1.87% (43)
Proprty Tax Pr Cap.$511.62 (65)
Sals Tax/Incom0.66% (65)
Sals Tax Pr Capita$179.61 (65)
County Rv./Incom2.57% (75)
County Rv. Pr Cap.$751.96 (82)
Proprty Tax/Incom1.63% (72)
Proprty Tax Pr Cap.$478.43 (82)
Sals Tax/Incom0.52% (82)
Sals Tax Pr Capita$150.99 (82)
County Rv./Incom3.25% (24)
County Rv. Pr Cap.$891.13 (52)
Proprty Tax/Incom1.95% (37)
Proprty Tax Pr Cap.$534.80 (52)
Sals Tax/Incom0.84% (52)Sals Tax Pr Capita
$229.40 (52)
County Rv./Incom2.65% (68)
County Rv. Pr Cap.$813.16 (70)
Proprty Tax/Incom1.63% (73)
Proprty Tax Pr Cap.$501.23 (70)
Sals Tax/Incom0.49% (70)
Sals Tax Pr Capita$149.91 (70)
edn 15,696 (58)Madison 2,210 (46)Mayodan 2,470 (72)
Ridsvill 14,637 (48)Stonvill 965 (—)Wntworth 2,985 (157)
China Grov 4,396 (138)Clvland 840 (72)east Spncr 1,703 (79)Faith 788 (79)Granit Quarry 2,479 (117)Landis 3,127 (91)Rocwll 2,082 (140)Salisbury 32,263 (21)Spncr 3,481 (83)
Bostic 316 (61)Chimny Roc 190 (56)ellnboro 712 (168)Forst City 7,133 (68)La Lur 1,105 (6)Ruth 318 (127)Ruthrordton 4,166 (82)Spindal 3,850 (—)
Autryvill 206 (—)Clinton 8,810 (—)
Garland 807 (—)Harrlls 215 (—)Nwton Grov 630 (—)Rosboro 1,396 (—)Salmburg 482 (—)Tury 270 (—)
east Laurinburg 290 (169)Gibson 582 (133)Laurinburg 15,825 (73)Wagram 771 (112)
Albmarl 16,338 (38)Badin 1,946 (143)Locust 3,154 (—)Misnhimr 701 (80)Nw London 601 (95)Norwood 2,815 (98)Oaboro 1,139 (58)Rd Cross 787 (148)Richfld 517 (121)Stanfld 1,337 (112)

8/2/2019 By the Numbers: What Government Costs in North Carolina Cities and Counties FY 2010
http://slidepdf.com/reader/full/by-the-numbers-what-government-costs-in-north-carolina-cities-and-counties 26/46
2
p o l i c y r e p o r t
by the numbers | APPeNDIX A: COUNTY-BY-COUNTY DATA
oVerall data 2010 data 2009 data 2010 mun. population COMBINEDCOUNTY COUNTYONLY COUNTYONLY (RANKINCOMBINEDLOCAL
county ANDMUNICIPAL (RANK) (RANK) REVENUEPERCAPITA)*
* Rank within relevant population range.
Stos
Surry
Swain
Transylvania
Tyrrll
Union
2010 Burdn: 3.01%2009 Burdn: 3.09%
2008 Burdn: 3.31%
Chang FY09-10: -2.54%Ran: 93 (2010), 94 (2009)
Population: 46,792Pr-Capita Incom: $29,751
Ran: 55 (Pop.), 60 (PCI)
2010 Burdn: 3.82%2009 Burdn: 3.98%2008 Burdn: 4.25%
Chang FY09-10: -3.95%Ran: 64 (2010), 65 (2009)
Population: 73,881
Pr-Capita Incom: $30,508Ran: 36 (Pop.), 49 (PCI)
2010 Burdn: 3.34%2009 Burdn: 3.44%2008 Burdn: 3.70%
Chang FY09-10: -2.77%Ran: 83 (2010), 84 (2009)
Population: 13,851Pr-Capita Incom: $28,386
Ran: 89 (Pop.), 77 (PCI)
2010 Burdn: 4.41%
2009 Burdn: 4.36%2008 Burdn: 4.75%
Chang FY09-10: 1.18%Ran: 38 (2010), 44 (2009)
Population: 31,091Pr-Capita Incom: $34,207
Ran: 70 (Pop.), 22 (PCI)
2010 Burdn: 5.46%2009 Burdn: 5.61%2008 Burdn: 6.06%
Chang FY09-10: -2.74%Ran: 9 (2010), 5 (2009)
Population: 4,251Pr-Capita Incom: $25,688Ran: 100 (Pop.), 97 (PCI)
2010 Burdn: 4.51%2009 Burdn: 4.57%2008 Burdn: 4.67%
Chang FY09-10: -1.35%Ran: 33 (2010), 35 (2009)
Population: 196,322Pr-Capita Incom: $33,240
Ran: 9 (Pop.), 27 (PCI)
Danbury 106 (163)king 6,631 (81)Walnut Cov 1,589 (148)
Dobson 1,516 (—)elin 4,227 (37)Mount Airy 10,820 (13)Pilot Mountain 1,299 (—)
Bryson City 1,487 (67)
Brvard 7,149 (11)Rosman 597 (49)
Columbia 855 (47)
Fairviw 5,241 (84)Hmby Bridg 1,960 (147)Indian Trail 27,524 (32)La Par 3,390 (111)Marshvill 3,156 (88)Marvin 4,236 (130)Minral Springs 2,525 (144)Monro 38,120 (8)Stallings 12,430 (61)Unionvill 7,935 (85)Waxhaw 4,241 (19)Wddington 11,702 (—)Wsly Chapl 6,472 (83)Wingat 4,275 (—)
County Rv./Incom2.34% (83)
County Rv. Pr Cap.
$695.99 (86)Proprty Tax/Incom
1.68% (68)Proprty Tax Pr Cap.
$499.04 (72)Sals Tax/Incom
0.38% (65)Sals Tax Pr Capita
$112.75 (74)
County Rv./Incom2.81% (43)
County Rv. Pr Cap.$858.01 (49)
Proprty Tax/Incom1.47% (88)
Proprty Tax Pr Cap.$448.10 (85)
Sals Tax/Incom
0.65% (9)Sals Tax Pr Capita
$197.56 (7)
County Rv./Incom2.84% (39)
County Rv. Pr Cap.$805.66 (58)
Proprty Tax/Incom1.16% (97)
Proprty Tax Pr Cap.$328.64 (98)
Sals Tax/Incom0.58% (12)
Sals Tax Pr Capita$165.88 (20)
County Rv./Incom3.44% (18)
County Rv. Pr Cap.$1,175.98 (11)
Proprty Tax/Incom2.44% (11)
Proprty Tax Pr Cap.$834.43 (10)
Sals Tax/Incom0.49% (30)
Sals Tax Pr Capita$168.53 (18)
County Rv./Incom3.73% (11)
County Rv. Pr Cap.$958.89 (34)
Proprty Tax/Incom2.82% (7)
Proprty Tax Pr Cap.$723.74 (23)
Sals Tax/Incom0.49% (31)Sals Tax Pr Capita
$126.34 (59)
County Rv./Incom3.04% (30)
County Rv. Pr Cap.$1,010.79 (30)
Proprty Tax/Incom2.40% (13)
Proprty Tax Pr Cap.$798.77 (15)
Sals Tax/Incom0.36% (73)
Sals Tax Pr Capita$119.78 (65)
County Rv./Incom2.40% (85)
County Rv. Pr Cap.
$724.28 (89)Proprty Tax/Incom
1.53% (78)Proprty Tax Pr Cap.
$460.96 (89)Sals Tax/Incom
0.53% (89)Sals Tax Pr Capita
$159.73 (89)
County Rv./Incom2.80% (52)
County Rv. Pr Cap.$864.54 (55)
Proprty Tax/Incom1.49% (83)
Proprty Tax Pr Cap.$459.97 (55)
Sals Tax/Incom
0.67% (55)Sals Tax Pr Capita
$207.64 (55)
County Rv./Incom2.95% (39)
County Rv. Pr Cap.$822.40 (66)
Proprty Tax/Incom1.15% (97)
Proprty Tax Pr Cap.$320.49 (66)
Sals Tax/Incom0.75% (66)
Sals Tax Pr Capita$208.71 (66)
County Rv./Incom3.45% (19)
County Rv. Pr Cap.$1,220.91 (13)
Proprty Tax/Incom2.26% (19)
Proprty Tax Pr Cap.$798.65 (13)
Sals Tax/Incom0.62% (13)
Sals Tax Pr Capita$219.52 (13)
County Rv./Incom3.71% (14)
County Rv. Pr Cap.$954.55 (41)
Proprty Tax/Incom2.82% (8)
Proprty Tax Pr Cap.$726.67 (41)
Sals Tax/Incom0.61% (41)Sals Tax Pr Capita
$156.56 (41)
County Rv./Incom3.11% (32)
County Rv. Pr Cap.$1,063.45 (28)
Proprty Tax/Incom2.36% (14)
Proprty Tax Pr Cap.$806.65 (28)
Sals Tax/Incom0.48% (28)
Sals Tax Pr Capita$165.66 (28)

8/2/2019 By the Numbers: What Government Costs in North Carolina Cities and Counties FY 2010
http://slidepdf.com/reader/full/by-the-numbers-what-government-costs-in-north-carolina-cities-and-counties 27/46
26
j o h n l o c k e f o u n d a t i o n
oVerall data 2010 data 2009 data 2010 mun. population COMBINEDCOUNTY COUNTYONLY COUNTYONLY (RANKINCOMBINEDLOCAL
county ANDMUNICIPAL (RANK) (RANK) REVENUEPERCAPITA)*
by the numbers | APPeNDIX A: COUNTY-BY-COUNTY DATA
Vanc
Wa
Warrn
Washington
Watauga
Wayn
2010 Burdn: 4.48%2009 Burdn: 4.65%
2008 Burdn: 4.99%
Chang FY09-10: -3.62%Ran: 35 (2010), 31 (2009)
Population: 43,614Pr-Capita Incom: $30,236
Ran: 59 (Pop.), 54 (PCI)
2010 Burdn: 4.74%2009 Burdn: 4.66%2008 Burdn: 4.65%
Chang FY09-10: 1.68%Ran: 24 (2010), 29 (2009)
Population: 892,409
Pr-Capita Incom: $39,821Ran: 2 (Pop.), 6 (PCI)
2010 Burdn: 5.39%2009 Burdn: 5.23%2008 Burdn: 5.52%
Chang FY09-10: 2.93%Ran: 11 (2010), 11 (2009)
Population: 19,932Pr-Capita Incom: $25,383
Ran: 83 (Pop.), 99 (PCI)
2010 Burdn: 3.91%
2009 Burdn: 4.10%2008 Burdn: 4.43%
Chang FY09-10: -4.69%Ran: 58 (2010), 60 (2009)
Population: 13,000Pr-Capita Incom: $30,483
Ran: 90 (Pop.), 51 (PCI)
2010 Burdn: 5.68%2009 Burdn: 4.92%2008 Burdn: 5.86%
Chang FY09-10: 15.45%Ran: 6 (2010), 16 (2009)
Population: 45,377Pr-Capita Incom: $32,193Ran: 57 (Pop.), 33 (PCI)
2010 Burdn: 3.50%2009 Burdn: 3.62%2008 Burdn: 3.86%
Chang FY09-10: -3.53%Ran: 74 (2010), 74 (2009)
Population: 116,554Pr-Capita Incom: $31,673
Ran: 23 (Pop.), 37 (PCI)
County Rv./Incom2.56% (66)
County Rv. Pr Cap.
$772.84 (69)Proprty Tax/Incom
1.61% (76)Proprty Tax Pr Cap.
$487.58 (77)Sals Tax/Incom
0.56% (18)Sals Tax Pr Capita
$168.83 (17)
County Rv./Incom2.48% (73)
County Rv. Pr Cap.$986.93 (31)
Proprty Tax/Incom1.83% (55)
Proprty Tax Pr Cap.$727.64 (22)
Sals Tax/Incom
0.29% (91)Sals Tax Pr Capita
$116.97 (69)
County Rv./Incom4.52% (4)
County Rv. Pr Cap.$1,147.95 (13)
Proprty Tax/Incom3.16% (4)
Proprty Tax Pr Cap.$802.67 (14)
Sals Tax/Incom0.43% (47)
Sals Tax Pr Capita$109.70 (77)
County Rv./Incom2.54% (68)
County Rv. Pr Cap.$774.35 (68)
Proprty Tax/Incom1.58% (79)
Proprty Tax Pr Cap.$480.91 (79)
Sals Tax/Incom0.41% (55)
Sals Tax Pr Capita$126.49 (58)
County Rv./Incom3.17% (23)
County Rv. Pr Cap.$1,020.99 (27)
Proprty Tax/Incom2.06% (35)
Proprty Tax Pr Cap.$662.89 (33)
Sals Tax/Incom0.62% (10)Sals Tax Pr Capita
$200.51 (6)
County Rv./Incom2.26% (89)
County Rv. Pr Cap.$714.52 (83)
Proprty Tax/Incom1.40% (91)
Proprty Tax Pr Cap.$444.43 (86)
Sals Tax/Incom0.44% (43)
Sals Tax Pr Capita$139.72 (43)
County Rv./Incom2.75% (60)
County Rv. Pr Cap.
$832.85 (61)Proprty Tax/Incom
1.68% (65)Proprty Tax Pr Cap.
$508.59 (61)Sals Tax/Incom
0.66% (61)Sals Tax Pr Capita
$199.52 (61)
County Rv./Incom2.49% (79)
County Rv. Pr Cap.$1,051.68 (31)
Proprty Tax/Incom1.77% (50)
Proprty Tax Pr Cap.$748.21 (31)
Sals Tax/Incom
0.35% (31)Sals Tax Pr Capita
$149.06 (31)
County Rv./Incom4.25% (5)
County Rv. Pr Cap.$1,064.66 (27)
Proprty Tax/Incom2.86% (6)
Proprty Tax Pr Cap.$715.91 (27)
Sals Tax/Incom0.61% (27)
Sals Tax Pr Capita$153.06 (27)
County Rv./Incom2.86% (47)
County Rv. Pr Cap.$854.01 (57)
Proprty Tax/Incom1.64% (69)
Proprty Tax Pr Cap.$491.16 (57)
Sals Tax/Incom0.58% (57)
Sals Tax Pr Capita$173.51 (57)
County Rv./Incom3.22% (26)
County Rv. Pr Cap.$1,052.81 (30)
Proprty Tax/Incom2.00% (34)
Proprty Tax Pr Cap.$653.39 (30)
Sals Tax/Incom0.73% (30)Sals Tax Pr Capita
$238.57 (30)
County Rv./Incom2.36% (89)
County Rv. Pr Cap.$757.44 (79)
Proprty Tax/Incom1.39% (90)
Proprty Tax Pr Cap.$446.74 (79)
Sals Tax/Incom0.55% (79)
Sals Tax Pr Capita$174.98 (79)
Hndrson 16,236 (43)kittrll 133 (177)Middlburg 169 (161)
Apx 32,269 (19)Cary 147,270 (15)Fuquay-Varina 16,961 (24)Garnr 27,013 (18)Holly Springs 21,599 (14)knightdal 12,393 (37)Morrisvill 15,996 (9)Raligh 384,116 (9)Rolsvill 2,952 (26)
Wa Forst 28,539 (—)Wndll 6,001 (33)Zbulon 5,545 (12)
Macon 103 (41)Norlina 1,080 (—)Warrnton 914 (18)
Crswll 246 (130)Plymouth 3,846 (108)
Ropr 609 (33)
Bch Mountain 389 (3)Blowing Roc 1,489 (3)Boon 14,813 (7)Svn Dvils 147 (6)
eura 235 (102)Frmont 1,404 (—)Goldsboro 38,313 (30)Mount Oliv 4,659 (110)Pivill 703 (78)Svn Springs 88 (119)Walnut Cr 920 (38)

8/2/2019 By the Numbers: What Government Costs in North Carolina Cities and Counties FY 2010
http://slidepdf.com/reader/full/by-the-numbers-what-government-costs-in-north-carolina-cities-and-counties 28/46
27
p o l i c y r e p o r t
by the numbers | APPeNDIX A: COUNTY-BY-COUNTY DATA
oVerall data 2010 data 2009 data 2010 mun. population COMBINEDCOUNTY COUNTYONLY COUNTYONLY (RANKINCOMBINEDLOCAL
county ANDMUNICIPAL (RANK) (RANK) REVENUEPERCAPITA)*
* Rank within relevant population range.
Wils
Wilson
Yadin
Yancy
2010 Burdn: 3.23%2009 Burdn: 3.40%
2008 Burdn: 3.53%
Chang FY09-10: -5.00%Ran: 88 (2010), 86 (2009)
Population: 67,519Pr-Capita Incom: $31,374
Ran: 37 (Pop.), 42 (PCI)
2010 Burdn: 5.50%2009 Burdn: 5.35%2008 Burdn: 5.29%
Chang FY09-10: 2.79%Ran: 8 (2010), 9 (2009)
Population: 80,005
Pr-Capita Incom: $32,628Ran: 34 (Pop.), 30 (PCI)
2010 Burdn: 3.30%2009 Burdn: 3.26%2008 Burdn: 3.43%
Chang FY09-10: 1.18%Ran: 85 (2010), 91 (2009)
Population: 37,996Pr-Capita Incom: $30,107
Ran: 63 (Pop.), 55 (PCI)
2010 Burdn: 3.45%
2009 Burdn: 3.77%2008 Burdn: 3.22%
Chang FY09-10: -8.44%Ran: 77 (2010), 69 (2009)
Population: 18,551Pr-Capita Incom: $24,807Ran: 85 (Pop.), 100 (PCI)
County Rv./Incom2.56% (65)
County Rv. Pr Cap.
$802.86 (61)Proprty Tax/Incom
1.61% (75)Proprty Tax Pr Cap.
$506.48 (68)Sals Tax/Incom
0.50% (27)Sals Tax Pr Capita
$155.50 (26)
County Rv./Incom2.75% (49)
County Rv. Pr Cap.$897.08 (41)
Proprty Tax/Incom1.87% (51)
Proprty Tax Pr Cap.$609.25 (45)
Sals Tax/Incom
0.43% (50)Sals Tax Pr Capita
$139.07 (44)
County Rv./Incom2.70% (53)
County Rv. Pr Cap.$813.99 (56)
Proprty Tax/Incom1.93% (43)
Proprty Tax Pr Cap.$581.76 (48)
Sals Tax/Incom0.44% (44)
Sals Tax Pr Capita$132.33 (52)
County Rv./Incom3.45% (15)
County Rv. Pr Cap.$856.85 (50)
Proprty Tax/Incom2.72% (9)
Proprty Tax Pr Cap.$675.78 (32)
Sals Tax/Incom0.56% (16)
Sals Tax Pr Capita$139.01 (45)
County Rv./Incom2.73% (61)
County Rv. Pr Cap.
$867.19 (54)Proprty Tax/Incom
1.64% (70)Proprty Tax Pr Cap.
$519.27 (54)Sals Tax/Incom
0.63% (54)Sals Tax Pr Capita
$199.51 (54)
County Rv./Incom2.86% (45)
County Rv. Pr Cap.$961.32 (39)
Proprty Tax/Incom1.83% (46)
Proprty Tax Pr Cap.$614.42 (39)
Sals Tax/Incom
0.53% (39)Sals Tax Pr Capita
$176.68 (39)
County Rv./Incom2.69% (66)
County Rv. Pr Cap.$819.54 (67)
Proprty Tax/Incom1.76% (54)
Proprty Tax Pr Cap.$536.12 (67)
Sals Tax/Incom0.58% (67)
Sals Tax Pr Capita$175.06 (67)
County Rv./Incom3.77% (11)
County Rv. Pr Cap.$943.10 (43)
Proprty Tax/Incom2.63% (10)
Proprty Tax Pr Cap.$658.37 (43)
Sals Tax/Incom0.84% (43)
Sals Tax Pr Capita$209.04 (43)
North Wilsboro 4,181 (49)Ronda 485 (108)Wilsboro 3,179 (27)
Blac Cr 780 (86)elm City 1,334 (86)Lucama 889 (74)Saratoga 401 (67)Sims 134 (31)Stantonsburg 749 (71)Wilson 51,264 (17)
Boonvill 1,165 (104)east Bnd 671 (96)Jonsvill 2,246 (80)Yadinvill 2,800 (109)
Burnsvill 1,694 (—)

8/2/2019 By the Numbers: What Government Costs in North Carolina Cities and Counties FY 2010
http://slidepdf.com/reader/full/by-the-numbers-what-government-costs-in-north-carolina-cities-and-counties 29/46
28
j o h n l o c k e f o u n d a t i o n
county reVenue as % of prop. taX reVenue as % of sales taX reVenue as % of
county per capita (rank) pcpi (rank) per capita (rank) pcpi (rank) per capita (rank) pcpi (rank)
Alamanc $699.12 (84) 2.28% (86) $455.09 (83) 1.48% (85) $112.29 (75) 0.37% (69)
Alxandr $723.73 (81) 2.50% (70) $434.46 (89) 1.50% (83) $133.65 (50) 0.46% (38)
Allghany $1,030.80 (24) 3.52% (14) $683.53 (30) 2.33% (16) $135.86 (49) 0.46% (37)
Anson $750.78 (75) 2.79% (44) $528.88 (58) 1.97% (41) $96.24 (92) 0.36% (76)
Ash $858.32 (48) 2.96% (33) $585.69 (47) 2.02% (38) $156.22 (24) 0.54% (23)
Avry $1,176.71 (10) 4.08% (5) $885.66 (8) 3.07% (5) $197.30 (9) 0.68% (3)
Bauort $805.55 (59) 2.48% (74) $578.41 (50) 1.78% (59) $151.14 (30) 0.46% (36)
Brti $677.92 (89) 2.20% (91) $429.45 (90) 1.39% (92) $74.67 (97) 0.24% (96)
Bladn $1,013.70 (29) 3.45% (17) $625.54 (43) 2.13% (30) $130.65 (54) 0.44% (42)
Brunswic $1,220.55 (6) 3.91% (10) $938.41 (6) 3.01% (6) $140.60 (41) 0.45% (40)
Buncomb $1,080.96 (18) 3.11% (26) $721.44 (24) 2.07% (34) $190.01 (11) 0.55% (22)
Bur $608.96 (97) 2.05% (95) $428.27 (91) 1.44% (89) $48.23 (98) 0.16% (98)
Cabarrus $1,028.81 (25) 3.02% (31) $771.64 (19) 2.26% (20) $160.16 (21) 0.47% (35)Caldwll $671.13 (91) 2.40% (81) $473.22 (81) 1.69% (67) $92.69 (94) 0.33% (84)
Camdn $1,095.29 (16) 3.10% (28) $846.47 (9) 2.39% (14) $99.99 (88) 0.28% (94)
Cartrt $1,119.34 (14) 2.91% (34) $775.38 (18) 2.02% (39) $189.72 (12) 0.49% (29)
Caswll $688.38 (88) 2.31% (85) $402.92 (94) 1.35% (94) $97.57 (90) 0.33% (85)
Catawba $875.06 (43) 2.82% (42) $538.98 (53) 1.74% (63) $170.01 (16) 0.55% (20)
Chatham $1,183.32 (9) 2.76% (47) $903.35 (7) 2.11% (31) $129.06 (56) 0.30% (90)
Chro $1,063.16 (20) 4.06% (6) $637.98 (39) 2.44% (12) $171.36 (14) 0.65% (7)
Chowan $1,113.63 (15) 3.52% (13) $697.70 (29) 2.20% (26) $156.82 (22) 0.50% (28)
Clay $971.08 (33) 3.45% (16) $648.00 (36) 2.30% (18) $154.70 (27) 0.55% (19)
Clvland $673.03 (90) 2.27% (87) $416.81 (92) 1.40% (90) $102.52 (85) 0.35% (80)
Columbus $775.95 (66) 2.60% (62) $511.58 (64) 1.72% (65) $107.08 (80) 0.36% (74)
Cravn $765.02 (71) 2.08% (93) $440.75 (87) 1.20% (96) $130.19 (55) 0.35% (77)
Cumbrland $828.95 (53) 1.99% (96) $527.77 (59) 1.27% (95) $136.14 (48) 0.33% (86)Currituc $2,150.71 (2) 6.05% (3) $1,148.91 (2) 3.23% (3) $287.94 (2) 0.81% (2)
Dar $2,428.12 (1) 6.47% (1) $1,436.33 (1) 3.83% (1) $419.08 (1) 1.12% (1)
Davidson $666.31 (92) 2.07% (94) $477.32 (80) 1.48% (87) $101.64 (86) 0.32% (88)
Davi $891.83 (42) 2.49% (71) $638.46 (38) 1.78% (58) $122.26 (63) 0.34% (81)
Duplin $784.71 (65) 2.69% (57) $486.33 (78) 1.67% (72) $117.09 (68) 0.40% (58)
Durham $1,054.46 (21) 2.73% (51) $810.01 (13) 2.09% (33) $156.60 (23) 0.40% (56)
edgcomb $818.07 (55) 2.82% (41) $538.90 (54) 1.86% (52) $83.60 (95) 0.29% (92)
Forsyth $919.21 (38) 2.55% (67) $658.28 (34) 1.82% (56) $139.87 (42) 0.39% (61)
Franlin $920.68 (37) 3.15% (25) $631.72 (41) 2.16% (27) $123.78 (60) 0.42% (53)
Gaston $868.75 (45) 2.70% (55) $613.98 (44) 1.91% (44) $109.29 (79) 0.34% (82)
Gats $735.36 (79) 2.75% (48) $506.53 (67) 1.90% (45) $103.95 (82) 0.39% (60)
Graham $1,023.30 (26) 3.92% (9) $596.71 (46) 2.29% (19) $153.02 (29) 0.59% (11)
Granvill $718.00 (82) 2.58% (63) $524.86 (61) 1.89% (48) $96.62 (91) 0.35% (79)
Grn $620.23 (94) 2.34% (84) $392.47 (95) 1.48% (86) $99.02 (89) 0.37% (67)
Guilord $936.49 (35) 2.49% (72) $711.99 (27) 1.89% (47) $131.84 (53) 0.35% (78)
Haliax $801.72 (62) 2.85% (38) $526.46 (60) 1.87% (50) $122.62 (62) 0.44% (46)
Harntt Incomplete data $491.01 (76) 1.78% (57) $109.60 (78) 0.40% (59)
Haywood $1,017.83 (28) 3.23% (22) $703.73 (28) 2.23% (24) $180.46 (13) 0.57% (13)
Hndrson $934.29 (36) 2.57% (64) $637.08 (40) 1.75% (62) $154.58 (28) 0.43% (52)
Hrtord $688.68 (87) 2.40% (80) $454.78 (84) 1.59% (78) $143.33 (39) 0.50% (26)
Ho Did not submit AFIR data
Hyd $1,750.03 (3) 6.17% (2) $1,059.64 (3) 3.74% (2) $191.83 (10) 0.68% (4)
Irdll $863.04 (46) 2.68% (59) $628.81 (42) 1.95% (42) $146.97 (33) 0.46% (39)
Jacson $1,172.61 (12) 3.95% (7) $813.02 (12) 2.74% (8) $197.55 (8) 0.67% (5)
ax a s
by the numbers | APPeNDIX A SUMMARY

8/2/2019 By the Numbers: What Government Costs in North Carolina Cities and Counties FY 2010
http://slidepdf.com/reader/full/by-the-numbers-what-government-costs-in-north-carolina-cities-and-counties 30/46
29
p o l i c y r e p o r t
county reVenue as % of prop. taX reVenue as % of sales taX reVenue as % ofcounty per capita (rank) pcpi (rank) per capita (rank) pcpi (rank) per capita (rank) pcpi (rank)
Johnston $827.10 (54) 2.63% (61) $579.54 (49) 1.84% (54) $138.23 (47) 0.44% (45)Jons $740.71 (77) 2.26% (88) $505.20 (69) 1.54% (80) $119.77 (66) 0.37% (70)
L $862.66 (47) 2.83% (40) $656.76 (35) 2.15% (29) $126.84 (57) 0.42% (54)
Lnoir $812.15 (57) 2.43% (76) $548.96 (52) 1.64% (74) $142.50 (40) 0.43% (51)
Lincoln $1,053.70 (22) 3.16% (24) $737.13 (21) 2.21% (25) $144.16 (37) 0.43% (48)
Macon $1,206.95 (7) 3.93% (8) $778.78 (17) 2.54% (10) $204.00 (5) 0.66% (6)
Madison $774.57 (67) 2.78% (45) $493.58 (75) 1.77% (60) $105.42 (81) 0.38% (66)
Martin $854.44 (51) 2.68% (58) $533.31 (55) 1.68% (70) $166.52 (19) 0.52% (25)
McDowll $697.28 (85) 2.70% (54) $411.63 (93) 1.60% (77) $146.86 (34) 0.57% (14)
Mclnburg $1,278.03 (5) 3.00% (32) $952.49 (5) 2.23% (23) $208.84 (3) 0.49% (33)
Mitchll $872.94 (44) 3.30% (19) $554.14 (51) 2.10% (32) $171.11 (15) 0.65% (8)
Montgomry $754.81 (73) 2.86% (37) $532.66 (56) 2.02% (37) $100.27 (87) 0.38% (63)
Moor $916.37 (39) 2.38% (82) $646.24 (37) 1.68% (69) $143.79 (38) 0.37% (68)
Nash $739.97 (78) 2.21% (90) $503.92 (70) 1.50% (82) $122.74 (61) 0.37% (71)
Nw Hanovr $1,197.26 (8) 3.27% (21) $828.09 (11) 2.26% (21) $204.90 (4) 0.56% (17)
Northampton $1,033.72 (23) 3.27% (20) $712.05 (26) 2.25% (22) $80.19 (96) 0.25% (95)
Onslow $643.21 (93) 1.51% (97) $386.64 (96) 0.91% (98) $133.19 (51) 0.31% (89)
Orang $1,332.01 (4) 2.78% (46) $1,034.53 (4) 2.16% (28) $113.44 (73) 0.24% (97)
Pamlico $984.80 (32) 2.71% (52) $742.82 (20) 2.04% (36) $138.32 (46) 0.38% (62)
Pasquotan $830.35 (52) 3.07% (29) $460.91 (82) 1.70% (66) $145.05 (36) 0.54% (24)
Pndr $916.10 (40) 3.10% (27) $682.46 (31) 2.31% (17) $119.30 (67) 0.40% (57)
Prquimans $804.36 (60) 2.68% (60) $531.91 (57) 1.77% (61) $95.44 (93) 0.32% (87)
Prson $1,089.33 (17) 3.55% (12) $720.74 (25) 2.35% (15) $150.47 (31) 0.49% (32)
Pitt $796.94 (63) 2.41% (79) $495.97 (74) 1.50% (84) $147.52 (32) 0.45% (41)
Pol $1,070.92 (19) 2.70% (56) $781.25 (16) 1.97% (40) $114.04 (71) 0.29% (93)
Randolph $619.62 (95) 2.16% (92) $437.02 (88) 1.52% (81) $102.87 (84) 0.36% (75)Richmond $740.83 (76) 2.75% (50) $497.49 (73) 1.85% (53) $116.26 (70) 0.43% (49)
Robson $614.57 (96) 2.41% (78) $353.23 (97) 1.38% (93) $121.33 (64) 0.48% (34)
Rocingham $752.30 (74) 2.47% (75) $508.15 (65) 1.67% (71) $109.84 (76) 0.36% (72)
Rowan $734.31 (80) 2.41% (77) $523.12 (62) 1.72% (64) $103.21 (83) 0.34% (83)
Ruthrord $772.39 (70) 2.88% (35) $507.85 (66) 1.89% (46) $146.83 (35) 0.55% (21)
Sampson Did not submit AFIR data
Scotland $789.77 (64) 2.87% (36) $519.17 (63) 1.88% (49) $155.97 (25) 0.57% (15)
Stanly $757.11 (72) 2.53% (69) $499.20 (71) 1.67% (73) $113.88 (72) 0.38% (64)
Stos $695.99 (86) 2.34% (83) $499.04 (72) 1.68% (68) $112.75 (74) 0.38% (65)
Surry $858.01 (49) 2.81% (43) $448.10 (85) 1.47% (88) $197.56 (7) 0.65% (9)
Swain $805.66 (58) 2.84% (39) $328.64 (98) 1.16% (97) $165.88 (20) 0.58% (12)
Transylvania $1,175.98 (11) 3.44% (18) $834.43 (10) 2.44% (11) $168.53 (18) 0.49% (30)
Tyrrll $958.89 (34) 3.73% (11) $723.74 (23) 2.82% (7) $126.34 (59) 0.49% (31)Union $1,010.79 (30) 3.04% (30) $798.77 (15) 2.40% (13) $119.78 (65) 0.36% (73)
Vanc $772.84 (69) 2.56% (66) $487.58 (77) 1.61% (76) $168.83 (17) 0.56% (18)
Wa $986.93 (31) 2.48% (73) $727.64 (22) 1.83% (55) $116.97 (69) 0.29% (91)
Warrn $1,147.95 (13) 4.52% (4) $802.67 (14) 3.16% (4) $109.70 (77) 0.43% (47)
Washington $774.35 (68) 2.54% (68) $480.91 (79) 1.58% (79) $126.49 (58) 0.41% (55)
Watauga $1,020.99 (27) 3.17% (23) $662.89 (33) 2.06% (35) $200.51 (6) 0.62% (10)
Wayn $714.52 (83) 2.26% (89) $444.43 (86) 1.40% (91) $139.72 (43) 0.44% (43)
Wils $802.86 (61) 2.56% (65) $506.48 (68) 1.61% (75) $155.50 (26) 0.50% (27)
Wilson $897.08 (41) 2.75% (49) $609.25 (45) 1.87% (51) $139.07 (44) 0.43% (50)
Yadin $813.99 (56) 2.70% (53) $581.76 (48) 1.93% (43) $132.33 (52) 0.44% (44)
Yancy $856.85 (50) 3.45% (15) $675.78 (32) 2.72% (9) $139.01 (45) 0.56% (16)
by the numbers | APPeNDIX A SUMMARY

8/2/2019 By the Numbers: What Government Costs in North Carolina Cities and Counties FY 2010
http://slidepdf.com/reader/full/by-the-numbers-what-government-costs-in-north-carolina-cities-and-counties 31/46
30
j o h n l o c k e f o u n d a t i o n
per-capita pop. % change taX rate reValue
county personal income rank population rank 2000–2009 actual/effect. year
Alamanc $30,671 48 148,338 18 13.39% $0.5200 /$0.5179 2009
Alxandr $28,976 71 37,316 65 11.71% $0.6050 /$0.5555 2007
Allghany $29,325 66 11,258 94 5.38% $0.4300 /$0.3560 2007
Anson $26,879 88 25,275 74 0.33% $0.8940 /$0.6463 2002
Ash $29,019 69 26,491 73 8.64% $0.4250 /$0.3188 2006
Avry $28,806 73 18,303 86 6.62% $0.3900 /$0.3030 2006
Bauort $32,542 31 47,393 53 5.42% $0.6000 /$0.4157 2002
Brti $30,835 45 20,114 82 1.72% $0.7800 /$0.6453 2004
Bladn $29,407 65 32,043 69 -0.73% $0.7400 /$0.5920 2007
Brunswic $31,222 43 107,127 25 46.46% $0.3050 /$0.3109 2007
Buncomb $34,774 21 230,421 7 11.68% $0.5250 /$0.4542 2006
Bur $29,710 61 89,653 31 0.57% $0.5200 /$0.4943 2007
Cabarrus $34,083 23 174,255 12 33.24% $0.6300 /$0.6279 2008Caldwll $27,969 81 80,130 33 3.51% $0.6599 /$0.5741 2005
Camdn $35,379 20 9,732 97 41.35% $0.5900 /$0.6160 2007
Cartrt $38,455 10 64,712 39 8.97% $0.2300 /$0.2451 2007
Caswll $29,830 58 23,571 78 0.30% $0.6290 /$0.5664 2008
Catawba $31,052 44 157,002 17 10.81% $0.5350 /$0.5211 2007
Chatham $42,870 2 62,482 41 26.66% $0.6022 /$0.6014 2009
Chro $26,185 94 27,090 72 11.49% $0.3850 /$0.3887 2008
Chowan $31,666 38 14,818 88 2.01% $0.6850 /$0.5685 2006
Clay $28,119 80 10,538 95 20.09% $0.4300 /$0.2721 2002
Clvland $29,692 62 98,628 28 2.51% $0.7200 /$0.6941 2008
Columbus $29,822 59 56,309 48 2.85% $0.8150 /$0.6602 2005
Cravn $36,798 13 100,261 27 9.65% $0.6100 /$0.4067 2002
Cumbrland $41,627 5 321,071 5 5.97% $0.7660 /$0.7652 2009
Currituc $35,569 19 23,815 77 30.92% $0.3200 /$0.3098 2005
Dar $37,526 12 34,355 68 14.64% $0.2600 /$0.2559 2005
Davidson $32,263 32 159,947 14 8.85% $0.5400 /$0.5368 2007
Davi $35,784 18 41,752 61 19.86% $0.6200 /$0.6203 2009
Duplin $29,155 68 53,659 50 9.37% $0.6900 /$0.6868 2009
Durham $38,692 8 266,132 6 19.33% $0.7081 /$0.7082 2008
edgcomb $28,973 72 51,327 52 -7.72% $0.8600 /$0.8572 2009
Forsyth $36,091 17 355,575 4 16.19% $0.6740 /$0.6650 2009
Franlin $29,228 67 59,191 43 25.25% $0.8725 /$0.7322 2004
Gaston $32,171 34 207,234 8 8.86% $0.8350 /$0.7919 2007
Gats $26,724 90 11,814 93 12.34% $0.6400 /$0.6368 2009
Graham $26,089 95 8,327 98 4.18% $0.5800 /$0.3002 2002Granvill $27,831 82 57,434 46 18.43% $0.8250 /$0.7612 2002
Grn $26,520 91 21,384 79 12.71% $0.7560 /$0.7498 2005
Guilord $37,658 11 475,953 3 13.04% $0.7374 /$0.6714 2004
Haliax $28,173 79 55,173 49 -3.83% $0.6800 /$0.6251 2007
Harntt $27,514 85 112,844 24 23.97% $0.7350 /$0.7178 2009
Haywood $31,552 40 58,028 45 7.39% $0.5140 /$0.4298 2006
Hndrson $36,355 15 105,221 26 18.00% $0.4620 /$0.4028 2007
Hrtord $28,673 76 24,010 75 6.24% $0.9100 /$0.7867 2003
Ho $28,997 70 46,134 56 37.12% $0.7000 /$0.6474 2006
Hyd $28,370 78 5,391 99 -7.47% $0.5200 /$0.5095 2009
Irdll $32,171 34 157,013 16 28.01% $0.4450 /$0.4221 2007
Jacson $29,674 63 37,990 64 14.76% $0.2800 /$0.2963 2008
c n.c. c
by the numbers | CHARACTeRISTICS OF N.C. COUNTIeS

8/2/2019 By the Numbers: What Government Costs in North Carolina Cities and Counties FY 2010
http://slidepdf.com/reader/full/by-the-numbers-what-government-costs-in-north-carolina-cities-and-counties 32/46
31
p o l i c y r e p o r t
per-capita pop. % change taX rate reValuecounty personal income rank population rank 2000–2009 actual/effect. year
Johnston $31,480 41 168,217 13 37.92% $0.7800 /$0.6751 2003
Jons $32,724 29 10,150 96 -2.20% $0.7000 /$0.6242 2006
L $30,505 50 58,563 44 19.44% $0.7500 /$0.7163 2007
Lnoir $33,476 25 57,221 47 -4.07% $0.8000 /$0.7967 2009
Lincoln $33,375 26 75,702 35 18.69% $0.5700 /$0.5560 2008
Macon $30,699 46 34,494 67 15.71% $0.2641 /$0.2592 2007
Madison $27,823 83 20,846 81 6.17% $0.5100 /$0.3392 2004
Martin $31,833 36 23,855 76 -6.78% $0.6700 /$0.6713 2009
McDowll $25,797 96 44,742 58 6.14% $0.5500 /$0.4074 2003
Mclnburg $42,644 3 894,290 1 28.59% $0.8387 /$0.6868 2003
Mitchll $26,418 92 15,976 87 1.84% $0.4400 /$0.4267 2009
Montgomry $26,375 93 27,983 71 4.33% $0.6200 /$0.4220 2004
Moor $38,539 9 86,945 32 16.28% $0.4650 /$0.4360 2007Nash $33,557 24 95,804 29 9.59% $0.6700 /$0.6448 2009
Nw Hanovr $36,662 14 194,054 10 21.05% $0.4525 /$0.4388 2007
Northampton $31,598 39 21,018 80 -4.84% $0.7800 /$0.6715 2007
Onslow $42,463 4 179,455 11 19.36% $0.5900 /$0.4728 2006
Orang $47,925 1 132,272 21 11.91% $0.8580 /$0.8492 2009
Pamlico $36,348 16 12,838 92 -0.74% $0.6525 /$0.3619 2004
Pasquotan $27,075 86 41,845 60 19.91% $0.5850 /$0.5156 2006
Pndr $29,520 64 53,095 51 29.24% $0.6500 /$0.4172 2003
Prquimans $29,990 56 12,980 91 14.18% $0.4100 /$0.4346 2008
Prson $30,688 47 38,272 62 7.51% $0.7000 /$0.6710 2005
Pitt $33,089 28 158,541 15 18.48% $0.6650 /$0.6518 2008
Pol $39,659 7 19,355 84 5.63% $0.5200 /$0.4883 2009
Randolph $28,717 75 142,467 19 9.21% $0.5550 /$0.5347 2007
Richmond $26,959 87 46,847 54 0.61% $0.8100 /$0.7754 2008
Robson $25,511 98 131,080 22 6.28% $0.8000 /$0.6654 2005
Rocingham $30,435 53 91,878 30 -0.05% $0.7150 /$0.6297 2003
Rowan $30,444 52 140,495 20 8.04% $0.5950 /$0.5754 2007
Ruthrord $26,820 89 63,821 40 1.47% $0.5300 /$0.4837 2007
Sampson $28,778 74 65,406 38 8.74% $0.8450 /$0.6550 2003
Scotland $27,544 84 36,926 66 2.58% $1.0200 /$0.9611 2003
Stanly $29,965 57 60,079 42 3.41% $0.6700 /$0.5822 2005
Stos $29,751 60 46,792 55 4.64% $0.6000 /$0.5992 2009
Surry $30,508 49 73,881 36 3.74% $0.5820 /$0.5599 2008
Swain $28,386 77 13,851 89 6.81% $0.3300 /$0.2181 2005
Transylvania $34,207 22 31,091 70 5.99% $0.3949 /$0.3933 2009Tyrrll $25,688 97 4,251 100 2.48% $0.6700 /$0.6766 2009
Union $33,240 27 196,322 9 58.74% $0.6650 /$0.6384 2008
Vanc $30,236 54 43,614 59 1.54% $0.7820 /$0.7392 2008
Wa $39,821 6 892,409 2 42.14% $0.5340 /$0.5304 2008
Warrn $25,383 99 19,932 83 -0.21% $0.6000 /$0.5837 2009
Washington $30,483 51 13,000 90 -5.25% $0.7900 /$0.6293 2005
Watauga $32,193 33 45,377 57 6.28% $0.3130 /$0.2465 2006
Wayn $31,673 37 116,554 23 2.85% $0.7640 /$0.6299 2003
Wils $31,374 42 67,519 37 2.88% $0.5700 /$0.5402 2007
Wilson $32,628 30 80,005 34 8.39% $0.7300 /$0.7079 2008
Yadin $30,107 55 37,996 63 4.53% $0.7400 /$0.7434 2009
Yancy $24,807 100 18,551 85 4.37% $0.4500 /$0.4447 2008
Note: Data or Fiscal Year 2010.
by the numbers | CHARACTeRISTICS OF N.C. COUNTIeS

8/2/2019 By the Numbers: What Government Costs in North Carolina Cities and Counties FY 2010
http://slidepdf.com/reader/full/by-the-numbers-what-government-costs-in-north-carolina-cities-and-counties 33/46
32
j o h n l o c k e f o u n d a t i o n
2010 c c & m rv m
municipalities With populations greater than 25,000 (35 MUNICIPALITIeS, 34 RANkeD)
higher burden — upper Quartile
Charlott Mclnburg $2,289.54 1 1 $1,457.77 3 3 $392.42 1 1Chapl Hill Oranga $2,281.96 2 2 $1,642.79 1 1 $269.60 16 20Wilmington Nw Hanovr $2,139.94 3 5 $1,286.14 9 11 $338.51 3 4Ashvill Buncomb $2,126.48 4 3 $1,288.14 8 12 $366.38 2 2Moorsvill Irdll $2,095.53 5 4 $1,565.06 2 2 $305.81 7 5Durham Durham $1,942.92 6 6 $1,333.62 4 6 $284.33 12 8Grnvill Pitt $1,922.80 7 28 $1,232.12 14 30 $304.76 8 13Monro Union $1,906.79 8 11 $1,242.33 13 14 $191.25 33 34
aVerage burden — second and third Quartiles
Raligh Wa $1,901.31 9 7 $1,208.75 15 15 $269.66 15 14
Grnsboro Guilord $1,867.89 10 10 $1,253.76 12 13 $264.50 21 24Huntrsvill Mclnburg $1,846.80 11 12 $1,311.08 6 7 $278.58 13 22Concord Cabarrus $1,845.10 12 14 $1,324.39 5 5 $298.73 9 9High Point Guilorda $1,839.42 13 13 $1,274.08 11 10 $259.35 26 23Winston-Salm Forsyth $1,835.89 14 21 $1,083.87 20 21 $255.72 27 28Cary Wa $1,816.67 15 9 $1,180.20 17 17 $265.67 20 18Hicory Catawba $1,810.27 16 15 $1,114.94 19 19 $328.72 5 6Wilson Wilson $1,782.03 17 20 $1,000.81 24 24 $252.69 28 26Garnr Wa $1,775.79 18 16 $1,281.84 10 8 $266.74 18 15Apx Wa $1,774.12 19 17 $1,196.24 16 16 $267.03 17 16Matthws Mclnburg $1,772.74 20 18 $1,294.32 7 9 $273.55 14 29Salisbury Rowan $1,674.76 21 19 $1,046.61 23 22 $215.09 32 30Rocy Mount Nasha $1,581.51 22 29 $872.95 30 32 $261.10 25 21Nw Brn Cravn $1,577.06 23 23 $889.28 29 28 $307.10 6 7Statsvill Irdll $1,576.49 24 22 $1,050.27 22 23 $334.12 4 3kannapolis Cabarrusa $1,567.12 25 25 $1,117.48 18 18 $266.27 19 31
Sanord L $1,533.77 26 24 $1,074.62 21 20 $288.94 10 10
loWer burden — loWer Quartile
Gastonia Gaston $1,496.01 27 26 $978.58 25 25 $238.52 29 33Burlington Alamanc $1,455.67 28 27 $931.60 27 27 $263.55 23 11Fayttvill Cumbrland $1,431.18 29 30 $810.28 32 33 $284.33 11 17Goldsboro Wayn $1,349.25 30 31 $808.43 33 34 $261.98 24 12Ashboro Randolph $1,298.03 31 32 $901.87 28 29 $218.75 30 32Indian Trail Union $1,277.10 32 33 $974.32 26 26 $156.54 34 35Thomasvill Davidson $1,239.47 33 34 $858.31 31 31 $218.21 31 25Jacsonvill Onslow $1,116.64 34 35 $603.85 34 35 $263.61 22 27
not ranked (incomplete data)
Wa Forstb Wa — — 8 — — 4 — — 19
municipalities With populations of 5,000–24,999 (95 MUNICIPALITIeS, 89 RANkeD) higher burden — upper Quartile
kill Dvil Hills Dar $3,928.62 1 1 $2,218.30 1 1 $657.81 1 1Carolina Bach Nw Hanovr $2,837.65 2 2 $1,562.31 6 8 $388.49 4 3Oa Island Brunswic $2,684.30 3 3 $1,629.84 4 4 $331.51 11 5Pinvill Mclnburg $2,413.35 4 6 $1,497.12 8 9 $317.37 14 24Hillsborough Orang $2,303.45 5 4 $1,748.41 3 3 $268.88 35 55Cornlius Mclnburg $2,272.33 6 18 $1,748.87 2 2 $296.02 23 34Boon Watauga $2,139.40 7 27 $1,427.51 10 12 $412.88 3 2Carrboro Orang $2,138.68 8 9 $1,598.29 5 6 $234.33 60 65Morrisvill Wa $2,136.37 9 5 $1,520.30 7 7 $262.83 43 46Morhad City Cartrt $2,107.70 10 7 $1,351.29 14 13 $358.00 6 8Brvard Transylvania $2,048.84 11 12 $1,389.22 13 16 $281.61 30 18Zbulon Wa $1,993.36 12 8 $1,490.91 9 5 $253.48 51 52Mount Airy Surry $1,978.62 13 17 $1,033.51 37 35 $414.59 2 4
local property salesreVenues 2010 2009 taX burden 2010 2009 taX burden 2010 2009
municipality county per capita rank rank per capita rank rank per capita rank rank
by the numbers | APPeNDIX B: LOCAL GOVeRNMeNT COSTS BY MUNICIPALITY
A P P E N
D
I x
B

8/2/2019 By the Numbers: What Government Costs in North Carolina Cities and Counties FY 2010
http://slidepdf.com/reader/full/by-the-numbers-what-government-costs-in-north-carolina-cities-and-counties 34/46
33
p o l i c y r e p o r t
by the numbers | APPeNDIX B: LOCAL GOVeRNMeNT COSTS BY MUNICIPALITY
local property sales
reVenues 2010 2009 taX burden 2010 2009 taX burden 2010 2009
municipality county per capita rank rank per capita rank rank per capita rank rank
Holly Springs Wa $1,969.34 14 10 $1,282.00 16 17 $266.67 39 48Waynsvill Haywood $1,958.80 15 11 $1,149.20 24 30 $378.24 5 6Davidson Mclnburg $1,952.64 16 13 $1,425.15 11 11 $297.14 22 37
Pinhurst Moor $1,873.50 17 14 $1,312.15 15 14 $301.98 18 16Harrisburg Cabarrus $1,861.18 18 19 $1,413.02 12 10 $273.33 32 47Southrn Pins Moor $1,833.72 19 16 $1,255.13 17 15 $301.84 19 11Abrdn Moor $1,824.87 20 15 $1,207.31 19 18 $299.72 20 19ednton Chowan $1,805.08 21 33 $978.95 40 45 $225.04 64 73krnrsvill Forsyth $1,801.85 22 24 $1,206.47 20 19 $290.44 25 35
aVerage burden — second and third Quartiles
Blac Mountain Buncomb $1,774.34 23 26 $1,076.27 33 37 $299.58 21 25Fuquay-Varina Wa $1,771.46 24 22 $1,196.09 21 21 $244.84 53 49Washington Bauort $1,764.08 25 23 $961.70 44 43 $349.57 9 7Smithfld Johnston $1,703.48 26 29 $981.63 39 40 $253.75 49 43Clayton Johnston $1,701.85 27 20 $1,089.28 31 29 $268.59 37 22Hndrsonvill Hndrson $1,697.29 28 25 $1,163.12 23 24 $290.48 24 10Lincolnton Lincoln $1,686.59 29 31 $1,149.05 25 25 $328.32 12 9
Mban Alamanca $1,660.16 30 34 $1,185.99 22 23 $263.24 42 41Gibsonvill Alamanca $1,652.46 31 41 $967.00 43 44 $241.58 54 66Lland Brunswic $1,648.21 32 32 $1,105.15 28 28 $321.66 13 15Wndll Wa $1,644.97 33 30 $1,098.88 30 31 $268.70 36 40Marion McDowll $1,643.67 34 77 $669.63 87 91 $287.63 27 13Silr City Chatham $1,640.01 35 36 $1,127.43 26 27 $303.19 16 21Mint Hill Mclnburg $1,634.89 36 38 $1,216.51 18 20 $260.96 44 67knightdal Wa $1,621.88 37 28 $1,113.97 27 26 $237.13 56 60Albmarl Stanly $1,617.53 38 48 $839.19 59 59 $240.86 55 56kinston Lnoir $1,615.29 39 45 $946.81 46 47 $272.43 33 62Conovr Catawba $1,607.89 40 37 $1,056.45 34 33 $349.77 8 17Mount Holly Gaston $1,563.78 41 43 $1,078.98 32 34 $219.59 68 64Williamston Martin $1,546.71 42 47 $978.32 41 42 $303.06 17 23Hndrson Vanc $1,536.45 43 46 $813.87 68 65 $279.60 31 27Whitvill Columbus $1,532.05 44 35 $881.84 51 50 $224.76 65 69
Blmont Gaston $1,530.65 45 49 $1,101.06 29 32 $218.98 69 70Tarboro edgcomb $1,527.36 46 51 $842.31 57 78 $214.34 73 76Nwton Catawba $1,508.62 47 50 $931.57 47 46 $347.86 10 12Ridsvill Rocingham $1,497.83 48 42 $1,016.25 38 39 $264.63 41 42Fltchr Hndrson $1,495.33 49 44 $1,040.91 36 38 $256.87 46 32elizabth City Pasquotan $1,469.04 50 39 $755.67 77 87 $270.67 34 39Roano Rapids Haliax $1,468.71 51 55 $960.55 45 48 $237.08 57 57Spring La Cumbrland $1,460.82 52 64 $929.28 48 72 $258.18 45 50Lumbrton Robson $1,433.55 53 65 $712.42 84 86 $290.33 26 20Bssmr City Gaston $1,429.05 54 73 $869.00 52 54 $165.36 84 86Woodfn Buncomb $1,422.09 55 56 $968.84 42 41 $267.08 38 61Long Viw Catawba $1,416.57 56 67 $774.14 73 73 $351.02 7 14Hamlt Richmond $1,413.87 57 54 $827.90 62 57 $284.79 29 26edn Rocingham $1,384.80 58 59 $847.95 56 63 $233.20 61 51Morganton Bur $1,374.40 59 58 $885.20 50 52 $192.06 76 85Hop Mills Cumbrland $1,369.14 60 74 $770.25 74 84 $254.24 48 59Stallings Union $1,358.36 61 60 $1,052.48 35 36 $166.11 83 80Rocingham Richmond $1,356.01 62 63 $815.92 67 62 $285.50 28 28Oxord Granvill $1,349.13 63 70 $816.48 66 77 $207.65 74 71Wintrvill Pitt $1,346.41 64 72 $833.11 60 58 $305.61 15 44Chrryvill Gaston $1,336.89 65 62 $890.53 49 49 $173.63 82 84Lnoir Caldwll $1,330.09 66 57 $860.16 54 51 $235.02 58 45Ahosi Hrtord $1,313.96 67 52 $801.08 71 56 $248.94 52 31
loWer burden — loWer Quartile
Bssmr City Gaston $1,334.55 70 67 $850.27 54 50 $215.11 84 83Forst City Ruthrord $1,289.66 68 69 $746.62 78 76 $223.67 66 77Lxington Davidson $1,280.17 69 71 $862.21 53 53 $218.72 70 68Slma Johnston $1,278.28 70 68 $826.69 63 60 $220.07 67 74Shlby Clvland $1,254.33 71 75 $789.77 72 69 $230.89 62 75

8/2/2019 By the Numbers: What Government Costs in North Carolina Cities and Counties FY 2010
http://slidepdf.com/reader/full/by-the-numbers-what-government-costs-in-north-carolina-cities-and-counties 35/46
34
j o h n l o c k e f o u n d a t i o n
by the numbers | APPeNDIX B: LOCAL GOVeRNMeNT COSTS BY MUNICIPALITY
local property sales
reVenues 2010 2009 taX burden 2010 2009 taX burden 2010 2009
municipality county per capita rank rank per capita rank rank per capita rank rank
Graham Alamanc $1,244.63 72 76 $743.23 79 81 $265.38 40 30Laurinburg Scotland $1,236.54 73 66 $711.87 85 85 $217.07 71 54kings Mountain Clvlanda $1,228.96 74 78 $718.57 81 89 $175.60 80 83
Wadsboro Anson $1,216.72 75 79 $839.40 58 61 $197.75 75 72elon Alamanc $1,180.97 76 81 $707.04 86 90 $256.29 47 29Archdal Randolph $1,162.84 77 82 $715.04 83 88 $216.21 72 58Walrtown Forsyth $1,140.08 78 83 $828.50 61 66 $179.33 79 87Lwisvill Forsyth $1,134.66 79 86 $823.14 64 70 $179.78 78 88Clmmons Forsyth $1,098.39 80 91 $764.49 75 79 $163.52 85 89king Stos $1,086.16 81 80 $668.66 88 75 $160.29 86 78Havloc Cravn $1,061.66 82 87 $595.30 89 93 $191.52 77 81Wsly Chapl Union $1,046.49 83 88 $822.32 65 64 $125.00 89 92Fairviw Union $1,028.23 84 89 $811.39 69 67 $123.19 90 93Unionvill Union $1,027.59 85 90 $810.74 70 68 $123.12 91 94Plasant Gardn Guilord $969.59 86 93 $728.01 80 83 $137.00 88 95Summrfld Guilord $967.41 87 92 $715.74 82 74 $142.14 87 91Sawmills Caldwll $906.95 88 94 $536.34 90 94 $234.82 59 38Trinity Randolph $849.14 89 95 $509.83 91 95 $253.58 50 53
not ranked (incomplete data)
Dunn Harntt — — 40 $848.97 55 80 $230.47 63 63erwin Harntt — — 61 $758.07 76 92 $175.50 81 79Clintond Sampson — — 53 – — 71 — — 33Mills Rivr b Hndrson — — 84 – — 82 — — 82Roxborob Prson — — 21 – — 22 — — 36Wddingtonb Union — — 85 – — 55 — — 90
municipalities With populations of 1,000–4,999 (195 MUNICIPALITIeS, 169 RANkeD) higher burden — upper Quartile
Nags Had Dar $5,328.80 1 1 $2,889.29 1 1 $828.04 3 2Manto Dar $5,257.22 2 2 $2,877.22 2 2 $849.71 2 3Blowing Roc Watauga $4,288.22 3 4 $2,707.14 3 3 $432.69 12 15
Wrightsvill Bach Nw Hanovr $4,046.39 4 6 $1,808.26 12 14 $459.77 10 13Atlantic Bach Cartrt $3,921.31 5 5 $2,375.06 5 6 $652.29 4 5La Lur Ruthrord $3,895.30 6 7 $2,419.80 4 5 $861.11 1 1kitty Haw Dar $3,804.47 7 8 $2,180.44 7 8 $645.31 6 7Southrn Shors Dar $3,645.97 8 10 $2,089.90 11 12 $618.67 7 8Pin knoll Shors Cartrt $3,370.41 9 11 $2,249.57 6 7 $617.99 8 9Farmvill Pitt $3,321.92 10 9 $1,131.92 39 41 $306.72 42 71emrald Isl Cartrt $3,252.91 11 12 $2,101.42 10 11 $569.62 9 10Biltmor Forst Buncomb $3,005.90 12 14 $2,170.64 8 9 $646.24 5 6Shallott Brunswic $2,905.99 13 13 $2,119.25 9 10 $299.88 46 31Sunst Bach Brunswic $2,664.12 14 15 $1,600.64 15 17 $332.28 29 32kur Bach Nw Hanovr $2,440.62 15 19 $1,551.33 16 19 $394.50 14 14Maggi Vally Haywood $2,440.54 16 18 $1,771.00 13 15 $352.55 23 17Wavrvill Buncomb $2,422.73 17 17 $1,470.20 19 23 $423.28 13 12Bauort Cartrt $2,361.49 18 24 $1,309.33 25 26 $340.18 25 49
Waxhaw Union $2,337.84 19 20 $1,749.82 14 16 $311.58 39 58Murphy Chro $2,270.35 20 25 $1,250.40 28 33 $357.04 19 174Southport Brunswic $2,166.12 21 22 $1,480.45 18 20 $293.87 49 37Tryon Pol $2,092.82 22 21 $1,457.61 20 22 $232.48 105 76Sylva Jacson $2,073.38 23 28 $1,344.00 23 28 $319.36 38 18Pittsboro Chatham $2,068.56 24 27 $1,429.51 21 24 $274.66 66 59Wst Jrson Ash $2,062.45 25 26 $1,518.48 17 21 $352.92 22 20Rolsvill Wa $2,040.66 26 30 $1,388.31 22 25 $257.66 79 113Wilsboro Wils $1,970.89 27 29 $1,300.31 27 27 $356.57 20 29Franlin Macon $1,935.67 28 33 $1,182.39 34 37 $330.34 31 41Canton Haywood $1,918.46 29 36 $1,305.83 26 29 $380.05 15 30Columbus Pol $1,848.87 30 31 $1,227.63 29 35 $275.48 64 63elizabthtown Bladn $1,847.67 31 37 $1,063.07 48 54 $251.24 87 101Youngsvill Franlin $1,813.47 32 43 $1,177.94 35 49 $227.44 109 107Wldon Haliax $1,804.72 33 70 $1,021.14 52 88 $288.20 57 133

8/2/2019 By the Numbers: What Government Costs in North Carolina Cities and Counties FY 2010
http://slidepdf.com/reader/full/by-the-numbers-what-government-costs-in-north-carolina-cities-and-counties 36/46
3
p o l i c y r e p o r t
by the numbers | APPeNDIX B: LOCAL GOVeRNMeNT COSTS BY MUNICIPALITY
local property sales
reVenues 2010 2009 taX burden 2010 2009 taX burden 2010 2009
municipality county per capita rank rank per capita rank rank per capita rank rank
Holly Ridg Onslow $1,802.25 34 34 $981.02 60 51 $459.65 11 11Jamstown Guilord $1,773.03 35 39 $1,135.14 38 42 $217.35 125 151Calabash Brunswic $1,764.14 36 44 $1,089.02 45 46 $339.00 26 26
elin Surry $1,755.05 37 49 $971.70 65 67 $375.16 17 27Troutman Irdll $1,750.44 38 35 $1,322.27 24 32 $305.30 43 42Cap Cartrt Cartrt $1,740.05 39 38 $1,201.50 32 30 $320.03 37 50Mount Plasant Cabarrus $1,731.51 40 41 $1,156.67 36 36 $261.19 77 116Brmuda Run Davi $1,730.86 41 47 $1,049.83 51 58 $255.30 81 67Bladnboro Bladn $1,718.61 42 69 $910.59 77 86 $210.38 132 150
aVerage burden — second and third Quartiles
Swansboro Onslow $1,692.28 43 46 $946.56 68 83 $367.03 18 22St. Jams Brunswic $1,680.53 44 45 $1,212.17 31 31 $322.38 34 40Carthag Moor $1,674.47 45 51 $1,104.00 42 43 $330.99 30 43Madison Rocingham $1,672.17 46 48 $1,223.28 30 34 $233.54 104 97Cramrton Gaston $1,663.04 47 62 $1,186.20 33 38 $238.79 99 119Boiling Spring Las Brunswic $1,642.18 48 50 $1,122.31 40 39 $329.85 32 33North Wilsboro Wils $1,636.44 49 42 $1,052.87 50 44 $321.17 35 28
Nwport Cartrt $1,632.02 50 55 $1,070.78 47 53 $254.96 82 124Clyd Haywood $1,629.39 51 40 $931.98 72 84 $375.75 16 34Laurl Par Hndrson $1,592.41 52 57 $1,144.10 37 45 $281.10 61 52Maidn Catawba $1,588.42 53 63 $998.44 57 65 $324.74 33 55Mocsvill Davi $1,583.85 54 64 $1,094.68 44 52 $289.45 54 64Crdmoor Granvill $1,570.33 55 73 $1,094.79 43 55 $204.89 136 146Whispring Pins Moor $1,563.59 56 60 $1,114.73 41 40 $300.48 45 47Pinblu Moor $1,561.65 57 58 $878.02 84 72 $310.17 40 45Oaboro Stanly $1,545.91 58 75 $1,015.40 53 59 $242.21 98 99Blvill Brunswic $1,543.36 59 54 $1,072.67 46 47 $296.41 48 39Carolina Shors Brunswic $1,537.95 60 53 $1,059.47 49 50 $296.52 47 35Robbins Moor $1,534.13 61 56 $938.54 71 66 $333.39 28 44Louisburg Franlin $1,532.52 62 67 $974.97 63 70 $221.09 119 144Nashvill Nash $1,528.82 63 87 $849.31 92 101 $280.21 62 72Sparta Allghany $1,505.41 64 72 $899.12 79 85 $320.68 36 46
Wallac Duplin $1,502.62 65 76 $843.29 95 109 $246.92 91 89Ros Hill Duplin $1,489.67 66 100 $768.58 115 136 $283.11 60 70Bryson City Swain $1,486.66 67 83 $637.92 144 166 $333.42 27 24Broadway L $1,483.62 68 78 $979.86 61 60 $293.14 51 65Burgaw Pndr $1,477.75 69 59 $958.35 66 62 $244.97 95 66Stanly Gaston $1,473.56 70 74 $1,012.59 54 57 $217.14 127 128Spruc Pin Mitchll $1,470.65 71 104 $930.30 73 135 $345.87 24 36Mayodan Rocingham $1,468.68 72 88 $985.02 58 79 $265.13 72 77Randlman Randolph $1,467.82 73 84 $1,007.50 55 61 $253.14 84 105Bulavill Duplin $1,446.05 74 85 $836.02 97 120 $247.31 90 85La Waccamaw Columbus $1,445.78 75 95 $876.13 85 87 $224.56 114 111Jrson Ash $1,435.37 76 65 $939.54 70 64 $354.83 21 19Spring Hop Nash $1,406.93 77 103 $856.03 89 116 $279.36 63 74Aydn Pitt $1,394.85 78 107 $687.30 138 143 $307.62 41 75east Spncr Rowan $1,393.05 79 97 $921.52 74 75 $220.12 120 134
Jonsvill Yadin $1,392.61 80 93 $952.65 67 81 $216.45 128 118Robrsonvill Martin $1,386.46 81 86 $830.12 99 104 $231.76 106 122Ruthrordton Ruthrord $1,382.17 82 32 $893.59 81 80 $264.11 74 79Spncr Rowan $1,369.34 83 89 $894.47 80 82 $246.33 94 125knly Johnston $1,363.05 84 101 $944.98 69 78 $237.54 101 120Lowll Gaston $1,361.69 85 91 $982.74 59 63 $193.78 145 152elm City Wilson $1,339.71 86 114 $868.32 87 93 $234.74 103 147Midland Cabarrus $1,338.00 87 71 $918.30 75 74 $193.28 147 173Marshvill Union $1,336.90 88 96 $1,005.97 56 56 $154.99 160 175Haw Rivr Alamanc $1,331.59 89 108 $872.48 86 102 $243.18 97 78Warsaw Duplin $1,331.38 90 — $743.57 122 — $284.19 58 —Landis Rowan $1,329.65 91 113 $818.25 104 108 $246.54 93 130Rural Hall Forsyth $1,328.72 92 126 $979.48 62 73 $208.26 133 163Garysburg Northampton $1,325.68 93 116 $854.11 90 96 $177.05 151 158Taylorsvill Alxandr $1,309.44 94 105 $763.80 117 142 $263.02 75 61

8/2/2019 By the Numbers: What Government Costs in North Carolina Cities and Counties FY 2010
http://slidepdf.com/reader/full/by-the-numbers-what-government-costs-in-north-carolina-cities-and-counties 37/46
36
j o h n l o c k e f o u n d a t i o n
by the numbers | APPeNDIX B: LOCAL GOVeRNMeNT COSTS BY MUNICIPALITY
local property sales
reVenues 2010 2009 taX burden 2010 2009 taX burden 2010 2009
municipality county per capita rank rank per capita rank rank per capita rank rank
Mars Hill Madison $1,309.18 95 102 $860.70 88 92 $224.34 115 102Ramsur Randolph $1,296.85 96 119 $836.39 96 100 $273.69 68 84Pmbro Robson $1,296.61 97 115 $694.68 135 154 $288.59 56 57
Norwood Stanly $1,295.21 98 125 $822.14 102 111 $269.53 69 91Mount Gilad Montgomry $1,283.04 99 122 $823.72 101 115 $211.79 131 106Troy Montgomry $1,278.23 100 158 $719.12 128 152 $243.92 96 115Chadbourn Columbus $1,274.58 101 109 $731.01 126 131 $224.65 113 117Dnton Davidson $1,271.40 102 123 $844.06 94 103 $251.21 88 109St. Pauls Robson $1,268.97 103 110 $633.35 145 158 $289.17 55 62Boonvill Yadin $1,266.99 104 141 $887.57 82 114 $228.66 108 141Valds Bur $1,264.46 105 112 $769.71 114 130 $203.96 138 162La Grang Lnoir $1,261.80 106 140 $766.94 116 137 $203.00 140 166Rowland Robson $1,261.38 107 134 $632.37 146 161 $290.25 53 51Plymouth Washington $1,254.78 108 120 $717.49 130 140 $219.33 122 135Yadinvill Yadin $1,254.47 109 150 $878.64 83 118 $221.86 117 140Mount Oliv Wayn $1,254.33 110 129 $718.00 129 144 $254.41 83 126La Par Union $1,253.14 111 130 $973.65 64 68 $154.05 162 176Stanfld Stanly $1,251.68 112 133 $834.09 98 112 $265.55 71 88Granit Falls Caldwll $1,244.94 113 143 $777.02 110 134 $206.06 135 104Bthl Pitt $1,243.34 114 118 $684.66 139 151 $304.37 44 68Pintops edgcomb $1,241.32 115 157 $675.80 141 171 $225.49 110 138enfld Haliax $1,240.43 116 142 $771.10 113 138 $193.44 146 155Granit Quarry Rowan $1,231.34 117 — $800.04 108 — $217.50 124 —Richlands Onslow $1,227.94 118 144 $689.47 137 164 $275.16 65 48Rd Springs Robson $1,225.53 119 90 $652.66 142 155 $252.18 86 60Princton Johnston $1,224.08 120 127 $816.84 105 105 $206.73 134 156Magnolia Duplin $1,222.08 121 147 $630.19 147 168 $283.34 59 81Murrsboro Hrtord $1,217.25 122 111 $749.45 120 121 $237.19 102 95Flat Roc Hndrson $1,216.65 123 132 $850.68 91 97 $221.68 118 137Four Oas Johnston $1,207.19 124 136 $771.51 112 124 $197.07 144 165Pin Lvl Johnston $1,203.84 125 135 $772.02 111 123 $197.56 143 160Griton Pitt $1,194.21 126 151 $713.56 132 147 $274.15 67 96Fair Blu Columbus $1,188.99 127 — $700.52 134 — $224.67 112 —
loWer burden — loWer Quartile
Librty Randolph $1,177.29 128 148 $739.61 123 133 $256.73 80 98Ranlo Gaston $1,170.42 129 152 $816.68 106 110 $155.25 159 178Marvin Union $1,166.97 130 153 $914.29 76 77 $144.75 165 182Hudson Caldwll $1,165.08 131 131 $754.11 119 129 $212.09 130 87Tabor City Columbus $1,158.24 132 68 $731.49 125 98 $185.23 149 123Maxton Robson $1,157.10 133 138 $609.46 150 159 $293.31 50 56Trnt Woods Cravn $1,152.39 134 146 $715.60 131 139 $238.13 100 114Sharpsburg Nasha $1,141.89 135 165 $675.82 140 160 $222.29 116 142Fairmont Robson $1,137.27 136 155 $613.80 149 165 $290.30 52 53Oa Ridg Guilord $1,115.03 137 160 $844.45 93 99 $162.31 158 181China Grov Rowan $1,101.07 138 154 $762.25 118 122 $217.16 126 132Rivr Bnd Cravn $1,097.80 139 156 $651.95 143 157 $214.54 129 148Rocwll Rowan $1,093.54 140 162 $727.29 127 141 $246.70 92 131Bayboro Pamlico $1,076.83 141 159 $798.94 109 126 $153.24 163 169
Brunswic Columbus $1,066.13 142 — $598.94 153 — $224.81 111 —Badin Stanly $1,053.47 143 164 $627.97 148 162 $268.96 70 94Minral Springs Union $1,045.77 144 166 $825.78 100 106 $125.74 169 184Wilson’s Mills Johnston $1,039.03 145 163 $736.29 124 132 $184.41 150 167Snow Hill Grn $1,038.12 146 167 $597.26 154 170 $174.23 152 172Hmby Bridg Union $1,030.37 147 168 $811.54 107 113 $122.65 170 185Walnut Cov Stos $1,021.30 148 99 $590.65 156 150 $143.48 166 159Windsor Brti $995.26 149 169 $485.48 167 181 $200.40 141 149Tobaccovill Forsyth $977.30 150 173 $691.98 136 153 $148.38 164 183Drxl Bur $950.60 151 170 $598.99 152 169 $173.47 153 161Boiling Springs Clvland $945.05 152 — $599.35 151 — $154.77 161 —Stosdal Guilord $940.43 153 175 $711.99 133 146 $131.84 168 186Gln Alpin Bur $931.63 154 171 $597.26 155 167 $168.96 154 170Polton Anson $926.47 155 177 $568.97 158 173 $228.87 107 136Yancyvill Caswll $917.50 156 178 $563.92 159 174 $133.77 167 180

8/2/2019 By the Numbers: What Government Costs in North Carolina Cities and Counties FY 2010
http://slidepdf.com/reader/full/by-the-numbers-what-government-costs-in-north-carolina-cities-and-counties 38/46
37
p o l i c y r e p o r t
by the numbers | APPeNDIX B: LOCAL GOVeRNMeNT COSTS BY MUNICIPALITY
local property sales
reVenues 2010 2009 taX burden 2010 2009 taX burden 2010 2009
municipality county per capita rank rank per capita rank rank per capita rank rank
Wntworth Rocingham $905.09 157 176 $508.15 165 180 $262.63 76 82Hildbran Bur $899.39 158 174 $572.30 157 172 $162.95 157 168Rd Oa Nash $878.94 159 185 $503.92 166 184 $260.10 78 83
Franlinvill Randolph $876.46 160 179 $530.10 161 175 $219.67 121 127Swpsonvill Alamanc $860.20 161 180 $455.09 171 186 $264.13 73 73Wallburg Davidson $855.69 162 181 $518.43 163 177 $249.91 89 108Midway Davidson $850.38 163 183 $513.20 164 179 $218.10 123 110Ruthrord Collg Bur $822.38 164 124 $519.35 162 178 $167.28 155 171Hrtord Prquimans $804.36 165 106 $531.91 160 127 $95.44 172 100Cajah’s Mountain Caldwll $782.97 166 182 $473.22 168 182 $203.97 137 93Gamwll Caldwll $782.34 167 184 $473.22 168 182 $203.90 139 92Connlly Springs Bur $772.61 168 186 $462.24 170 185 $167.24 156 164Blwood Clvland $680.53 169 187 $416.81 172 187 $102.52 171 187
not ranked (incomplete data)
Angir Harntt — — 82 $820.35 103 145 $190.58 148 143Coats Harntt — — 92 $745.16 121 156 $199.61 142 157Lillington Harntt — — 66 $903.36 78 119 $252.78 85 103
Andrwsc Chro — — 61 — — 90 — — 16Blhavnb Bauort — — 81 — — 94 — — 25Bnsonb Johnston — — 79 — — 69 — — 121Biscob Montgomry — — 121 — — 89 — — 112Burnsvillc Yancy — — — — — — — — —Clarmontb Catawba — — 16 — — 13 — — 54Dallasb Gaston — — 128 — — 107 — — 177Dobsonb Surry — — 77 — — 125 — — 23Franlintonb Franlin — — 94 — — 91 — — 153Frmontb Wayn — — 149 — — 148 — — 139Grnlvlb Alamanc — — 172 — — 176 — — 69knansvillb Duplin — — 137 — — 149 — — 86Locustb Stanly — — 98 — — 95 — — 90Navassab Brunswic — — 52 — — 48 — — 38Norlinab Warrn — — 80 — — 71 — — 80
Pilot Mountainb
Surry — — 23 — — 18 — — 21Princvillb edgcomb — — 161 — — 163 — — 145Raordd Ho — — — — — — — — —Rosboroc, d Sampson — — — — — — — — —Scotland Ncb Haliax — — 117 — — 128 — — 154Spindalb Ruthrord — — 145 — — 117 — — 129Sur Cityb Pndr — — 3 — — 4 — — 4Wingatb Union — — 139 — — 76 — — 179 municipalities With populations under 1,000 (224 MUNICIPALITIeS, 192 RANkeD) higher burden — upper Quartile
Bald Had Island Brunswic $26,592.18 1 1 $22,235.89 1 1 $331.56 21 27Indian Bach Cartrt $13,631.81 2 2 $10,517.67 3 2 $2,552.05 1 1Bch Mountain Watauga $13,217.27 3 — $10,541.23 2 — $408.77 11 —Duc Dar $11,454.30 4 4 $6,324.13 4 3 $1,903.86 2 2
Ocan Isl Bach Brunswic $11,171.01 5 3 $5,522.33 6 5 $331.58 20 23Svn Dvils Watauga $7,586.97 6 6 $5,824.85 5 4 $433.30 9 14Highlands Macon $6,415.35 7 10 $3,326.97 7 7 $982.82 3 4Topsail Bach Pndr $5,286.41 8 8 $2,919.49 8 8 $556.84 5 5North Topsail Bach Onslow $4,921.46 9 9 $2,720.75 9 9 $787.42 4 3Holdn Bach Brunswic $4,818.97 10 7 $2,511.91 10 10 $300.16 38 29Whit La Bladn $3,082.46 11 12 $1,766.54 14 13 $457.94 7 7Caswll Bach Brunswic $3,033.22 12 11 $2,066.06 11 11 $295.49 42 32Montrat Buncomb $2,889.70 13 13 $1,973.32 12 12 $545.50 6 6Santtlah Graham $2,582.49 14 — $1,718.16 15 — $153.02 176 —Bannr el Avry $2,530.35 15 14 $1,817.38 13 14 $417.10 10 13Harmony Irdll $2,365.39 16 98 $677.62 130 136 $307.59 30 19Saluda Pol $2,311.46 17 15 $1,643.92 16 15 $246.53 83 51Warrnton Warrn $1,985.33 18 18 $1,301.11 18 22 $220.54 106 90Foxfr Villag Moor $1,976.13 19 16 $1,508.31 17 16 $301.96 36 36

8/2/2019 By the Numbers: What Government Costs in North Carolina Cities and Counties FY 2010
http://slidepdf.com/reader/full/by-the-numbers-what-government-costs-in-north-carolina-cities-and-counties 39/46
38
j o h n l o c k e f o u n d a t i o n
by the numbers | APPeNDIX B: LOCAL GOVeRNMeNT COSTS BY MUNICIPALITY
local property sales
reVenues 2010 2009 taX burden 2010 2009 taX burden 2010 2009
municipality county per capita rank rank per capita rank rank per capita rank rank
Nwland Avry $1,919.47 20 17 $1,283.52 19 18 $404.12 14 11Atinson Pndr $1,911.54 21 — $1,279.44 20 — $273.83 56 —Robbinsvill Graham $1,815.85 22 — $1,024.04 39 — $279.57 54 —
Clarton Bladn $1,746.27 23 20 $1,092.36 28 25 $268.08 59 73Barsvill Mitchll $1,745.66 24 45 $1,168.85 25 59 $298.10 41 38Svrn Northampton $1,741.32 25 21 $1,183.88 23 20 $176.98 155 133Bridgton Cravn $1,738.04 26 23 $1,053.02 33 34 $335.58 19 37Dublin Bladn $1,725.08 27 25 $934.41 56 51 $229.88 98 115Dillsboro Jacson $1,722.35 28 19 $1,221.93 21 17 $309.30 28 30Orintal Pamlico $1,698.04 29 22 $1,221.11 22 19 $235.41 91 85Catawba Catawba $1,685.80 30 24 $1,170.31 24 23 $324.58 25 43Sims Wilson $1,639.90 31 30 $1,080.13 31 33 $248.09 78 118Baily Nash $1,635.93 32 95 $776.26 92 112 $278.80 55 69Ropr Washington $1,621.55 33 — $680.15 129 — $209.89 119 —Camron Moor $1,619.88 34 27 $1,024.52 38 30 $337.32 18 33Sandy Cr Brunswic $1,553.70 35 28 $1,082.13 29 26 $303.37 35 22Cdar Point Cartrt $1,547.79 36 — $1,010.15 41 — $246.57 82 —el Par Avry $1,537.08 37 29 $1,018.40 40 42 $404.68 12 12Walnut Cr Wayn $1,536.18 38 33 $1,061.36 32 31 $330.62 22 24McAdnvill Gaston $1,531.57 39 44 $1,146.75 26 29 $235.57 90 102Woodland Northampton $1,530.70 40 52 $944.24 52 53 $221.20 104 169Macon Warrn $1,522.67 41 75 $950.52 51 78 $220.67 105 89Pin Hill Lnoir $1,518.85 42 43 $935.97 55 60 $249.25 76 114Rich Squar Northampton $1,516.14 43 38 $1,080.18 30 28 $168.27 162 163Goldston Chatham $1,515.14 44 48 $991.33 45 43 $304.28 32 46Northwst Brunswic $1,506.95 45 26 $1,033.46 35 27 $311.70 27 31Vass Moor $1,505.98 46 34 $993.34 44 35 $303.83 33 34Columbia Tyrrll $1,491.36 47 32 $1,026.76 37 41 $193.19 143 182Crossnor Avry $1,486.77 48 37 $960.28 49 45 $404.35 13 10
aVerage burden — second and third Quartiles
Rosman Transylvania $1,484.40 49 42 $989.65 46 55 $195.23 142 145Conway Northampton $1,468.21 50 40 $1,037.66 34 32 $176.80 157 156Minnsott Bach Pamlico $1,468.19 51 41 $1,124.13 27 24 $237.60 89 108Bolivia Brunswic $1,464.08 52 36 $983.16 48 40 $330.61 23 20Grandathr Villag Avry $1,428.66 53 46 $885.66 66 63 $440.22 8 9Varnamtown Brunswic $1,426.51 54 35 $986.04 47 38 $298.93 40 26Gaston Northampton $1,425.24 55 55 $906.54 62 52 $208.62 123 139Chimny Roc Ruthrord $1,421.86 56 49 $795.71 86 87 $263.97 64 75Brooord Catawba $1,415.09 57 51 $788.89 89 88 $325.12 24 41Taylortown Moor $1,406.41 58 39 $937.31 54 36 $303.38 34 35Lilsvill Anson $1,398.66 59 47 $1,008.16 42 37 $197.46 139 120Whitars edgcomb $1,392.16 60 67 $827.09 80 118 $231.96 94 117Bostic Ruthrord $1,379.17 61 59 $913.30 59 49 $184.81 150 178Chocowinity Bauort $1,377.91 62 63 $881.33 67 66 $348.18 16 16Jacson Northampton $1,377.49 63 58 $933.36 57 46 $176.90 156 162Bthania Forsyth $1,363.73 64 73 $954.65 50 50 $213.96 117 161Marshall Madison $1,360.34 65 64 $907.82 61 57 $263.97 63 92Candor Montgomry $1,359.22 66 82 $995.10 43 62 $216.18 113 101
Saratoga Wilson $1,358.13 67 61 $853.23 72 61 $211.73 118 155Stonwall Pamlico $1,341.80 68 62 $1,028.31 36 39 $208.98 122 126Sagrov Randolph $1,339.40 69 65 $909.24 60 44 $252.84 71 98Middlsx Nash $1,337.27 70 93 $819.57 82 98 $279.68 53 71Stantonsburg Wilson $1,334.32 71 68 $849.28 73 68 $209.57 121 149Clvland Rowan $1,334.16 72 31 $937.66 53 21 $246.86 80 110Saboard Northampton $1,322.11 73 66 $890.17 65 56 $177.65 154 158Lucama Wilson $1,310.00 74 69 $802.06 84 83 $199.67 134 168Forst Hills Jacson $1,303.69 75 70 $913.80 58 54 $227.86 100 124MacClsfld edgcomb $1,303.13 76 112 $703.79 121 155 $190.03 146 157Littlton Haliax $1,289.80 77 81 $864.52 70 72 $218.30 108 116Pivill Wayn $1,279.07 78 100 $765.98 95 99 $264.87 61 112Faith Rowan $1,270.54 79 85 $862.00 71 65 $247.19 79 111Misnhimr Stanly $1,268.03 80 76 $537.22 165 180 $242.03 88 86Pantgo Bauort $1,261.62 81 60 $748.31 100 100 $346.09 17 18

8/2/2019 By the Numbers: What Government Costs in North Carolina Cities and Counties FY 2010
http://slidepdf.com/reader/full/by-the-numbers-what-government-costs-in-north-carolina-cities-and-counties 40/46
39
p o l i c y r e p o r t
by the numbers | APPeNDIX B: LOCAL GOVeRNMeNT COSTS BY MUNICIPALITY
local property sales
reVenues 2010 2009 taX burden 2010 2009 taX burden 2010 2009
municipality county per capita rank rank per capita rank rank per capita rank rank
Como Hrtord $1,259.58 82 204 $650.25 138 194 $214.88 114 196Aulandr Brti $1,255.63 83 96 $711.98 114 121 $214.09 116 123Coolm Davi $1,253.49 84 74 $789.81 88 91 $255.01 68 57
Wbstr Jacson $1,248.88 85 83 $875.99 68 58 $197.55 137 154Blac Cr Wilson $1,238.69 86 79 $805.17 83 80 $204.89 128 144Lov Vally Irdll $1,235.11 87 78 $834.56 77 81 $300.69 37 94Tachy Duplin $1,234.09 88 114 $719.49 110 140 $248.94 77 76Lasr Northampton $1,230.68 89 86 $821.77 81 77 $166.98 164 142Star Montgomry $1,230.18 90 88 $801.04 85 84 $216.57 112 100Washington Par Bauort $1,229.87 91 80 $833.41 78 74 $317.82 26 21Old Fort McDowll $1,228.05 92 72 $762.34 97 86 $299.63 39 28Tar Hl Bladn $1,226.29 93 92 $783.22 91 90 $173.90 158 175Bolton Columbus $1,216.99 94 54 $707.26 117 115 $224.68 101 104Nw London Stanly $1,212.66 95 97 $791.79 87 93 $268.90 57 74east Bnd Yadin $1,209.31 96 123 $902.32 63 82 $205.00 127 127Haliax Haliax $1,208.45 97 122 $732.12 106 124 $179.55 152 172Micro Johnston $1,207.79 98 91 $787.83 90 85 $201.91 132 160ellrb Richmond $1,204.70 99 108 $699.03 123 110 $249.67 75 66
Vandmr Pamlico $1,204.09 100 87 $894.69 64 64 $179.22 153 151Fountain Pitt $1,202.35 101 107 $722.84 108 106 $282.01 51 70eura Wayn $1,199.53 102 111 $704.57 120 126 $235.41 92 122Stdman Cumbrland $1,199.09 103 113 $768.59 94 103 $245.83 84 99Pltir Cartrt $1,199.06 104 104 $835.46 75 70 $206.55 126 165Bogu Cartrt $1,198.08 105 103 $834.96 76 69 $207.14 125 164Jamsvill Martin $1,188.29 106 116 $774.16 93 95 $242.25 87 125Stm Granvill $1,184.44 107 148 $866.75 69 104 $204.27 130 167Ronda Wils $1,182.37 108 119 $657.56 136 151 $355.20 15 25Colrain Brti $1,179.22 109 90 $677.46 131 129 $167.62 163 136Calypso Duplin $1,178.45 110 110 $634.22 144 152 $253.50 70 81Grimsland Pitt $1,173.16 111 127 $665.95 133 142 $304.56 31 47Wagram Scotland $1,166.07 112 — $722.76 109 — $230.97 97 —Cofld Hrtord $1,162.78 113 102 $761.66 98 89 $244.04 85 96Stovall Granvill $1,153.34 114 121 $714.07 112 133 $243.60 86 105Vancboro Cravn $1,152.97 115 105 $661.68 134 132 $203.52 131 132Spd edgcomb $1,149.80 116 146 $745.67 101 154 $208.56 124 113Msic Pamlico $1,142.93 117 115 $843.22 74 76 $164.20 167 166Falland Pitt $1,141.87 118 133 $669.23 132 144 $307.72 29 68Svn Springs Wayn $1,141.36 119 120 $688.77 124 131 $231.21 95 119Pollocsvill Jons $1,129.75 120 171 $755.85 99 122 $190.42 145 187Richfld Stanly $1,127.69 121 118 $681.37 127 127 $254.94 69 64St. Hlna Pndr $1,124.71 122 125 $707.05 118 111 $286.64 47 59Lindn Cumbrland $1,117.00 123 145 $622.58 146 171 $264.32 62 91Hobgood Haliax $1,115.95 124 136 $705.34 119 143 $190.01 147 179Watha Pndr $1,114.62 125 124 $700.12 122 117 $286.37 48 54Lggtt edgcomb $1,096.26 126 169 $708.78 116 168 $191.92 144 141Ruth Ruthrord $1,095.81 127 135 $733.55 104 107 $229.42 99 137Hamilton Martin $1,091.91 128 137 $712.93 113 116 $217.38 111 153Sdalia Guilord $1,091.24 129 139 $832.13 79 71 $159.50 172 195Crswll Washington $1,084.83 130 128 $661.29 135 125 $204.27 129 143
Lwiston Woodvill Brti $1,084.45 131 144 $638.86 143 146 $223.61 103 129Wad Cumbrland $1,076.07 132 140 $643.94 141 165 $198.88 136 97Gibson Scotland $1,074.30 133 109 $685.46 125 109 $217.38 110 84Maysvill Jons $1,072.28 134 166 $719.47 111 130 $166.25 165 191evrtts Martin $1,068.28 135 132 $684.00 126 108 $218.48 107 147Parton Robson $1,068.04 136 131 $573.58 159 167 $284.97 49 42Alamanc Alamanc $1,062.24 137 57 $726.49 107 48 $183.73 151 53Trnton Jons $1,060.54 138 — $733.51 105 — $187.06 149 —Cdar Roc Caldwll $1,060.53 139 158 $710.01 115 147 $232.51 93 83Harrllsvill Hrtord $1,054.94 140 138 $648.59 139 138 $209.59 120 131Walstonburg Grn $1,052.70 141 149 $619.32 148 156 $159.40 173 177Falcon Cumbrland $1,052.15 142 159 $593.09 155 174 $258.40 66 93Winton Hrtord $1,045.18 143 129 $643.32 142 141 $217.67 109 140Dobbins Hights Richmond $1,042.95 144 157 $619.99 147 159 $284.95 50 55

8/2/2019 By the Numbers: What Government Costs in North Carolina Cities and Counties FY 2010
http://slidepdf.com/reader/full/by-the-numbers-what-government-costs-in-north-carolina-cities-and-counties 41/46
40
j o h n l o c k e f o u n d a t i o n
by the numbers | APPeNDIX B: LOCAL GOVeRNMeNT COSTS BY MUNICIPALITY
loWer burden — loWer Quartile
Bar Grass Martin $1,037.64 145 154 $681.23 128 134 $201.24 133 170
Grantsboro Pamlico $1,020.10 146 147 $763.03 96 105 $143.62 178 180Crro Gordo Columbus $1,016.78 147 143 $565.90 162 166 $223.96 102 103Rd Cross Stanly $1,012.64 148 155 $598.55 154 161 $268.87 58 78Allianc Pamlico $1,008.93 149 151 $742.82 102 114 $138.32 180 183Grovr Clvland $1,007.43 150 164 $567.44 161 158 $169.73 161 188Norman Richmond $1,001.81 151 177 $497.49 177 183 $251.14 74 63Conto edgcomb $999.84 152 182 $589.22 156 186 $214.27 115 135Ansonvill Anson $981.24 153 172 $613.90 150 162 $231.16 96 121Dovr Cravn $981.02 154 163 $526.77 169 178 $158.53 174 186Whitstt Guilord $978.50 155 173 $742.35 103 102 $138.43 179 200Hassll Martin $974.47 156 162 $618.61 149 139 $197.47 138 181McFarlan Anson $969.91 157 168 $598.56 153 153 $196.86 141 130Ossip Alamanc $968.73 158 165 $535.88 166 179 $265.43 60 56Rhodhiss Bur $963.15 159 156 $648.02 140 148 $162.34 171 173Pachland Anson $948.00 160 170 $605.37 152 160 $197.31 140 134
Middlburg Vanc $937.13 161 175 $569.27 160 163 $199.15 135 174Momyr Nash $932.67 162 188 $537.94 164 190 $279.85 52 67Danbury Stos $929.37 163 152 $613.23 151 119 $170.83 160 152Lumbr Bridg Robson $929.08 164 179 $478.30 180 189 $290.33 45 48Spncr Mountain Gaston $923.43 165 — $655.53 137 — $121.74 185 —Homan Richmond $922.90 166 174 $544.71 163 170 $246.78 81 72Cntrvill Franlin $920.68 167 — $631.72 145 — $123.78 184 —ellnboro Ruthrord $919.04 168 181 $586.16 157 164 $171.05 159 190east Laurinburg Scotland $905.79 169 180 $582.42 158 169 $155.97 175 176Roxobl Brti $902.21 170 178 $518.60 170 176 $163.73 169 148Powllsvill Brti $878.81 171 183 $502.02 175 188 $164.21 166 159Dortchs Nash $874.39 172 193 $503.92 174 195 $257.16 67 79Aswvill Brti $868.85 173 185 $530.32 168 181 $164.03 168 146Proctorvill Robson $861.63 174 186 $424.02 186 200 $292.48 43 39klord Brti $852.31 175 187 $514.42 171 184 $163.39 170 150Staly Randolph $850.37 176 190 $505.87 173 185 $252.74 72 95kittrll Vanc $836.35 177 192 $531.90 167 172 $188.02 148 185Cov City Cravn $829.00 178 189 $486.38 179 191 $145.32 177 193kingstown Clvland $798.69 179 — $513.50 172 — $131.20 181 —Raynham Robson $794.99 180 191 $402.37 189 203 $252.61 73 52McDonald Robson $794.37 181 195 $364.88 190 205 $289.48 46 44Lawndal Clvland $788.46 182 197 $501.99 176 187 $127.33 182 197Maritta Robson $785.19 183 196 $353.23 191 206 $291.94 44 40earl Clvland $767.98 184 199 $490.31 178 192 $123.98 183 198Orrum Robson $753.85 185 198 $353.23 191 206 $260.60 65 49Lattimor Clvland $742.98 186 200 $468.45 181 193 $120.85 186 199Waco Clvland $740.00 187 201 $463.20 182 196 $120.40 187 201Fallston Clvland $715.79 188 202 $450.22 183 197 $111.88 188 202Polvill Clvland $704.70 189 203 $441.50 184 198 $109.51 189 203Casar Clvland $700.68 190 205 $438.11 185 199 $108.76 190 204Pattrson Springs Clvland $688.34 191 207 $416.81 187 201 $102.52 191 205
Moorsboro Clvland $686.67 192 206 $416.81 187 201 $102.52 191 205
not ranked (incomplete data)
Arapahob Pamlico — — 153 — — 113 — — 183Aurorab Bauort — — 71 — — 92 — — 15Autryvilld Sampson — — 126 — — 137 — — 62Bathb Bauort — — 77 — — 73 — — 17Boardmanb Columbus — — 176 — — 175 — — 109Bunnc Franlin — — — — — — — — —Castaliac Nash — — — — — — — — —east Arcadiab Bladn — — 134 — — 128 — — 192Faisonb Duplin — — 56 — — 75 — — 60Garlandd Sampson — — 89 — — 135 — — 58Gatsvillb Gats — — 161 — — 157 — — 77
local property sales
reVenues 2010 2009 taX burden 2010 2009 taX burden 2010 2009
municipality county per capita rank rank per capita rank rank per capita rank rank

8/2/2019 By the Numbers: What Government Costs in North Carolina Cities and Counties FY 2010
http://slidepdf.com/reader/full/by-the-numbers-what-government-costs-in-north-carolina-cities-and-counties 42/46
41
p o l i c y r e p o r t
by the numbers | APPeNDIX B: LOCAL GOVeRNMeNT COSTS BY MUNICIPALITY
local property sales
reVenues 2010 2009 taX burden 2010 2009 taX burden 2010 2009
municipality county per capita rank rank per capita rank rank per capita rank rank
Godwinc Cumbrland — — — — — — — — —Grnvrsc Duplin — — — — — — — — —Harrllsd Sampson — — 167 — — 182 — — 82
Haysvillb
Clay — — 84 — — 79 — — 106High Shoalsb Gaston — — 130 — — 94 — — 194Hoortonb Grn — — 160 — — 177 — — 189Hot Springsc Madison — — — — — — — — —Lansingc Ash — — — — — — — — —Miltonb Caswll — — 141 — — 123 — — 171Morvnb Anson — — 184 — — 150 — — 207Nwton Grovd Sampson — — 94 — — 101 — — 65Oa Cityb Martin — — 99 — — 97 — — 138Parmlb Martin — — 106 — — 96 — — 128Rnnrtb Robson — — 194 — — 204 — — 45Salmburgd Sampson — — 117 — — 149 — — 61Sandyfldb Columbus — — 142 — — 145 — — 107Simpsonb Pitt — — 101 — — 120 — — 50Stonvillb Rocingham — — 50 — — 47 — — 88Sugar Mountainb Avry — — 5 — — 6 — — 8Turyd Sampson — — 150 — — 173 — — 80Winallb Prquimans — — 53 — — 67 — — 87
Notes:
a) Municipality has at last 1,000 rsidnts in two countis; is listd undr county in which th gratr numbr o rsidnts liv.
b) Rsults could not b calculatd in part; municipality had not submittd FY 2010 AFIR by Fbruary 4, 2012.
c) Rsults could not b calculatd; municipality did not submit FY 2010 and FY 2009 AFIRs by Fbruary 4, 2012.
d) Rsults could not b calculatd; though municipality submittd its AFIRs in a timly mannr, th county in which it is locatd did not.
) Rsults or FY 2009 could not b calculatd; municipality had not submittd FY 2009 AFIR by Fbruary 4, 2012.
) Local Rvnus Pr Capita could not b computd or FY2010 as th Harntt County AFIR was incomplt.
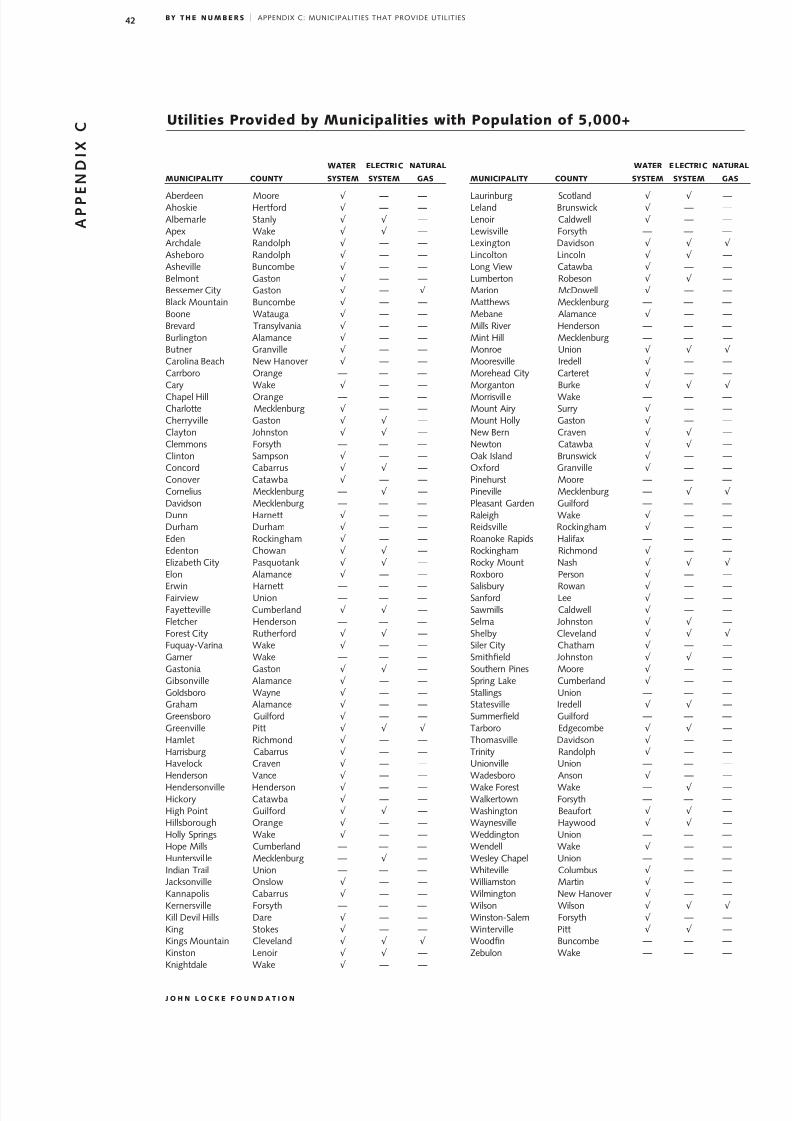
8/2/2019 By the Numbers: What Government Costs in North Carolina Cities and Counties FY 2010
http://slidepdf.com/reader/full/by-the-numbers-what-government-costs-in-north-carolina-cities-and-counties 43/46
42
j o h n l o c k e f o u n d a t i o n
Water electric natural
municipality county system system gas
Abrdn Moor √ — —Ahosi Hrtord √ — —
Albmarl Stanly √ √ —Apx Wa √ √ —Archdal Randolph √ — —Ashboro Randolph √ — —Ashvill Buncomb √ — —Blmont Gaston √ — —Bssmr City Gaston √ — √
Blac Mountain Buncomb √ — —Boon Watauga √ — —Brvard Transylvania √ — —Burlington Alamanc √ — —Butnr Granvill √ — —Carolina Bach Nw Hanovr √ — —Carrboro Orang — — —Cary Wa √ — —Chapl Hill Orang — — —Charlott Mclnburg √ — —Chrryvill Gaston √ √ —Clayton Johnston √ √ —Clmmons Forsyth — — —Clinton Sampson √ — —Concord Cabarrus √ √ —Conovr Catawba √ — —Cornlius Mclnburg — √ —Davidson Mclnburg — — —Dunn Harntt √ — —Durham Durham √ — —edn Rocingham √ — —ednton Chowan √ √ —elizabth City Pasquotan √ √ —elon Alamanc √ — —
erwin Harntt — — —Fairviw Union — — —Fayttvill Cumbrland √ √ —Fltchr Hndrson — — —Forst City Ruthrord √ √ —Fuquay-Varina Wa √ — —Garnr Wa — — —Gastonia Gaston √ √ —Gibsonvill Alamanc √ — —Goldsboro Wayn √ — —Graham Alamanc √ — —Grnsboro Guilord √ — —Grnvill Pitt √ √ √
Hamlt Richmond √ — —Harrisburg Cabarrus √ — —Havloc Cravn √ — —Hndrson Vanc √ — —
Hndrsonvill Hndrson √ — —Hicory Catawba √ — —High Point Guilord √ √ —Hillsborough Orang √ — —Holly Springs Wa √ — —Hop Mills Cumbrland — — —Huntrsvil l Mclnburg — √ —Indian Trail Union — — —Jacsonvill Onslow √ — —kannapolis Cabarrus √ — —krnrsvill Forsyth — — —kill Dvil Hills Dar √ — —king Stos √ — —kings Mountain Clvland √ √ √
kinston Lnoir √ √ —knightdal Wa √ — —
Water electric natura
municipality county system system gas
Laurinburg Scotland √ √ —Lland Brunswic √ — —Lnoir Caldwll √ — —Lwisvill Forsyth — — —Lxington Davidson √ √ √
Lincolton Lincoln √ √ —Long Viw Catawba √ — —Lumbrton Robson √ √ —Marion McDowll √ — —Matthws Mclnburg — — —Mban Alamanc √ — —Mills Rivr Hndrson — — —Mint Hill Mclnburg — — —Monro Union √ √ √
Moorsvill Irdll √ — —Morhad City Cartrt √ — —Morganton Bur √ √ √
Morrisvill Wa — — —Mount Airy Surry √ — —Mount Holly Gaston √ — —Nw Brn Cravn √ √ —Nwton Catawba √ √ —Oa Island Brunswic √ — —Oxord Granvill √ — —Pinhurst Moor — — —Pinvill Mclnburg — √ √
Plasant Gardn Guilord — — —Raligh Wa √ — —Ridsvill Rocingham √ — —Roano Rapids Haliax — — —Rocingham Richmond √ — —Rocy Mount Nash √ √ √
Roxboro Prson √ — —
Salisbury Rowan √ — —Sanord L √ — —Sawmills Caldwll √ — —Slma Johnston √ √ —Shlby Clvland √ √ √
Silr City Chatham √ — —Smithfld Johnston √ √ —Southrn Pins Moor √ — —Spring La Cumbrland √ — —Stallings Union — — —Statsvill Irdll √ √ —Summrfld Guilord — — —Tarboro edgcomb √ √ —Thomasvill Davidson √ — —Trinity Randolph √ — —Unionvill Union — — —Wadsboro Anson √ — —
Wa Forst Wa — √ —Walrtown Forsyth — — —Washington Bauort √ √ —Waynsvill Haywood √ √ —Wddington Union — — —Wndll Wa √ — —Wsly Chapl Union — — —Whitvill Columbus √ — —Williamston Martin √ — —Wilmington Nw Hanovr √ — —Wilson Wilson √ √ √
Winston-Salm Forsyth √ — —Wintrvill Pitt √ √ —Woodfn Buncomb — — —Zbulon Wa — — —
u pv m w p 5,000+
by the numbers | APPeNDIX C: MUNICIPALITIeS THAT PROVIDe UTILITIeS
A P P E N
D
I x
C

8/2/2019 By the Numbers: What Government Costs in North Carolina Cities and Counties FY 2010
http://slidepdf.com/reader/full/by-the-numbers-what-government-costs-in-north-carolina-cities-and-counties 44/46
43
p o l i c y r e p o r t
p tx 10 Currnt Collctions o Unit-Wid Lvy11 Currnt Collctions o Spcial
Tax District12 Prior Yars’ Lvy Collctions13 Pnaltis and Intrst14 Collctions o Taxs Prviously
Writtn O
s tx 19 1% Local Govrnmnt Option Sals20 1/2% Local Govrnmnt Option Sals
Tax (Articl 40)21 1/2% Local Govrnmnt Option Sals
Tax (Articl 42)21.1 1/2% Local Govrnmnt Option Sals
Tax (Articl 44)21.2 1/4% Local Govrnmnt Option Sals
Tax (Articl 46)
t The above plus:
rv 15 Animal Tax16 Dd Stamp excis Tax17 Ral Proprty Transr Tax18 Scrap Tir Disposal Tax22 Local Occupancy Tax23 Prpard Food Tax24 911 Chargs25 Gross Rcipts Tax on Short Trm
Lasd Vhicls
26 Whit Goods Disposal Tax27 Privilg Licnss28 Othr Licnss (Including CATV)81 Building Prmits82 Rgistr o Dds83 Inspction Fs84 Concald Handgun Prmits85 Othr Prmits86 Paring Rvnus87 Rnts and Royaltis89 Fir Protction Chargs90 Solid Wast91 Ambulanc and Rscu Squad Chargs92 Cmtris93 Rcration Srvic Rvnus94 Library Srvic Rvnus95 Othr Cultural and Rc. Srvic Rv.96 Clint and Third Party Paymnts—Halth97 Mntal Halth98 Social Srvics99 County Hom100 Mass Transit—County Opratd101 Othr Sals and Srvics102 Watr and Swr Chargs*105 Spcial Assssmnts106 Privat Contrib. and Othr Donations109 1 Cnt and 5 Cnt Bottl Tax110 Mixd Drin Surcharg111 ABC Proft Distribution112 Othr Miscllanous Rvnus
p tx 10 Currnt Collctions o Unit-Wid Lvy11 Currnt Collctions o Spcial
Tax Districts12 Prior Yars’ Lvy Collctions13 Pnaltis and Intrst14 Collctions o Taxs Prviously
Writtn O102 Supplmntal Schools Taxs Currnt
Lvy Collctions103 Prior Yars’ Lvy Collctions
s tx 16 1% Local Govrnmnt Option Sals Tax17 1/2% Local Govrnmnt Option Sals
Tax (Articl 40)
18 1/2% Local Govrnmnt Option SalsTax (Articl 42)
18.5 1/2% Local Govrnmnt Option SalsTax (Articl 44)
t The above plus:
rv 15 Animal Tax 19 Privilg Licnss
19.2 All Othr Privilgs and Prmits20 Auto Licnss21 Vhicl Tax or Public Transportation22 Othr Licnss (Including CATV)23 Local Occupancy Tax24 Prpard Food Tax25 911 Chargs
26 Gross Short Trm Las and Rntal Tax71 Building Prmits72 Inspction Fs72.1 Amusmnts Licnsing and Prmit Taxs73 Othr Prmits74 Paring Rvnus75 Rnts and Royaltis77 Fir Protction Chargs78 Solid Wast79 Ambulanc and Rscu Squad Chargs80 Cmtris81 Rcration Srvic Rvnus82 Library Srvic Rvnus83 Othr Cultural and Rc. Srvic
Rvnus84 Mass Transit —City Opratd85 Othr Sals and Srvics86 Watr and Swr Chargs*88.1 Storm watr s91 Spcial Assssmnts92 Privat Contributions and Donations96 ABC Mixd Drin Surcharg97 ABC Proft Distribution98 Othr Miscllanous Rvnus
* excludd rom municipality- and county-onlyanalyss.
a f i r (afir) l i u a
by the numbers | APPeNDIX D: AFIR LINe ITeMS USeD IN ANALYSIS
county municipality
reVenue line
type ref. descriptionreVenue line
type ref. description
A P P E N
D
I x D

8/2/2019 By the Numbers: What Government Costs in North Carolina Cities and Counties FY 2010
http://slidepdf.com/reader/full/by-the-numbers-what-government-costs-in-north-carolina-cities-and-counties 45/46
a a
Michael Lowrey is an economist and a ormer instructor at the University o North Carolina at Charlotte
and Wingate University. A policy analyst in the elds o economics and regulatory policy or the John Locke
Foundation as well as associate editor o Carolina Journal , Lowrey has written numerous articles over theyears on such topics as economic policy, education, welare, and transportation, and has appeared in ove
100 newspapers such as The Christian Science Monitor, The Charlotte Observer, The News & Observer o Raleigh
and The News & Record o Greensboro. He received his undergraduate degree rom the University o North
Carolina at Chapel Hill and his masters in economics rom North Carolina State University.
a j l f
The John Locke Foundation is a nonprot, nonpartisan policy institute based in Raleigh. It seeks to trans
orm state and local government through the principles o competition, innovation, personal reedom, andpersonal responsibility in order to strike a better balance between the public sector and private institutions
o amily, aith, community, and enterprise.
To pursue these goals, JLF operates a number o programs and services to provide inormation and analysis
to policymakers, civic and community leaders, activists, and the news media. These services and program
include research reports on policy issues such as taxes, education, health care, regulation, and economic
development; a media outlet, Carolina Journal , with an audience o 200,000 North Carolinians receiving
print, radio, video, or online editions at CarolinaJournal.com ; a quarterly member newsletter, The Lock
Letter , and a variety o blogs, web sites, and media outreach eorts; and regular luncheons, policy briengs
panel discussions, and other events held throughout the year in Raleigh, Charlotte, the Triad, Asheville
Wilmington, and other North Carolina communities.
The John Locke Foundation is a 501(c)(3) tax-exempt public charity and is unded solely rom voluntary
contributions rom individuals, corporations, and charitable oundations. It was ounded in 1990. For more
inormation, visit www.JohnLocke.org .
On the cover: Trac on a highway in the all under Pilot Mountain (BigStockPhoto.com).

8/2/2019 By the Numbers: What Government Costs in North Carolina Cities and Counties FY 2010
http://slidepdf.com/reader/full/by-the-numbers-what-government-costs-in-north-carolina-cities-and-counties 46/46
“To prejudge other men’s notions
before we have looked into them
is not to show their darknessbut to put out our own eyes.”
JOHN LOCKE (1632–1704)
Author, Two Treatises of Government and Fundamental Constitutions of Carolina
Recommended