A REVIEW OF CLIMATOLOGICAL DATA FOR
GROUND SNOW LOADS IN ARIZONA
by
Scott Brent Freestone
_______________________
A Report Submitted to the Faculty of the
DEPARTMENT OF CIVIL ENGINEERING
AND ENGINEERING MECHANICS
In Partial Fulfillment of the Requirements
For the Degree of
MASTER OF SCIENCE
WITH A MAJOR IN CIVIL ENGINEERING
In the Graduate College
THE UNIVERSITY OF ARIZONA
2 0 0 6

STATEMENT BY AUTHOR
This report has been submitted in partial fulfillment of the requirements for an
advanced degree at the University of Arizona and is deposited in the Department of Civil
Engineering and Engineering Mechanics to be made available to borrowers under the
rules of the department.
Brief quotations from this report are allowable without special permission, provided
that the accurate acknowledgement of source is made. Requests for permission for
extended quotation from or reproduction of this manuscript in whole or in part may be
granted by the head of the major department or the Dean of the Graduate College when in
his or her judgment the proposed use of the material is in the interest of scholarship. In
all other instances, however, permission must be obtained from the author.
SIGNED: _______________________________
APPROVAL BY REPORT DIRECTOR
This report has been approved on the date shown below:
____________________________ ________________
Achintya Haldar, Ph.D., P.E. Date
Professor of Civil Engineering
And Engineering Mechanics

ACKNOWLEDGEMENTS
The author wishes to express appreciation for his Masters Report Review Committee, Dr.
Robert Fleishman and Dr. Mo Ehsani, and especially his Graduate Advisor, Dr. Haldar
for his expertise, support and patience through the completion of this report. Thanks are
also due at home, to the author’s wife Sabrina and his three children Claira, Camilla and
Brenten. Although they provided more distraction than contribution to productivity in
the completion of this study, their love, patience and inspiration was invaluable in the
pursuit of further education, knowledge and accomplishment.
1
TABLE OF CONTENTS
Page
List of Figures 2
List of Tables 2
Abstract 3
Chapter
1. Introduction 4
1.1 Code Background 4
1.2 Motivation 7
1.3 Objectives 12
2. Literature Review 14
2.1 Overview 14
2.2 Snow Loads Data for Arizona 14
2.3 Reliable Statistical Models for Snow 17
2.4 Densities for Depth-only Snow Data 20
3. Determination of Ground Snow Loads 22
3.1 Introduction 22
3.2 Data Collection 23
3.2.1 National Climate Data Center 26
3.2.2 National Weather and Climate Center 27
3.3 Statistical Methods 28
3.4 Density of Snow 33
3.5 Ground Snow Loads 40
3.6 Observations 50
3.7 Comparison of Ground Snow Load Data 55
4. Limitations 57
4.1 Mapping of Snow Loads 57
4.2 Missing Data 57
4.3 Statistical Modeling 58
5. Summary and Conclusion 60
5.1 Summary 60
5.2 Conclusion 61
Appendix A Ground Snow Loads with Statistical Data for All Sites 62
Appendix B Snow Load Data for Arizona 77
Works Cited 108

2
LIST OF FIGURES
1.1 Looking West down the University of Arizona
Mall in Tucson During a Snow Storm on April 4, 1999 7
1.2 Apartments in Flagstaff after a Snow Storm 8
1.3 A Portion of the ASCE 7-05 Ground Snow Load Map 11
2.1 Ground Snow Load Relationship to Snow Depth 21
3.1 Climate Division as Defined by NCDC 24
3.2 Data Stations by Climate Division 25
3.3 Data Stations by Source 26
3.4 NWCC Snow Course Sites 37
3.5 Density Relationship for Arizona Snow Course Sites 38
3.6 Data Stations with 50-year Ground
Snow Loads 12 psf or Greater 40
3.7 Latitude vs. 50-year Ground Snow Load 50
3.8 Elevation vs. 50-year Ground Snow Load—Climate Division 1 51
3.9 Elevation vs. 50-year Ground Snow Load—Climate Division 2 52
3.10 Elevation vs. 50-year Ground Snow Load—Climate Division 3 52
3.11 Elevation vs. 50-year Ground Snow Load—Climate Division 4 53
3.12 Elevation vs. 50-year Ground Snow Load—Climate Division 6 53
3.13 Elevation vs. 50-year Ground Snow Load—Climate Division 7 54
LIST OF TABLES
3.1 Chi-square Test Results for McNary 2N 29
3.2 SWE/Snow Depth Records during Storm 34
3.3 Load Comparison by Method 35
3.4 Summary of Ground Snow Loads 43
3.5 Comparison of Ground Snow Loads 55

3
ABSTRACT
A REVIEW OF CLIMATOLOGICAL DATA
FOR GROUND SNOW LOADS IN ARIZONA
by Scott Brent Freestone
Snow loads on structures are determined in modern building codes by applying
ground-to-roof conversion coefficients to ground snow loads. An essential part of
structural design for the mountainous regions of Arizona is designing for loads due to
snow. For accurate design for snow loading current ground snow loads in Arizona must
be updated. Historical snow data obtained from climate monitoring stations throughout
the state provide a basis for ground snow load predictions. Historical snow depth and
snow water equivalent data from climate monitoring sources for over 500 sites across the
state of Arizona have been compiled and modeled with lognormal distributions to
determine ground snow loads to be used in structural design. Ground snow loads with a
mean recurrence interval of fifty and thirty years (2% and 3.3% annual probability of
exceedance, respectively) are presented.
4
CHAPTER ONE
INTRODUCTION
1.1 CODE BACKGROUND
When approaching the design of a new structure, one generally refers to a
building code, such as the International Building Code (IBC) which is very common in
urbanized areas in Arizona, or the Uniform Building Code (UBC) which is still enforced
in some rural jurisdictions in Arizona. Building codes give an outline of the design
process for the structure, from the applied loads to account for to the analysis procedure
to employ. Second only to the utility required by the users of the structure, the loads
imposed on the structure are often the starting point of the design. Individual loads will
affect a structure independently and simultaneously in combinations. In most current
building codes combinations of loads to consider are given for two methods of design,
Allowable Stress Design (ASD, also referred to as Allowable Strength Design or Working
Stress Design) and Load and Resistance Factor Design (LRFD). (ASCE 7-05)
ASD is characterized by comparing the stresses on structural members due to
applied design loads to a predetermined allowable stress for the structural members.
These allowable stresses are established based on safety factors applied to the material
strength exhibited in standardized testing procedures and historical performance. These
factors are applied to the material strength to provide a confidence against the uncertainty
inherent in the material strength. These factors vary depending on the failure mechanism
(e.g., bending moment, shear, axial compression, etc.)
5
The common load combinations used for structural design with ASD are:
Dead (1.1)
Dead + Live (1.2)
Dead + Live + (Roof Live or Snow or Rain) (1.3)
Dead + (Wind or 0.7Seismic) + Live +
(Roof Live or Snow or Rain) (1.4)
0.6Dead + Wind (1.5)
0.6Dead + 0.7Seismic (1.6)
LRFD is characterized by comparing the strength requirements of the structural
components due to the application of factored loads to the allowable strength of the
member. Each type of load (e.g., dead, roof live, roof snow, etc.) has a different factor
representing uncertainty in the magnitude of the load and in the analysis from which the
load effect is obtained from the load. (Steel, 2005) As in ASD, the strength of the
member also has different resistance factors applied corresponding to each failure
mechanism.
The common load combinations used in structural design with LRFD are:
1.4Dead (1.7)
1.2Dead + 1.6Live + 0.5(Roof Live or Snow or Rain) (1.8)
1.2Dead + 1.6(Roof Live or Snow or Rain) +
(f1Live or 0.8Wind) (1.9)
1.2Dead + 1.6Wind +f1Live +
0.5(Roof Live or Snow or Rain) (1.10)
1.2Dead ± 1.0Seismic + f1Live + f2Snow (1.11)
0.9Dead ± (1.6Wind or 1.0Seismic) (1.12)
where f1 = 1.0 for floors in places of public assembly, for live loads in
excess of 100 psf, and for parking garage live loads.
= 0.5 for other live loads.
f2 = 0.7 for roof configurations (such as saw tooth) that do not
6
shed snow off the structure.
= 0.2 for other roof configurations.
Along with the affects of Dead, Live, Wind and Seismic loading, the affects of
Snow on a structure can be a crucial aspect of the design. In both design approaches,
ASD and LRFD, the design snow load is calculated from a basic ground snow load. The
equation for determining the snow load to be used in the design of a building with a roof
of a very low pitch (referred to as a flat roof in building codes) is as follows:
gtef IpCCP 7.0= (1.13)
where Pf is the Flat Roof Snow Load (psf)
Ce is a dimensionless exposure factor
Ct is a dimensionless thermal factor
I is a dimensionless importance factor
pg is the ground snow load (psf)
The determination of the roof snow load for sloped roofs has an additional step:
fss PCP = (1.14)
where Cs is a Roof Slope Factor
Pf is the Flat Roof Snow Load determined in equation 1.13
The Roof Slope Factor takes into account whether the roof is warm or cold,
whether the surface of the roof is slippery and unobstructed or not, how much pitch the
roof has and whether the roof is curved or not. (ASCE 7-05)

7
1.2 MOTIVATION
When considering structural design and engineering in Arizona, where the warm
weather and dry climate are well known, the last thing typically thought of is the affects
of snow on a structure. Much of the populated portions of the state rest at elevations
lower than 4,500 feet (1,372 m) above mean sea level and rarely have a considerable
accumulation of snow.
Figure 1.1 Looking West down the University of Arizona Mall In Tucson during a Snow Storm on April 4, 1999
Even in most of the areas where it does snow, the load from the small amount of
snow that is likely to accumulate would not exceed the live load consideration required in
the load combinations previously mentioned. From these load combinations it can be
surmised that if the roof snow load is equal to or less than the roof live load, there is no
need to consider the snow load at all. (It is important to note that for large roof areas the
live load may be reduced, but roof snow load may not. In these cases, the roof snow load
8
may be negligible if it is less than the reduced roof live load, 12 psf in most cases.) (IBC,
2003) This is the case for most of the metropolitan areas in the state. There are however
locations in the mountainous regions of the state, where this is not the case. Snow depths
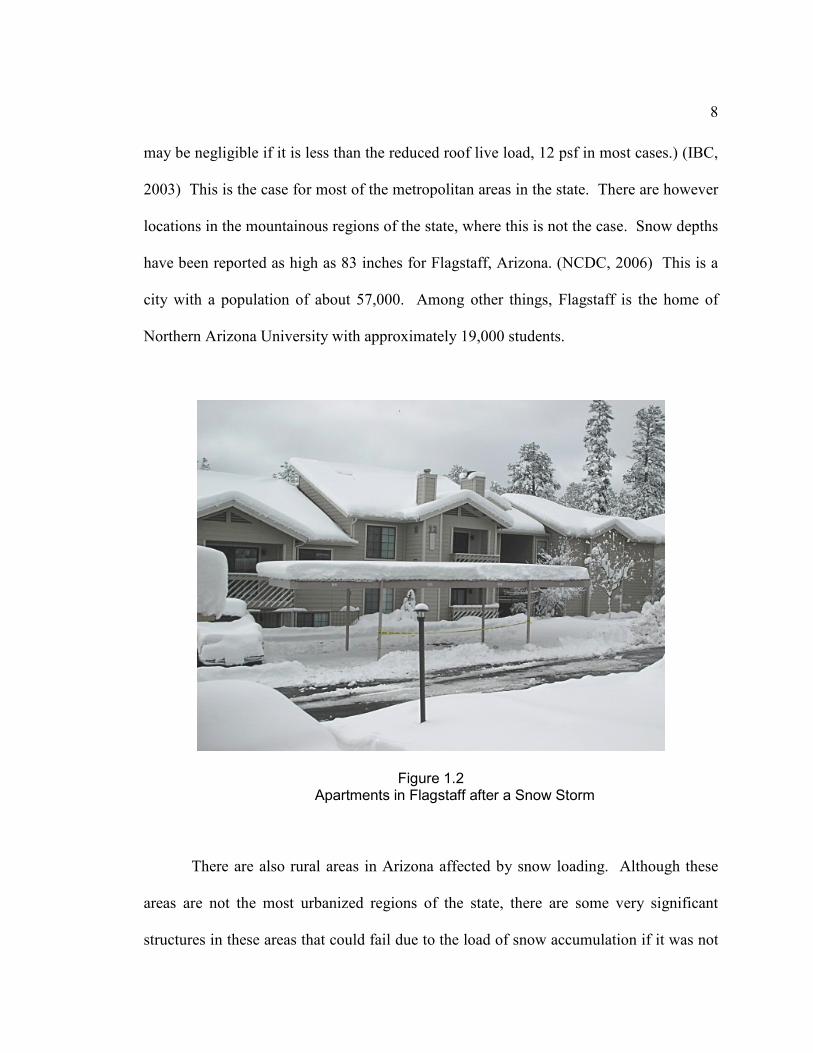
have been reported as high as 83 inches for Flagstaff, Arizona. (NCDC, 2006) This is a
city with a population of about 57,000. Among other things, Flagstaff is the home of
Northern Arizona University with approximately 19,000 students.
Figure 1.2 Apartments in Flagstaff after a Snow Storm
There are also rural areas in Arizona affected by snow loading. Although these
areas are not the most urbanized regions of the state, there are some very significant
structures in these areas that could fail due to the load of snow accumulation if it was not

9
properly considered in the design. For instance, in Southern Arizona, an area where the
climate is generally warm and snow loading is not given much thought in structural
design, Mt. Graham is the home of the University of Arizona’s Large Binocular
Telescope (LBT) at an elevation of 10,480 feet (3,194 m) above mean sea level. The
enclosure for the LBT is the height of a 12-story building rotating on a cylindrical base
38 feet tall. This is a very significant structure that houses “the world’s most powerful
optical telescope” (World’s, 2003) where reported snow depths have been as much as 120
inches (Elliott, 1981).
Another rural location with significant construction is a telescope site in Happy
Jack, Arizona. Happy Jack is a small town with a population between 600 and 700 in the
southeast corner of Coconino County. Lowell Observatory in conjunction with The
Discovery Channel is currently in the process of building a 4.2-meter telescope at an
altitude of 7800 feet (2,377 m) above mean sea level in Happy Jack. Because Happy
Jack is a small rural town there is no design snow load determined by a local jurisdiction
for structures built in the area. In addition to these telescope sites, there are also mines
with large structures at rural sites throughout Arizona, some of which are at high
elevations where snow would contribute significantly to the loading on the structure.
Loading due to snow is the most critical design load for many structures in the
mountainous regions of Arizona. At higher elevations snow will accumulate for most of
the winter season, and although Arizona boasts of warmer and dryer climates than much
of the United States, snow depths have been recorded as high as 126 inches (Elliott,

10
1981). The presence of significant amounts of snow during the winter months requires
the use of accurate snow loads in the design of buildings and other structures.
Some guidance for snow load design in Arizona does currently exist. Most
building codes currently used, such as the IBC and UBC reference snow load maps
published by the American Society of Civil Engineers (ASCE) in the Standard for
Minimum Design Loads for Buildings and Other Structures, ASCE 7. The maps in
ASCE 7 indicate basic ground snow loads to be used in design, pg used to determine the
roof snow load in equation 1.13. These maps have contours separating regions of
different climatological behavior. In each region grouped by contour lines the basic
ground snow load is indicated based on the elevation. At elevations above those shown
or locations where the snow load is unknown the designation “CS” is given to indicate
that a “Case Study” of that specific area is required to determine the basic ground snow
load to be used for design. Because of the characteristics of the rapidly varying terrain in
the mountainous regions of Arizona, the snow load cannot always be accurately shown
by general smoothed isolines. Hence, the “Case Study” areas are extensive for the higher
elevation areas of the state. This makes it difficult to design for snow loads in these areas
without performing an in-depth case study to determine the snow loads. (Tobiasson and
Greatorex, 1996)

11
Figure 1.3 A Portion of the ASCE 7-05 Ground Snow Load Map
To provide more accurate local information regarding ground snow loads many
states have published their own snow load design guides. (Arizona, 1981, Oregon, 1971,
Washington, 1995) Arizona’s state-specific guide, Snow Load Data for Arizona,
provides another resource for determining ground snow loads. (Elliot, 1981) In this study
ground snow loads with a magnitude predicted to occur once every 30 years are
published as a guide to aid in structural design.

12
Although we have a few resources available to assist in determining snow
loads for structural design, there still exists a need for additional information as well as
further refinement of existing information. Much of the map in ASCE 7 indicates
requirements for case studies to determine the ground snow load for specific areas. Snow
Load Data for Arizona gives recommendations for snow loads based on a 30-year return
period, which is not consistent with the requirements for most modern building codes.
(ASCE 7-05) Furthermore, there has been much research in this area over the past three
decades that could improve current snow load design methods. In Snow Load Data for
Arizona it is suggested that a future publication would be advisable as more weather
information and research becomes available (Elliott, 1981). This report explores the
research in snow loading from the 1980’s to current and its application in structural
design in Arizona.
1.3 OBJECTIVES
There is a recognized need for guidance when considering the effects of snow
loads on structures in the higher elevations of Arizona. Even though some locations in
Arizona have experienced considerable amounts of snowfall, the current resources
available do not provide a complete guide to designing structures in Arizona for snow
loads. In this study, reliable snow loads are developed for use in the design of buildings
and other structures in Arizona from historical climatological data. The National Water
and Climate Center (NWCC), under the U.S. Department of Agriculture National
Resources Conservation Service (formerly the U.S. Soils Conservation Service), has kept
13
records for the amount of snow on the ground measured in Snow Water Equivalents
(SWE) for 56 measuring stations in the mountainous regions of Arizona. The National
Climate Data Center (NCDC) also has an extensive database of historical weather records
that includes measurements for the daily snow depth at over 480 sites in Arizona.
Historical records for each of the sites with SWE data are statistically analyzed to
determine an annual extreme SWE that has a mean recurrence interval of 50 years (or an
annual 2% probability of being exceeded). (Haldar and Mahadevan, 2000) The SWE is
then translated directly into a snow load to give a ground snow load that will occur on
average once every 50 years, or a 50-year basic ground snow load. Likewise, the
historical records for daily snow depth are analyzed to predict an annual extreme snow
depth that has a mean recurrence interval of 50 years. An equation relating snow density
to the depth is then applied to the 50-year ground snow depth to determine a 50-year
ground snow load. Predicting 50-year ground snow loads in this report is consistent with
current codes and building design practices. (ASCE 7-05)
The Happy Jack site mentioned previously is in a designated Case Study area in
the ASCE 7-05 ground snow load maps and has a recommended ground snow load of 95
psf in Snow Load Data for Arizona. (Elliott, 1981) It will be interesting to compare this
ground snow load value to that found with the updated modeling to see if the previous
ground snow load is consistent with current practices suggested in the code.

14
CHAPTER TWO
LITERATURE REVIEW
2.1 OVERVIEW
Snow Load Data for Arizona (Elliott, 1981) provides useful snow load
information for many specific sites in Arizona and is widely used today as a guide by
design consultants across the state. The methods used in the development of ground
snow loads have received considerable attention in the research community and have
improved substantially during the past 3 decades. Since the publication of Snow Load
Data for Arizona there has been much research done on the statistical modeling of snow
loads. There have also been developments in the determination of ground snow loads
from historical data with only depth of snow records. Furthermore, there now exists
approximately 32 additional years or historical snow records with improvements on
measuring and reporting the data.
2.2 SNOW LOAD DATA FOR ARIZONA
Snow Load Data for Arizona (Elliott, 1981) was prepared by a special Snow Load
Committee of the Central Chapter of the Structural Engineers Association of Arizona in
Cooperation with the Civil Engineering Department of Arizona State University. It was
published in 1973 with a second printing in 1981. There were no revisions to the
information in the second printing, only a one-page Foreword with a few notes
responding to frequent questions that had been voiced as the structural design community
of Arizona had begun implementing the findings of the report in their work.
15
Snow Load Data for Arizona presents basic ground snow loads to be used in
design as well as information for the application of snow loads on structures with factors
for wind exposure, sloped roofs, shape of roofs, etc. similar to those outlined in Section
1.1. The ground snow loads presented will be discussed here, but the application of loads
on structures will be ignored since this is covered thoroughly in building codes and is
beyond the scope of this study.
The introduction to Snow Load Data for Arizona states that it is intended to serve
as a guide to structural designers. As a guide to designers there is no statistical
information detailed in the report. There is however tables giving useful information
including the 30-year basic ground snow load and the 30-year basic roof snow load for
each of the sites studied. These tables also list the elevation for each site, the month and
year of the maximum snow depth; maximum snow depth (inches), maximum measured,
calculated, or estimated weight of snow on ground (psf) and the source of the data. Each
site in the tables is divided into one of five “Snow Zones.” The Snow Zones are
geographical areas of Arizona that are separated by weather patterns and weather
behavior, including snowfall.
The report states that the three major sources of snow data used were: 1) U.S. Soil
Conservation Service (SCS) Snow Survey records, 2) U.S. Weather Bureau records and
3) “Actual Snow Loads in Arizona, a detailed study of the great storm of December
1967.” (Elliott, 1968) The SCS records provided data for the depth and weight of snow
on the ground. Actual Snow Loads in Arizona provided information for snow depth and
estimated ground snow loads for a single storm in December 1967. “This storm was the
16
heaviest short period snow fall in most areas of the state.” (Elliott, 1968) The U.S.
Weather Bureau records provided information only for the depth of snow. For the data
with only snow depth, weights of snow were determined by comparing similar stations
that had both depth and weight measurements.
Plots for maximum ground snow loads vs. elevation for each Snow Zone are
included as figures in the report. In discussion of the development of the snow loads it is
stated that the original intent was to draw regression curves for each of these plots and
use the curve values for the basic ground snow loads. This approach was abandoned due
to inaccurate loads resulting from the wide scatter of data. No regression curves were
included in the final publication of the report, only the plots. These curves did however
aid in determining the ground snow loads, but ultimately each site was considered and
assigned a ground snow load individually. Elliott does not indicate the precise methods
used to determine the ground snow loads published in this report. He does indicate that
the snow density assumptions for the sites with only snow depth measurements are most
likely “fraught with error…There is no way of judging accuracies of these weight
estimates, but hopefully they are within 30%±.” (Elliott, 1981)
Factors affecting the accuracy of determined snow loads based on depths are the
variability in exposure of each of the sites (sun exposure decreases snow depth, but
increases snow density) and the time during the season when the snow depth is measured
(higher densities as snow melts later in the spring). Elliott suggests that reason and
judgment were essential to develop the snow loads. If reason and judgment were
required to determine snow loads based on the limited and varying data available, Elliott

17
would be considered a qualified judge since his study was the source of much of the data
used. He suggests that reason and judgment were not only used to develop the loads, but
they are also required in application of the snow loads in structural design.
2.3 RELIABLE STATISTICAL MODELS FOR SNOW
For sufficient design of structures it is imperative to have accurate snow loads for
design. Snowfall, however, is a naturally occurring phenomenon with some variability.
As is well known in Arizona where water resources depend considerably on snowmelt,
snowfall or snow depth does not measure the same each season. That is to say, the
snowfall or snow depth varies from season to season, and from site to site. In order to
accurately predict snow loading for structural design there must be a reliable statistical
model for this natural phenomenon.
The American National Standard A58 (the predecessor to the current design load
standard, ASCE 7) developed ground snow loads for structural design based on an
analysis of annual extreme ground snow load data from National Weather Service climate
monitoring stations. The ground snow load maps in the 1972 publication of the A58
Standard were based on 10 years of data at 140 monitoring stations (Ellingwood and
Redfield, 1983). Subsequent publications have increased the data used in analysis, in
both number of years of data and number of sites. With this expansion of data the design
values changed, in some cases these changes were significant. In the case of the 1972
Edition of the A58 Standard ground snow loads with a mean recurrence interval of 50
years were determined using only 10 years of data. It is easy to see that the extrapolation

18
from 10 years of actual data to predicting a value with a 50-year mean recurrence interval
would be very sensitive to the statistical model used. The limited historical
climatological data available from some of the climate monitoring stations makes it
critical to find a reliable statistical model to predict the values to be used in analysis and
design.
Some of the statistical distributions used for modeling of annual extreme snow
loads in the era of the 1972 Edition of the A58 Standard were Tippett Type I and Frechét
Type II extreme value distributions. These distributions were found to be inadequate in
predicting the upper quantiles; the Type I distribution underestimated snow loads while
the Type II distribution greatly overestimated the snow loads in the upper quantiles.
Instead, the lognormal distribution was tried on the annual extreme snow water
equivalent data for 50 sites across the United States and “fit very well” (Thom, 1966).
The recommendation by Thom to use a lognormal distribution became the basis for the
snow load maps in the 1972 Edition of the A58 Standard (Ellingwood and Redfield,
1984).
Ellingwood and Redfield (1983) further explored possible distributions used to
model ground snow loads. Records for 76 “first-order” weather stations operated by the
National Oceanic and Atmospheric Administration located in northeastern United States
were examined. These sites are indicated as “first-order” stations because they provide
data for the depth of snow as well as the water equivalent of snow (from which the
weight of snow can be directly determined). The snow water equivalent (SWE) data was
used to avoid the additional source of error inherent in the variability of the density

19
conversion of snow depth to snow load. In order to determine an appropriate distribution
model the comparison was made between models that were commonly used to describe
the distribution of the annual extreme SWE. The distributions included in the
comparison in the study were lognormal, log-Pearson Type III, Type I and Type II.
Because the common tests for goodness-of-fit, the chi-square for lognormal distribution
and Kolmogorov-Smirnov for Type I distributions (Haldar and Mahadevan, 2000), gave
conflicting results for the best fitting distributions, the maximum probability plot
correlation coefficient (MPPCC) criterion was used to determine the goodness of fit for
each distribution (Ellingwood and Redfield, 1984).
The results of the study indicated that according to the MPPCC criterion, 30% of
the sites had a distribution best fit by a lognormal distribution, 21% by a log-Pearson
Type III, 24% by a Type I and 25% by a Type II distribution. Although the number of
sites which showed the best fit for each distribution assumption did not vary greatly,
through further investigation data sets were developed from a lognormal parent
population using Monte Carlo techniques (Haldar and Mahadevan, 2000) and found
strikingly similar results for percentages of data sets best fit by the respective
distributions. The exercise was repeated with a Type I parent population and altogether
different results were found. Finally, the study was concluded in agreeance with the
aforementioned report completed 18 years previous (Thom, 1966) with a
recommendation to use lognormal distribution for modeling annual extreme snow water
equivalents.
20
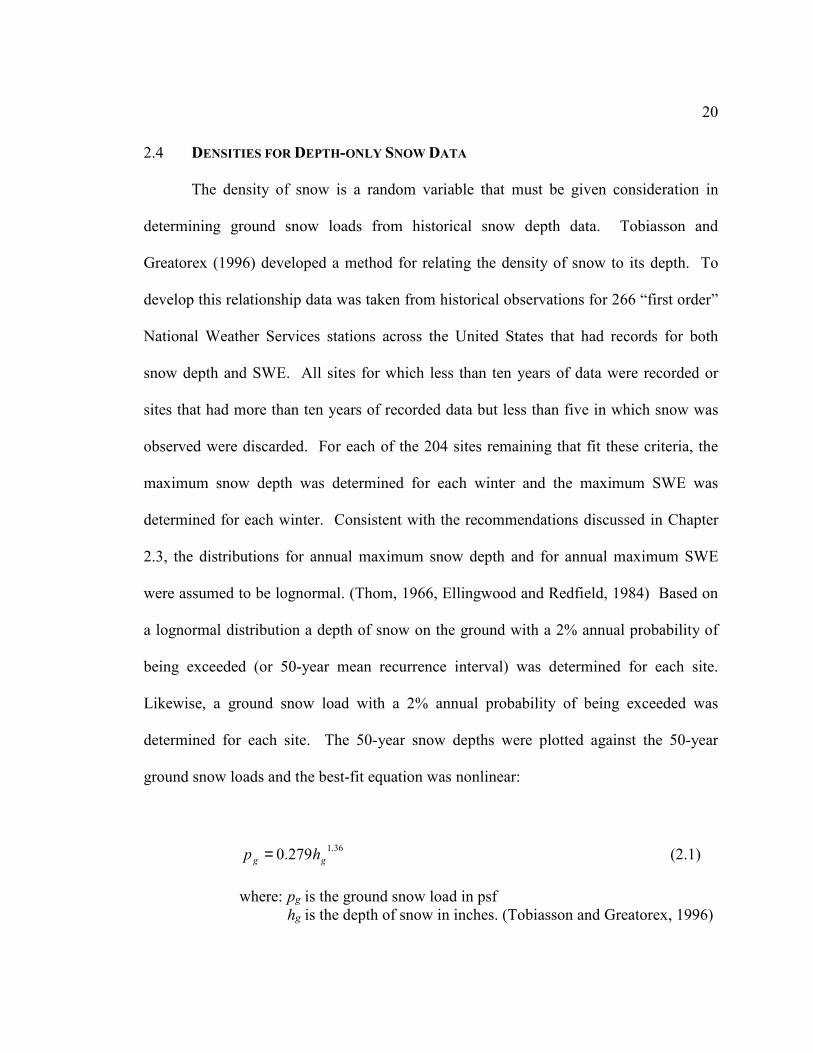
2.4 DENSITIES FOR DEPTH-ONLY SNOW DATA
The density of snow is a random variable that must be given consideration in
determining ground snow loads from historical snow depth data. Tobiasson and
Greatorex (1996) developed a method for relating the density of snow to its depth. To
develop this relationship data was taken from historical observations for 266 “first order”
National Weather Services stations across the United States that had records for both
snow depth and SWE. All sites for which less than ten years of data were recorded or
sites that had more than ten years of recorded data but less than five in which snow was
observed were discarded. For each of the 204 sites remaining that fit these criteria, the
maximum snow depth was determined for each winter and the maximum SWE was
determined for each winter. Consistent with the recommendations discussed in Chapter
2.3, the distributions for annual maximum snow depth and for annual maximum SWE
were assumed to be lognormal. (Thom, 1966, Ellingwood and Redfield, 1984) Based on
a lognormal distribution a depth of snow on the ground with a 2% annual probability of
being exceeded (or 50-year mean recurrence interval) was determined for each site.
Likewise, a ground snow load with a 2% annual probability of being exceeded was
determined for each site. The 50-year snow depths were plotted against the 50-year
ground snow loads and the best-fit equation was nonlinear:
36.1
279.0 gg hp = (2.1)
where: pg is the ground snow load in psf
hg is the depth of snow in inches. (Tobiasson and Greatorex, 1996)

21
Ground Snow Load vs. Snow Depth
pg = 0.279h1.36
0
20
40
60
80
100
0 20 40 60 80
Snow Depth, h
(inches)
Gro
un
d S
no
w L
oad
, p
g
(psf)
Figure 2.1 Ground Snow Load Relationship to Snow Depth
Figure 2.1 illustrates that the density of snow increases with its depth. For
instance, a snow depth of 20 inches contains 15.8% water while a snow depth of 60
inches contains 23.3% water. This seems to be an accurate assumption for sites where
the snow continues to pack throughout the winter and spring, compressing snow near the
bottom of the snow pack. As will be shown later, this may not be the most accurate
relationship for sites that have an annual extreme snow depth characterized by a periodic
snow storm that melts away before the next snow storm occurs.
This equation relating snow depth to ground snow load has been used for the
forty-eight contiguous states to determine the ground snow loads from historical snow
depth data to develop the ground snow load maps in the ASCE 7. (O’Rourke, 2004)

22
CHAPTER THREE
DETERMINATION OF GROUND SNOW LOADS
3.1 INTRODUCTION
The methods used to determine the ground snow loads presented in this report
include gathering data for historical snow depth or snow water equivalents for as many
sites as possible within the state of Arizona, modeling them statistically and determining
a 50-year snow depth or 50-year snow water equivalent. For the snow depth data, density
conversion is required to obtain a ground snow load. For the snow water equivalent data,
a unit conversion from inches of water to pounds per square foot is required to determine
the applicable load:
=
.
.12
..4.62
ft
in
ftcu
lbs
SWEp g (3.1)
where pg is the ground snow load (psf)
SWE is the Snow Water Equivalent (inches of water)
In order to reduce the task of analysis, it was decided to ignore data from certain
sites that would obviously not have a ground snow load large enough to impact structural
design. To be sure that the data would not yield a significant ground snow load a low
threshold was set for those data sets to be ignored. All sites with an annual maximum
observed snow depth of 6 inches or less were set aside and not included in the statistical

23
analysis. These sites are shown with a ground snow load equal to zero in Table 3.4,
Summary of Ground Snow Loads, presented later in this chapter.
3.2 DATA COLLECTION
Data was taken from 2 main sources: the National Climate Data Center and the
National Weather and Climate Center. These sources were used because they provided
data that was publicly available and provided a large number of sites across the state.
Other sources likely exist with additional historical snow depth and/or snow water
equivalent data. The United States Forest Service was contacted for further historical
snow data from the national forests but no response was received within time to include
in this report. There are sites in Snow Data for Arizona for which current data could not
be obtained. Although there is possibly more data available, the sources aforementioned
seem to provide a good representation of Arizona and were utilized in this study.
Each site is assigned to a Climate Division, as illustrated in Figure 3.1, by the
NCDC. Climate Divisions are intended to be geographic divisions of homogeneous
weather. The Climate Divisions are a further development of the “Snow Zones”
mentioned in Snow Load Data for Arizona. (Elliot, 1981) It appears that the boundaries
for the climate divisions fall on county borders, which are not necessarily precise
divisions for change in climate behavior. This method was likely chosen for convenient
bookkeeping and reporting instead of homogenous climate. It should be noted that the
NCDC is currently in the midst of a review of the Climate Divisions across the United
States. They are likely to be revised to more accurately represent areas of similar

24
climate. Figure 3.2 is a diagram of all the sites from which data was collected
distinguished by Climate Division. Included for reference are the locations of Flagstaff,
Phoenix and Tucson.
Figure 3.1 Climate Divisions As Defined by NCDC

25
Figure 3.2 Data Stations by Climate Divisions
Figure 3.3 shows all the sites distinguished by the source of the data. In some
instances sites from different sources are at the same location. Because some sources had
data for different time periods recorded each site was treated individually regardless of its
proximity to other sites. Data was manipulated individually to enable statistical modeling
for each site independently with independent results.
All Sites by Climate Division
31.00
32.00
33.00
34.00
35.00
36.00
37.00
-115.00 -114.00 -113.00 -112.00 -111.00 -110.00 -109.00
Longitude
Lati
tud
e
Cl. Div. 1
Cl. Div. 2
Cl. Div. 3
Cl. Div. 4
Cl. Div. 5
Cl. Div. 6
Cl. Div. 7
Approx. StateCornersPhoenix
Tucson
Flagstaff

26
All Sites by Source
30.50
31.50
32.50
33.50
34.50
35.50
36.50
37.50
-115.00 -114.00 -113.00 -112.00 -111.00 -110.00 -109.00
Longitude
Lati
tud
e
NCDC
Snow Course
Snotel
Approx. StateCorners
Phoenix
Flagstaff
Tucson
Figure 3.3 Data Stations by Sources
3.2.1 NATIONAL CLIMATE DATA CENTER
The National Climate Data Center (NCDC) is a part of the United States
Department of Commerce. It is specifically operated as part of the National
Environmental Satellite, Data, and Information Service of the National Oceanic and
Atmospheric Administration. The purpose of NCDC is to manage the Nation’s global

27
climatological data for monitoring, assessment, and prediction of changes in the global
climate. (NCDC, 2006)
The NCDC maintains a database of information from a cooperative network of
climate observers. Many different climate-monitoring organizations contribute data to
the database. Information for this report was accessed from the NCDC database through
the Office of the State of Arizona Climatologist. Andrew W. Ellis, Director of the Office
of Climatology and State Climatologist for Arizona was contacted by email and in turn
filed a request with the NCDC for the data of interest. In less than one day a response
was received indicating that the data was available via an Internet .ftp site. The data
remained available for seven days, after which it was deleted from the .ftp site. The data
was provided for download as a zipped file containing ASCII files. There was over 150
megabytes of information in ASCII format, including historical daily snow depths for
483 individual sites in Arizona. The number of years that data was recorded varied
greatly by site from 1 year to 173 years (the number of years of data is included in Table
3.4, Summary of Ground Snow Loads). In addition to the snow depth data there was
miscellaneous information that was discarded (i.e. to reduce the data down before it could
be manipulated for statistical modeling).
3.2.2 NATIONAL WEATHER AND CLIMATE CENTER
The National Weather and Climate Center (NWCC) is part of the National
Resource Conservation Service operated under the United States Department of

28
Agriculture. Their purpose is to promote national resource conservation by leading the
development and transfer of climate information. (NWCC, 2006)
The Snow Survey program is maintained primarily to provide mountain snow
pack and streamflow forecasting information. Two types of sites are maintained by the
NWCC for monitoring snow water equivalents (SWE), Snow Course sites and Snotel
sites.
Snow Course sites are generally meadow areas that are well protected from wind.
Measurements are taken manually around the beginning and end of each month during
the winter and spring. Data from these sites included the depth of snow, the SWE and the
date the measurement was taken. The number of years that data was recorded varied
from 6 to 68 years.
Snotel (for SNOwpack TELemetry) sites are automated sites that transmit data via
VHF radio signals to a central computer in Portland, Oregon. The SWE is measured
daily by a pressure sensitive pillow. Snotel sites are generally located in high mountain
watersheds. The information available from these sites included the daily SWE and the
date and times of measurement. The number of years recorded for each site varied from
6 years to 23 years.
3.3 STATISTICAL METHODS
Consistent with the recommendations of the previously mentioned studies (see
Section 2.3) and the current design load standards, a lognormal distribution was assumed
for the annual extreme snow depth for NCDC sites and annual extreme SWE for the

29
NWCC sites. In order to verify the goodness-of-fit for the lognormal distribution a chi-
square goodness-of-fit test was performed on a data set from a typical NCDC site. The
McNary 2N site has records available for 73 years in which the minimum annual extreme
snow depth recorded was 8 inches and the maximum annual extreme snow depth was 42
inches. The results of the test are shown in Table 3.1. Occurrences are years in which
the annual extreme snow depth is within the interval indicated.
Table 3.1 Chi-square Test Results for McNary 2N
Snow Depth
Observed
Occurences
Theoretical
Occurences (O-T)2/T
<10 4 4.0 0.00
10 to 15 15 16.8 0.18
15 to 19 19 16.6 0.34
19 to 25 16 18.5 0.34
20 to 29 7 7.2 0.01
30 to 39 10 7.6 0.79
>39 2 2.3 0.05
Sum = 73 73.0 1.72
McNary 2N
With 4 degrees of freedom (7 intervals - 1- 2 distribution parameters = 4 degrees
of freedom) the resulting chi-square value is less than 9.488 corresponding to a 5%
significance level, hence the lognormal distribution is acceptable at the 5% significance
level. (Haldar and Mahadevan, 2000) This test was not performed on all the sites, but
having a 5% significance level indicates that 5 samples out of 100 are not modeled
accurately with a lognormal distribution. A 5% significance level is adequate for
purposes of modeling annual extreme snow data.
30
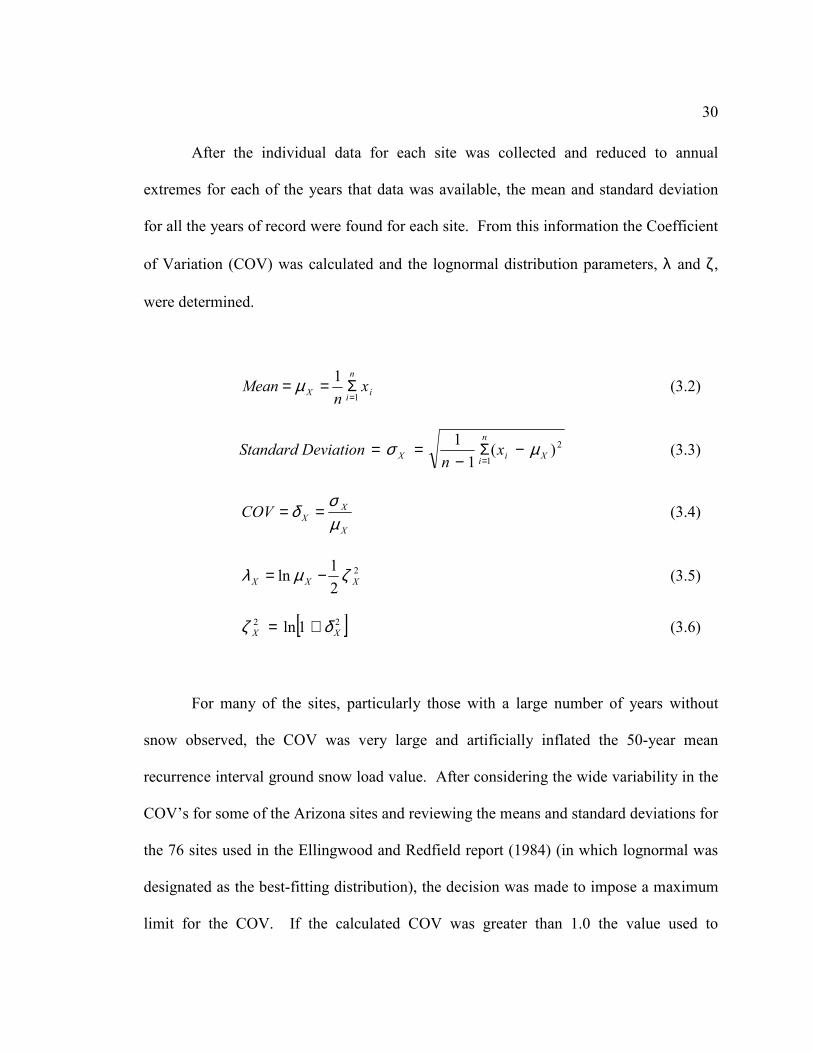
After the individual data for each site was collected and reduced to annual
extremes for each of the years that data was available, the mean and standard deviation
for all the years of record were found for each site. From this information the Coefficient
of Variation (COV) was calculated and the lognormal distribution parameters, λ and ζ,
were determined.
i
n
iX x
nMean
1
1
=Σ== µ (3.2)
Standard Deviation 2
1)(
1
1Xi
n
iX x
nµσ −Σ
−==
= (3.3)
X
X
XCOVµσδ == (3.4)
2
2
1ln XXX ζµλ −= (3.5)
[ ]22 1ln XX δζ += (3.6)
For many of the sites, particularly those with a large number of years without
snow observed, the COV was very large and artificially inflated the 50-year mean
recurrence interval ground snow load value. After considering the wide variability in the
COV’s for some of the Arizona sites and reviewing the means and standard deviations for
the 76 sites used in the Ellingwood and Redfield report (1984) (in which lognormal was
designated as the best-fitting distribution), the decision was made to impose a maximum
limit for the COV. If the calculated COV was greater than 1.0 the value used to
31
determine ζ2 was limited to 1.0. All sites that had a calculated COV equal to or less than
1.0 were not modified. After these modifications of the COV, the results appeared more
realistic and consistent than with the inflated COV’s.
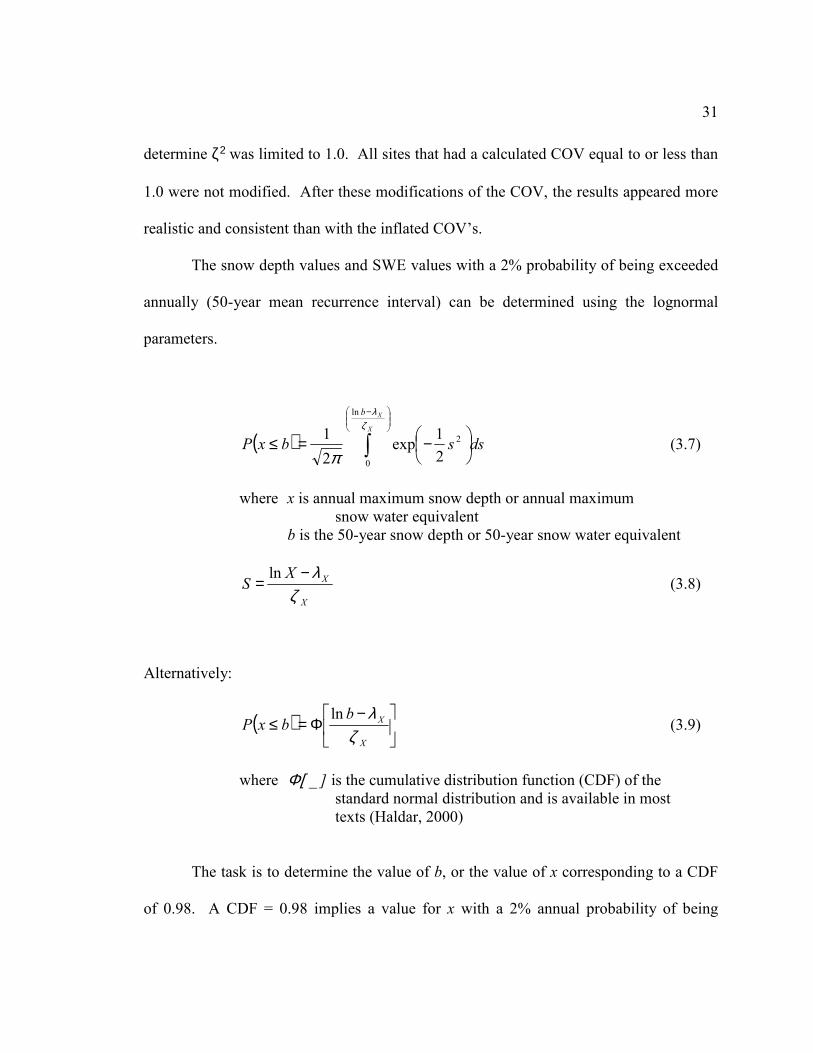
The snow depth values and SWE values with a 2% probability of being exceeded
annually (50-year mean recurrence interval) can be determined using the lognormal
parameters.
( ) dssbxPX
Xb
∫
−
−=≤ζ
λ
π
ln
0
2
2
1exp
2
1 (3.7)
where x is annual maximum snow depth or annual maximum
snow water equivalent
b is the 50-year snow depth or 50-year snow water equivalent
X
XXS
ζλ−
=ln
(3.8)
Alternatively:
( )
−Φ=≤
X
XbbxP
ζλln
(3.9)
where Φ[ _ ] is the cumulative distribution function (CDF) of the
standard normal distribution and is available in most
texts (Haldar, 2000)
The task is to determine the value of b, or the value of x corresponding to a CDF
of 0.98. A CDF = 0.98 implies a value for x with a 2% annual probability of being

32
exceeded (1-0.98 = 2%). A value for
−
X
Xb
ζλln
that corresponds to value of
98.002.01ln
=−=
−Φ
X
Xb
ζλ
can be found from a table commonly found in a textbook.
Referencing the table in Appendix 1 of Probability, Reliability and Statistical Methods in
Engineering Design (Haldar and Mahadevan, 2000) one can find that for
98.0ln
=
−Φ
X
Xb
ζλ
, the corresponding value of 0548.2ln
=
−
X
Xb
ζλ
. Solving for b
yields:
[ ]XXb λζ +∗= 0548.2exp (3.10)
This process can be repeated to determine the 30-year snow depth and snow water
equivalent. For a 30-year mean recurrence interval a corresponding value for x with a
%3.330
1 = annual probability of being exceeded is sought. The corresponding value of
8339.1ln
=
−
X
Xb
ζλ
. Similar to equation 3.10 we solve for b:
[ ]XXb λζ +∗= 8339.1exp (3.11)
33
These same steps can be applied for any mean recurrence interval of interest. The
appropriate values for the CDF, Φ, must be selected, then a table referenced for the
corresponding value of
−
X
Xb
ζλln
.
With these values the 50-year and 30-year ground snow loads were established for
each site. For the sites with SWE data equation 3.1 is used to find the ground snow load.
For the sites with only snow depth data the density of the snow must be determined in
order to find a 50-year or 30-year ground snow load.
3.4 DENSITY OF SNOW
The density of snow is a difficult quantity to measure. Not only can it vary
greatly from site to site, but it can also vary at a given site throughout the duration of the
snow season. Furthermore, at a given site and time the density of snow in a snow pack
can vary within the snow pack from the bottom of the snow pack to the top. A few
reasons for this variation in density are; the packing of the snow, the wetness of the snow
when it falls and the thawing and refreezing action of the snow through the season. Early
in the season, when the temperatures are colder, the snow falls and remains frozen on the
ground. As it accumulates the weight of the snow piling on top compresses the snow
near the bottom to a higher density. Conversely, prolonged or repeated exposure to the
sun can cause the snow near the top to melt down into the snow pack where it refreezes.
Although the density through the depth of the snow varies, an average density of the

34
snow pack is considered sufficient for analysis. This average density increases as the
density increases at the bottom or the top of the snow pack.
Table 3.2 illustrates the variations in snow density at two NWCC sites. It
includes the measured snow depth and measured SWE at the Snowslide Canyon and
Happy Jack sites for a snowstorm during March 2006.
Table 3.2 SWE/Snow Depth Records during Storm
Date
Snow Water
Equivalent Snow Depth
Change in
Snow Water
Equivalent
Change in
Snow Depth
% Water
of Snow
3/9 2.8 5.5 51%
3/10 3.3 5.7 0.5 0.2 58%
3/11 4.6 20.4 1.3 14.7 23%
3/12 6.0 34.3 1.4 13.9 17%
3/13 6.7 34.8 0.7 0.5 19%
3/14 6.6 29.4 -0.1 -5.4 22%
3/15 7.0 24.5 0.4 -4.9 29%
3/16 6.9 22.1 -0.1 -2.4 31%
Date
Snow Water
Equivalent Snow Depth
Change in
Snow Water
Equivalent
Change in
Snow Depth
% Water
of Snow
3/9 0.0 0.7 0%
3/10 0.0 0.3 0.0 -0.4 0%
3/11 0.5 3.3 0.5 3.0 15%
3/12 1.8 14.2 1.3 10.9 13%
3/13 2.3 15.0 0.5 0.8 15%
3/14 2.3 13.3 0.0 -1.7 17%
3/15 2.3 10.7 0.0 -2.6 21%
3/16 2.2 9.5 -0.1 -1.2 23%
Snowslide Canyon
Happy Jack
During the week of the storm, the depth of snow drops off very quickly after the
storm passes, but the SWE remains almost constant for a few days. The 5.5 inches of
snow with a 51% water at the beginning of the week before the storm at Snowslide
Canyon had obviously been on the ground for some time and had already experienced

35
significant melting. Just as new snow falling can change the density of a deep snow pack
by packing it even further, the new drier snow fell and the average density decreased
drastically for the Snowslide Canyon site. This same general behavior is evident at the
Happy Jack site as well; on March 12 the density (or % water) decreased as the dry and
light snow fell, then it melted and decreased in depth, but the weight remained consistent.
Table 3.3 compares the ground snow load measured by the SWE data and the
ground snow load calculated using equation 2.1.
Table 3.3 Load Comparison by Method
Date
Snow Water
Equivalent Snow Depth
Ground Snow
Load From
Snow Water
Equivalent
Ground Snow
Load From
Snow Depth
(Eq. 2.1) % Difference
3/9 2.8 5.5 14.6 2.8 81%
3/10 3.3 5.7 17.2 3.0 83%
3/11 4.6 20.4 23.9 16.9 30%
3/12 6.0 34.3 31.2 34.2 -10%
3/13 6.7 34.8 34.8 34.8 0%
3/14 6.6 29.4 34.3 27.7 19%
3/15 7.0 24.5 36.4 21.6 41%
3/16 6.9 22.1 35.9 18.8 48%
Date
Snow Water
Equivalent Snow Depth
Ground Snow
Load From
Snow Water
Equivalent
Ground Snow
Load From
Snow Depth
(Eq. 2.1) % Difference
3/9 0.0 0.7 0.0 0.2 NC
3/10 0.0 0.3 0.0 0.1 NC
3/11 0.5 3.3 2.6 1.4 46%
3/12 1.8 14.2 9.4 10.3 -10%
3/13 2.3 15.0 12.0 11.1 7%
3/14 2.3 13.3 12.0 9.4 21%
3/15 2.3 10.7 12.0 7.0 41%
3/16 2.2 9.5 11.4 6.0 48%
Snowslide Canyon
Happy Jack
36
Equation 2.1 does not give accurate results in predicting the ground snow load at
these 2 sites. It does, however, predict the snow load exactly for one day of record at the
Snowslide Canyon site, March 13. It would be expected that equation 2.1 would be
relatively accurate; however the prediction of the daily snow load is not the intent of the
study done by Tobiasson and Greatorex (1996) in the development of equation 2.1. This
relationship was developed from comparing annual maximum snow depth to annual
maximum SWE. This does not imply that it can be accurate for predicting snow density
on any given site on any given day. It must be remember that equation 2.1 is intended to
predict annual maximum ground snow load from annual maximum snow depth.
With a few exceptions, the predictions for ground snow loads shown in Table 3.3
by equation 2.1 appear to be low. This could be due to the fact that the annual extreme
values for snow depth and SWE used in the development did not occur in the spring,
when snow is known to have a higher density. (Fridley et al., 1994) This equation was
also developed by fitting data from 204 sites across the United States to a single curve.
The report does not indicate where the data for each site fell relative to the curve. There
could have been areas of the U.S. that had more scatter relative to other areas. There are
many possible causes for the inaccuracies in the predictions of ground snow loads, but it
is impossible to come to a certain conclusion for such an isolated snowstorm incident as
shown in the case study.
Although equation 2.1 cannot be expected to predict the ground snow load from
snow depth for two sites in Arizona from an isolated spring snowstorm, noting the
inaccuracies does cause questions to arise as to the applicability for this equation for

37
Arizona. To further investigate the application and suitability of this equation
specifically for Arizona, a study similar to that of Tobiasson and Greatorex (1996) has
been conducted.
NWCC Snow Course Sites
30.50
31.50
32.50
33.50
34.50
35.50
36.50
37.50
-115.00 -114.00 -113.00 -112.00 -111.00 -110.00 -109.00
Longitude
Lati
tud
e
Snow Course
Approx. StateCorners
Phoenix
Flagstaff
Tucson
Figure 3.4 Location of NWCC Snow Course Sites
38
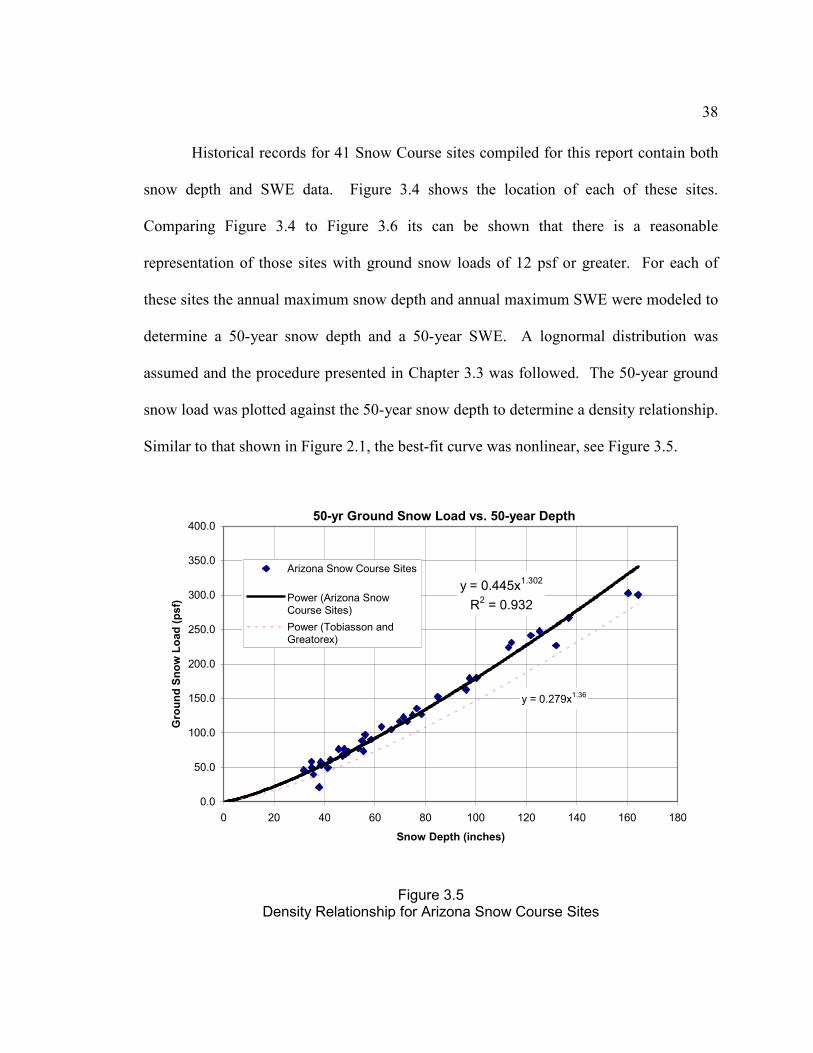
Historical records for 41 Snow Course sites compiled for this report contain both
snow depth and SWE data. Figure 3.4 shows the location of each of these sites.
Comparing Figure 3.4 to Figure 3.6 its can be shown that there is a reasonable
representation of those sites with ground snow loads of 12 psf or greater. For each of
these sites the annual maximum snow depth and annual maximum SWE were modeled to
determine a 50-year snow depth and a 50-year SWE. A lognormal distribution was
assumed and the procedure presented in Chapter 3.3 was followed. The 50-year ground
snow load was plotted against the 50-year snow depth to determine a density relationship.
Similar to that shown in Figure 2.1, the best-fit curve was nonlinear, see Figure 3.5.
50-yr Ground Snow Load vs. 50-year Depth
y = 0.445x1.302
R2 = 0.932
y = 0.279x1.36
0.0
50.0
100.0
150.0
200.0
250.0
300.0
350.0
400.0
0 20 40 60 80 100 120 140 160 180
Snow Depth (inches)
Gro
un
d S
no
w L
oad
(p
sf)
Arizona Snow Course Sites
Power (Arizona SnowCourse Sites)
Power (Tobiasson andGreatorex)
Figure 3.5 Density Relationship for Arizona Snow Course Sites

39
The curve determined from Arizona sites predicts a higher load for a given depth
than that determined from equation 2.1 for the entire U.S. The reasons for this may be
the same as those discussed previously. The refinement of this density relationship to
represent Arizona exclusively yields the equation:
302.1445.0 gg hp = (3.12)
where pg is the ground snow load in psf (multiply by 0.048 to get kN/m2)
hg is the depth of snow in inches
Equation 3.12 shows only the curve that fit the scatter best, with no adjustment to
increase the confidence level for the predicted ground snow load. From the Coefficient
of Determination R2 value of 0.932 in Figure 3.5 it can be shown that the relationship
shown in equation 3.12 is an accurate predictor accounting for 93% of the total variation
in ground snow loads. (Haldar and Mahadevan, 2000) Because this curve fit the data
scatter best and represents the approximate mean, if we further assume that the median is
close to the mean, it can be expected that it will provide a conservative prediction
approximately half of the time.
Because equation 3.12 fits the data available for Arizona better than equation 2.1,
it is used in this study for determining ground snow loads from snow depth; nevertheless,
determining the density of snow is a complex task with numerous random variables and
has been the source of many inaccuracies for decades. (Elliott, 1981)
40
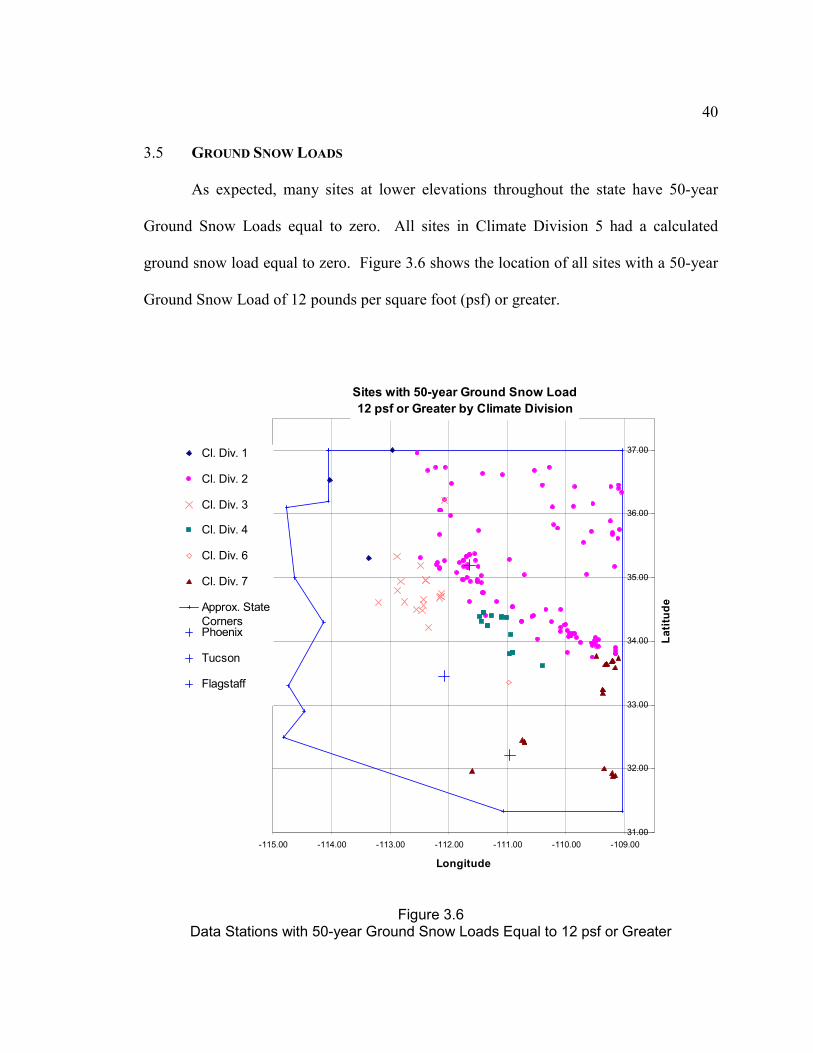
3.5 GROUND SNOW LOADS
As expected, many sites at lower elevations throughout the state have 50-year
Ground Snow Loads equal to zero. All sites in Climate Division 5 had a calculated
ground snow load equal to zero. Figure 3.6 shows the location of all sites with a 50-year
Ground Snow Load of 12 pounds per square foot (psf) or greater.
Sites with 50-year Ground Snow Load
12 psf or Greater by Climate Division
31.00
32.00
33.00
34.00
35.00
36.00
37.00
-115.00 -114.00 -113.00 -112.00 -111.00 -110.00 -109.00
Longitude
La
titu
de
Cl. Div. 1
Cl. Div. 2
Cl. Div. 3
Cl. Div. 4
Cl. Div. 6
Cl. Div. 7
Approx. State
CornersPhoenix
Tucson
Flagstaff
Figure 3.6 Data Stations with 50-year Ground Snow Loads Equal to 12 psf or Greater

41
The majority (63.6%) of the sites that are represented by having 50-year ground
snow loads greater than 11 psf fall in Climate Division 2. Climate Divisions 1 (1.7%), 3
(10.2%), 4 (9.7%), 6 (0.6%) and 7 (11.4%) make up the remaining representation of sites
with ground snow loads equal to 12 psf or greater.
All of the ground snow loads determined in this study are presented in Table 3.4.
Some locations had records for more than one site (town, city, etc. is meant by location).
During statistical modeling each site was kept independent and modeled individually.
For the purposes of summarizing the data, only one site was listed for each location, with
a few exceptions. For locations with more than one site at elevations differing by more
than 300 feet (91 meters) and having a significantly different snow load calculated for
each, both sites are shown in the table. For locations where one or more site records are
not included in the table, three criteria were used to determine which site record and
ground snow load value would be shown. 1) If a site had more than 15 years of data
included in determining the ground snow load it was given precedence. 2) Those sites
that had the ground snow loads determined by SWE data were considered to have more
reliable records than site with only snow depth data (due to the error inherent in
converting snow depth to ground snow load discussed in Section 3.4). 3) If considering
the two preceding items could not determine which site was more accurate, the
Coefficient of Variation values were compared, the site that had more consistent annual
maxima (a lower COV) was given priority. These rules were not hard and fast rules, each
location with multiple sites was considered individually and if, after the application of the

42
3 listed criteria the preferred site could still not be obtained, the record with a more
conservative ground snow load was chosen.

43
Station Name CountyClimate
DivisionLongitude Latitude
Elev.
(ft (m))
Max
Snow
Depth
(in)
Max
SWE
(in of
H2O)
Year
of Max
Month
of Max
# of
Years
of
Data
50-yr
Ground
Snow
Load
(psf)
30-yr
Ground
Snow
Load
(psf)
Data
Source
* BEAVER DAM MOHAVE 1 -113.95 36.90 1875 (572) -- -- -- -- 1 0 0 NCDC
BEAVER DAM MOHAVE 1 -113.95 36.90 1875 (572) -- -- -- -- 43 0 0 NCDC
BULLHEAD CITY MOHAVE 1 -114.57 35.13 540 (165) -- -- -- -- 29 0 0 NCDC
* CHLORIDE MOHAVE 1 -114.20 35.42 4021 (1226) -- -- -- -- 1 0 0 NCDC
COLORADO CITY MOHAVE 1 -112.97 37.00 5009 (1527) 13 -- 1979 2 43 10 8 NCDC
* COLORADO CITY MOHAVE 1 -112.98 37.00 5012 (1528) 8 -- 1951 4 13 8 6 NCDC
* DAVIS DAM MOHAVE 1 -114.57 35.18 531 (162) -- -- -- -- 11 0 0 NCDC
DAVIS DAM # 2 MOHAVE 1 -114.57 35.20 659 (201) -- -- -- -- 20 0 0 NCDC
* DIAMOND BAR RANCH 1 -114.00 35.88 3601 (1098) -- -- -- -- 5 0 0 NCDC
* DIAMOND M RANCH MOHAVE 1 -113.37 35.30 5479 (1670) 15 -- 2001 1 7 19 15 NCDC
* HACKBERRY 1 -113.73 35.37 3582 (1092) -- -- -- -- 5 0 0 NCDC
* KATHERINE RANGER STN MOHAVE 1 -114.57 35.23 670 (204) -- -- -- -- 2 0 0 NCDC
KINGMAN AAF MOHAVE 1 -113.93 35.27 3385 (1032) 7 -- 1922 3 67 2 1 NCDC
* KINGMAN AIRPORT MOHAVE 1 -113.93 35.25 3419 (1042) -- -- -- -- 3 0 0 NCDC
KINGMAN NO 2 MOHAVE 1 -114.02 35.20 3538 (1079) -- -- -- -- 27 0 0 NCDC
LAKE HAVASU MOHAVE 1 -114.37 34.45 482 (147) -- -- -- -- 25 0 0 NCDC
LAKE HAVASU CITY MOHAVE 1 -114.37 34.50 468 (143) -- -- -- -- 15 0 0 NCDC
* LITTLEFIELD 1 NE MOHAVE 1 -113.90 36.90 1904 (581) -- -- -- -- 12 0 0 NCDC
* LITTLEFIELD 25 SSW MOHAVE 1 -114.03 36.53 4002 (1220) 12 -- 1949 1 5 9 7 NCDC
* LOOKOUT RANCH 1 -113.38 35.20 5002 (1525) -- -- -- -- 7 0 0 NCDC
* MEADVIEW 1SE MOHAVE 1 -114.08 36.02 3199 (975) -- -- -- -- 10 0 0 NCDC
MOUNT TRUMBULL MOHAVE 1 -113.35 36.42 5603 (1708) 40 -- 1945 12 57 8 6 NCDC
PEACH SPRINGS MOHAVE 1 -113.42 35.55 4969 (1515) 27 -- 1967 12 56 4 3 NCDC
* PIERCE FERRY 1 -114.00 36.12 1371 (418) -- -- -- -- 5 0 0 NCDC
PIERCE FERRY 17 SSW MOHAVE 1 -114.08 35.88 3857 (1176) 11 -- 1979 2 22 6 4 NCDC
PIPE SPRINGS NATL MON MOHAVE 1 -112.73 36.87 4919 (1500) 18 -- 1973 1 43 5 4 NCDC
* SIGNAL MOHAVE 1 -113.63 34.47 1522 (464) -- -- -- -- 1 0 0 NCDC
* SIGNAL 13 SW 1 -113.80 34.37 2512 (766) -- -- -- -- 9 0 0 NCDC
TEMPLE BAR MOHAVE 1 -114.33 36.03 1280 (390) -- -- -- -- 19 0 0 NCDC
* TOPOCK MOHAVE 1 -114.48 34.72 449 (137) -- -- -- -- 3 0 0 NCDC
* TOPOCK 2 SSE 1 -114.45 34.70 502 (153) -- -- -- -- 13 0 0 NCDC
TRUXTON CANYON MOHAVE 1 -113.67 35.38 3819 (1164) 12 -- 1932 12 54 4 3 NCDC
TUWEEP MOHAVE 1 -113.07 36.28 4774 (1455) 15 -- 1967 12 45 7 5 NCDC
* WHITE HILLS 5 WSW MOHAVE 1 -114.48 35.70 2430 (741) -- -- -- -- 4 0 0 NCDC
WIKIEUP MOHAVE 1 -113.62 34.70 2009 (613) -- -- -- -- 54 0 0 NCDC
WILLOW BEACH MOHAVE 1 -114.67 35.87 740 (226) -- -- -- -- 39 0 0 NCDC
YUCCA 1 NNE MOHAVE 1 -114.13 34.88 1950 (594) -- -- -- -- 53 0 0 NCDC
ALPINE APACHE 2 -109.15 33.85 8048 (2454) 60 -- 1967 12 97 38 31 NCDC
ARBABS FOREST APACHE 2 -109.20 35.70 7680 (2341) -- 6 98 2 21 41 36 S. Course
* ASH FORK 5 N COCONINO 2 -112.47 35.28 5325 (1623) 8 -- 1978 3 8 6 6 NCDC
ASH FORK 6 N COCONINO 2 -112.48 35.30 5304 (1617) 38 -- 1967 12 71 12 9 NCDC
Baldy Apache 2 -109.50 33.98 9125 (2782) -- 17.6 83 4 23 115 103 Snotel
BALDY #1 - SNOW COURSE AND AERIALAPACHE 2 -109.52 33.98 9125 (2782) -- 18.3 79 3 50 110 99 S. Course
BALDY #2 APACHE 2 -109.55 33.93 9750 (2973) -- 41.8 79 3 36 238 214 S. Course
BEAR PAW COCONINO 2 -111.65 35.35 10100 (3079) -- 51 93 E/ST 37 271 244 S. Course
BEAVER SPRING APACHE 2 -109.05 36.33 9220 (2811) -- 16.8 93 3 20 103 96 S. Course
* BELLEMONT NWFO COCONINO 2 -111.82 35.23 7150 (2180) 20 -- 2005 1 7 26 22 NCDC
BETATAKIN NAVAJO 2 -110.53 36.68 7284 (2221) 38 -- 1967 12 67 26 23 NCDC
* BIG LAKE 2 -109.42 33.87 9004 (2745) -- -- -- -- 2 0 0 NCDC
* BITA HOCHEE TRADING POST NAVAJO 2 -110.08 35.42 5904 (1800) -- -- -- -- 8 0 0 NCDC
* BLACK MOUNTAIN MISSION APACHE 2 -109.87 36.12 6353 (1937) 12 -- 1961 12 9 10 8 NCDC
BLUE RIDGE RANGER STN COCONINO 2 -111.18 34.62 6878 (2097) 38 -- 1997 1 39 39 31 NCDC
BRIGHT ANGEL RS COCONINO 2 -112.07 36.22 8398 (2560) 89 -- 1993 2 81 164 138 NCDC
* BUCK SPRING APACHE 2 -109.85 34.12 7400 (2256) -- 5.4 98 2 8 35 30 S. Course
* BUFFALO RANCH 2 -111.95 36.47 5662 (1726) 21 -- 1960 12 4 32 25 NCDC
BURRUS RANCH COCONINO 2 -111.53 35.27 6802 (2074) 70 -- 1949 2 25 67 54 NCDC
CAMERON 1 NNE COCONINO 2 -111.40 35.88 4163 (1269) 18 -- 1967 12 31 2 1 NCDC
* CAMP GERONIMO GILA 2 -111.37 34.40 5514 (1681) 15 -- 1978 2 2 28 22 NCDC
CANYON DE CHELLY APACHE 2 -109.53 36.15 5608 (1710) 8 -- 1974 1 36 2 2 NCDC
* CEDAR RIDGE TRADING POST COCONINO 2 -111.52 36.38 5923 (1806) -- -- -- -- 6 0 0 NCDC
CHALENDER COCONINO 2 -112.07 35.25 7100 (2165) -- 12 73 3 59 63 55 S. Course
CHEESE SPRINGS APACHE 2 -109.50 34.05 8700 (2652) -- 12.4 73 3 37 72 66 S. Course
CHEVELON RS COCONINO 2 -110.92 34.55 7004 (2135) 52 -- 1967 12 45 43 35 NCDC
CHINLE APACHE 2 -109.53 36.15 5544 (1690) 14 -- 1967 12 57 9 7 NCDC
CIBECUE NAVAJO 2 -110.48 34.03 4979 (1518) 18 -- 1937 1 52 14 11 NCDC
CLAY SPRINGS NAVAJO 2 -110.32 34.38 6318 (1926) -- -- -- -- 16 0 0 NCDC
COPPER MINE TRADING POST COCONINO 2 -111.42 36.63 6383 (1946) 23 -- 1960 12 38 13 10 NCDC
Coronado Trail Apache 2 -109.15 33.80 8400 (2561) -- 13.8 93 3 23 75 66 Snotel
CORONADO TRAIL APACHE 2 -109.15 33.80 8350 (2546) -- 12.5 49 2 68 65 57 S. Course

44
Station Name CountyClimate
DivisionLongitude Latitude
Elev.
(ft (m))
Max
Snow
Depth
(in)
Max
SWE
(in of
H2O)
Year
of Max
Month
of Max
# of
Years
of
Data
50-yr
Ground
Snow
Load
(psf)
30-yr
Ground
Snow
Load
(psf)
Data
Source
FORT APACHE APACHE 2 -109.52 34.00 9160 (2793) -- 17.6 93 3 55 107 96 S. Course
FORT DEFIANCE 2 -109.08 35.75 6904 (2105) 14 -- 1903 2 19 13 10 NCDC
FORT VALLEY COCONINO 2 -111.75 35.27 7345 (2239) 57 -- 1949 1 97 73 60 NCDC
FORT VALLEY COCONINO 2 -111.75 35.27 7350 (2241) -- 11.6 49 2 59 60 52 S. Course
FREDONIA COCONINO 2 -112.53 36.95 4681 (1427) 18 -- 1973 1 41 11 9 NCDC
Fry Coconino 2 -111.85 35.07 7200 (2195) -- 15 93 3 23 95 86 Snotel
GANADO APACHE 2 -109.57 35.72 6338 (1932) 24 -- 1967 12 77 12 10 NCDC
GRAND CANYON COCONINO 2 -111.97 35.97 7500 (2287) -- 10.6 73 3 59 52 45 S. Course
GRAND CANYON AIRWAYS COCONINO 2 -112.13 36.05 6973 (2126) 40 -- 1949 1 20 38 31 NCDC
GRAND CANYON HDQS 2 -112.13 36.05 6891 (2101) 38 -- 1949 1 54 38 32 NCDC
GRAND CANYON N P 2 COCONINO 2 -112.15 36.05 6783 (2068) 28 -- 1979 2 30 25 22 NCDC
GRAND CANYON NATL PARK COCONINO 2 -112.13 36.05 6953 (2120) 29 -- 1967 12 21 30 27 NCDC
* GRAY MOUNTAIN TRADING POST 2 -111.48 35.73 4914 (1498) 15 -- 1962 1 7 14 11 NCDC
GREER APACHE 2 -109.45 34.02 8273 (2522) 54 -- 1967 12 81 61 50 NCDC
* GREER LAKES APACHE 2 -109.45 34.03 8505 (2593) -- -- -- -- 1 0 0 NCDC
HAPPY JACK COCONINO 2 -111.40 34.75 7630 (2326) -- 20.1 73 3 55 90 79 S. Course
* Happy Jack Coconino 2 -111.42 34.75 7630 (2326) -- 11.6 05 3 6 78 69 Snotel
HAPPY JACK RS COCONINO 2 -111.42 34.75 7478 (2280) 58 -- 1997 1 37 76 63 NCDC
HAWLEY LAKE APACHE 2 -109.75 33.98 8178 (2493) 91 -- 1967 12 22 146 132 NCDC
HEBER COCONINO 2 -110.75 34.32 7640 (2329) -- 16.2 73 3 50 77 68 S. Course
Heber Coconino 2 -110.75 34.32 7640 (2329) -- 11.6 98 3 23 75 68 Snotel
* HEBER 2 -110.58 34.38 6504 (1983) 30 -- 1922 2 14 45 36 NCDC
HEBER (BLACK MESA) RANGER STA NAVAJO 2 -110.55 34.40 6588 (2009) 48 -- 1967 12 56 35 29 NCDC
HOLBROOK NAVAJO 2 -110.15 34.92 5084 (1550) 19 -- 1967 12 111 5 4 NCDC
* HOUCK 2 W 2 -109.23 35.28 5812 (1772) -- -- -- -- 1 0 0 NCDC
* HOUSE ROCK 2 -112.05 36.73 5382 (1641) 15 -- 1948 12 7 11 8 NCDC
* INDIAN WELLS TRADING POST NAVAJO 2 -110.07 35.42 5904 (1800) -- -- -- -- 1 0 0 NCDC
INNER CANYON USGS COCONINO 2 -112.10 36.10 2571 (784) -- -- -- -- 21 0 0 NCDC
JACOB LAKE COCONINO 2 -112.22 36.73 7823 (2385) 60 -- 1973 4 32 77 64 NCDC
JEDDITO 2 -110.13 35.77 6704 (2044) 16 -- 1937 1 25 14 11 NCDC
JUNIPINE COCONINO 2 -111.75 34.97 5134 (1565) 44 -- 1937 1 47 39 31 NCDC
* KAIBITO 2 -111.08 36.60 6002 (1830) 14 -- 1960 12 11 16 13 NCDC
KAYENTA NAVAJO 2 -110.28 36.73 5704 (1739) 24 -- 1915 12 64 11 9 NCDC
* KAYENTA 21 SSW NAVAJO 2 -110.40 36.45 6524 (1989) 12 -- 1974 1 4 18 15 NCDC
KEAMS CANYON NAVAJO 2 -110.20 35.82 6203 (1891) 12 -- 1906 11 69 10 8 NCDC
* KLAGETOH 2 -109.53 35.50 6402 (1952) 7 -- 1952 11 9 5 4 NCDC
KLAGETOH 12 WNW APACHE 2 -109.70 35.55 6498 (1981) 36 -- 1967 12 35 16 12 NCDC
LAKE MARY COCONINO 2 -111.45 35.02 6930 (2113) -- 7.8 79 2 31 52 46 S. Course
LAKESIDE RANGER STN NAVAJO 2 -109.98 34.17 6704 (2044) 52 -- 1967 12 44 52 43 NCDC
LEES FERRY COCONINO 2 -111.60 36.87 3209 (978) 8 -- 1967 12 84 1 0 NCDC
LEUPP COCONINO 2 -110.97 35.28 4704 (1434) 55 -- 1918 12 50 12 9 NCDC
LUKACHUKAI APACHE 2 -109.23 36.42 6518 (1987) 20 -- 1961 12 59 11 9 NCDC
* LUPTON 2 -109.05 35.35 6212 (1894) -- -- -- -- 3 0 0 NCDC
MANY FARMS SCHOOL APACHE 2 -109.62 36.37 5314 (1620) 13 -- 1961 12 25 3 3 NCDC
MAVERICK APACHE 2 -109.55 33.75 7803 (2379) 42 -- 1961 12 20 61 53 NCDC
Maverick Fork Apache 2 -109.47 33.92 9200 (2805) -- 23.6 93 3 23 139 125 Snotel
MAVERICK FORK SNOW COURSE & AERIALAPACHE 2 -109.45 33.92 9150 (2790) -- 23.5 93 E/ST 50 144 128 S. Course
MC NARY 2 N NAVAJO 2 -109.87 34.12 7338 (2237) 42 -- 1967 12 73 45 40 NCDC
MCNARY (DISC.) NAVAJO 2 -109.92 34.08 7200 (2195) -- 11.6 73 3 51 61 54 S. Course
* METEOR CRATER COCONINO 2 -111.02 35.03 5662 (1726) -- -- -- -- 6 0 0 NCDC
MILK RANCH (DISC.) NAVAJO 2 -109.95 34.07 7000 (2134) -- 8 73 3 49 43 38 S. Course
MONUMENT VALLEY NAVAJO 2 -110.12 36.98 5563 (1696) 8 -- 1989 2 26 2 2 NCDC
MORMON LAKE RNGR STN COCONINO 2 -111.45 34.92 7183 (2190) 20 -- 1963 1 30 11 9 NCDC
Mormon Mountain Coconino 2 -111.52 34.93 7500 (2287) -- 17 93 3 23 105 93 Snotel
MORMON MOUNTAIN - SNOW COURSE & AERIALCOCONINO 2 -111.52 34.93 7500 (2287) -- 24.1 73 3 50 110 97 S. Course
MORMON MOUNTAIN SUMMIT #2 COCONINO 2 -111.52 34.97 8470 (2582) -- 33.6 93 2 31 202 181 S. Course
MUND'S PARK COCONINO 2 -111.63 34.93 6468 (1972) 22 -- 1990 2 20 29 26 NCDC
NAVAJO APACHE 2 -109.53 35.13 5583 (1702) -- -- -- -- 16 0 0 NCDC
NEWMAN PARK COCONINO 2 -111.68 35.00 6750 (2058) -- 14.4 73 3 43 63 55 S. Course
NUTRIOSO APACHE 2 -109.15 33.90 8500 (2591) -- 9.3 49 2 68 43 38 S. Course
OAK CREEK CANYON COCONINO 2 -111.77 34.97 5074 (1547) 19 -- 1999 4 24 19 15 NCDC
* ORAIBI NAVAJO 2 -110.62 35.87 5934 (1809) -- -- -- -- 13 0 0 NCDC
PAGE COCONINO 2 -111.45 36.92 4269 (1302) 9 -- 1967 12 47 5 4 NCDC
PAINTED DESERT N P APACHE 2 -109.78 35.07 5758 (1756) 11 -- 1976 11 33 8 6 NCDC
PETRIFIED FOREST N P NAVAJO 2 -109.88 34.80 5444 (1660) 14 -- 1967 12 75 7 6 NCDC
PHANTOM RANCH COCONINO 2 -112.10 36.13 2529 (771) 8 -- 1971 1 40 0 0 NCDC
PINEDALE NAVAJO 2 -110.25 34.30 6504 (1983) 42 -- 1937 1 57 46 37 NCDC
PINETOP NAVAJO 2 -109.93 34.12 6958 (2121) 31 -- 1987 2 18 27 24 NCDC
PINETOP 2E NAVAJO 2 -109.92 34.12 7198 (2195) 54 -- 1967 12 63 46 39 NCDC

45
Station Name CountyClimate
DivisionLongitude Latitude
Elev.
(ft (m))
Max
Snow
Depth
(in)
Max
SWE
(in of
H2O)
Year
of Max
Month
of Max
# of
Years
of
Data
50-yr
Ground
Snow
Load
(psf)
30-yr
Ground
Snow
Load
(psf)
Data
Source
SANDERS APACHE 2 -109.32 35.22 5852 (1784) 14 -- 1967 12 49 8 6 NCDC
SANDERS 11 ESE APACHE 2 -109.17 35.17 6248 (1905) 20 -- 1967 12 26 14 11 NCDC
* SEBA DALKAI SCHOOL NAVAJO 2 -110.43 35.50 5904 (1800) -- -- -- -- 10 0 0 NCDC
SEDONA COCONINO 2 -111.77 34.90 4219 (1286) 16 -- 1949 1 62 3 3 NCDC
* SHONGOPOVI 2 -110.53 35.80 6123 (1867) -- -- -- -- 2 0 0 NCDC
SHOW LOW NAVAJO 2 -110.00 34.27 6412 (1955) 20 -- 1905 4 39 22 18 NCDC
SHOW LOW CITY NAVAJO 2 -110.03 34.25 6438 (1963) 41 -- 1967 12 40 21 17 NCDC
SILVER CREEK RANCH NAVAJO 2 -109.98 34.35 6153 (1876) 14 -- 1952 11 20 7 5 NCDC
SNOW BOWL #1 ALT. COCONINO 2 -111.70 35.33 9920 (3024) -- 40.2 93 3 22 204 182 S. Course
SNOW BOWL #2 COCONINO 2 -111.70 35.33 11200 (3415) -- 51.6 93 3 41 272 246 S. Course
SNOWFLAKE NAVAJO 2 -110.08 34.50 5641 (1720) 30 -- 1967 12 106 11 8 NCDC
SNOWFLAKE 15 W NAVAJO 2 -110.33 34.50 6078 (1853) 24 -- 1967 12 34 17 13 NCDC
* Snowslide Canyon Coconino 2 -111.65 34.62 9730 (2966) -- 41 05 4 8 246 222 Snotel
SNOWSLIDE CANYON COCONINO 2 -111.65 35.35 9750 (2973) -- 47.5 93 E/ST 37 218 194 S. Course
SPRINGERVILLE APACHE 2 -109.30 34.13 7035 (2145) 14 -- 1961 11 95 8 6 NCDC
ST MICHAELS 6 WNW APACHE 2 -109.20 35.67 7642 (2330) 14 -- 1913 2 22 13 11 NCDC
SUNRISE MOUNTAIN APACHE 2 -109.57 33.97 9368 (2856) 85 -- 1973 4 16 173 135 NCDC
SUNSET CRATER NATL MONUMENT COCONINO 2 -111.55 35.37 6978 (2128) 31 -- 1973 3 37 31 27 NCDC
SUPAI COCONINO 2 -112.70 36.20 3203 (977) -- -- -- -- 44 0 0 NCDC
TEEC NOS POS APACHE 2 -109.08 36.92 5289 (1612) 10 -- 1974 1 44 4 3 NCDC
* TEES TO 2 -110.42 35.50 5803 (1769) 7 -- 1959 12 8 1 1 NCDC
* TIMBER RANGER STN COCONINO 2 -111.18 34.62 6812 (2077) -- -- -- -- 3 0 0 NCDC
* TONALEA 2 -110.95 36.33 5514 (1681) -- -- -- -- 2 0 0 NCDC
TSAILE CANYON #1 APACHE 2 -109.10 36.40 8160 (2488) -- 11.2 95 3 21 73 67 S. Course
TSAILE CANYON #3 APACHE 2 -109.10 36.45 8920 (2720) -- 15.4 93 2 20 93 87 S. Course
TUBA CITY COCONINO 2 -111.25 36.13 4987 (1520) 20 -- 1967 12 98 5 4 NCDC
* VALLE COCONINO 2 -112.20 35.65 5891 (1796) -- -- -- -- 2 0 0 NCDC
* VALLE AIRPORT 2 -112.15 35.67 6002 (1830) 10 -- 1949 1 12 11 9 NCDC
WAHWEAP COCONINO 2 -111.48 37.00 3729 (1137) 8 -- 1967 12 45 1 1 NCDC
WALLACE RANGER STN 2 -110.92 34.53 7012 (2138) 30 -- 1949 1 41 33 27 NCDC
WALNUT CANYON NATL MONUMENT COCONINO 2 -111.50 35.17 6683 (2038) 54 -- 1967 12 57 36 30 NCDC
WHITE HORSE LAKE JCT COCONINO 2 -112.15 35.13 7180 (2189) -- 16.6 73 3 33 79 69 S. Course
Whitehorse Lake Coconino 2 -112.15 35.15 7180 (2189) -- 13.5 93 3 23 83 74 Snotel
WHITERIVER 1 SW NAVAJO 2 -109.98 33.82 5119 (1561) 21 -- 1960 1 101 12 9 NCDC
WILLIAMS COCONINO 2 -112.18 35.23 6748 (2057) 52 -- 1949 1 106 44 36 NCDC
* WILLIAMS 24 NNW COCONINO 2 -112.40 35.53 5753 (1754) -- -- -- -- 4 0 0 NCDC
WILLIAMS CREEK FISH HATCHERY APACHE 2 -109.82 34.05 6963 (2123) 38 -- 1967 12 15 46 38 NCDC
WILLIAMS SKI RUN COCONINO 2 -112.20 35.20 7720 (2354) -- 24.6 73 4 39 136 122 S. Course
WINDOW ROCK 4 SW APACHE 2 -109.12 35.62 6918 (2109) 18 -- 1967 12 62 13 10 NCDC
* WINSLOW NAVAJO 2 -110.70 35.02 4868 (1484) -- -- -- -- 2 0 0 NCDC
WINSLOW MUNICIPAL AP NAVAJO 2 -110.72 35.03 4885 (1489) 29 -- 1967 12 89 10 8 NCDC
WUPATKI NM COCONINO 2 -111.37 35.52 4907 (1496) 32 -- 1967 12 63 7 5 NCDC
* ANVIL ROCK 3 -113.13 35.07 5261 (1604) -- -- -- -- 2 0 0 NCDC
* ASH FORK 12 WNW YAVAPAI 3 -112.67 35.27 5739 (1750) 9 -- 1988 1 8 8 7 NCDC
ASH FORK 3 YAVAPAI 3 -112.48 35.20 5074 (1547) 12 -- 1990 1 17 8 7 NCDC
* ASH FORK CAMPGROUND YAVAPAI 3 -112.48 35.22 5150 (1570) -- -- -- -- 1 0 0 NCDC
* BAGDAD 3 -113.20 34.60 3201 (976) 17 -- 1927 2 9 13 10 NCDC
BAGDAD YAVAPAI 3 -113.17 34.60 3954 (1206) 10 -- 1932 12 73 1 1 NCDC
* BAGDAD 2 YAVAPAI 3 -113.13 34.60 4116 (1255) -- -- -- -- 9 0 0 NCDC
BAGDAD 8 NE YAVAPAI 3 -113.08 34.65 4241 (1293) 15 -- 1967 12 26 6 5 NCDC
BEAVER CREEK YAVAPAI 3 -111.78 34.65 3524 (1074) 6 -- 1965 4 50 1 1 NCDC
BRIGHT ANGEL COCONINO 3 -112.07 36.22 8400 (2561) -- 27.9 93 3 59 154 135 S. Course
BUMBLE BEE YAVAPAI 3 -112.15 34.20 2502 (763) 11 -- 1967 12 28 1 1 NCDC
CAMP WOOD YAVAPAI 3 -112.87 34.80 5713 (1742) 36 -- 1967 12 31 18 14 NCDC
CASTLE HOT SPRINGS YAVAPAI 3 -112.37 33.98 1990 (607) -- -- -- -- 48 0 0 NCDC
* CASTLE HOT SPRINGS 4 N 3 -112.35 34.05 2801 (854) -- -- -- -- 10 0 0 NCDC
CEDAR GLADE 3 -112.38 34.97 4651 (1418) 28 -- 1930 1 40 18 14 NCDC
CHILDS YAVAPAI 3 -111.70 34.35 2649 (808) 10 -- 1937 1 91 0 0 NCDC
CHINO VALLEY YAVAPAI 3 -112.45 34.75 4749 (1448) 22 -- 1967 12 65 6 4 NCDC
* CONGRESS YAVAPAI 3 -112.87 34.17 3021 (921) -- -- -- -- 11 0 0 NCDC
COPPER BASIN DIVIDE YAVAPAI 3 -112.55 34.50 6720 (2049) -- 11.3 68 12 35 57 49 S. Course
CORDES YAVAPAI 3 -112.17 34.30 3770 (1149) 15 -- 1967 12 74 2 1 NCDC
CROWN KING YAVAPAI 3 -112.35 34.22 5918 (1804) 54 -- 1967 12 82 55 43 NCDC
* DRAKE RANGER STN 3 -112.38 34.97 4651 (1418) 12 -- 1961 12 9 13 10 NCDC
* DUGAS 2 SE YAVAPAI 3 -111.95 34.35 4041 (1232) -- -- -- -- 13 0 0 NCDC
FOSSIL SPRINGS YAVAPAI 3 -111.57 34.42 4271 (1302) -- -- -- -- 20 0 0 NCDC
GADDES CANYON YAVAPAI 3 -112.13 34.70 7600 (2317) -- 20.8 73 3 36 107 93 S. Course
GROOM CREEK YAVAPAI 3 -112.45 34.48 6104 (1861) 36 -- 1949 1 32 35 29 NCDC
* HILLSIDE 3 -112.92 34.42 3851 (1174) 10 -- 1949 1 8 3 2 NCDC

46
Station Name CountyClimate
DivisionLongitude Latitude
Elev.
(ft (m))
Max
Snow
Depth
(in)
Max
SWE
(in of
H2O)
Year
of Max
Month
of Max
# of
Years
of
Data
50-yr
Ground
Snow
Load
(psf)
30-yr
Ground
Snow
Load
(psf)
Data
Source
SELIGMAN YAVAPAI 3 -112.88 35.33 5249 (1600) 16 -- 1906 1 101 9 7 NCDC
SELIGMAN 13 SSW YAVAPAI 3 -112.92 35.13 5242 (1598) -- -- -- -- 20 0 0 NCDC
* SKULL VALLEY YAVAPAI 3 -112.68 34.50 4251 (1296) -- -- -- -- 9 0 0 NCDC
STANTON YAVAPAI 3 -112.73 34.17 3480 (1061) 10 -- 1967 12 25 2 2 NCDC
SYCAMORE RANGER STN YAVAPAI 3 -111.97 34.35 4002 (1220) 8 -- 1937 1 41 2 2 NCDC
TONTO SPRINGS RANGER STN 4 W YAVAPAI 3 -112.75 34.62 4802 (1464) 24 -- 1915 12 42 13 10 NCDC
TUZIGOOT YAVAPAI 3 -112.03 34.77 3469 (1058) -- -- -- -- 29 0 0 NCDC
TUZIGOOT NATL MONUMENT YAVAPAI 3 -112.03 34.75 3382 (1031) 26 -- 1967 12 31 4 3 NCDC
WALNUT CREEK YAVAPAI 3 -112.82 34.93 5089 (1551) 55 -- 1948 2 91 14 11 NCDC
WALNUT GROVE YAVAPAI 3 -112.57 34.32 3763 (1147) 14 -- 1913 2 112 1 1 NCDC
YAEGER CANYON YAVAPAI 3 -112.17 34.68 6002 (1830) 30 -- 1933 1 32 31 25 NCDC
YAVA 6 ESE YAVAPAI 3 -112.80 34.45 3782 (1153) -- -- -- -- 28 0 0 NCDC
BAKER BUTTE GILA 4 -111.40 34.45 7300 (2226) -- 23.9 73 3 34 119 105 S. Course
Baker Butte Gila 4 -111.40 34.45 7300 (2226) -- 14.7 83 3 23 90 81 Snotel
BAKER BUTTE NO. 2 GILA 4 -11.38 34.45 7700 (2348) -- 30.8 73 3 34 197 175 S. Course
BAR T BAR RANCH GILA 4 -111.37 34.03 3103 (946) -- -- -- -- 25 0 0 NCDC
GISELA GILA 4 -111.28 34.12 2899 (884) 19 -- 1967 12 94 1 1 NCDC
GLOBE GILA 4 -110.77 33.38 3649 (1113) 12 -- 1985 2 25 2 1 NCDC
* GLOBE #2 GILA 4 -110.77 33.40 3749 (1143) -- -- -- -- 12 0 0 NCDC
GLOBE RANGER STN GILA 4 -110.78 33.38 3552 (1083) 11 -- 1967 12 76 1 1 NCDC
* GRAPEVINE 4 -111.05 33.63 2221 (677) -- -- -- -- 4 0 0 NCDC
* HILLTOP 4 -110.40 33.62 5704 (1739) 12 -- 1945 3 6 15 13 NCDC
INTAKE 4 -110.93 33.62 2221 (677) -- -- -- -- 47 0 0 NCDC
MIAMI GILA 4 -110.87 33.40 3559 (1085) -- -- -- -- 92 0 0 NCDC
* MILLERS RIM TRAIL RANCH 4 -111.23 34.40 5631 (1717) -- -- -- -- 1 0 0 NCDC
NATURAL BRIDGE GILA 4 -111.45 34.32 4612 (1406) 36 -- 1967 12 82 25 19 NCDC
* O W RANCH 4 -110.80 34.28 7203 (2196) -- -- -- -- 1 0 0 NCDC
* PARKER CREEK MNTC YRD GILA 4 -110.95 33.80 5504 (1678) -- -- -- -- 1 0 0 NCDC
PAYSON GILA 4 -111.33 34.23 4912 (1498) 48 -- 1967 12 58 28 21 NCDC
PAYSON 12 NNE GILA 4 -111.27 34.40 5504 (1678) 42 -- 1967 12 25 35 30 NCDC
PAYSON RANGER STN GILA 4 -111.33 34.23 4851 (1479) 24 -- 1937 1 72 14 11 NCDC
* PAYSON RANGER STN 2 GILA 4 -111.30 34.25 5002 (1525) -- -- -- -- 3 0 0 NCDC
* PINE GILA 4 -111.47 34.38 5452 (1662) 14 -- 1974 1 2 23 20 NCDC
PLEASANT VALLEY R S GILA 4 -110.95 34.10 5049 (1539) 27 -- 1967 12 42 5 4 NCDC
PROMONTORY BUTTE GILA 4 -111.02 34.37 7930 (2418) -- 35.4 80 4 17 216 194 S. Course
PUNKIN CENTER GILA 4 -111.30 33.85 2325 (709) -- -- -- -- 33 0 0 NCDC
RENO R S GILA 4 -111.32 33.87 2420 (738) 9 -- 1967 12 59 0 0 NCDC
* RIM TRAIL RANCH GILA 4 -111.27 34.40 5631 (1717) -- -- -- -- 2 0 0 NCDC
ROOSEVELT 1 WNW GILA 4 -111.15 33.67 2204 (672) -- -- -- -- 101 0 0 NCDC
SALT RIVER GILA 4 -110.50 33.80 3611 (1101) 12 -- 1942 1 19 2 2 NCDC
SAN CARLOS GILA 4 -110.45 33.35 2640 (805) -- -- -- -- 33 0 0 NCDC
* SAN CARLOS AIRPORT GILA 4 -110.47 33.38 2889 (881) -- -- -- -- 4 0 0 NCDC
SAN CARLOS RESERVOIR GILA 4 -110.53 33.18 2532 (772) -- -- -- -- 62 0 0 NCDC
* SENECA 3 NW 4 -110.53 33.78 4924 (1501) -- -- -- -- 2 0 0 NCDC
SIERRA ANCHA GILA 4 -110.97 33.80 5099 (1555) 30 -- 1967 12 50 20 16 NCDC
TONTO CREEK FISH HAT 2 GILA 4 -111.10 34.38 6388 (1948) 27 -- 1997 1 31 15 12 NCDC
TONTO CREEK FISH HATCHERY GILA 4 -111.10 34.37 6282 (1915) 58 -- 1967 12 28 39 31 NCDC
WORKMAN CREEK GILA 4 -110.92 33.82 6900 (2104) -- 20.1 73 3 42 102 90 S. Course
Workman Creek Gila 4 -110.92 33.82 6900 (2104) -- 16.1 83 3 23 94 85 Snotel
* WORKMAN CREEK 1 GILA 4 -110.92 33.82 6973 (2126) -- -- -- -- 1 0 0 NCDC
* WORKMAN CREEK 2 GILA 4 -110.92 33.82 6973 (2126) 25 -- 1942 1 2 55 43 NCDC
YOUNG GILA 4 -110.93 34.10 5051 (1540) 31 -- 1953 3 60 15 12 NCDC
* ALAMO 8 SW 5 -113.70 34.20 951 (290) -- -- -- -- 4 0 0 NCDC
ALAMO DAM LA PAZ 5 -113.58 34.23 1290 (393) -- -- -- -- 31 0 0 NCDC
* ALAMO DAM 6 ESE YUMA 5 -113.47 34.25 1480 (451) -- -- -- -- 13 0 0 NCDC
* ALAMO RANGER STN 5 -110.85 33.50 3040 (927) -- -- -- -- 4 0 0 NCDC
BOUSE LA PAZ 5 -114.02 33.95 925 (282) -- -- -- -- 55 0 0 NCDC
DATELAND YUMA 5 -113.53 32.80 449 (137) -- -- -- -- 17 0 0 NCDC
DATELAND WHITEWING RANCH YUMA 5 -113.50 32.97 520 (159) -- -- -- -- 34 0 0 NCDC
EHRENBERG YUMA 5 -114.53 33.60 322 (98) -- -- -- -- 30 0 0 NCDC
EHRENBERG 2 E LA PAZ 5 -114.47 33.62 465 (142) -- -- -- -- 29 0 0 NCDC
* IMPERIAL DAM 5 -114.47 32.88 171 (52) -- -- -- -- 2 0 0 NCDC
KOFA MINE YUMA 5 -113.97 33.27 1774 (541) -- -- -- -- 54 0 0 NCDC
MOHAWK 5 -113.77 32.73 541 (165) -- -- -- -- 52 0 0 NCDC
PARKER LA PAZ 5 -114.28 34.15 420 (128) -- -- -- -- 113 0 0 NCDC
QUARTZSITE LA PAZ 5 -114.23 33.67 875 (267) -- -- -- -- 37 0 0 NCDC
SALOME 1 ESE YUMA 5 -113.62 33.78 1902 (580) -- -- -- -- 17 0 0 NCDC
* SALOME 17 SE LA PAZ 5 -113.48 33.68 1599 (487) -- -- -- -- 12 0 0 NCDC
SALOME 6 SE 5 -113.53 33.73 1703 (519) -- -- -- -- 50 0 0 NCDC

47
Station Name CountyClimate
DivisionLongitude Latitude
Elev.
(ft (m))
Max
Snow
Depth
(in)
Max
SWE
(in of
H2O)
Year
of Max
Month
of Max
# of
Years
of
Data
50-yr
Ground
Snow
Load
(psf)
30-yr
Ground
Snow
Load
(psf)
Data
Source
AGUILA MARICOPA 6 -113.18 33.95 2164 (660) -- -- -- -- 78 0 0 NCDC
ALHAMBRA MARICOPA 6 -112.12 33.52 1142 (348) -- -- -- -- 29 0 0 NCDC
APACHE JUNCTION PINAL 6 -111.55 33.42 1722 (525) -- -- -- -- 15 0 0 NCDC
* APACHE JUNCTION 4 NNW PINAL 6 -111.58 33.47 1890 (576) -- -- -- -- 5 0 0 NCDC
APACHE JUNCTION 5 NE PINAL 6 -111.48 33.47 2069 (631) -- -- -- -- 19 0 0 NCDC
* ARIZONA CITY PINAL 6 -111.67 32.75 1505 (459) -- -- -- -- 4 0 0 NCDC
* ARIZONA FALLS 1 WNW MARICOPA 6 -111.98 33.50 1250 (381) -- -- -- -- 6 0 0 NCDC
ARIZONA FALLS 1 WNW MARICOPA 6 -111.97 33.48 1250 (381) -- -- -- -- 16 0 0 NCDC
ASHURST HAYDEN DAM PINAL 6 -111.28 33.08 1549 (472) -- -- -- -- 50 0 0 NCDC
BARTLETT DAM MARICOPA 6 -111.65 33.82 1650 (503) -- -- -- -- 67 0 0 NCDC
BEARDSLEY MARICOPA 6 -112.38 33.67 1270 (387) -- -- -- -- 29 0 0 NCDC
BUCKEYE MARICOPA 6 -112.58 33.38 890 (271) -- -- -- -- 110 0 0 NCDC
CAREFREE MARICOPA 6 -111.90 33.82 2529 (771) -- -- -- -- 38 0 0 NCDC
CASA GRANDE PINAL 6 -111.72 32.88 1403 (428) -- -- -- -- 105 0 0 NCDC
CASA GRANDE NATL MONUMENT PINAL 6 -111.53 33.00 1419 (433) -- -- -- -- 85 0 0 NCDC
* CAVE CREEK 6 -111.95 33.83 2122 (647) -- -- -- -- 13 0 0 NCDC
* CAVE CREEK 3 ESE MARICOPA 6 -111.90 33.82 2529 (771) -- -- -- -- 2 0 0 NCDC
CAVE CREEK DAM MARICOPA 6 -112.05 33.72 1670 (509) -- -- -- -- 21 0 0 NCDC
CHANDLER MARICOPA 6 -111.83 33.30 1220 (372) -- -- -- -- 33 0 0 NCDC
CHANDLER HEIGHTS MARICOPA 6 -111.68 33.20 1425 (434) -- -- -- -- 58 0 0 NCDC
DEER VALLEY MARICOPA 6 -112.08 33.58 1257 (383) -- -- -- -- 36 0 0 NCDC
* EAST MESA MARICOPA 6 -111.65 33.42 1518 (463) -- -- -- -- 4 0 0 NCDC
* EL MIRAGE 6 -112.32 33.63 1142 (348) -- -- -- -- 1 0 0 NCDC
ELOY 4 NE PINAL 6 -111.52 32.78 1545 (471) -- -- -- -- 55 0 0 NCDC
FALCON FIELD MARICOPA 6 -111.75 33.43 1322 (403) -- -- -- -- 29 0 0 NCDC
FLORENCE PINAL 6 -111.38 33.03 1400 (427) -- -- -- -- 100 0 0 NCDC
FOUNTAIN HILLS MARICOPA 6 -111.72 33.60 1580 (482) -- -- -- -- 27 0 0 NCDC
GILA BEND MARICOPA 6 -112.72 32.95 735 (224) -- -- -- -- 111 0 0 NCDC
GILA BEND AIRPORT 6 -112.72 32.88 853 (260) -- -- -- -- 23 0 0 NCDC
GOULDS RANCH MARICOPA 6 -112.07 33.38 1201 (366) -- -- -- -- 46 0 0 NCDC
GRANITE REEF DAM MARICOPA 6 -111.70 33.52 1322 (403) -- -- -- -- 173 0 0 NCDC
GRIGGS 3 W MARICOPA 6 -112.48 33.50 1160 (354) -- -- -- -- 41 0 0 NCDC
HARQUAHALA PLAINS 6 -113.17 33.53 1220 (372) -- -- -- -- 28 0 0 NCDC
HORSESHOE DAM MARICOPA 6 -111.72 33.98 2019 (616) -- -- -- -- 58 0 0 NCDC
KEARNY PINAL 6 -110.90 33.05 1830 (558) -- -- -- -- 22 0 0 NCDC
KELVIN PINAL 6 -110.97 33.10 1850 (564) -- -- -- -- 37 0 0 NCDC
* LAKE PLEASANT MARICOPA 6 -112.27 33.85 1601 (488) -- -- -- -- 10 0 0 NCDC
LAKE PLEASANT MARICOPA 6 -112.27 33.83 1536 (468) -- -- -- -- 19 0 0 NCDC
LAVEEN 3 SSE MARICOPA 6 -112.15 33.33 1135 (346) -- -- -- -- 58 0 0 NCDC
LITCHFIELD PARK MARICOPA 6 -112.37 33.50 1030 (314) -- -- -- -- 86 0 0 NCDC
MARICOPA 4 N PINAL 6 -112.03 33.12 1160 (354) -- -- -- -- 46 0 0 NCDC
MARICOPA 9 SSW 6 -112.10 32.92 1401 (427) -- -- -- -- 58 0 0 NCDC
MARINETTE MARICOPA 6 -112.30 33.63 1152 (351) -- -- -- -- 48 0 0 NCDC
MESA MARICOPA 6 -111.82 33.42 1235 (376) -- -- -- -- 108 0 0 NCDC
* MONTEZUMA MARICOPA 6 -113.38 33.10 741 (226) -- -- -- -- 5 0 0 NCDC
MORMON FLAT MARICOPA 6 -111.45 33.55 1705 (520) -- -- -- -- 83 0 0 NCDC
MUMMY MOUNTAIN MARICOPA 6 -111.97 33.55 1421 (433) -- -- -- -- 16 0 0 NCDC
ORACLE 6 -110.78 32.60 4602 (1403) 16 -- 1937 1 54 7 6 NCDC
ORACLE 2 SE PINAL 6 -110.73 32.60 4509 (1375) 12 -- 1967 12 56 2 2 NCDC
* PAINTED ROCK DAM MARICOPA 6 -113.03 33.08 568 (173) -- -- -- -- 6 0 0 NCDC
* PARADISE VALLEY NO 2 MARICOPA 6 -111.97 33.57 1381 (421) -- -- -- -- 4 0 0 NCDC
* PARADISE VALLEY NO 2 MARICOPA 6 -111.95 33.55 1421 (433) -- -- -- -- 5 0 0 NCDC
PHOENIX CITY MARICOPA 6 -112.08 33.45 1098 (335) -- -- -- -- 48 0 0 NCDC
PHOENIX INDIAN SCHOOL MARICOPA 6 -112.07 33.50 1122 (342) -- -- -- -- 30 0 0 NCDC
PHOENIX SKY HARBOR INTL AP MARICOPA 6 -112.00 33.43 1107 (337) -- -- -- -- 59 0 0 NCDC
* PHOENIX SOUTH MOUNTAIN MARICOPA 6 -112.05 33.33 2645 (807) -- -- -- -- 9 0 0 NCDC
PICACHO 8 SE PINAL 6 -111.40 32.65 1830 (558) -- -- -- -- 19 0 0 NCDC
PICACHO RESERVOIR PINAL 6 -111.47 32.87 1512 (461) -- -- -- -- 28 0 0 NCDC
PINAL RANCH PINAL 6 -110.98 33.35 4523 (1379) 25 -- 1967 12 78 16 12 NCDC
* PINNACLE PEAK MARICOPA 6 -111.87 33.73 2564 (782) -- -- -- -- 4 0 0 NCDC
RED ROCK 6 SSW PINAL 6 -111.33 32.48 1879 (573) -- -- -- -- 53 0 0 NCDC
SACATON PINAL 6 -111.75 33.08 1285 (392) -- -- -- -- 96 0 0 NCDC
SAN MANUEL PINAL 6 -110.63 32.60 3459 (1055) 9 -- 1958 11 52 1 1 NCDC
SCOTTSDALE MARICOPA 6 -111.88 33.47 1201 (366) -- -- -- -- 18 0 0 NCDC
SENTINEL 6 -113.22 32.87 689 (210) -- -- -- -- 31 0 0 NCDC
* SLATE MOUNTAIN PINAL 6 -111.88 32.52 1932 (589) -- -- -- -- 4 0 0 NCDC
SOUTH PHOENIX MARICOPA 6 -112.07 33.38 1155 (352) -- -- -- -- 45 0 0 NCDC
* STANFIELD 6 -111.97 32.88 1312 (400) -- -- -- -- 2 0 0 NCDC
STEWART MOUNTAIN MARICOPA 6 -111.53 33.55 1422 (433) -- -- -- -- 58 0 0 NCDC

48
Station Name CountyClimate
DivisionLongitude Latitude
Elev.
(ft (m))
Max
Snow
Depth
(in)
Max
SWE
(in of
H2O)
Year
of Max
Month
of Max
# of
Years
of
Data
50-yr
Ground
Snow
Load
(psf)
30-yr
Ground
Snow
Load
(psf)
Data
Source
TONOPAH 5N MARICOPA 6 -112.88 33.50 1150 (351) -- -- -- -- 31 0 0 NCDC
* TONTO HILLS MARICOPA 6 -111.83 33.88 3680 (1122) -- -- -- -- 2 0 0 NCDC
* VALLEY CITRUS FARM MARICOPA 6 -111.97 33.38 1181 (360) -- -- -- -- 5 0 0 NCDC
* WADDELL 3 SSE 6 -112.40 33.57 1099 (335) -- -- -- -- 2 0 0 NCDC
WILLOW SPRINGS RANCH PINAL 6 -110.87 32.72 3690 (1125) -- -- -- -- 30 0 0 NCDC
WINKELMAN 6 S PINAL 6 -110.72 32.92 2080 (634) -- -- -- -- 38 0 0 NCDC
* WINKLEMAN 12 SE PINAL 6 -110.60 32.87 2589 (789) -- -- -- -- 11 0 0 NCDC
WITTMANN 4SW MARICOPA 6 -112.60 33.75 1670 (509) -- -- -- -- 47 0 0 NCDC
YOUNGTOWN MARICOPA 6 -112.30 33.60 1135 (346) -- -- -- -- 42 0 0 NCDC
AJO PIMA 7 -112.87 32.37 1799 (549) -- -- -- -- 92 0 0 NCDC
AJO WELL PIMA 7 -112.83 32.45 1430 (436) -- -- -- -- 28 0 0 NCDC
* ALPINE 18 SW GREENLEE 7 -109.33 33.63 9158 (2792) 84 -- 1987 3 4 209 171 NCDC
ALPINE 8 SSE GREENLEE 7 -109.12 33.73 6728 (2051) 19 -- 1999 4 17 20 17 NCDC
AMADO SANTA CRUZ 7 -111.05 31.72 3050 (930) -- -- -- -- 28 0 0 NCDC
ANVIL RANCH PIMA 7 -111.38 31.98 2749 (838) -- -- -- -- 58 0 0 NCDC
APACHE 6 WNW COCHISE 7 -109.23 31.72 5382 (1641) -- -- -- -- 17 0 0 NCDC
APACHE POWDER COMPANY COCHISE 7 -110.25 31.90 3688 (1124) -- -- -- -- 68 0 0 NCDC
* ARAVAIPA RANGER STN 7 -110.27 32.78 3670 (1119) -- -- -- -- 2 0 0 NCDC
ARIVACA PIMA 7 -111.33 31.57 3619 (1103) -- -- -- -- 51 0 0 NCDC
* ARIZONA SONORA DESERT MUSEUM PIMA 7 -111.17 32.25 2821 (860) -- -- -- -- 12 0 0 NCDC
* ARSENIC TUBS 7 -109.83 33.27 4704 (1434) 7 -- 1948 2 3 6 4 NCDC
* BEACH RANCH PIMA 7 -110.77 31.93 3762 (1147) -- -- -- -- 9 0 0 NCDC
* BEAR VALLEY 7 -111.18 31.42 4031 (1229) -- -- -- -- 12 0 0 NCDC
BEAVER HEAD GREENLEE 7 -109.20 33.70 8000 (2439) -- 12.5 68 1 68 60 52 S. Course
* Beaverhead Greenlee 7 -109.22 33.68 7990 (2436) -- 8.3 98 3 11 57 51 Snotel
BEAVERHEAD LODGE GREENLEE 7 -109.22 33.68 8092 (2467) 44 -- 1962 1 20 66 55 NCDC
BENSON COCHISE 7 -110.28 31.97 3585 (1093) 17 -- 1919 3 74 1 1 NCDC
* BENSON 23 NNW COCHISE 7 -110.38 32.30 3142 (958) -- -- -- -- 5 0 0 NCDC
BENSON 6 SE COCHISE 7 -110.23 31.88 3689 (1125) -- -- -- -- 16 0 0 NCDC
BISBEE COCHISE 7 -109.92 31.43 5306 (1618) 20 -- 1949 1 68 5 4 NCDC
BISBEE 1 WNW COCHISE 7 -109.93 31.45 5559 (1695) 7 -- 1988 1 17 4 3 NCDC
BISBEE 2 COCHISE 7 -109.90 31.43 5049 (1539) 6 -- 1980 2 28 1 1 NCDC
BLACK RIVER PUMPS GRAHAM 7 -109.75 33.48 6063 (1849) 15 -- 1997 1 56 5 4 NCDC
BLUE GREENLEE 7 -109.17 33.58 5419 (1652) 42 -- 1967 12 58 16 13 NCDC
* BONITA CREEK 7 -109.78 33.15 4802 (1464) 10 -- 1949 1 6 7 5 NCDC
BOSLEY RANCH GRAHAM 7 -110.20 32.57 4802 (1464) -- -- -- -- 25 0 0 NCDC
BOWIE COCHISE 7 -109.48 32.32 3759 (1146) 10 -- 1978 1 104 1 1 NCDC
* BOWIE JUNCTION R15 ON W5 7 -109.70 32.43 4723 (1440) -- -- -- -- 1 0 0 NCDC
CANELO 1 NW SANTA CRUZ 7 -110.53 31.57 5009 (1527) 11 -- 1978 12 93 2 2 NCDC
CASCABEL COCHISE 7 -110.42 32.32 3144 (959) -- -- -- -- 37 0 0 NCDC
CHIRICAHUA NATL MONUMENT COCHISE 7 -109.35 32.00 5299 (1615) 28 -- 1967 12 69 9 7 NCDC
CLIFTON GREENLEE 7 -109.30 33.05 3519 (1073) 15 -- 1949 1 112 0 0 NCDC
COCHISE 4 SSE COCHISE 7 -109.88 32.07 4179 (1274) 10 -- 1912 2 33 1 1 NCDC
COCHISE STRONGHOLD 7 -109.95 31.95 4749 (1448) 8 -- 1928 2 20 3 3 NCDC
CORONADO N M HDQTRS COCHISE 7 -110.25 31.35 5241 (1598) 16 -- 1988 1 46 4 3 NCDC
* CORONADO NATL MONUMENT 7 -110.28 31.37 5553 (1693) 15 -- 1958 3 5 8 6 NCDC
CORTARO 3 SW PIMA 7 -111.12 32.33 2269 (692) -- -- -- -- 29 0 0 NCDC
* COVERED WELLS 1 E PIMA 7 -112.15 32.15 2620 (799) -- -- -- -- 8 0 0 NCDC
DOS CABEZAS 1 SE COCHISE 7 -109.60 32.17 5104 (1556) 12 -- 1967 12 32 6 5 NCDC
DOUGLAS COCHISE 7 -109.53 31.35 4039 (1231) -- -- -- -- 37 0 0 NCDC
DOUGLAS BISBEE-DOUGLAS INTL A COCHISE 7 -109.60 31.47 4104 (1251) -- -- -- -- 58 0 0 NCDC
DOUGLAS SMELTER 7 -109.58 31.35 3972 (1211) -- -- -- -- 71 0 0 NCDC
DUNCAN GREENLEE 7 -109.12 32.75 3659 (1116) 15 -- 1949 1 72 0 0 NCDC
EAGLE CREEK GREENLEE 7 -109.48 33.40 5104 (1556) 35 -- 1967 12 46 4 3 NCDC
EAGLE CREEK 2 GREENLEE 7 -109.48 33.35 4869 (1484) -- -- -- -- 17 0 0 NCDC
ELGIN 5 N SANTA CRUZ 7 -110.53 31.73 4904 (1495) 13 -- 1916 1 59 3 2 NCDC
FAIRBANK 1 S COCHISE 7 -110.18 31.72 3851 (1174) 10 -- 1939 2 65 1 1 NCDC
* FLYING H RANCH 7 -110.23 31.40 5081 (1549) -- -- -- -- 11 0 0 NCDC
FORT HUACHUCA COCHISE 7 -110.33 31.57 4664 (1422) 13 -- 1916 1 51 5 4 NCDC
* FORT THOMAS GRAHAM 7 -109.95 33.03 2679 (817) -- -- -- -- 9 0 0 NCDC
FORT THOMAS 2 SW GRAHAM 7 -110.00 33.02 2799 (853) -- -- -- -- 40 0 0 NCDC
FRITZ RANCH GREENLEE 7 -109.18 33.33 4323 (1318) -- -- -- -- 33 0 0 NCDC
FT GRANT GRAHAM 7 -109.95 32.62 4849 (1478) 40 -- 1935 3 67 3 2 NCDC
GRANVILLE GREENLEE 7 -109.38 33.20 6802 (2074) 38 -- 1968 12 21 12 9 NCDC
GREEN VALLEY PIMA 7 -111.00 31.90 2899 (884) -- -- -- -- 18 0 0 NCDC
* GREY PEAK GREENLEE 7 -109.38 33.25 6398 (1951) 30 -- 1950 2 5 42 33 NCDC
* GREYS PEAK MNTC YD GREENLEE 7 -109.38 33.25 6658 (2030) 15 -- 1979 2 7 17 15 NCDC
Hannagan Meadows Greenlee 7 -109.32 33.65 9020 (2750) -- 27.1 83 4 23 167 150 Snotel
HANNAGAN MEADOWS GREENLEE 7 -109.32 33.63 9090 (2771) -- 27 93 2 36 159 141 S. Course
49
Appendix A is an expanded table with a more complete presentation of the
statistical data, including distribution parameters, for all of the sites. With the
distribution parameters for each site the ground snow loads for any mean recurrence
interval can be calculated by the methods presented in Section 3.3.
Although there is some inherent error in the calculation of ground snow load from
depth, there are a few sites that give confidence to the methods used. For the Happy Jack
location there are 3 sites; Snow Course, SnoTel and NCDC each have a representation.
(Results for all 3 sites are shown only in Appendix A) The SnoTel site has only 6 years
of records available and discounted as less reliable. The 50-year ground snow load value
of the Snow Course (SWE) site and that of the NCDC (snow depth) site are very similar.
The NCDC site has a 50-year ground snow load of 95 psf predicted from the snow depth
with equation 3.12, while the Snow Course site has a 50-year ground snow load of 90 psf
calculated directly from SWE. The prediction in this case is off by only 6%. McNary is
another location with multiple sites that has an accurate prediction of the 50-year ground
snow load based on snow depth. The Snow Course site has a value of 61 psf calculated
directly from SWE data, while the NCDC site has a predicted value of 58 psf based on
snow depth. This is an error of only 5%.
On the other hand, Fort Valley has a predicted value for its NCDC site of 92 psf
and a calculated value for its Snow Course site of only 60 psf, a 53% error. This is
evidence that equation 3.12 represents only the best-fit regression curve for the snow
depth vs. ground snow load data, as shown in Figure 3.5. Although this curve fits the

50
relationship best, there is still error in the approximation. As stated in Section 3.4 it can
be expected that the prediction will be conservative and unconservative for
approximately half of the predictions.
3.6 OBSERVATIONS
In an attempt to find other relationships with the ground snow loads a plot was
created for latitude vs. 50-year ground snow loads.
Latitude vs. 50-year Ground Snow Load
0
50
100
150
200
250
300
31.00 32.00 33.00 34.00 35.00 36.00 37.00 38.00
Latitude
50-y
ear
Gro
un
d S
no
w L
oa
d (
ps
f)
Figure 3.7 Latitude vs. 50-year Ground Snow Load

51
As can be seen in Figure 3.7 there is no relationship evident between the latitude and
ground snow load. Sites at all latitudes have a 50-year ground snow load of zero, and
conversely, sites with 50-year ground snow loads are located at almost all latitudes.
Figures 3.8 through 3.13 illustrate the relationship between ground snow load and
elevation separated by Climate Division. Climate Division 5 is not included since every
site has a 50-year ground snow load of zero.
Climate Division 1 Elevation vs. 50-yr Ground Snow Load
0
5
10
15
20
25
30
0 1000 2000 3000 4000 5000 6000
Elevation (ft)
50-y
ear
Gro
un
d S
no
w L
oad
(p
sf)
Figure 3.8
Elevation vs. 50-year Ground Snow Load—Climate Division 1

52
Climate Division 2 Elevation vs. 50-yr Ground Snow Load
0
50
100
150
200
250
300
0 2000 4000 6000 8000 10000 12000
Elevation (ft)
50
-ye
ar
Gro
un
d S
no
w L
oa
d (
ps
f)
Figure 3.9 Elevation vs. 50-year Ground Snow Load—Climate Division 2
Climate Division 3 Elevation vs. 50-yr Ground Snow Load
0
20
40
60
80
100
120
140
160
180
0 1000 2000 3000 4000 5000 6000 7000 8000 9000
Elevation (ft)
50-y
ear
Gro
un
d S
no
w L
oad
(p
sf)
Figure 3.10
Elevation vs. 50-year Ground Snow Load—Climate Division 3
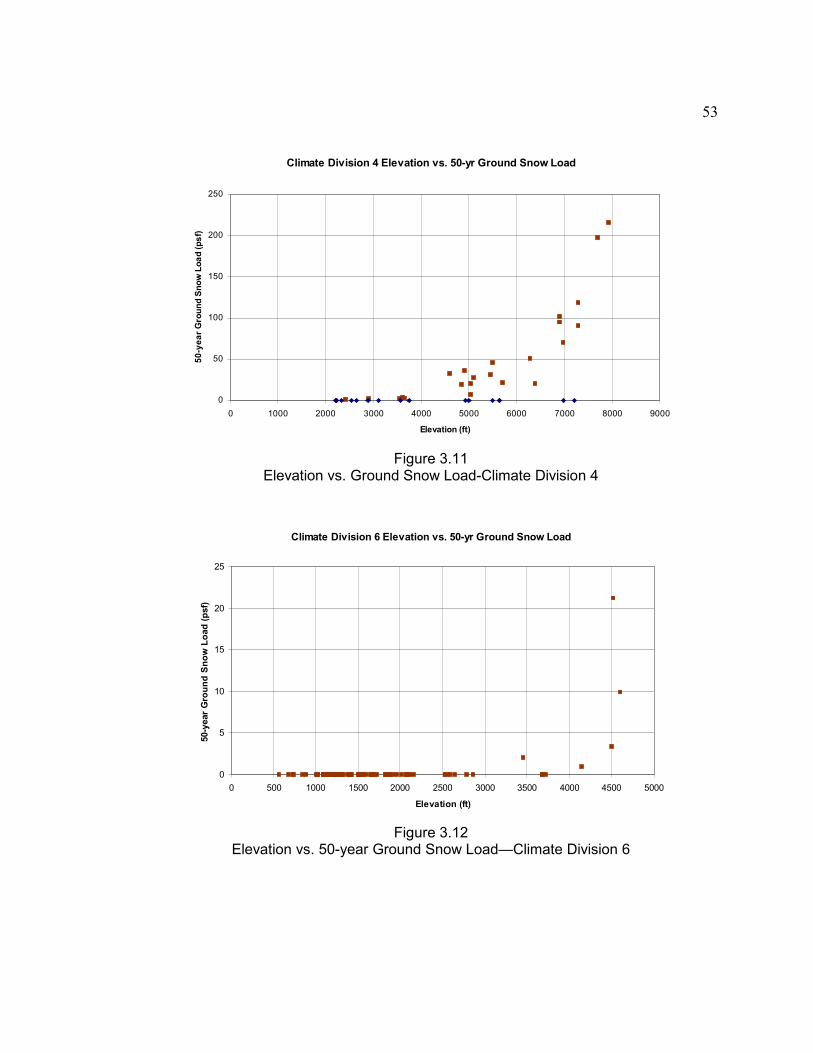
53
Climate Division 4 Elevation vs. 50-yr Ground Snow Load
0
50
100
150
200
250
0 1000 2000 3000 4000 5000 6000 7000 8000 9000
Elevation (ft)
50
-ye
ar
Gro
un
d S
no
w L
oa
d (
ps
f)
Figure 3.11
Elevation vs. Ground Snow Load-Climate Division 4
Climate Division 6 Elevation vs. 50-yr Ground Snow Load
0
5
10
15
20
25
0 500 1000 1500 2000 2500 3000 3500 4000 4500 5000
Elevation (ft)
50-y
ear
Gro
un
d S
no
w L
oad
(p
sf)
Figure 3.12
Elevation vs. 50-year Ground Snow Load—Climate Division 6

54
Climate Division 7 Elevation vs. 50-yr Ground Snow Load
0
50
100
150
200
250
300
0 1000 2000 3000 4000 5000 6000 7000 8000 9000 10000
Elevation (ft)
50
-ye
ar
Gro
un
d S
no
w L
oa
d (
ps
f)
Figure 3.13
Elevation vs. 50-year Ground Snow Load—Climate Division 7
As can be seen from the graphs in Figures 3.8 through 3.13, the obvious
relationship exists that as elevation increases so does the 50-year ground snow load.
There exist so much scatter and error that it is impossible to accurately quantify this
relationship without significant error. In the future, when the Climate Divisions are
reorganized to more closely align with homogeneous weather behavior these
relationships may be more refined as well.
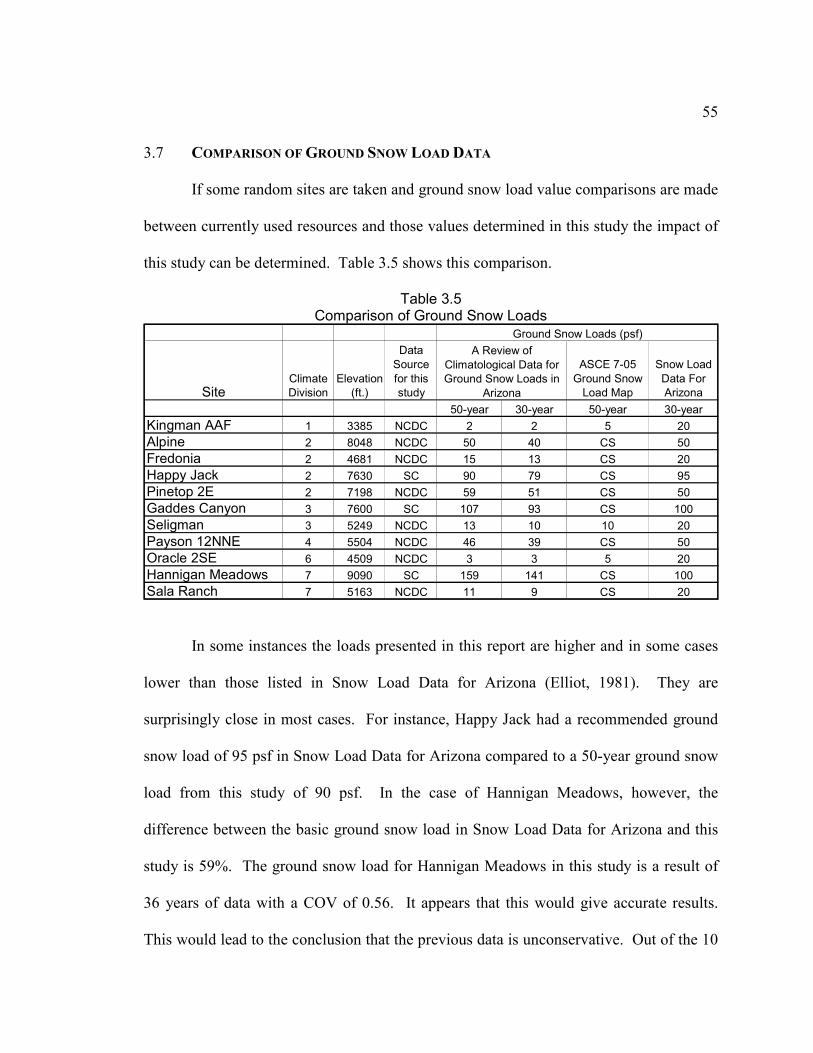
55
3.7 COMPARISON OF GROUND SNOW LOAD DATA
If some random sites are taken and ground snow load value comparisons are made
between currently used resources and those values determined in this study the impact of
this study can be determined. Table 3.5 shows this comparison.
Table 3.5 Comparison of Ground Snow Loads
SiteClimate
Division
Elevation
(ft.)
Data
Source
for this
study
ASCE 7-05
Ground Snow
Load Map
Snow Load
Data For
Arizona
50-year 30-year 50-year 30-year
Kingman AAF 1 3385 NCDC 2 2 5 20
Alpine 2 8048 NCDC 50 40 CS 50
Fredonia 2 4681 NCDC 15 13 CS 20
Happy Jack 2 7630 SC 90 79 CS 95
Pinetop 2E 2 7198 NCDC 59 51 CS 50
Gaddes Canyon 3 7600 SC 107 93 CS 100
Seligman 3 5249 NCDC 13 10 10 20
Payson 12NNE 4 5504 NCDC 46 39 CS 50
Oracle 2SE 6 4509 NCDC 3 3 5 20
Hannigan Meadows 7 9090 SC 159 141 CS 100
Sala Ranch 7 5163 NCDC 11 9 CS 20
A Review of
Climatological Data for
Ground Snow Loads in
Arizona
Ground Snow Loads (psf)
In some instances the loads presented in this report are higher and in some cases
lower than those listed in Snow Load Data for Arizona (Elliot, 1981). They are
surprisingly close in most cases. For instance, Happy Jack had a recommended ground
snow load of 95 psf in Snow Load Data for Arizona compared to a 50-year ground snow
load from this study of 90 psf. In the case of Hannigan Meadows, however, the
difference between the basic ground snow load in Snow Load Data for Arizona and this
study is 59%. The ground snow load for Hannigan Meadows in this study is a result of
36 years of data with a COV of 0.56. It appears that this would give accurate results.
This would lead to the conclusion that the previous data is unconservative. Out of the 10

56
sites considered only 3 had ground snow loads attainable from the ASCE 7-05 map.
From this comparison it is evident that additional information could be very beneficial,
and should be implemented among the structural design community for use in designing
for snow in Arizona.

57
CHAPTER FOUR
LIMITATIONS
4.1 MAPPING OF SNOW LOADS
Many other states have developed a guide for ground snow loads specific to their
state. Some of these states have mapped their ground snow loads with isolines, similar to
what is presented in ASCE 7. (Idaho, 1984, Washington 1995) In the ASCE 7 ground
snow load maps the isolines determine the depth directly. Another method developed to
try to be even more accurate is to determine a relationship between the elevation and the
ground snow load. Ground Snow Loads for Idaho contains a map where the contours or
isolines separate coefficients to be used in an equation relating the elevation to the ground
snow load (Sack and Sheik-Taheri, 1986). Not every location in between two isolines
has the same ground snow load, but the elevation of the site and the contours together
help to determine the ground snow load to be used for design. This is similar to what
Elliott (1981) had in mind originally in Snow Load Data for Arizona as mentioned
previously in Chapter 2.2. This would prove to be a very useful tool for designers if this
relationship could be determined for each division of homogenous climate and advance
software could be used to develop the isolines.
4.2 MISSING DATA
There is data presented in Snow Load Data for Arizona (Elliot, 1981) that could
not be located. Some of the sites are not included in the NCDC database. There are most

58
likely other agencies that keep historical data on snow depth or snow water equivalents
that were either not contacted or no response was received. Although efforts were made
to be as comprehensive as possible, some locations were not represented in this study.
The recommendations in the ASCE 7-05 for conducting the Case Studies include
finding the values for all known sites within a fifty-mile radius of the site of interest. For
many locations along the borders of the state of Arizona this would require having the
historical data for locations in Utah and New Mexico. For this report to be more
complete it would make sense to include data available for all sites in New Mexico and
Utah within fifty miles of the Arizona border. Nevada and California could be ignored
since the elevations along the Arizona border adjacent to these two states is less than
4,000 feet above mean sea level and there are no records of significant snow fall for the
Arizona sites in this area.
4.3 STATISTICAL MODELING
When the data from the NCDC sites was manipulated and reduced for modeling
the maximum snow depths were determined for a calendar year instead of a winter year.
This may not have a consequential affect, except that if there was a large storm at the end
of December the maximum snow depth for the calendar year of December and for the
calendar year of January might be determined from the same storm. If the data was
rearranged to be considered by winter years this theoretical end-of-the-year storm would
be counted only once. The data from the NWCC was recorded by winter year, not

59
calendar year; hence this concern only applies to the data obtained from the NCDC
database.
60
CHAPTER FIVE
SUMMARY AND CONCLUSION
5.1 SUMMARY
Comprehensive structural design requires consideration for snow loads. Modern
building codes determine snow loads on structures by applying coefficients for exposure,
roof shape, etc. to basic ground snow loads. Basic ground snow loads are currently loads
with a mean recurrence interval of 50 years and are illustrated in ground snow load maps
found in the code. These maps contain areas with a “CS” designation indicating that a
site-specific Case Study is required to determine the basic ground snow load within that
area. A snow load design guide was published for Arizona in 1973 with a second
printing in 1981. Nothing has been done since this time to update the snow loads
presented in that guide. Although it is a great guide for designers, it is not completely
consistent with current code and modern standards of practice, e.g., the loads published
are presented as having a 30-year mean recurrence interval.
Research over the past 25 years has indicated that modeling annual extreme snow
depth and SWE with a lognormal distribution is a reliable approach. Advances have also
been made in finding an appropriate snow depth-density relationship. To update
available ground snow loads historical Snow Water Equivalent data and snow depth data
were collected for over 500 sites in Arizona. The annual maximum SWE or snow depth
was gleaned from the data and the records for each site were modeled as a lognormal
distribution to determine the SWE or snow depth with a 50-year mean recurrence
interval. For the sites with SWE data, the 50-year ground snow load was calculated using

61
the weight of water multiplied by the SWE. A snow density prediction relating snow
density to depth was determined from historical records for 41 sites that contained both
SWE and snow depth data. For the sites with snow depth data, this relationship was
applied to the 50-year snow depth to determine the 50-year ground snow load. Table 3.4
is a summary of sites across Arizona with their respective 50-year ground snow loads.
For convenience and comparison, the 30-year ground snow loads are listed also. Further
work could be done to improve this report as a design guide by developing a contour map
for the 50-year basic ground snow loads in Arizona.
5.2 CONCLUSION
This report presents improved basic ground snow loads for Arizona
consistent with recent research and modern building code standards. The attempt of this
study was to provide up-to-date ground snow loads to be used in structural design in
Arizona and fill some of the voids in current design practices with a scientific approach
of applying reliable statistical methods to historical climatological data. Inasmuch as the
historical data is accurate and the statistical methods reliable the ground snow loads
presented herein are satisfactory for use in structural design and should be encouraged in
the structural design community in Arizona.
These loads are believed to be accurate from a statistical modeling stand point,
but caution should be used when applying the information presented in this report to
structural design. In the immortal words of Elliott (1981) “Statistics are helpful,
Judgment is essential.”

62
APPENDIX A

Ground Snow Loads with Statistical Data for All Sites 63 .
Station Name CountyClimate
DivisionLongitude Latitude
Elev.
(ft (m))
Max
Snow
Depth
(in)
Max
SWE
(in of
H2O)
Year
of Max
Month
of Max
# of
Years
of
Data
50-yr
Ground
Snow
Load
(psf)
[Eqn. 2.1]
50-yr
Ground
Snow
Load
(psf)
[Eqn.
3.12]
30-yr
Ground
Snow
Load
(psf)
[Eqn. 2.1]
30-yr
Ground
Snow
Load
(psf)
[Eqn.
3.12]
BEAVER DAM MOHAVE 1 -113.95 36.90 1875 (572) -- -- -- -- 43 0 0 0 0
* BEAVER DAM MOHAVE 1 -113.95 36.90 1875 (572) -- -- -- -- 1 0 0 0 0
BULLHEAD CITY MOHAVE 1 -114.57 35.13 540 (165) -- -- -- -- 29 0 0 0 0
* CHLORIDE MOHAVE 1 -114.20 35.42 4021 (1226) -- -- -- -- 1 0 0 0 0
COLORADO CITY MOHAVE 1 -112.97 37.00 5009 (1527) 13 -- 1979 2 43 10 14 8 11
* COLORADO CITY MOHAVE 1 -112.98 37.00 5012 (1528) 8 -- 1951 4 13 8 11 6 8
* DAVIS DAM MOHAVE 1 -114.57 35.18 531 (162) -- -- -- -- 11 0 0 0 0
DAVIS DAM # 2 MOHAVE 1 -114.57 35.20 659 (201) -- -- -- -- 20 0 0 0 0
* DIAMOND BAR RANCH 1 -114.00 35.88 3601 (1098) -- -- -- -- 5 0 0 0 0
* DIAMOND M RANCH MOHAVE 1 -113.37 35.30 5479 (1670) 15 -- 2001 1 7 19 25 15 21
* HACKBERRY 1 -113.73 35.37 3582 (1092) -- -- -- -- 5 0 0 0 0
* KATHERINE RANGER STN MOHAVE 1 -114.57 35.23 670 (204) -- -- -- -- 2 0 0 0 0
KINGMAN AAF MOHAVE 1 -113.93 35.27 3385 (1032) 7 -- 1922 3 67 2 2 1 2
* KINGMAN AIRPORT MOHAVE 1 -113.93 35.25 3419 (1042) -- -- -- -- 3 0 0 0 0
KINGMAN NO 2 MOHAVE 1 -114.02 35.20 3538 (1079) -- -- -- -- 27 0 0 0 0
LAKE HAVASU MOHAVE 1 -114.37 34.45 482 (147) -- -- -- -- 25 0 0 0 0
LAKE HAVASU CITY MOHAVE 1 -114.37 34.50 468 (143) -- -- -- -- 15 0 0 0 0
* LITTLEFIELD 1 NE MOHAVE 1 -113.90 36.90 1904 (581) -- -- -- -- 12 0 0 0 0
* LITTLEFIELD 25 SSW MOHAVE 1 -114.03 36.53 4002 (1220) 12 -- 1949 1 5 9 13 7 10
* LOOKOUT RANCH 1 -113.38 35.20 5002 (1525) -- -- -- -- 7 0 0 0 0
* MEADVIEW 1SE MOHAVE 1 -114.08 36.02 3199 (975) -- -- -- -- 10 0 0 0 0
MOUNT TRUMBULL MOHAVE 1 -113.35 36.42 5603 (1708) 40 -- 1945 12 57 8 11 6 8
PEACH SPRINGS MOHAVE 1 -113.42 35.55 4969 (1515) 27 -- 1967 12 56 4 6 3 5
* PIERCE FERRY MOHAVE 1 -114.00 36.12 1371 (418) -- -- -- -- 5 0 0 0 0
PIERCE FERRY 17 SSW MOHAVE 1 -114.08 35.88 3857 (1176) 11 -- 1979 2 22 6 8 4 6
PIPE SPRINGS NATL MON MOHAVE 1 -112.73 36.87 4919 (1500) 18 -- 1973 1 43 5 7 4 6
* SIGNAL MOHAVE 1 -113.63 34.47 1522 (464) -- -- -- -- 1 0 0 0 0
* SIGNAL 13 SW 1 -113.80 34.37 2512 (766) -- -- -- -- 9 0 0 0 0
TEMPLE BAR MOHAVE 1 -114.33 36.03 1280 (390) -- -- -- -- 19 0 0 0 0
* TOPOCK MOHAVE 1 -114.48 34.72 449 (137) -- -- -- -- 3 0 0 0 0
* TOPOCK 2 SSE 1 -114.45 34.70 502 (153) -- -- -- -- 13 0 0 0 0
TRUXTON CANYON MOHAVE 1 -113.67 35.38 3819 (1164) 12 -- 1932 12 54 4 5 3 4
TUWEEP MOHAVE 1 -113.07 36.28 4774 (1455) 15 -- 1967 12 45 7 9 5 7
* WHITE HILLS 5 WSW MOHAVE 1 -114.48 35.70 2430 (741) -- -- -- -- 4 0 0 0 0
WIKIEUP MOHAVE 1 -113.62 34.70 2009 (613) -- -- -- -- 54 0 0 0 0
WILLOW BEACH MOHAVE 1 -114.67 35.87 740 (226) -- -- -- -- 39 0 0 0 0
YUCCA 1 NNE MOHAVE 1 -114.13 34.88 1950 (594) -- -- -- -- 53 0 0 0 0
ALPINE APACHE 2 -109.15 33.85 8048 (2454) 60 -- 1967 12 97 38 50 31 40
ARBABS FOREST APACHE 2 -109.20 35.70 7680 (2341) -- 6 98 2 21 41 41 36 36
* ASH FORK 5 N COCONINO 2 -112.47 35.28 5325 (1623) 8 -- 1978 3 8 6 8 6 8
ASH FORK 6 N COCONINO 2 -112.48 35.30 5304 (1617) 38 -- 1967 12 71 12 16 9 13
Baldy Apache 2 -109.50 33.98 9125 (2782) -- 17.6 83 4 23 115 115 103 103
BALDY #1 - SNOW COURSE AND AERIALAPACHE 2 -109.52 33.98 9125 (2782) -- 18.3 79 3 50 110 110 99 99
BALDY #2 APACHE 2 -109.55 33.93 9750 (2973) -- 41.8 79 3 36 238 238 214 214
BEAR PAW COCONINO 2 -111.65 35.35 10100 (3079) -- 51 93 E/ST 37 271 271 244 244
BEAVER SPRING APACHE 2 -109.05 36.33 9220 (2811) -- 16.8 93 3 20 103 103 96 96
* BELLEMONT NWFO COCONINO 2 -111.82 35.23 7150 (2180) 20 -- 2005 1 7 26 34 22 29
BETATAKIN NAVAJO 2 -110.53 36.68 7284 (2221) 38 -- 1967 12 67 26 35 23 30
* BIG LAKE 2 -109.42 33.87 9004 (2745) -- -- -- -- 2 0 0 0 0
* BITA HOCHEE TRADING POST NAVAJO 2 -110.08 35.42 5904 (1800) -- -- -- -- 8 0 0 0 0
* BLACK MOUNTAIN MISSION APACHE 2 -109.87 36.12 6353 (1937) 12 -- 1961 12 9 10 14 8 11
BLUE RIDGE RANGER STN COCONINO 2 -111.18 34.62 6878 (2097) 38 -- 1997 1 39 39 50 31 41
BRIGHT ANGEL RS COCONINO 2 -112.07 36.22 8398 (2560) 89 -- 1993 2 81 164 199 138 169
* BUCK SPRING APACHE 2 -109.85 34.12 7400 (2256) -- 5.4 98 2 8 35 35 30 30
* BUFFALO RANCH 2 -111.95 36.47 5662 (1726) 21 -- 1960 12 4 32 42 25 33
BURRUS RANCH COCONINO 2 -111.53 35.27 6802 (2074) 70 -- 1949 2 25 67 84 54 68
CAMERON 1 NNE COCONINO 2 -111.40 35.88 4163 (1269) 18 -- 1967 12 31 2 3 1 2
* CAMP GERONIMO GILA 2 -111.37 34.40 5514 (1681) 15 -- 1978 2 2 28 36 22 29
CANYON DE CHELLY APACHE 2 -109.53 36.15 5608 (1710) 8 -- 1974 1 36 2 3 2 2
* CEDAR RIDGE TRADING POST COCONINO 2 -111.52 36.38 5923 (1806) -- -- -- -- 6 0 0 0 0
CHALENDER COCONINO 2 -112.07 35.25 7100 (2165) -- 12 73 3 59 63 63 55 55
CHEESE SPRINGS APACHE 2 -109.50 34.05 8700 (2652) -- 12.4 73 3 37 72 72 66 66
CHEVELON RS COCONINO 2 -110.92 34.55 7004 (2135) 52 -- 1967 12 45 43 55 35 45
CHINLE APACHE 2 -109.53 36.15 5544 (1690) 14 -- 1967 12 57 9 13 7 10
CIBECUE NAVAJO 2 -110.48 34.03 4979 (1518) 18 -- 1937 1 52 14 19 11 15
CLAY SPRINGS NAVAJO 2 -110.32 34.38 6318 (1926) -- -- -- -- 16 0 0 0 0
COPPER MINE TRADING POST COCONINO 2 -111.42 36.63 6383 (1946) 23 -- 1960 12 38 13 17 10 14
Coronado Trail Apache 2 -109.15 33.80 8400 (2561) -- 13.8 93 3 23 75 75 66 66
CORONADO TRAIL APACHE 2 -109.15 33.80 8350 (2546) -- 12.5 49 2 68 65 65 57 57
* COTTONWOOD INDIAN SCHOOL 2 -109.88 36.07 6052 (1845) -- -- -- -- 3 0 0 0 0
* COW SPRINGS TRADING POST COCONINO 2 -110.85 36.42 5704 (1739) -- -- -- -- 6 0 0 0 0
* DILKON 2 -110.32 35.38 5002 (1525) -- -- -- -- 1 0 0 0 0
DINNEHOTSO APACHE 2 -109.85 36.85 5022 (1531) 9 -- 1967 12 19 6 9 5 7
FLAGSTAFF 4 SW COCONINO 2 -111.73 35.17 7123 (2172) 38 -- 1997 1 22 43 56 39 50
FLAGSTAFF PULLIAM ARPT COCONINO 2 -111.67 35.15 7001 (2135) 83 -- 1967 12 72 59 75 50 64
* FLAGSTAFF WB CITY 2 -111.67 35.20 6921 (2110) 68 -- 1949 1 9 67 84 52 66
FLUTED ROCK APACHE 2 -109.25 35.88 7800 (2378) -- 7.8 98 2 21 52 52 46 46
* FOREST DALE ALT. NAVAJO 2 -110.08 34.22 6580 (2006) -- 2.5 87 2 6 20 20 18 18
FORESTDALE NAVAJO 2 -110.10 34.15 6104 (1861) 24 -- 1965 2 25 21 28 18 24
FORT APACHE APACHE 2 -109.52 34.00 9160 (2793) -- 17.6 93 3 55 107 107 96 96
FORT DEFIANCE 2 -109.08 35.75 6904 (2105) 14 -- 1903 2 19 13 18 10 14
FORT VALLEY COCONINO 2 -111.75 35.27 7345 (2239) 57 -- 1949 1 97 73 92 60 76
FORT VALLEY COCONINO 2 -111.75 35.27 7350 (2241) -- 11.6 49 2 59 60 60 52 52
* indicates less than 15 years of data available
SHADED indicates 50-year Snow Load less than 12 PSF (negligible in typical design)
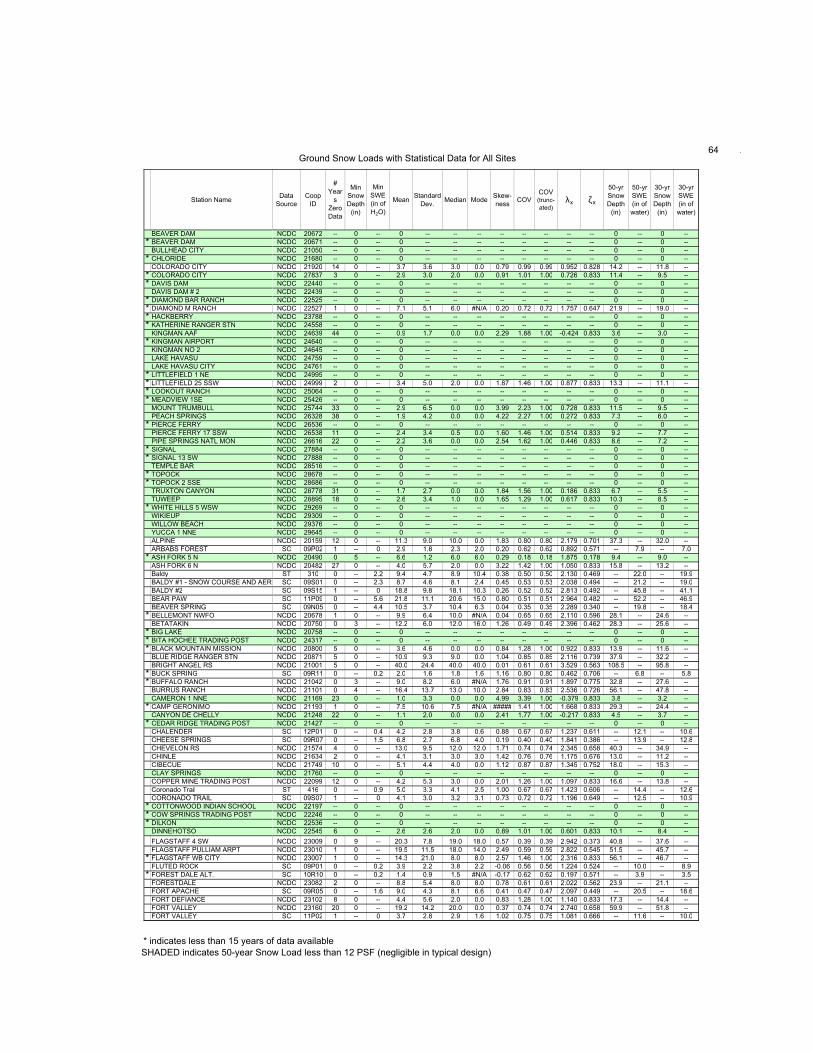
Ground Snow Loads with Statistical Data for All Sites 64 .
Station Name
BEAVER DAM
* BEAVER DAM
BULLHEAD CITY
* CHLORIDE
COLORADO CITY
* COLORADO CITY
* DAVIS DAM
DAVIS DAM # 2
* DIAMOND BAR RANCH
* DIAMOND M RANCH
* HACKBERRY
* KATHERINE RANGER STN
KINGMAN AAF
* KINGMAN AIRPORT
KINGMAN NO 2
LAKE HAVASU
LAKE HAVASU CITY
* LITTLEFIELD 1 NE
* LITTLEFIELD 25 SSW
* LOOKOUT RANCH
* MEADVIEW 1SE
MOUNT TRUMBULL
PEACH SPRINGS
* PIERCE FERRY
PIERCE FERRY 17 SSW
PIPE SPRINGS NATL MON
* SIGNAL
* SIGNAL 13 SW
TEMPLE BAR
* TOPOCK
* TOPOCK 2 SSE
TRUXTON CANYON
TUWEEP
* WHITE HILLS 5 WSW
WIKIEUP
WILLOW BEACH
YUCCA 1 NNE
ALPINE
ARBABS FOREST
* ASH FORK 5 N
ASH FORK 6 N
Baldy
BALDY #1 - SNOW COURSE AND AERIAL
BALDY #2
BEAR PAW
BEAVER SPRING
* BELLEMONT NWFO
BETATAKIN
* BIG LAKE
* BITA HOCHEE TRADING POST
* BLACK MOUNTAIN MISSION
BLUE RIDGE RANGER STN
BRIGHT ANGEL RS
* BUCK SPRING
* BUFFALO RANCH
BURRUS RANCH
CAMERON 1 NNE
* CAMP GERONIMO
CANYON DE CHELLY
* CEDAR RIDGE TRADING POST
CHALENDER
CHEESE SPRINGS
CHEVELON RS
CHINLE
CIBECUE
CLAY SPRINGS
COPPER MINE TRADING POST
Coronado Trail
CORONADO TRAIL
* COTTONWOOD INDIAN SCHOOL
* COW SPRINGS TRADING POST
* DILKON
DINNEHOTSO
FLAGSTAFF 4 SW
FLAGSTAFF PULLIAM ARPT
* FLAGSTAFF WB CITY
FLUTED ROCK
* FOREST DALE ALT.
FORESTDALE
FORT APACHE
FORT DEFIANCE
FORT VALLEY
FORT VALLEY
Data
Source
Coop
ID
#
Year
s
Zero
Data
Min
Snow
Depth
(in)
Min
SWE
(in of
H2O)
MeanStandard
Dev.Median Mode
Skew-
nessCOV
COV (trunc-
ated)λx ζx
50-yr
Snow
Depth
(in)
50-yr
SWE
(in of
water)
30-yr
Snow
Depth
(in)
30-yr
SWE
(in of
water)
NCDC 20672 -- 0 -- 0 -- -- -- -- -- -- -- -- 0 -- 0 --
NCDC 20671 -- 0 -- 0 -- -- -- -- -- -- -- -- 0 -- 0 --
NCDC 21050 -- 0 -- 0 -- -- -- -- -- -- -- -- 0 -- 0 --
NCDC 21680 -- 0 -- 0 -- -- -- -- -- -- -- -- 0 -- 0 --
NCDC 21920 14 0 -- 3.7 3.6 3.0 0.0 0.79 0.99 0.99 0.952 0.828 14.2 -- 11.8 --
NCDC 27837 3 0 -- 2.9 3.0 2.0 0.0 0.91 1.01 1.00 0.726 0.833 11.4 -- 9.5 --
NCDC 22440 -- 0 -- 0 -- -- -- -- -- -- -- -- 0 -- 0 --
NCDC 22439 -- 0 -- 0 -- -- -- -- -- -- -- -- 0 -- 0 --
NCDC 22525 -- 0 -- 0 -- -- -- -- -- -- -- -- 0 -- 0 --
NCDC 22527 1 0 -- 7.1 5.1 6.0 #N/A 0.20 0.72 0.72 1.757 0.647 21.9 -- 19.0 --
NCDC 23788 -- 0 -- 0 -- -- -- -- -- -- -- -- 0 -- 0 --
NCDC 24558 -- 0 -- 0 -- -- -- -- -- -- -- -- 0 -- 0 --
NCDC 24639 44 0 -- 0.9 1.7 0.0 0.0 2.29 1.88 1.00 -0.424 0.833 3.6 -- 3.0 --
NCDC 24640 -- 0 -- 0 -- -- -- -- -- -- -- -- 0 -- 0 --
NCDC 24645 -- 0 -- 0 -- -- -- -- -- -- -- -- 0 -- 0 --
NCDC 24759 -- 0 -- 0 -- -- -- -- -- -- -- -- 0 -- 0 --
NCDC 24761 -- 0 -- 0 -- -- -- -- -- -- -- -- 0 -- 0 --
NCDC 24995 -- 0 -- 0 -- -- -- -- -- -- -- -- 0 -- 0 --
NCDC 24999 2 0 -- 3.4 5.0 2.0 0.0 1.87 1.46 1.00 0.877 0.833 13.3 -- 11.1 --
NCDC 25064 -- 0 -- 0 -- -- -- -- -- -- -- -- 0 -- 0 --
NCDC 25426 -- 0 -- 0 -- -- -- -- -- -- -- -- 0 -- 0 --
NCDC 25744 33 0 -- 2.9 6.5 0.0 0.0 3.99 2.23 1.00 0.728 0.833 11.5 -- 9.5 --
NCDC 26328 38 0 -- 1.9 4.2 0.0 0.0 4.22 2.27 1.00 0.272 0.833 7.3 -- 6.0 --
NCDC 26536 -- 0 -- 0 -- -- -- -- -- -- -- -- 0 -- 0 --
NCDC 26538 11 0 -- 2.4 3.4 0.5 0.0 1.60 1.46 1.00 0.514 0.833 9.2 -- 7.7 --
NCDC 26616 22 0 -- 2.2 3.6 0.0 0.0 2.54 1.62 1.00 0.446 0.833 8.6 -- 7.2 --
NCDC 27884 -- 0 -- 0 -- -- -- -- -- -- -- -- 0 -- 0 --
NCDC 27888 -- 0 -- 0 -- -- -- -- -- -- -- -- 0 -- 0 --
NCDC 28516 -- 0 -- 0 -- -- -- -- -- -- -- -- 0 -- 0 --
NCDC 28678 -- 0 -- 0 -- -- -- -- -- -- -- -- 0 -- 0 --
NCDC 28686 -- 0 -- 0 -- -- -- -- -- -- -- -- 0 -- 0 --
NCDC 28778 31 0 -- 1.7 2.7 0.0 0.0 1.84 1.56 1.00 0.186 0.833 6.7 -- 5.5 --
NCDC 28895 18 0 -- 2.6 3.4 1.0 0.0 1.65 1.29 1.00 0.617 0.833 10.3 -- 8.5 --
NCDC 29269 -- 0 -- 0 -- -- -- -- -- -- -- -- 0 -- 0 --
NCDC 29309 -- 0 -- 0 -- -- -- -- -- -- -- -- 0 -- 0 --
NCDC 29376 -- 0 -- 0 -- -- -- -- -- -- -- -- 0 -- 0 --
NCDC 29645 -- 0 -- 0 -- -- -- -- -- -- -- -- 0 -- 0 --
NCDC 20159 12 0 -- 11.3 9.0 10.0 0.0 1.83 0.80 0.80 2.179 0.701 37.3 -- 32.0 --
SC 09P02 1 -- 0 2.9 1.8 2.3 2.0 0.20 0.62 0.62 0.892 0.571 -- 7.9 -- 7.0
NCDC 20490 0 5 -- 6.6 1.2 6.0 6.0 0.29 0.18 0.18 1.875 0.178 9.4 -- 9.0 --
NCDC 20482 27 0 -- 4.0 5.7 2.0 0.0 3.22 1.42 1.00 1.050 0.833 15.8 -- 13.2 --
ST 310 0 -- 2.2 9.4 4.7 8.9 10.4 0.38 0.50 0.50 2.130 0.469 -- 22.0 -- 19.9
SC 09S01 0 -- 2.3 8.7 4.6 8.1 2.4 0.45 0.53 0.53 2.038 0.494 -- 21.2 -- 19.0
SC 09S15 1 -- 0 18.8 9.8 18.1 10.3 0.26 0.52 0.52 2.813 0.492 -- 45.8 -- 41.1
SC 11P09 0 -- 5.6 21.8 11.1 20.6 15.0 0.80 0.51 0.51 2.964 0.482 -- 52.2 -- 46.9
SC 09N05 0 -- 4.4 10.5 3.7 10.4 6.3 0.04 0.35 0.35 2.289 0.340 -- 19.8 -- 18.4
NCDC 20678 1 0 -- 9.9 6.4 10.0 #N/A 0.04 0.65 0.65 2.110 0.596 28.1 -- 24.6 --
NCDC 20750 0 3 -- 12.2 6.0 12.0 16.0 1.26 0.49 0.49 2.396 0.462 28.3 -- 25.6 --
NCDC 20758 -- 0 -- 0 -- -- -- -- -- -- -- -- 0 -- 0 --
NCDC 24317 -- 0 -- 0 -- -- -- -- -- -- -- -- 0 -- 0 --
NCDC 20800 5 0 -- 3.6 4.6 0.0 0.0 0.84 1.28 1.00 0.922 0.833 13.9 -- 11.6 --
NCDC 20871 5 0 -- 10.9 9.3 9.0 0.0 1.04 0.85 0.85 2.116 0.739 37.9 -- 32.2 --
NCDC 21001 5 0 -- 40.0 24.4 40.0 40.0 0.01 0.61 0.61 3.529 0.563 108.5 -- 95.8 --
SC 09R11 0 -- 0.2 2.0 1.6 1.8 1.6 1.16 0.80 0.80 0.462 0.706 -- 6.8 -- 5.8
NCDC 21042 0 3 -- 9.0 8.2 6.0 #N/A 1.76 0.91 0.91 1.897 0.775 32.8 -- 27.6 --
NCDC 21101 0 4 -- 16.4 13.7 13.0 10.0 2.84 0.83 0.83 2.536 0.726 56.1 -- 47.8 --
NCDC 21169 23 0 -- 1.0 3.3 0.0 0.0 4.99 3.39 1.00 -0.379 0.833 3.8 -- 3.2 --
NCDC 21193 1 0 -- 7.5 10.6 7.5 #N/A ##### 1.41 1.00 1.668 0.833 29.3 -- 24.4 --
NCDC 21248 22 0 -- 1.1 2.0 0.0 0.0 2.41 1.77 1.00 -0.217 0.833 4.5 -- 3.7 --
NCDC 21427 -- 0 -- 0 -- -- -- -- -- -- -- -- 0 -- 0 --
SC 12P01 0 -- 0.4 4.2 2.8 3.8 0.6 0.88 0.67 0.67 1.237 0.611 -- 12.1 -- 10.6
SC 09R07 0 -- 1.5 6.8 2.7 6.8 4.0 0.19 0.40 0.40 1.841 0.386 -- 13.9 -- 12.8
NCDC 21574 4 0 -- 13.0 9.5 12.0 12.0 1.71 0.74 0.74 2.345 0.658 40.3 -- 34.9 --
NCDC 21634 2 0 -- 4.1 3.1 3.0 3.0 1.42 0.76 0.76 1.175 0.676 13.0 -- 11.2 --
NCDC 21749 10 0 -- 5.1 4.4 4.0 0.0 1.12 0.87 0.87 1.345 0.752 18.0 -- 15.3 --
NCDC 21760 -- 0 -- 0 -- -- -- -- -- -- -- -- 0 -- 0 --
NCDC 22099 12 0 -- 4.2 5.3 3.0 0.0 2.01 1.26 1.00 1.097 0.833 16.6 -- 13.8 --
ST 416 0 -- 0.9 5.0 3.3 4.1 2.5 1.00 0.67 0.67 1.423 0.606 -- 14.4 -- 12.6
SC 09S07 1 -- 0 4.1 3.0 3.2 3.1 0.73 0.72 0.72 1.196 0.649 -- 12.5 -- 10.9
NCDC 22197 -- 0 -- 0 -- -- -- -- -- -- -- -- 0 -- 0 --
NCDC 22246 -- 0 -- 0 -- -- -- -- -- -- -- -- 0 -- 0 --
NCDC 22536 -- 0 -- 0 -- -- -- -- -- -- -- -- 0 -- 0 --
NCDC 22545 6 0 -- 2.6 2.6 2.0 0.0 0.89 1.01 1.00 0.601 0.833 10.1 -- 8.4 --
NCDC 23009 0 9 -- 20.3 7.8 19.0 18.0 0.57 0.39 0.39 2.942 0.373 40.8 -- 37.6 --
NCDC 23010 1 0 -- 19.5 11.5 18.0 14.0 2.49 0.59 0.59 2.822 0.545 51.5 -- 45.7 --
NCDC 23007 1 0 -- 14.3 21.0 8.0 8.0 2.57 1.46 1.00 2.316 0.833 56.1 -- 46.7 --
SC 09P01 0 -- 0.2 3.9 2.2 3.8 2.2 -0.06 0.56 0.56 1.224 0.524 -- 10.0 -- 8.9
SC 10R10 0 -- 0.2 1.4 0.9 1.5 #N/A -0.17 0.62 0.62 0.197 0.571 -- 3.9 -- 3.5
NCDC 23082 2 0 -- 8.8 5.4 8.0 8.0 0.78 0.61 0.61 2.022 0.562 23.9 -- 21.1 --
SC 09R05 0 -- 1.6 9.0 4.3 8.1 6.6 0.41 0.47 0.47 2.097 0.449 -- 20.5 -- 18.6
NCDC 23102 8 0 -- 4.4 5.6 2.0 0.0 0.83 1.28 1.00 1.140 0.833 17.3 -- 14.4 --
NCDC 23160 20 0 -- 19.2 14.2 20.0 0.0 0.37 0.74 0.74 2.740 0.658 59.9 -- 51.8 --
SC 11P02 1 -- 0 3.7 2.8 2.9 1.6 1.02 0.75 0.75 1.081 0.666 -- 11.6 -- 10.0
* indicates less than 15 years of data available
SHADED indicates 50-year Snow Load less than 12 PSF (negligible in typical design)
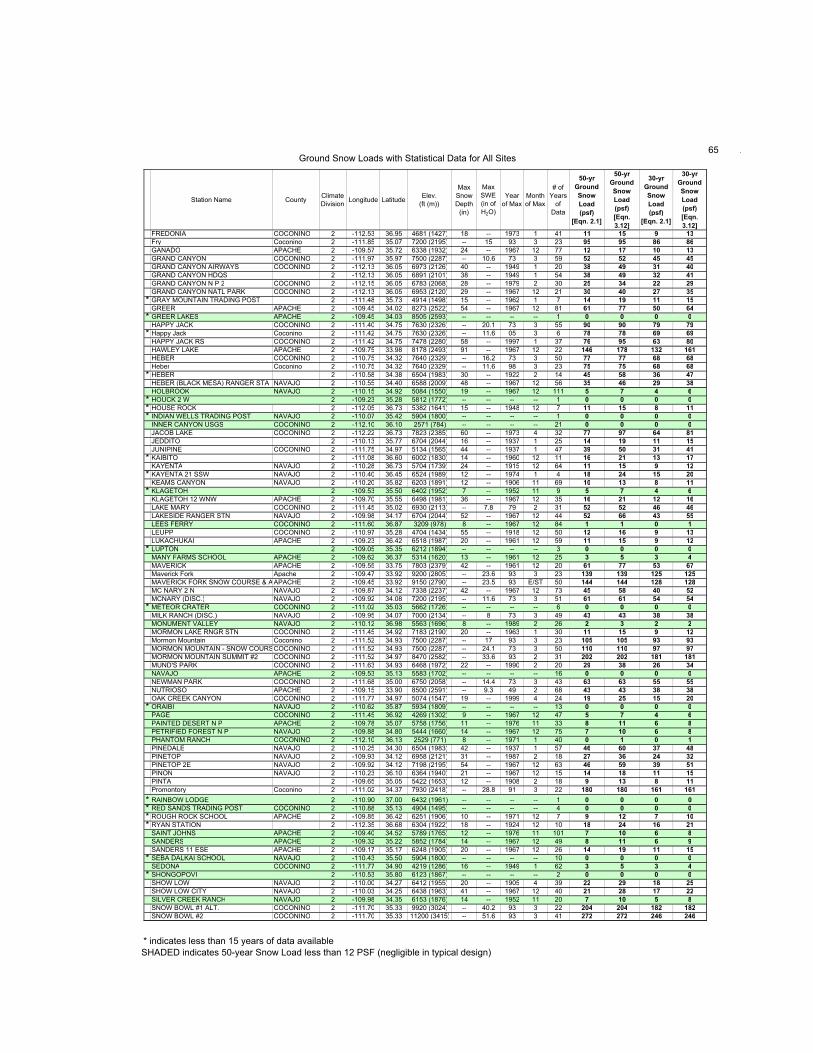
Ground Snow Loads with Statistical Data for All Sites 65 .
Station Name CountyClimate
DivisionLongitude Latitude
Elev.
(ft (m))
Max
Snow
Depth
(in)
Max
SWE
(in of
H2O)
Year
of Max
Month
of Max
# of
Years
of
Data
50-yr
Ground
Snow
Load
(psf)
[Eqn. 2.1]
50-yr
Ground
Snow
Load
(psf)
[Eqn.
3.12]
30-yr
Ground
Snow
Load
(psf)
[Eqn. 2.1]
30-yr
Ground
Snow
Load
(psf)
[Eqn.
3.12]
FREDONIA COCONINO 2 -112.53 36.95 4681 (1427) 18 -- 1973 1 41 11 15 9 13
Fry Coconino 2 -111.85 35.07 7200 (2195) -- 15 93 3 23 95 95 86 86
GANADO APACHE 2 -109.57 35.72 6338 (1932) 24 -- 1967 12 77 12 17 10 13
GRAND CANYON COCONINO 2 -111.97 35.97 7500 (2287) -- 10.6 73 3 59 52 52 45 45
GRAND CANYON AIRWAYS COCONINO 2 -112.13 36.05 6973 (2126) 40 -- 1949 1 20 38 49 31 40
GRAND CANYON HDQS 2 -112.13 36.05 6891 (2101) 38 -- 1949 1 54 38 49 32 41
GRAND CANYON N P 2 COCONINO 2 -112.15 36.05 6783 (2068) 28 -- 1979 2 30 25 34 22 29
GRAND CANYON NATL PARK COCONINO 2 -112.13 36.05 6953 (2120) 29 -- 1967 12 21 30 40 27 35
* GRAY MOUNTAIN TRADING POST 2 -111.48 35.73 4914 (1498) 15 -- 1962 1 7 14 19 11 15
GREER APACHE 2 -109.45 34.02 8273 (2522) 54 -- 1967 12 81 61 77 50 64
* GREER LAKES APACHE 2 -109.45 34.03 8505 (2593) -- -- -- -- 1 0 0 0 0
HAPPY JACK COCONINO 2 -111.40 34.75 7630 (2326) -- 20.1 73 3 55 90 90 79 79
* Happy Jack Coconino 2 -111.42 34.75 7630 (2326) -- 11.6 05 3 6 78 78 69 69
HAPPY JACK RS COCONINO 2 -111.42 34.75 7478 (2280) 58 -- 1997 1 37 76 95 63 80
HAWLEY LAKE APACHE 2 -109.75 33.98 8178 (2493) 91 -- 1967 12 22 146 178 132 161
HEBER COCONINO 2 -110.75 34.32 7640 (2329) -- 16.2 73 3 50 77 77 68 68
Heber Coconino 2 -110.75 34.32 7640 (2329) -- 11.6 98 3 23 75 75 68 68
* HEBER 2 -110.58 34.38 6504 (1983) 30 -- 1922 2 14 45 58 36 47
HEBER (BLACK MESA) RANGER STA NAVAJO 2 -110.55 34.40 6588 (2009) 48 -- 1967 12 56 35 46 29 38
HOLBROOK NAVAJO 2 -110.15 34.92 5084 (1550) 19 -- 1967 12 111 5 7 4 6
* HOUCK 2 W 2 -109.23 35.28 5812 (1772) -- -- -- -- 1 0 0 0 0
* HOUSE ROCK 2 -112.05 36.73 5382 (1641) 15 -- 1948 12 7 11 15 8 11
* INDIAN WELLS TRADING POST NAVAJO 2 -110.07 35.42 5904 (1800) -- -- -- -- 1 0 0 0 0
INNER CANYON USGS COCONINO 2 -112.10 36.10 2571 (784) -- -- -- -- 21 0 0 0 0
JACOB LAKE COCONINO 2 -112.22 36.73 7823 (2385) 60 -- 1973 4 32 77 97 64 81
JEDDITO 2 -110.13 35.77 6704 (2044) 16 -- 1937 1 25 14 19 11 15
JUNIPINE COCONINO 2 -111.75 34.97 5134 (1565) 44 -- 1937 1 47 39 50 31 41
* KAIBITO 2 -111.08 36.60 6002 (1830) 14 -- 1960 12 11 16 21 13 17
KAYENTA NAVAJO 2 -110.28 36.73 5704 (1739) 24 -- 1915 12 64 11 15 9 12
* KAYENTA 21 SSW NAVAJO 2 -110.40 36.45 6524 (1989) 12 -- 1974 1 4 18 24 15 20
KEAMS CANYON NAVAJO 2 -110.20 35.82 6203 (1891) 12 -- 1906 11 69 10 13 8 11
* KLAGETOH 2 -109.53 35.50 6402 (1952) 7 -- 1952 11 9 5 7 4 6
KLAGETOH 12 WNW APACHE 2 -109.70 35.55 6498 (1981) 36 -- 1967 12 35 16 21 12 16
LAKE MARY COCONINO 2 -111.45 35.02 6930 (2113) -- 7.8 79 2 31 52 52 46 46
LAKESIDE RANGER STN NAVAJO 2 -109.98 34.17 6704 (2044) 52 -- 1967 12 44 52 66 43 55
LEES FERRY COCONINO 2 -111.60 36.87 3209 (978) 8 -- 1967 12 84 1 1 0 1
LEUPP COCONINO 2 -110.97 35.28 4704 (1434) 55 -- 1918 12 50 12 16 9 13
LUKACHUKAI APACHE 2 -109.23 36.42 6518 (1987) 20 -- 1961 12 59 11 15 9 12
* LUPTON 2 -109.05 35.35 6212 (1894) -- -- -- -- 3 0 0 0 0
MANY FARMS SCHOOL APACHE 2 -109.62 36.37 5314 (1620) 13 -- 1961 12 25 3 5 3 4
MAVERICK APACHE 2 -109.55 33.75 7803 (2379) 42 -- 1961 12 20 61 77 53 67
Maverick Fork Apache 2 -109.47 33.92 9200 (2805) -- 23.6 93 3 23 139 139 125 125
MAVERICK FORK SNOW COURSE & AERIALAPACHE 2 -109.45 33.92 9150 (2790) -- 23.5 93 E/ST 50 144 144 128 128
MC NARY 2 N NAVAJO 2 -109.87 34.12 7338 (2237) 42 -- 1967 12 73 45 58 40 52
MCNARY (DISC.) NAVAJO 2 -109.92 34.08 7200 (2195) -- 11.6 73 3 51 61 61 54 54
* METEOR CRATER COCONINO 2 -111.02 35.03 5662 (1726) -- -- -- -- 6 0 0 0 0
MILK RANCH (DISC.) NAVAJO 2 -109.95 34.07 7000 (2134) -- 8 73 3 49 43 43 38 38
MONUMENT VALLEY NAVAJO 2 -110.12 36.98 5563 (1696) 8 -- 1989 2 26 2 3 2 2
MORMON LAKE RNGR STN COCONINO 2 -111.45 34.92 7183 (2190) 20 -- 1963 1 30 11 15 9 12
Mormon Mountain Coconino 2 -111.52 34.93 7500 (2287) -- 17 93 3 23 105 105 93 93
MORMON MOUNTAIN - SNOW COURSE & AERIALCOCONINO 2 -111.52 34.93 7500 (2287) -- 24.1 73 3 50 110 110 97 97
MORMON MOUNTAIN SUMMIT #2 COCONINO 2 -111.52 34.97 8470 (2582) -- 33.6 93 2 31 202 202 181 181
MUND'S PARK COCONINO 2 -111.63 34.93 6468 (1972) 22 -- 1990 2 20 29 38 26 34
NAVAJO APACHE 2 -109.53 35.13 5583 (1702) -- -- -- -- 16 0 0 0 0
NEWMAN PARK COCONINO 2 -111.68 35.00 6750 (2058) -- 14.4 73 3 43 63 63 55 55
NUTRIOSO APACHE 2 -109.15 33.90 8500 (2591) -- 9.3 49 2 68 43 43 38 38
OAK CREEK CANYON COCONINO 2 -111.77 34.97 5074 (1547) 19 -- 1999 4 24 19 25 15 20
* ORAIBI NAVAJO 2 -110.62 35.87 5934 (1809) -- -- -- -- 13 0 0 0 0
PAGE COCONINO 2 -111.45 36.92 4269 (1302) 9 -- 1967 12 47 5 7 4 6
PAINTED DESERT N P APACHE 2 -109.78 35.07 5758 (1756) 11 -- 1976 11 33 8 11 6 8
PETRIFIED FOREST N P NAVAJO 2 -109.88 34.80 5444 (1660) 14 -- 1967 12 75 7 10 6 8
PHANTOM RANCH COCONINO 2 -112.10 36.13 2529 (771) 8 -- 1971 1 40 0 1 0 1
PINEDALE NAVAJO 2 -110.25 34.30 6504 (1983) 42 -- 1937 1 57 46 60 37 48
PINETOP NAVAJO 2 -109.93 34.12 6958 (2121) 31 -- 1987 2 18 27 36 24 32
PINETOP 2E NAVAJO 2 -109.92 34.12 7198 (2195) 54 -- 1967 12 63 46 59 39 51
PINON NAVAJO 2 -110.23 36.10 6364 (1940) 21 -- 1967 12 15 14 18 11 15
PINTA 2 -109.65 35.05 5422 (1653) 12 -- 1908 2 18 9 13 8 11
Promontory Coconino 2 -111.02 34.37 7930 (2418) -- 28.8 91 3 22 180 180 161 161
* RAINBOW LODGE 2 -110.90 37.00 6432 (1961) -- -- -- -- 1 0 0 0 0
* RED SANDS TRADING POST COCONINO 2 -110.88 35.13 4904 (1495) -- -- -- -- 4 0 0 0 0
* ROUGH ROCK SCHOOL APACHE 2 -109.85 36.42 6251 (1906) 10 -- 1971 12 7 9 12 7 10
* RYAN STATION 2 -112.35 36.68 6304 (1922) 18 -- 1924 12 10 18 24 16 21
SAINT JOHNS APACHE 2 -109.40 34.52 5789 (1765) 12 -- 1976 11 101 7 10 6 8
SANDERS APACHE 2 -109.32 35.22 5852 (1784) 14 -- 1967 12 49 8 11 6 9
SANDERS 11 ESE APACHE 2 -109.17 35.17 6248 (1905) 20 -- 1967 12 26 14 19 11 15
* SEBA DALKAI SCHOOL NAVAJO 2 -110.43 35.50 5904 (1800) -- -- -- -- 10 0 0 0 0
SEDONA COCONINO 2 -111.77 34.90 4219 (1286) 16 -- 1949 1 62 3 5 3 4
* SHONGOPOVI 2 -110.53 35.80 6123 (1867) -- -- -- -- 2 0 0 0 0
SHOW LOW NAVAJO 2 -110.00 34.27 6412 (1955) 20 -- 1905 4 39 22 29 18 25
SHOW LOW CITY NAVAJO 2 -110.03 34.25 6438 (1963) 41 -- 1967 12 40 21 28 17 22
SILVER CREEK RANCH NAVAJO 2 -109.98 34.35 6153 (1876) 14 -- 1952 11 20 7 10 5 8
SNOW BOWL #1 ALT. COCONINO 2 -111.70 35.33 9920 (3024) -- 40.2 93 3 22 204 204 182 182
SNOW BOWL #2 COCONINO 2 -111.70 35.33 11200 (3415) -- 51.6 93 3 41 272 272 246 246
* indicates less than 15 years of data available
SHADED indicates 50-year Snow Load less than 12 PSF (negligible in typical design)

Ground Snow Loads with Statistical Data for All Sites 66 .
Station Name
FREDONIA
Fry
GANADO
GRAND CANYON
GRAND CANYON AIRWAYS
GRAND CANYON HDQS
GRAND CANYON N P 2
GRAND CANYON NATL PARK
* GRAY MOUNTAIN TRADING POST
GREER
* GREER LAKES
HAPPY JACK
* Happy Jack
HAPPY JACK RS
HAWLEY LAKE
HEBER
Heber
* HEBER
HEBER (BLACK MESA) RANGER STA
HOLBROOK
* HOUCK 2 W
* HOUSE ROCK
* INDIAN WELLS TRADING POST
INNER CANYON USGS
JACOB LAKE
JEDDITO
JUNIPINE
* KAIBITO
KAYENTA
* KAYENTA 21 SSW
KEAMS CANYON
* KLAGETOH
KLAGETOH 12 WNW
LAKE MARY
LAKESIDE RANGER STN
LEES FERRY
LEUPP
LUKACHUKAI
* LUPTON
MANY FARMS SCHOOL
MAVERICK
Maverick Fork
MAVERICK FORK SNOW COURSE & AERIAL
MC NARY 2 N
MCNARY (DISC.)
* METEOR CRATER
MILK RANCH (DISC.)
MONUMENT VALLEY
MORMON LAKE RNGR STN
Mormon Mountain
MORMON MOUNTAIN - SNOW COURSE & AERIAL
MORMON MOUNTAIN SUMMIT #2
MUND'S PARK
NAVAJO
NEWMAN PARK
NUTRIOSO
OAK CREEK CANYON
* ORAIBI
PAGE
PAINTED DESERT N P
PETRIFIED FOREST N P
PHANTOM RANCH
PINEDALE
PINETOP
PINETOP 2E
PINON
PINTA
Promontory
* RAINBOW LODGE
* RED SANDS TRADING POST
* ROUGH ROCK SCHOOL
* RYAN STATION
SAINT JOHNS
SANDERS
SANDERS 11 ESE
* SEBA DALKAI SCHOOL
SEDONA
* SHONGOPOVI
SHOW LOW
SHOW LOW CITY
SILVER CREEK RANCH
SNOW BOWL #1 ALT.
SNOW BOWL #2
Data
Source
Coop
ID
#
Year
s
Zero
Data
Min
Snow
Depth
(in)
Min
SWE
(in of
H2O)
MeanStandard
Dev.Median Mode
Skew-
nessCOV
COV (trunc-
ated)λx ζx
50-yr
Snow
Depth
(in)
50-yr
SWE
(in of
water)
30-yr
Snow
Depth
(in)
30-yr
SWE
(in of
water)
NCDC 23250 3 0 -- 4.7 3.6 4.0 4.0 1.77 0.77 0.77 1.309 0.685 15.1 -- 13.0 --
ST 488 0 -- 2.1 8.1 3.8 7.8 3.3 0.03 0.47 0.47 1.988 0.446 -- 18.3 -- 16.6
NCDC 23303 24 0 -- 4.2 4.7 3.0 0.0 1.73 1.14 1.00 1.081 0.833 16.3 -- 13.6 --
SC 11P01 3 -- 0 3.2 2.4 2.5 0.0 1.11 0.74 0.74 0.957 0.658 -- 10.1 -- 8.7
NCDC 23586 3 0 -- 10.8 9.1 9.0 9.0 1.74 0.84 0.84 2.110 0.734 37.3 -- 31.7 --
NCDC 23591 4 0 -- 13.2 8.4 12.0 6.0 0.87 0.63 0.63 2.413 0.582 36.9 -- 32.4 --
NCDC 23596 1 0 -- 10.8 6.1 10.0 12.0 1.13 0.56 0.56 2.242 0.524 27.7 -- 24.6 --
NCDC 23595 0 4 -- 13.7 6.6 13.0 14.0 0.87 0.48 0.48 2.511 0.457 31.5 -- 28.5 --
NCDC 23663 0 1 -- 4.6 5.2 2.0 1.0 1.74 1.14 1.00 1.173 0.833 17.9 -- 14.9 --
NCDC 23683 5 0 -- 17.4 12.3 15.0 5.0 0.78 0.70 0.70 2.657 0.634 52.4 -- 45.6 --
NCDC 23688 -- 0 -- 0 -- -- -- -- -- -- -- -- 0 -- 0 --
SC 11R05 1 -- 0 5.9 4.0 5.0 2.2 0.97 0.67 0.67 1.595 0.611 -- 17.3 -- 15.1
ST 969 0 -- 2.8 6.1 3.2 6.0 #N/A 0.98 0.53 0.53 1.679 0.498 -- 14.9 -- 13.4
NCDC 23828 3 0 -- 21.0 14.3 18.0 16.0 0.54 0.68 0.68 2.854 0.617 61.7 -- 53.8 --
NCDC 23926 0 30 -- 52.9 18.2 53.5 32.0 0.34 0.34 0.34 3.912 0.335 99.6 -- 92.5 --
SC 10R04 0 -- 0.5 5.3 3.4 4.4 2.5 1.08 0.63 0.63 1.506 0.579 -- 14.8 -- 13.0
ST 519 0 -- 1.9 6.6 2.9 7.1 7.1 0.14 0.44 0.44 1.805 0.420 -- 14.4 -- 13.1
NCDC 23958 1 0 -- 12.6 10.1 7.0 7.0 0.51 0.80 0.80 2.290 0.703 41.9 -- 35.9 --
NCDC 23961 4 0 -- 11.3 8.3 10.0 6.0 1.95 0.74 0.74 2.205 0.659 35.1 -- 30.4 --
NCDC 24089 47 0 -- 2.1 2.9 1.0 0.0 2.51 1.38 1.00 0.408 0.833 8.3 -- 6.9 --
NCDC 24228 -- 0 -- 0 -- -- -- -- -- -- -- -- 0 -- 0 --
NCDC 24240 4 0 -- 3.7 5.6 0.0 0.0 1.64 1.51 1.00 0.966 0.833 14.5 -- 12.1 --
NCDC 20781 -- 0 -- 0 -- -- -- -- -- -- -- -- 0 -- 0 --
NCDC 24335 -- 0 -- 0 -- -- -- -- -- -- -- -- 0 -- 0 --
NCDC 24418 1 0 -- 20.6 14.6 18.5 26.0 0.67 0.71 0.71 2.821 0.639 62.4 -- 54.2 --
NCDC 24438 3 0 -- 5.7 4.1 6.0 4.0 0.51 0.72 0.72 1.535 0.646 17.5 -- 15.2 --
NCDC 24508 1 0 -- 11.0 9.1 9.0 9.0 2.04 0.83 0.83 2.138 0.724 37.5 -- 32.0 --
NCDC 24528 1 0 -- 5.7 4.6 4.0 4.0 0.94 0.81 0.81 1.492 0.712 19.2 -- 16.4 --
NCDC 24578 22 0 -- 3.9 5.2 2.0 0.0 2.16 1.33 1.00 1.016 0.833 15.3 -- 12.7 --
NCDC 24580 1 0 -- 7.0 5.0 8.0 8.0 -1.13 0.72 0.72 1.738 0.646 21.4 -- 18.6 --
NCDC 24586 11 0 -- 4.4 3.1 4.0 5.0 0.60 0.71 0.71 1.278 0.641 13.4 -- 11.6 --
NCDC 24683 0 2 -- 3.4 1.9 3.0 2.0 1.20 0.55 0.55 1.107 0.510 8.6 -- 7.7 --
NCDC 24686 9 0 -- 4.9 6.4 4.0 0.0 3.49 1.30 1.00 1.246 0.833 19.2 -- 16.0 --
SC 11P12 0 -- 0.2 3.8 2.2 3.6 1.6 0.01 0.59 0.59 1.191 0.543 -- 10.0 -- 8.9
NCDC 24779 3 0 -- 15.3 10.9 14.0 14.0 1.55 0.71 0.71 2.527 0.638 46.4 -- 40.3 --
NCDC 24849 69 0 -- 0.5 1.3 0.0 0.0 3.69 2.79 1.00 -1.114 0.833 1.8 -- 1.5 --
NCDC 24872 17 0 -- 4.1 8.2 3.0 0.0 5.27 2.00 1.00 1.060 0.833 16.0 -- 13.3 --
NCDC 25129 30 0 -- 3.8 5.2 0.0 0.0 1.41 1.36 1.00 0.996 0.833 15.0 -- 12.5 --
NCDC 25156 -- 0 -- 0 -- -- -- -- -- -- -- -- 0 -- 0 --
NCDC 25204 13 0 -- 1.6 2.8 0.0 0.0 2.92 1.73 1.00 0.148 0.833 6.4 -- 5.3 --
NCDC 25312 1 0 -- 22.9 10.9 25.0 32.0 -0.36 0.48 0.48 3.027 0.452 52.3 -- 47.3 --
ST 617 0 -- 2.4 11.0 5.7 10.1 #N/A 0.57 0.52 0.52 2.281 0.489 -- 26.7 -- 24.0
SC 09S02 0 -- 2.3 10.9 6.1 9.9 7.0 0.54 0.56 0.56 2.253 0.519 -- 27.7 -- 24.7
NCDC 25412 0 8 -- 20.3 8.3 19.0 16.0 0.73 0.41 0.41 2.933 0.394 42.2 -- 38.7 --
SC 09R02 1 -- 0 4.2 2.7 3.4 1.8 0.81 0.63 0.63 1.281 0.575 -- 11.7 -- 10.3
NCDC 25494 -- 0 -- 0 -- -- -- -- -- -- -- -- 0 -- 0 --
SC 09R01 2 -- 0 2.9 1.9 2.6 1.5 0.96 0.68 0.68 0.863 0.613 -- 8.4 -- 7.3
NCDC 25665 18 0 -- 1.1 2.1 0.0 0.0 2.20 1.96 1.00 -0.272 0.833 4.2 -- 3.5 --
NCDC 25708 13 0 -- 3.9 5.3 2.0 0.0 1.59 1.37 1.00 1.006 0.833 15.1 -- 12.6 --
ST 640 0 -- 2 8.0 4.4 7.5 9.9 0.57 0.55 0.55 1.944 0.515 -- 20.1 -- 17.9
SC 11R03 0 -- 0.8 7.8 4.7 7.0 4.9 0.93 0.61 0.61 1.896 0.560 -- 21.1 -- 18.6
SC 11R12 0 -- 3.8 15.9 8.4 13.6 10.0 0.51 0.53 0.53 2.645 0.494 -- 38.9 -- 34.9
NCDC 25780 0 2 -- 16.2 5.5 18.5 19.0 -1.00 0.34 0.34 2.730 0.332 30.3 -- 28.2 --
NCDC 25837 -- 0 -- 0 -- -- -- -- -- -- -- -- 0 -- 0 --
SC 11P05 1 -- 0 4.0 2.8 3.3 0.5 1.29 0.72 0.72 1.170 0.644 -- 12.1 -- 10.5
SC 09S04 1 -- 0 2.7 2.0 2.1 1.9 1.16 0.73 0.73 0.775 0.656 -- 8.4 -- 7.2
NCDC 26037 6 0 -- 6.4 5.5 5.5 0.0 0.65 0.85 0.85 1.587 0.737 22.2 -- 18.9 --
NCDC 26124 -- 0 -- 0 -- -- -- -- -- -- -- -- 0 -- 0 --
NCDC 26180 23 0 -- 2.2 2.9 1.0 0.0 1.14 1.29 1.00 0.457 0.833 8.7 -- 7.3 --
NCDC 26190 12 0 -- 2.9 2.9 3.0 0.0 0.81 0.98 0.98 0.739 0.823 11.4 -- 9.5 --
NCDC 26468 23 0 -- 2.8 3.2 2.0 0.0 1.63 1.15 1.00 0.669 0.833 10.8 -- 9.0 --
NCDC 26471 35 0 -- 0.4 1.4 0.0 0.0 5.11 3.86 1.00 -1.396 0.833 1.4 -- 1.1 --
NCDC 26581 11 0 -- 11.7 10.8 10.0 0.0 0.97 0.92 0.92 2.149 0.784 43.0 -- 36.1 --
NCDC 26597 0 7 -- 14.4 5.6 14.0 14.0 1.40 0.39 0.39 2.601 0.373 29.0 -- 26.7 --
NCDC 26601 2 0 -- 17.3 9.2 16.0 16.0 1.44 0.53 0.53 2.723 0.499 42.5 -- 38.1 --
NCDC 26604 7 0 -- 4.5 6.2 2.0 0.0 1.63 1.38 1.00 1.150 0.833 17.5 -- 14.5 --
NCDC 26606 2 0 -- 5.1 3.0 5.0 3.0 0.32 0.59 0.59 1.473 0.543 13.3 -- 11.8 --
ST 705 0 -- 3.1 13.9 7.5 12.7 #N/A 0.53 0.54 0.54 2.509 0.503 -- 34.5 -- 30.9
NCDC 26940 -- 0 -- 0 -- -- -- -- -- -- -- -- 0 -- 0 --
NCDC 27069 -- 0 -- 0 -- -- -- -- -- -- -- -- 0 -- 0 --
NCDC 27291 4 0 -- 3.3 4.3 0.0 0.0 0.77 1.32 1.00 0.843 0.833 12.9 -- 10.7 --
NCDC 27349 0 1 -- 8.5 4.7 8.0 7.0 0.42 0.56 0.56 2.005 0.521 21.6 -- 19.3 --
NCDC 27435 38 0 -- 2.9 3.0 2.0 0.0 0.80 1.05 1.00 0.708 0.833 11.2 -- 9.3 --
NCDC 27488 20 0 -- 3.1 3.9 1.0 0.0 1.21 1.26 1.00 0.779 0.833 12.1 -- 10.0 --
NCDC 27496 15 0 -- 4.6 6.4 0.0 0.0 1.19 1.41 1.00 1.174 0.833 17.9 -- 14.9 --
NCDC 27671 -- 0 -- 0 -- -- -- -- -- -- -- -- 0 -- 0 --
NCDC 27708 42 0 -- 1.6 3.2 0.0 0.0 3.01 2.06 1.00 0.101 0.833 6.1 -- 5.1 --
NCDC 27829 -- 0 -- 0 -- -- -- -- -- -- -- -- 0 -- 0 --
NCDC 27849 5 0 -- 9.1 5.6 10.0 0.0 0.04 0.62 0.62 2.042 0.568 24.8 -- 21.8 --
NCDC 27855 9 0 -- 6.2 6.9 5.0 0.0 3.43 1.10 1.00 1.482 0.833 24.4 -- 20.3 --
NCDC 27921 13 0 -- 2.7 4.6 0.0 0.0 1.54 1.70 1.00 0.647 0.833 10.6 -- 8.8 --
SC 11P14 0 -- 2.4 15.6 8.6 13.4 #N/A 1.14 0.55 0.55 2.612 0.515 -- 39.3 -- 35.0
SC 11P06 0 -- 3.2 22.7 10.9 20.8 15.6 0.67 0.48 0.48 3.020 0.456 -- 52.3 -- 47.3
* indicates less than 15 years of data available
SHADED indicates 50-year Snow Load less than 12 PSF (negligible in typical design)

Ground Snow Loads with Statistical Data for All Sites 67 .
Station Name CountyClimate
DivisionLongitude Latitude
Elev.
(ft (m))
Max
Snow
Depth
(in)
Max
SWE
(in of
H2O)
Year
of Max
Month
of Max
# of
Years
of
Data
50-yr
Ground
Snow
Load
(psf)
[Eqn. 2.1]
50-yr
Ground
Snow
Load
(psf)
[Eqn.
3.12]
30-yr
Ground
Snow
Load
(psf)
[Eqn. 2.1]
30-yr
Ground
Snow
Load
(psf)
[Eqn.
3.12]
SNOWFLAKE NAVAJO 2 -110.08 34.50 5641 (1720) 30 -- 1967 12 106 11 15 8 11
SNOWFLAKE 15 W NAVAJO 2 -110.33 34.50 6078 (1853) 24 -- 1967 12 34 17 23 13 18
* Snowslide Canyon Coconino 2 -111.65 34.62 9730 (2966) -- 41 05 4 8 246 246 222 222
SNOWSLIDE CANYON COCONINO 2 -111.65 35.35 9750 (2973) -- 47.5 93 E/ST 37 218 218 194 194
SPRINGERVILLE APACHE 2 -109.30 34.13 7035 (2145) 14 -- 1961 11 95 8 11 6 9
ST MICHAELS 6 WNW APACHE 2 -109.20 35.67 7642 (2330) 14 -- 1913 2 22 13 18 11 14
SUNRISE MOUNTAIN APACHE 2 -109.57 33.97 9368 (2856) 85 -- 1973 4 16 173 210 135 165
SUNSET CRATER NATL MONUMENT COCONINO 2 -111.55 35.37 6978 (2128) 31 -- 1973 3 37 31 40 27 35
SUPAI COCONINO 2 -112.70 36.20 3203 (977) -- -- -- -- 44 0 0 0 0
TEEC NOS POS APACHE 2 -109.08 36.92 5289 (1612) 10 -- 1974 1 44 4 5 3 4
* TEES TO 2 -110.42 35.50 5803 (1769) 7 -- 1959 12 8 1 2 1 2
* TIMBER RANGER STN COCONINO 2 -111.18 34.62 6812 (2077) -- -- -- -- 3 0 0 0 0
* TONALEA 2 -110.95 36.33 5514 (1681) -- -- -- -- 2 0 0 0 0
TSAILE CANYON #1 APACHE 2 -109.10 36.40 8160 (2488) -- 11.2 95 3 21 73 73 67 67
TSAILE CANYON #3 APACHE 2 -109.10 36.45 8920 (2720) -- 15.4 93 2 20 93 93 87 87
TUBA CITY COCONINO 2 -111.25 36.13 4987 (1520) 20 -- 1967 12 98 5 7 4 6
* VALLE COCONINO 2 -112.20 35.65 5891 (1796) -- -- -- -- 2 0 0 0 0
* VALLE AIRPORT COCONINO 2 -112.15 35.67 6002 (1830) 10 -- 1949 1 12 11 16 9 13
WAHWEAP COCONINO 2 -111.48 37.00 3729 (1137) 8 -- 1967 12 45 1 1 1 1
WALLACE RANGER STN 2 -110.92 34.53 7012 (2138) 30 -- 1949 1 41 33 43 27 36
WALNUT CANYON NATL MONUMENT COCONINO 2 -111.50 35.17 6683 (2038) 54 -- 1967 12 57 36 46 30 40
WHITE HORSE LAKE JCT COCONINO 2 -112.15 35.13 7180 (2189) -- 16.6 73 3 33 79 79 69 69
Whitehorse Lake Coconino 2 -112.15 35.15 7180 (2189) -- 13.5 93 3 23 83 83 74 74
WHITERIVER 1 SW NAVAJO 2 -109.98 33.82 5119 (1561) 21 -- 1960 1 101 12 16 9 13
WILLIAMS COCONINO 2 -112.18 35.23 6748 (2057) 52 -- 1949 1 106 44 56 36 47
* WILLIAMS 24 NNW COCONINO 2 -112.40 35.53 5753 (1754) -- -- -- -- 4 0 0 0 0
WILLIAMS CREEK FISH HATCHERY APACHE 2 -109.82 34.05 6963 (2123) 38 -- 1967 12 15 46 59 38 50
WILLIAMS SKI RUN COCONINO 2 -112.20 35.20 7720 (2354) -- 24.6 73 4 39 136 136 122 122
WINDOW ROCK 4 SW APACHE 2 -109.12 35.62 6918 (2109) 18 -- 1967 12 62 13 17 10 14
* WINSLOW NAVAJO 2 -110.70 35.02 4868 (1484) -- -- -- -- 2 0 0 0 0
WINSLOW MUNICIPAL AP NAVAJO 2 -110.72 35.03 4885 (1489) 29 -- 1967 12 89 10 14 8 11
WUPATKI NM COCONINO 2 -111.37 35.52 4907 (1496) 32 -- 1967 12 63 7 9 5 7
* ANVIL ROCK 3 -113.13 35.07 5261 (1604) -- -- -- -- 2 0 0 0 0
* ASH FORK 12 WNW YAVAPAI 3 -112.67 35.27 5739 (1750) 9 -- 1988 1 8 8 11 7 9
ASH FORK 3 YAVAPAI 3 -112.48 35.20 5074 (1547) 12 -- 1990 1 17 8 12 7 9
* ASH FORK CAMPGROUND YAVAPAI 3 -112.48 35.22 5150 (1570) -- -- -- -- 1 0 0 0 0
* BAGDAD 3 -113.20 34.60 3201 (976) 17 -- 1927 2 9 13 18 10 14
BAGDAD YAVAPAI 3 -113.17 34.60 3954 (1206) 10 -- 1932 12 73 1 2 1 2
* BAGDAD 2 YAVAPAI 3 -113.13 34.60 4116 (1255) -- -- -- -- 9 0 0 0 0
BAGDAD 8 NE YAVAPAI 3 -113.08 34.65 4241 (1293) 15 -- 1967 12 26 6 9 5 7
BEAVER CREEK YAVAPAI 3 -111.78 34.65 3524 (1074) 6 -- 1965 4 50 1 1 1 1
BRIGHT ANGEL COCONINO 3 -112.07 36.22 8400 (2561) -- 27.9 93 3 59 154 154 135 135
BUMBLE BEE YAVAPAI 3 -112.15 34.20 2502 (763) 11 -- 1967 12 28 1 1 1 1
CAMP WOOD YAVAPAI 3 -112.87 34.80 5713 (1742) 36 -- 1967 12 31 18 24 14 19
CASTLE HOT SPRINGS YAVAPAI 3 -112.37 33.98 1990 (607) -- -- -- -- 48 0 0 0 0
* CASTLE HOT SPRINGS 4 N 3 -112.35 34.05 2801 (854) -- -- -- -- 10 0 0 0 0
CEDAR GLADE 3 -112.38 34.97 4651 (1418) 28 -- 1930 1 40 18 24 14 19
CHILDS YAVAPAI 3 -111.70 34.35 2649 (808) 10 -- 1937 1 91 0 0 0 0
CHINO VALLEY YAVAPAI 3 -112.45 34.75 4749 (1448) 22 -- 1967 12 65 6 8 4 6
* CONGRESS YAVAPAI 3 -112.87 34.17 3021 (921) -- -- -- -- 11 0 0 0 0
COPPER BASIN DIVIDE YAVAPAI 3 -112.55 34.50 6720 (2049) -- 11.3 68 12 35 57 57 49 49
CORDES YAVAPAI 3 -112.17 34.30 3770 (1149) 15 -- 1967 12 74 2 3 1 2
CROWN KING YAVAPAI 3 -112.35 34.22 5918 (1804) 54 -- 1967 12 82 55 70 43 55
* DRAKE RANGER STN 3 -112.38 34.97 4651 (1418) 12 -- 1961 12 9 13 17 10 13
* DUGAS 2 SE YAVAPAI 3 -111.95 34.35 4041 (1232) -- -- -- -- 13 0 0 0 0
FOSSIL SPRINGS YAVAPAI 3 -111.57 34.42 4271 (1302) -- -- -- -- 20 0 0 0 0
GADDES CANYON YAVAPAI 3 -112.13 34.70 7600 (2317) -- 20.8 73 3 36 107 107 93 93
GROOM CREEK YAVAPAI 3 -112.45 34.48 6104 (1861) 36 -- 1949 1 32 35 46 29 38
* HILLSIDE 3 -112.92 34.42 3851 (1174) 10 -- 1949 1 8 3 4 2 3
HILLSIDE 4 NNE YAVAPAI 3 -112.88 34.47 3319 (1012) 9 -- 1967 12 44 2 3 2 2
IRVING YAVAPAI 3 -111.62 34.40 3794 (1157) -- -- -- -- 55 0 0 0 0
JEROME YAVAPAI 3 -112.12 34.75 4949 (1509) 40 -- 1967 12 109 13 18 10 14
MINGUS MOUNTAIN YAVAPAI 3 -112.13 34.70 7100 (2165) -- 10.8 49 2 43 45 45 37 37
* MINGUS MOUNTAIN LOOKOUT YAVAPAI 3 -112.13 34.70 7662 (2336) -- -- -- -- 1 0 0 0 0
MONTEZUMA CASTLE N M YAVAPAI 3 -111.83 34.62 3179 (969) 19 -- 1967 12 68 1 1 1 1
* PERKINSVILLE YAVAPAI 3 -112.20 34.90 3861 (1177) 10 -- 1968 1 11 4 6 3 5
* POLAND JUNCTION YAVAPAI 3 -112.27 34.45 4904 (1495) -- -- -- -- 1 0 0 0 0
PRESCOTT YAVAPAI 3 -112.43 34.57 5204 (1587) 31 -- 1949 1 107 20 27 16 21
PRESCOTT MUNICIPAL AP YAVAPAI 3 -112.43 34.65 5019 (1530) 28 -- 1967 12 22 16 21 12 17
RIMROCK 3 -111.73 34.65 3601 (1098) 10 -- 1949 1 18 4 6 3 4
SELIGMAN YAVAPAI 3 -112.88 35.33 5249 (1600) 16 -- 1906 1 101 9 13 7 10
SELIGMAN 13 SSW YAVAPAI 3 -112.92 35.13 5242 (1598) -- -- -- -- 20 0 0 0 0
* SKULL VALLEY YAVAPAI 3 -112.68 34.50 4251 (1296) -- -- -- -- 9 0 0 0 0
STANTON YAVAPAI 3 -112.73 34.17 3480 (1061) 10 -- 1967 12 25 2 3 2 3
SYCAMORE RANGER STN YAVAPAI 3 -111.97 34.35 4002 (1220) 8 -- 1937 1 41 2 3 2 3
TONTO SPRINGS RANGER STN 4 W YAVAPAI 3 -112.75 34.62 4802 (1464) 24 -- 1915 12 42 13 17 10 14
TUZIGOOT YAVAPAI 3 -112.03 34.77 3469 (1058) -- -- -- -- 29 0 0 0 0
TUZIGOOT NATL MONUMENT YAVAPAI 3 -112.03 34.75 3382 (1031) 26 -- 1967 12 31 4 5 3 4
WALNUT CREEK YAVAPAI 3 -112.82 34.93 5089 (1551) 55 -- 1948 2 91 14 19 11 15
WALNUT GROVE YAVAPAI 3 -112.57 34.32 3763 (1147) 14 -- 1913 2 112 1 2 1 1
YAEGER CANYON YAVAPAI 3 -112.17 34.68 6002 (1830) 30 -- 1933 1 32 31 41 25 33
YAVA 6 ESE YAVAPAI 3 -112.80 34.45 3782 (1153) -- -- -- -- 28 0 0 0 0
BAKER BUTTE GILA 4 -111.40 34.45 7300 (2226) -- 23.9 73 3 34 119 119 105 105
* indicates less than 15 years of data available
SHADED indicates 50-year Snow Load less than 12 PSF (negligible in typical design)
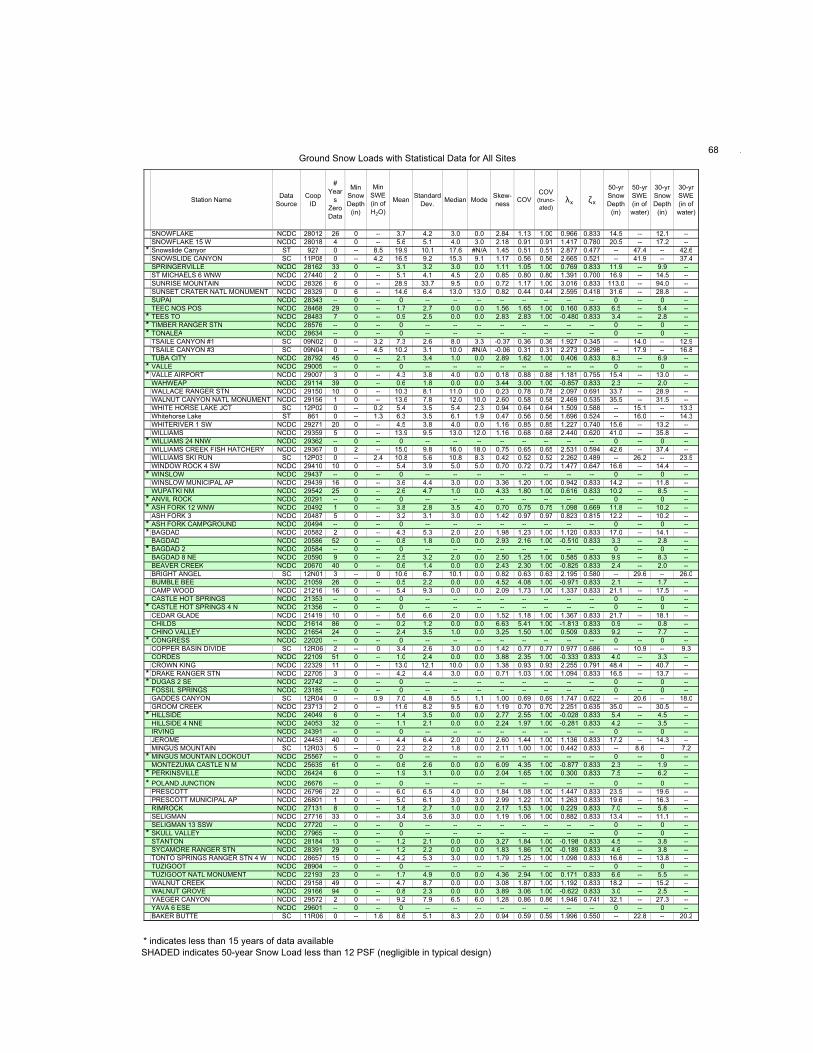
Ground Snow Loads with Statistical Data for All Sites 68 .
Station Name
SNOWFLAKE
SNOWFLAKE 15 W
* Snowslide Canyon
SNOWSLIDE CANYON
SPRINGERVILLE
ST MICHAELS 6 WNW
SUNRISE MOUNTAIN
SUNSET CRATER NATL MONUMENT
SUPAI
TEEC NOS POS
* TEES TO
* TIMBER RANGER STN
* TONALEA
TSAILE CANYON #1
TSAILE CANYON #3
TUBA CITY
* VALLE
* VALLE AIRPORT
WAHWEAP
WALLACE RANGER STN
WALNUT CANYON NATL MONUMENT
WHITE HORSE LAKE JCT
Whitehorse Lake
WHITERIVER 1 SW
WILLIAMS
* WILLIAMS 24 NNW
WILLIAMS CREEK FISH HATCHERY
WILLIAMS SKI RUN
WINDOW ROCK 4 SW
* WINSLOW
WINSLOW MUNICIPAL AP
WUPATKI NM
* ANVIL ROCK
* ASH FORK 12 WNW
ASH FORK 3
* ASH FORK CAMPGROUND
* BAGDAD
BAGDAD
* BAGDAD 2
BAGDAD 8 NE
BEAVER CREEK
BRIGHT ANGEL
BUMBLE BEE
CAMP WOOD
CASTLE HOT SPRINGS
* CASTLE HOT SPRINGS 4 N
CEDAR GLADE
CHILDS
CHINO VALLEY
* CONGRESS
COPPER BASIN DIVIDE
CORDES
CROWN KING
* DRAKE RANGER STN
* DUGAS 2 SE
FOSSIL SPRINGS
GADDES CANYON
GROOM CREEK
* HILLSIDE
HILLSIDE 4 NNE
IRVING
JEROME
MINGUS MOUNTAIN
* MINGUS MOUNTAIN LOOKOUT
MONTEZUMA CASTLE N M
* PERKINSVILLE
* POLAND JUNCTION
PRESCOTT
PRESCOTT MUNICIPAL AP
RIMROCK
SELIGMAN
SELIGMAN 13 SSW
* SKULL VALLEY
STANTON
SYCAMORE RANGER STN
TONTO SPRINGS RANGER STN 4 W
TUZIGOOT
TUZIGOOT NATL MONUMENT
WALNUT CREEK
WALNUT GROVE
YAEGER CANYON
YAVA 6 ESE
BAKER BUTTE
Data
Source
Coop
ID
#
Year
s
Zero
Data
Min
Snow
Depth
(in)
Min
SWE
(in of
H2O)
MeanStandard
Dev.Median Mode
Skew-
nessCOV
COV (trunc-
ated)λx ζx
50-yr
Snow
Depth
(in)
50-yr
SWE
(in of
water)
30-yr
Snow
Depth
(in)
30-yr
SWE
(in of
water)
NCDC 28012 26 0 -- 3.7 4.2 3.0 0.0 2.84 1.13 1.00 0.966 0.833 14.5 -- 12.1 --
NCDC 28018 4 0 -- 5.6 5.1 4.0 3.0 2.18 0.91 0.91 1.417 0.780 20.5 -- 17.2 --
ST 927 0 -- 8.5 19.9 10.1 17.6 #N/A 1.45 0.51 0.51 2.877 0.477 -- 47.4 -- 42.6
SC 11P08 0 -- 4.2 16.5 9.2 15.3 9.1 1.17 0.56 0.56 2.665 0.521 -- 41.9 -- 37.4
NCDC 28162 33 0 -- 3.1 3.2 3.0 0.0 1.11 1.05 1.00 0.769 0.833 11.9 -- 9.9 --
NCDC 27440 2 0 -- 5.1 4.1 4.5 2.0 0.85 0.80 0.80 1.391 0.700 16.9 -- 14.5 --
NCDC 28326 6 0 -- 28.9 33.7 9.5 0.0 0.72 1.17 1.00 3.016 0.833 113.0 -- 94.0 --
NCDC 28329 0 6 -- 14.6 6.4 13.0 13.0 0.82 0.44 0.44 2.595 0.418 31.6 -- 28.8 --
NCDC 28343 -- 0 -- 0 -- -- -- -- -- -- -- -- 0 -- 0 --
NCDC 28468 29 0 -- 1.7 2.7 0.0 0.0 1.56 1.65 1.00 0.160 0.833 6.5 -- 5.4 --
NCDC 28483 7 0 -- 0.9 2.5 0.0 0.0 2.83 2.83 1.00 -0.480 0.833 3.4 -- 2.8 --
NCDC 28576 -- 0 -- 0 -- -- -- -- -- -- -- -- 0 -- 0 --
NCDC 28634 -- 0 -- 0 -- -- -- -- -- -- -- -- 0 -- 0 --
SC 09N02 0 -- 3.2 7.3 2.6 8.0 3.3 -0.37 0.36 0.36 1.927 0.345 -- 14.0 -- 12.9
SC 09N04 0 -- 4.5 10.2 3.1 10.0 #N/A -0.06 0.31 0.31 2.273 0.298 -- 17.9 -- 16.8
NCDC 28792 45 0 -- 2.1 3.4 1.0 0.0 2.89 1.62 1.00 0.406 0.833 8.3 -- 6.9 --
NCDC 29005 -- 0 -- 0 -- -- -- -- -- -- -- -- 0 -- 0 --
NCDC 29007 3 0 -- 4.3 3.8 4.0 0.0 0.18 0.88 0.88 1.181 0.755 15.4 -- 13.0 --
NCDC 29114 39 0 -- 0.6 1.8 0.0 0.0 3.44 3.00 1.00 -0.857 0.833 2.3 -- 2.0 --
NCDC 29150 10 0 -- 10.3 8.1 11.0 0.0 0.23 0.78 0.78 2.097 0.691 33.7 -- 28.9 --
NCDC 29156 1 0 -- 13.6 7.8 12.0 10.0 2.60 0.58 0.58 2.469 0.535 35.5 -- 31.5 --
SC 12P02 0 -- 0.2 5.4 3.5 5.4 2.3 0.94 0.64 0.64 1.509 0.588 -- 15.1 -- 13.3
ST 861 0 -- 1.3 6.3 3.5 6.1 1.9 0.47 0.56 0.56 1.696 0.524 -- 16.0 -- 14.3
NCDC 29271 20 0 -- 4.5 3.8 4.0 0.0 1.16 0.85 0.85 1.227 0.740 15.6 -- 13.2 --
NCDC 29359 5 0 -- 13.9 9.5 13.0 12.0 1.16 0.68 0.68 2.440 0.620 41.0 -- 35.8 --
NCDC 29362 -- 0 -- 0 -- -- -- -- -- -- -- -- 0 -- 0 --
NCDC 29367 0 2 -- 15.0 9.8 16.0 18.0 0.75 0.65 0.65 2.531 0.594 42.6 -- 37.4 --
SC 12P03 0 -- 2.4 10.8 5.6 10.8 8.3 0.42 0.52 0.52 2.262 0.489 -- 26.2 -- 23.5
NCDC 29410 10 0 -- 5.4 3.9 5.0 5.0 0.70 0.72 0.72 1.477 0.647 16.6 -- 14.4 --
NCDC 29437 -- 0 -- 0 -- -- -- -- -- -- -- -- 0 -- 0 --
NCDC 29439 16 0 -- 3.6 4.4 3.0 0.0 3.36 1.20 1.00 0.942 0.833 14.2 -- 11.8 --
NCDC 29542 25 0 -- 2.6 4.7 1.0 0.0 4.33 1.80 1.00 0.616 0.833 10.2 -- 8.5 --
NCDC 20291 -- 0 -- 0 -- -- -- -- -- -- -- -- 0 -- 0 --
NCDC 20492 1 0 -- 3.8 2.8 3.5 4.0 0.70 0.75 0.75 1.098 0.669 11.8 -- 10.2 --
NCDC 20487 5 0 -- 3.2 3.1 3.0 0.0 1.42 0.97 0.97 0.823 0.815 12.2 -- 10.2 --
NCDC 20494 -- 0 -- 0 -- -- -- -- -- -- -- -- 0 -- 0 --
NCDC 20582 2 0 -- 4.3 5.3 2.0 2.0 1.98 1.23 1.00 1.120 0.833 17.0 -- 14.1 --
NCDC 20586 52 0 -- 0.8 1.8 0.0 0.0 2.93 2.16 1.00 -0.510 0.833 3.3 -- 2.8 --
NCDC 20584 -- 0 -- 0 -- -- -- -- -- -- -- -- 0 -- 0 --
NCDC 20590 9 0 -- 2.5 3.2 2.0 0.0 2.50 1.25 1.00 0.585 0.833 9.9 -- 8.3 --
NCDC 20670 40 0 -- 0.6 1.4 0.0 0.0 2.43 2.30 1.00 -0.825 0.833 2.4 -- 2.0 --
SC 12N01 3 -- 0 10.6 6.7 10.1 0.0 0.82 0.63 0.63 2.195 0.580 -- 29.6 -- 26.0
NCDC 21059 26 0 -- 0.5 2.2 0.0 0.0 4.52 4.08 1.00 -0.971 0.833 2.1 -- 1.7 --
NCDC 21216 16 0 -- 5.4 9.3 0.0 0.0 2.09 1.73 1.00 1.337 0.833 21.1 -- 17.5 --
NCDC 21353 -- 0 -- 0 -- -- -- -- -- -- -- -- 0 -- 0 --
NCDC 21356 -- 0 -- 0 -- -- -- -- -- -- -- -- 0 -- 0 --
NCDC 21419 10 0 -- 5.6 6.6 2.0 0.0 1.52 1.18 1.00 1.367 0.833 21.7 -- 18.1 --
NCDC 21614 86 0 -- 0.2 1.2 0.0 0.0 6.63 5.41 1.00 -1.813 0.833 0.9 -- 0.8 --
NCDC 21654 24 0 -- 2.4 3.5 1.0 0.0 3.25 1.50 1.00 0.509 0.833 9.2 -- 7.7 --
NCDC 22020 -- 0 -- 0 -- -- -- -- -- -- -- -- 0 -- 0 --
SC 12R06 2 -- 0 3.4 2.6 3.0 0.0 1.42 0.77 0.77 0.977 0.686 -- 10.9 -- 9.3
NCDC 22109 51 0 -- 1.0 2.4 0.0 0.0 3.88 2.35 1.00 -0.333 0.833 4.0 -- 3.3 --
NCDC 22329 11 0 -- 13.0 12.1 10.0 0.0 1.38 0.93 0.93 2.255 0.791 48.4 -- 40.7 --
NCDC 22705 3 0 -- 4.2 4.4 3.0 0.0 0.71 1.03 1.00 1.094 0.833 16.5 -- 13.7 --
NCDC 22742 -- 0 -- 0 -- -- -- -- -- -- -- -- 0 -- 0 --
NCDC 23185 -- 0 -- 0 -- -- -- -- -- -- -- -- 0 -- 0 --
SC 12R04 0 -- 0.9 7.0 4.8 5.5 1.1 1.00 0.69 0.69 1.747 0.622 -- 20.6 -- 18.0
NCDC 23713 2 0 -- 11.6 8.2 9.5 6.0 1.19 0.70 0.70 2.251 0.635 35.0 -- 30.5 --
NCDC 24049 6 0 -- 1.4 3.5 0.0 0.0 2.77 2.55 1.00 -0.028 0.833 5.4 -- 4.5 --
NCDC 24053 32 0 -- 1.1 2.1 0.0 0.0 2.24 1.97 1.00 -0.281 0.833 4.2 -- 3.5 --
NCDC 24391 -- 0 -- 0 -- -- -- -- -- -- -- -- 0 -- 0 --
NCDC 24453 40 0 -- 4.4 6.4 2.0 0.0 2.60 1.44 1.00 1.136 0.833 17.2 -- 14.3 --
SC 12R03 5 -- 0 2.2 2.2 1.8 0.0 2.11 1.00 1.00 0.442 0.833 -- 8.6 -- 7.2
NCDC 25567 -- 0 -- 0 -- -- -- -- -- -- -- -- 0 -- 0 --
NCDC 25635 61 0 -- 0.6 2.6 0.0 0.0 6.09 4.35 1.00 -0.877 0.833 2.3 -- 1.9 --
NCDC 26424 6 0 -- 1.9 3.1 0.0 0.0 2.04 1.65 1.00 0.300 0.833 7.5 -- 6.2 --
NCDC 26676 -- 0 -- 0 -- -- -- -- -- -- -- -- 0 -- 0 --
NCDC 26796 22 0 -- 6.0 6.5 4.0 0.0 1.84 1.08 1.00 1.447 0.833 23.5 -- 19.6 --
NCDC 26801 1 0 -- 5.0 6.1 3.0 3.0 2.99 1.22 1.00 1.263 0.833 19.6 -- 16.3 --
NCDC 27131 8 0 -- 1.8 2.7 1.0 0.0 2.17 1.53 1.00 0.229 0.833 7.0 -- 5.8 --
NCDC 27716 33 0 -- 3.4 3.6 3.0 0.0 1.19 1.06 1.00 0.882 0.833 13.4 -- 11.1 --
NCDC 27720 -- 0 -- 0 -- -- -- -- -- -- -- -- 0 -- 0 --
NCDC 27965 -- 0 -- 0 -- -- -- -- -- -- -- -- 0 -- 0 --
NCDC 28184 13 0 -- 1.2 2.1 0.0 0.0 3.27 1.84 1.00 -0.198 0.833 4.5 -- 3.8 --
NCDC 28391 29 0 -- 1.2 2.2 0.0 0.0 1.83 1.86 1.00 -0.189 0.833 4.6 -- 3.8 --
NCDC 28657 15 0 -- 4.2 5.3 3.0 0.0 1.79 1.25 1.00 1.098 0.833 16.6 -- 13.8 --
NCDC 28904 -- 0 -- 0 -- -- -- -- -- -- -- -- 0 -- 0 --
NCDC 22193 23 0 -- 1.7 4.9 0.0 0.0 4.36 2.94 1.00 0.171 0.833 6.6 -- 5.5 --
NCDC 29158 49 0 -- 4.7 8.7 0.0 0.0 3.08 1.87 1.00 1.192 0.833 18.2 -- 15.2 --
NCDC 29166 94 0 -- 0.8 2.3 0.0 0.0 3.89 3.06 1.00 -0.622 0.833 3.0 -- 2.5 --
NCDC 29572 2 0 -- 9.2 7.9 6.5 6.0 1.28 0.86 0.86 1.946 0.741 32.1 -- 27.3 --
NCDC 29601 -- 0 -- 0 -- -- -- -- -- -- -- -- 0 -- 0 --
SC 11R06 0 -- 1.6 8.6 5.1 8.3 2.0 0.94 0.59 0.59 1.996 0.550 -- 22.8 -- 20.2
* indicates less than 15 years of data available
SHADED indicates 50-year Snow Load less than 12 PSF (negligible in typical design)
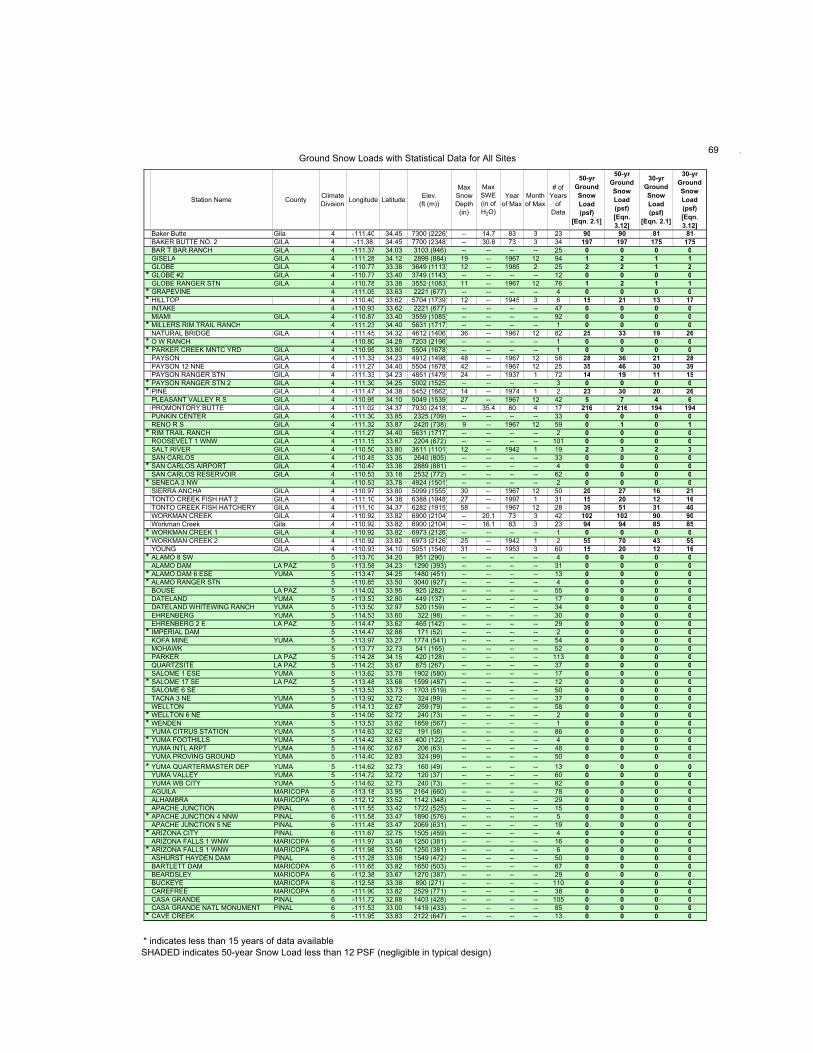
Ground Snow Loads with Statistical Data for All Sites 69 .
Station Name CountyClimate
DivisionLongitude Latitude
Elev.
(ft (m))
Max
Snow
Depth
(in)
Max
SWE
(in of
H2O)
Year
of Max
Month
of Max
# of
Years
of
Data
50-yr
Ground
Snow
Load
(psf)
[Eqn. 2.1]
50-yr
Ground
Snow
Load
(psf)
[Eqn.
3.12]
30-yr
Ground
Snow
Load
(psf)
[Eqn. 2.1]
30-yr
Ground
Snow
Load
(psf)
[Eqn.
3.12]
Baker Butte Gila 4 -111.40 34.45 7300 (2226) -- 14.7 83 3 23 90 90 81 81
BAKER BUTTE NO. 2 GILA 4 -11.38 34.45 7700 (2348) -- 30.8 73 3 34 197 197 175 175
BAR T BAR RANCH GILA 4 -111.37 34.03 3103 (946) -- -- -- -- 25 0 0 0 0
GISELA GILA 4 -111.28 34.12 2899 (884) 19 -- 1967 12 94 1 2 1 1
GLOBE GILA 4 -110.77 33.38 3649 (1113) 12 -- 1985 2 25 2 2 1 2
* GLOBE #2 GILA 4 -110.77 33.40 3749 (1143) -- -- -- -- 12 0 0 0 0
GLOBE RANGER STN GILA 4 -110.78 33.38 3552 (1083) 11 -- 1967 12 76 1 2 1 1
* GRAPEVINE 4 -111.05 33.63 2221 (677) -- -- -- -- 4 0 0 0 0
* HILLTOP 4 -110.40 33.62 5704 (1739) 12 -- 1945 3 6 15 21 13 17
INTAKE 4 -110.93 33.62 2221 (677) -- -- -- -- 47 0 0 0 0
MIAMI GILA 4 -110.87 33.40 3559 (1085) -- -- -- -- 92 0 0 0 0
* MILLERS RIM TRAIL RANCH 4 -111.23 34.40 5631 (1717) -- -- -- -- 1 0 0 0 0
NATURAL BRIDGE GILA 4 -111.45 34.32 4612 (1406) 36 -- 1967 12 82 25 33 19 26
* O W RANCH 4 -110.80 34.28 7203 (2196) -- -- -- -- 1 0 0 0 0
* PARKER CREEK MNTC YRD GILA 4 -110.95 33.80 5504 (1678) -- -- -- -- 1 0 0 0 0
PAYSON GILA 4 -111.33 34.23 4912 (1498) 48 -- 1967 12 58 28 36 21 28
PAYSON 12 NNE GILA 4 -111.27 34.40 5504 (1678) 42 -- 1967 12 25 35 46 30 39
PAYSON RANGER STN GILA 4 -111.33 34.23 4851 (1479) 24 -- 1937 1 72 14 19 11 15
* PAYSON RANGER STN 2 GILA 4 -111.30 34.25 5002 (1525) -- -- -- -- 3 0 0 0 0
* PINE GILA 4 -111.47 34.38 5452 (1662) 14 -- 1974 1 2 23 30 20 26
PLEASANT VALLEY R S GILA 4 -110.95 34.10 5049 (1539) 27 -- 1967 12 42 5 7 4 6
PROMONTORY BUTTE GILA 4 -111.02 34.37 7930 (2418) -- 35.4 80 4 17 216 216 194 194
PUNKIN CENTER GILA 4 -111.30 33.85 2325 (709) -- -- -- -- 33 0 0 0 0
RENO R S GILA 4 -111.32 33.87 2420 (738) 9 -- 1967 12 59 0 1 0 1
* RIM TRAIL RANCH GILA 4 -111.27 34.40 5631 (1717) -- -- -- -- 2 0 0 0 0
ROOSEVELT 1 WNW GILA 4 -111.15 33.67 2204 (672) -- -- -- -- 101 0 0 0 0
SALT RIVER GILA 4 -110.50 33.80 3611 (1101) 12 -- 1942 1 19 2 3 2 3
SAN CARLOS GILA 4 -110.45 33.35 2640 (805) -- -- -- -- 33 0 0 0 0
* SAN CARLOS AIRPORT GILA 4 -110.47 33.38 2889 (881) -- -- -- -- 4 0 0 0 0
SAN CARLOS RESERVOIR GILA 4 -110.53 33.18 2532 (772) -- -- -- -- 62 0 0 0 0
* SENECA 3 NW 4 -110.53 33.78 4924 (1501) -- -- -- -- 2 0 0 0 0
SIERRA ANCHA GILA 4 -110.97 33.80 5099 (1555) 30 -- 1967 12 50 20 27 16 21
TONTO CREEK FISH HAT 2 GILA 4 -111.10 34.38 6388 (1948) 27 -- 1997 1 31 15 20 12 16
TONTO CREEK FISH HATCHERY GILA 4 -111.10 34.37 6282 (1915) 58 -- 1967 12 28 39 51 31 40
WORKMAN CREEK GILA 4 -110.92 33.82 6900 (2104) -- 20.1 73 3 42 102 102 90 90
Workman Creek Gila 4 -110.92 33.82 6900 (2104) -- 16.1 83 3 23 94 94 85 85
* WORKMAN CREEK 1 GILA 4 -110.92 33.82 6973 (2126) -- -- -- -- 1 0 0 0 0
* WORKMAN CREEK 2 GILA 4 -110.92 33.82 6973 (2126) 25 -- 1942 1 2 55 70 43 55
YOUNG GILA 4 -110.93 34.10 5051 (1540) 31 -- 1953 3 60 15 20 12 16
* ALAMO 8 SW 5 -113.70 34.20 951 (290) -- -- -- -- 4 0 0 0 0
ALAMO DAM LA PAZ 5 -113.58 34.23 1290 (393) -- -- -- -- 31 0 0 0 0
* ALAMO DAM 6 ESE YUMA 5 -113.47 34.25 1480 (451) -- -- -- -- 13 0 0 0 0
* ALAMO RANGER STN 5 -110.85 33.50 3040 (927) -- -- -- -- 4 0 0 0 0
BOUSE LA PAZ 5 -114.02 33.95 925 (282) -- -- -- -- 55 0 0 0 0
DATELAND YUMA 5 -113.53 32.80 449 (137) -- -- -- -- 17 0 0 0 0
DATELAND WHITEWING RANCH YUMA 5 -113.50 32.97 520 (159) -- -- -- -- 34 0 0 0 0
EHRENBERG YUMA 5 -114.53 33.60 322 (98) -- -- -- -- 30 0 0 0 0
EHRENBERG 2 E LA PAZ 5 -114.47 33.62 465 (142) -- -- -- -- 29 0 0 0 0
* IMPERIAL DAM 5 -114.47 32.88 171 (52) -- -- -- -- 2 0 0 0 0
KOFA MINE YUMA 5 -113.97 33.27 1774 (541) -- -- -- -- 54 0 0 0 0
MOHAWK 5 -113.77 32.73 541 (165) -- -- -- -- 52 0 0 0 0
PARKER LA PAZ 5 -114.28 34.15 420 (128) -- -- -- -- 113 0 0 0 0
QUARTZSITE LA PAZ 5 -114.23 33.67 875 (267) -- -- -- -- 37 0 0 0 0
SALOME 1 ESE YUMA 5 -113.62 33.78 1902 (580) -- -- -- -- 17 0 0 0 0
* SALOME 17 SE LA PAZ 5 -113.48 33.68 1599 (487) -- -- -- -- 12 0 0 0 0
SALOME 6 SE 5 -113.53 33.73 1703 (519) -- -- -- -- 50 0 0 0 0
TACNA 3 NE YUMA 5 -113.92 32.72 324 (99) -- -- -- -- 37 0 0 0 0
WELLTON YUMA 5 -114.13 32.67 259 (79) -- -- -- -- 58 0 0 0 0
* WELLTON 6 NE 5 -114.05 32.72 240 (73) -- -- -- -- 2 0 0 0 0
* WENDEN YUMA 5 -113.53 33.82 1859 (567) -- -- -- -- 1 0 0 0 0
YUMA CITRUS STATION YUMA 5 -114.63 32.62 191 (58) -- -- -- -- 86 0 0 0 0
* YUMA FOOTHILLS YUMA 5 -114.42 32.63 400 (122) -- -- -- -- 4 0 0 0 0
YUMA INTL ARPT YUMA 5 -114.60 32.67 206 (63) -- -- -- -- 48 0 0 0 0
YUMA PROVING GROUND YUMA 5 -114.40 32.83 324 (99) -- -- -- -- 50 0 0 0 0
* YUMA QUARTERMASTER DEP YUMA 5 -114.62 32.73 160 (49) -- -- -- -- 13 0 0 0 0
YUMA VALLEY YUMA 5 -114.72 32.72 120 (37) -- -- -- -- 60 0 0 0 0
YUMA WB CITY YUMA 5 -114.62 32.73 240 (73) -- -- -- -- 82 0 0 0 0
AGUILA MARICOPA 6 -113.18 33.95 2164 (660) -- -- -- -- 78 0 0 0 0
ALHAMBRA MARICOPA 6 -112.12 33.52 1142 (348) -- -- -- -- 29 0 0 0 0
APACHE JUNCTION PINAL 6 -111.55 33.42 1722 (525) -- -- -- -- 15 0 0 0 0
* APACHE JUNCTION 4 NNW PINAL 6 -111.58 33.47 1890 (576) -- -- -- -- 5 0 0 0 0
APACHE JUNCTION 5 NE PINAL 6 -111.48 33.47 2069 (631) -- -- -- -- 19 0 0 0 0
* ARIZONA CITY PINAL 6 -111.67 32.75 1505 (459) -- -- -- -- 4 0 0 0 0
ARIZONA FALLS 1 WNW MARICOPA 6 -111.97 33.48 1250 (381) -- -- -- -- 16 0 0 0 0
* ARIZONA FALLS 1 WNW MARICOPA 6 -111.98 33.50 1250 (381) -- -- -- -- 6 0 0 0 0
ASHURST HAYDEN DAM PINAL 6 -111.28 33.08 1549 (472) -- -- -- -- 50 0 0 0 0
BARTLETT DAM MARICOPA 6 -111.65 33.82 1650 (503) -- -- -- -- 67 0 0 0 0
BEARDSLEY MARICOPA 6 -112.38 33.67 1270 (387) -- -- -- -- 29 0 0 0 0
BUCKEYE MARICOPA 6 -112.58 33.38 890 (271) -- -- -- -- 110 0 0 0 0
CAREFREE MARICOPA 6 -111.90 33.82 2529 (771) -- -- -- -- 38 0 0 0 0
CASA GRANDE PINAL 6 -111.72 32.88 1403 (428) -- -- -- -- 105 0 0 0 0
CASA GRANDE NATL MONUMENT PINAL 6 -111.53 33.00 1419 (433) -- -- -- -- 85 0 0 0 0
* CAVE CREEK 6 -111.95 33.83 2122 (647) -- -- -- -- 13 0 0 0 0
* indicates less than 15 years of data available
SHADED indicates 50-year Snow Load less than 12 PSF (negligible in typical design)
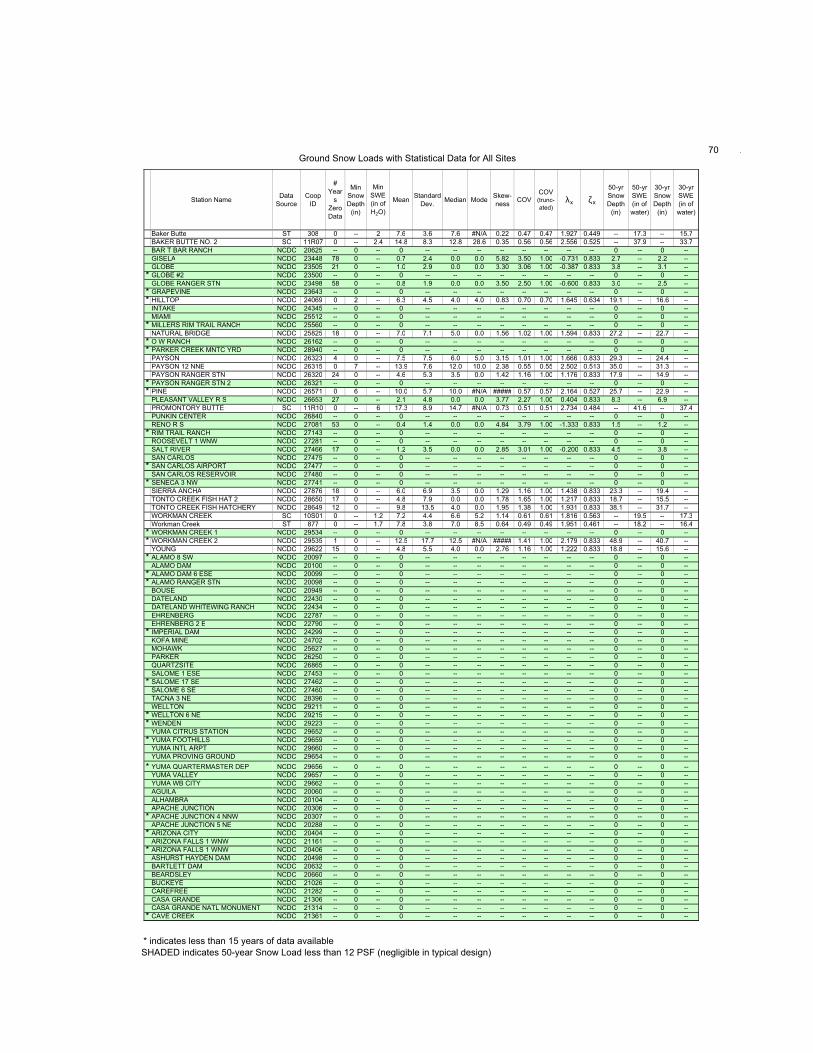
Ground Snow Loads with Statistical Data for All Sites 70 .
Station Name
Baker Butte
BAKER BUTTE NO. 2
BAR T BAR RANCH
GISELA
GLOBE
* GLOBE #2
GLOBE RANGER STN
* GRAPEVINE
* HILLTOP
INTAKE
MIAMI
* MILLERS RIM TRAIL RANCH
NATURAL BRIDGE
* O W RANCH
* PARKER CREEK MNTC YRD
PAYSON
PAYSON 12 NNE
PAYSON RANGER STN
* PAYSON RANGER STN 2
* PINE
PLEASANT VALLEY R S
PROMONTORY BUTTE
PUNKIN CENTER
RENO R S
* RIM TRAIL RANCH
ROOSEVELT 1 WNW
SALT RIVER
SAN CARLOS
* SAN CARLOS AIRPORT
SAN CARLOS RESERVOIR
* SENECA 3 NW
SIERRA ANCHA
TONTO CREEK FISH HAT 2
TONTO CREEK FISH HATCHERY
WORKMAN CREEK
Workman Creek
* WORKMAN CREEK 1
* WORKMAN CREEK 2
YOUNG
* ALAMO 8 SW
ALAMO DAM
* ALAMO DAM 6 ESE
* ALAMO RANGER STN
BOUSE
DATELAND
DATELAND WHITEWING RANCH
EHRENBERG
EHRENBERG 2 E
* IMPERIAL DAM
KOFA MINE
MOHAWK
PARKER
QUARTZSITE
SALOME 1 ESE
* SALOME 17 SE
SALOME 6 SE
TACNA 3 NE
WELLTON
* WELLTON 6 NE
* WENDEN
YUMA CITRUS STATION
* YUMA FOOTHILLS
YUMA INTL ARPT
YUMA PROVING GROUND
* YUMA QUARTERMASTER DEP
YUMA VALLEY
YUMA WB CITY
AGUILA
ALHAMBRA
APACHE JUNCTION
* APACHE JUNCTION 4 NNW
APACHE JUNCTION 5 NE
* ARIZONA CITY
ARIZONA FALLS 1 WNW
* ARIZONA FALLS 1 WNW
ASHURST HAYDEN DAM
BARTLETT DAM
BEARDSLEY
BUCKEYE
CAREFREE
CASA GRANDE
CASA GRANDE NATL MONUMENT
* CAVE CREEK
Data
Source
Coop
ID
#
Year
s
Zero
Data
Min
Snow
Depth
(in)
Min
SWE
(in of
H2O)
MeanStandard
Dev.Median Mode
Skew-
nessCOV
COV (trunc-
ated)λx ζx
50-yr
Snow
Depth
(in)
50-yr
SWE
(in of
water)
30-yr
Snow
Depth
(in)
30-yr
SWE
(in of
water)
ST 308 0 -- 2 7.6 3.6 7.6 #N/A 0.22 0.47 0.47 1.927 0.449 -- 17.3 -- 15.7
SC 11R07 0 -- 2.4 14.8 8.3 12.8 28.6 0.35 0.56 0.56 2.556 0.525 -- 37.9 -- 33.7
NCDC 20625 -- 0 -- 0 -- -- -- -- -- -- -- -- 0 -- 0 --
NCDC 23448 78 0 -- 0.7 2.4 0.0 0.0 5.82 3.50 1.00 -0.731 0.833 2.7 -- 2.2 --
NCDC 23505 21 0 -- 1.0 2.9 0.0 0.0 3.30 3.06 1.00 -0.387 0.833 3.8 -- 3.1 --
NCDC 23500 -- 0 -- 0 -- -- -- -- -- -- -- -- 0 -- 0 --
NCDC 23498 58 0 -- 0.8 1.9 0.0 0.0 3.50 2.50 1.00 -0.600 0.833 3.0 -- 2.5 --
NCDC 23643 -- 0 -- 0 -- -- -- -- -- -- -- -- 0 -- 0 --
NCDC 24069 0 2 -- 6.3 4.5 4.0 4.0 0.83 0.70 0.70 1.645 0.634 19.1 -- 16.6 --
NCDC 24345 -- 0 -- 0 -- -- -- -- -- -- -- -- 0 -- 0 --
NCDC 25512 -- 0 -- 0 -- -- -- -- -- -- -- -- 0 -- 0 --
NCDC 25560 -- 0 -- 0 -- -- -- -- -- -- -- -- 0 -- 0 --
NCDC 25825 18 0 -- 7.0 7.1 5.0 0.0 1.56 1.02 1.00 1.594 0.833 27.2 -- 22.7 --
NCDC 26162 -- 0 -- 0 -- -- -- -- -- -- -- -- 0 -- 0 --
NCDC 28940 -- 0 -- 0 -- -- -- -- -- -- -- -- 0 -- 0 --
NCDC 26323 4 0 -- 7.5 7.5 6.0 5.0 3.15 1.01 1.00 1.666 0.833 29.3 -- 24.4 --
NCDC 26315 0 7 -- 13.9 7.6 12.0 10.0 2.38 0.55 0.55 2.502 0.513 35.0 -- 31.3 --
NCDC 26320 24 0 -- 4.6 5.3 3.5 0.0 1.42 1.16 1.00 1.176 0.833 17.9 -- 14.9 --
NCDC 26321 -- 0 -- 0 -- -- -- -- -- -- -- -- 0 -- 0 --
NCDC 26571 0 6 -- 10.0 5.7 10.0 #N/A ##### 0.57 0.57 2.164 0.527 25.7 -- 22.9 --
NCDC 26653 27 0 -- 2.1 4.8 0.0 0.0 3.77 2.27 1.00 0.404 0.833 8.3 -- 6.9 --
SC 11R10 0 -- 6 17.3 8.9 14.7 #N/A 0.73 0.51 0.51 2.734 0.484 -- 41.6 -- 37.4
NCDC 26840 -- 0 -- 0 -- -- -- -- -- -- -- -- 0 -- 0 --
NCDC 27081 53 0 -- 0.4 1.4 0.0 0.0 4.84 3.79 1.00 -1.333 0.833 1.5 -- 1.2 --
NCDC 27143 -- 0 -- 0 -- -- -- -- -- -- -- -- 0 -- 0 --
NCDC 27281 -- 0 -- 0 -- -- -- -- -- -- -- -- 0 -- 0 --
NCDC 27466 17 0 -- 1.2 3.5 0.0 0.0 2.85 3.01 1.00 -0.200 0.833 4.5 -- 3.8 --
NCDC 27475 -- 0 -- 0 -- -- -- -- -- -- -- -- 0 -- 0 --
NCDC 27477 -- 0 -- 0 -- -- -- -- -- -- -- -- 0 -- 0 --
NCDC 27480 -- 0 -- 0 -- -- -- -- -- -- -- -- 0 -- 0 --
NCDC 27741 -- 0 -- 0 -- -- -- -- -- -- -- -- 0 -- 0 --
NCDC 27876 18 0 -- 6.0 6.9 3.5 0.0 1.29 1.16 1.00 1.438 0.833 23.3 -- 19.4 --
NCDC 28650 17 0 -- 4.8 7.9 0.0 0.0 1.78 1.65 1.00 1.217 0.833 18.7 -- 15.5 --
NCDC 28649 12 0 -- 9.8 13.5 4.0 0.0 1.95 1.38 1.00 1.931 0.833 38.1 -- 31.7 --
SC 10S01 0 -- 1.2 7.2 4.4 6.6 5.2 1.14 0.61 0.61 1.816 0.563 -- 19.5 -- 17.3
ST 877 0 -- 1.7 7.8 3.8 7.0 8.5 0.64 0.49 0.49 1.951 0.461 -- 18.2 -- 16.4
NCDC 29534 -- 0 -- 0 -- -- -- -- -- -- -- -- 0 -- 0 --
NCDC 29535 1 0 -- 12.5 17.7 12.5 #N/A ##### 1.41 1.00 2.179 0.833 48.9 -- 40.7 --
NCDC 29622 15 0 -- 4.8 5.5 4.0 0.0 2.76 1.16 1.00 1.222 0.833 18.8 -- 15.6 --
NCDC 20097 -- 0 -- 0 -- -- -- -- -- -- -- -- 0 -- 0 --
NCDC 20100 -- 0 -- 0 -- -- -- -- -- -- -- -- 0 -- 0 --
NCDC 20099 -- 0 -- 0 -- -- -- -- -- -- -- -- 0 -- 0 --
NCDC 20098 -- 0 -- 0 -- -- -- -- -- -- -- -- 0 -- 0 --
NCDC 20949 -- 0 -- 0 -- -- -- -- -- -- -- -- 0 -- 0 --
NCDC 22430 -- 0 -- 0 -- -- -- -- -- -- -- -- 0 -- 0 --
NCDC 22434 -- 0 -- 0 -- -- -- -- -- -- -- -- 0 -- 0 --
NCDC 22787 -- 0 -- 0 -- -- -- -- -- -- -- -- 0 -- 0 --
NCDC 22790 -- 0 -- 0 -- -- -- -- -- -- -- -- 0 -- 0 --
NCDC 24299 -- 0 -- 0 -- -- -- -- -- -- -- -- 0 -- 0 --
NCDC 24702 -- 0 -- 0 -- -- -- -- -- -- -- -- 0 -- 0 --
NCDC 25627 -- 0 -- 0 -- -- -- -- -- -- -- -- 0 -- 0 --
NCDC 26250 -- 0 -- 0 -- -- -- -- -- -- -- -- 0 -- 0 --
NCDC 26865 -- 0 -- 0 -- -- -- -- -- -- -- -- 0 -- 0 --
NCDC 27453 -- 0 -- 0 -- -- -- -- -- -- -- -- 0 -- 0 --
NCDC 27462 -- 0 -- 0 -- -- -- -- -- -- -- -- 0 -- 0 --
NCDC 27460 -- 0 -- 0 -- -- -- -- -- -- -- -- 0 -- 0 --
NCDC 28396 -- 0 -- 0 -- -- -- -- -- -- -- -- 0 -- 0 --
NCDC 29211 -- 0 -- 0 -- -- -- -- -- -- -- -- 0 -- 0 --
NCDC 29215 -- 0 -- 0 -- -- -- -- -- -- -- -- 0 -- 0 --
NCDC 29223 -- 0 -- 0 -- -- -- -- -- -- -- -- 0 -- 0 --
NCDC 29652 -- 0 -- 0 -- -- -- -- -- -- -- -- 0 -- 0 --
NCDC 29659 -- 0 -- 0 -- -- -- -- -- -- -- -- 0 -- 0 --
NCDC 29660 -- 0 -- 0 -- -- -- -- -- -- -- -- 0 -- 0 --
NCDC 29654 -- 0 -- 0 -- -- -- -- -- -- -- -- 0 -- 0 --
NCDC 29656 -- 0 -- 0 -- -- -- -- -- -- -- -- 0 -- 0 --
NCDC 29657 -- 0 -- 0 -- -- -- -- -- -- -- -- 0 -- 0 --
NCDC 29662 -- 0 -- 0 -- -- -- -- -- -- -- -- 0 -- 0 --
NCDC 20060 -- 0 -- 0 -- -- -- -- -- -- -- -- 0 -- 0 --
NCDC 20104 -- 0 -- 0 -- -- -- -- -- -- -- -- 0 -- 0 --
NCDC 20306 -- 0 -- 0 -- -- -- -- -- -- -- -- 0 -- 0 --
NCDC 20307 -- 0 -- 0 -- -- -- -- -- -- -- -- 0 -- 0 --
NCDC 20288 -- 0 -- 0 -- -- -- -- -- -- -- -- 0 -- 0 --
NCDC 20404 -- 0 -- 0 -- -- -- -- -- -- -- -- 0 -- 0 --
NCDC 21161 -- 0 -- 0 -- -- -- -- -- -- -- -- 0 -- 0 --
NCDC 20406 -- 0 -- 0 -- -- -- -- -- -- -- -- 0 -- 0 --
NCDC 20498 -- 0 -- 0 -- -- -- -- -- -- -- -- 0 -- 0 --
NCDC 20632 -- 0 -- 0 -- -- -- -- -- -- -- -- 0 -- 0 --
NCDC 20660 -- 0 -- 0 -- -- -- -- -- -- -- -- 0 -- 0 --
NCDC 21026 -- 0 -- 0 -- -- -- -- -- -- -- -- 0 -- 0 --
NCDC 21282 -- 0 -- 0 -- -- -- -- -- -- -- -- 0 -- 0 --
NCDC 21306 -- 0 -- 0 -- -- -- -- -- -- -- -- 0 -- 0 --
NCDC 21314 -- 0 -- 0 -- -- -- -- -- -- -- -- 0 -- 0 --
NCDC 21361 -- 0 -- 0 -- -- -- -- -- -- -- -- 0 -- 0 --
* indicates less than 15 years of data available
SHADED indicates 50-year Snow Load less than 12 PSF (negligible in typical design)

Ground Snow Loads with Statistical Data for All Sites 71 .
Station Name CountyClimate
DivisionLongitude Latitude
Elev.
(ft (m))
Max
Snow
Depth
(in)
Max
SWE
(in of
H2O)
Year
of Max
Month
of Max
# of
Years
of
Data
50-yr
Ground
Snow
Load
(psf)
[Eqn. 2.1]
50-yr
Ground
Snow
Load
(psf)
[Eqn.
3.12]
30-yr
Ground
Snow
Load
(psf)
[Eqn. 2.1]
30-yr
Ground
Snow
Load
(psf)
[Eqn.
3.12]
* CAVE CREEK 3 ESE MARICOPA 6 -111.90 33.82 2529 (771) -- -- -- -- 2 0 0 0 0
CAVE CREEK DAM MARICOPA 6 -112.05 33.72 1670 (509) -- -- -- -- 21 0 0 0 0
CHANDLER MARICOPA 6 -111.83 33.30 1220 (372) -- -- -- -- 33 0 0 0 0
CHANDLER HEIGHTS MARICOPA 6 -111.68 33.20 1425 (434) -- -- -- -- 58 0 0 0 0
DEER VALLEY MARICOPA 6 -112.08 33.58 1257 (383) -- -- -- -- 36 0 0 0 0
* EAST MESA MARICOPA 6 -111.65 33.42 1518 (463) -- -- -- -- 4 0 0 0 0
* EL MIRAGE 6 -112.32 33.63 1142 (348) -- -- -- -- 1 0 0 0 0
ELOY 4 NE PINAL 6 -111.52 32.78 1545 (471) -- -- -- -- 55 0 0 0 0
FALCON FIELD MARICOPA 6 -111.75 33.43 1322 (403) -- -- -- -- 29 0 0 0 0
FLORENCE PINAL 6 -111.38 33.03 1400 (427) -- -- -- -- 100 0 0 0 0
FOUNTAIN HILLS MARICOPA 6 -111.72 33.60 1580 (482) -- -- -- -- 27 0 0 0 0
GILA BEND MARICOPA 6 -112.72 32.95 735 (224) -- -- -- -- 111 0 0 0 0
GILA BEND AIRPORT 6 -112.72 32.88 853 (260) -- -- -- -- 23 0 0 0 0
GOULDS RANCH MARICOPA 6 -112.07 33.38 1201 (366) -- -- -- -- 46 0 0 0 0
GRANITE REEF DAM MARICOPA 6 -111.70 33.52 1322 (403) -- -- -- -- 173 0 0 0 0
GRIGGS 3 W MARICOPA 6 -112.48 33.50 1160 (354) -- -- -- -- 41 0 0 0 0
HARQUAHALA PLAINS 6 -113.17 33.53 1220 (372) -- -- -- -- 28 0 0 0 0
HORSESHOE DAM MARICOPA 6 -111.72 33.98 2019 (616) -- -- -- -- 58 0 0 0 0
KEARNY PINAL 6 -110.90 33.05 1830 (558) -- -- -- -- 22 0 0 0 0
KELVIN PINAL 6 -110.97 33.10 1850 (564) -- -- -- -- 37 0 0 0 0
LAKE PLEASANT MARICOPA 6 -112.27 33.83 1536 (468) -- -- -- -- 19 0 0 0 0
* LAKE PLEASANT MARICOPA 6 -112.27 33.85 1601 (488) -- -- -- -- 10 0 0 0 0
LAVEEN 3 SSE MARICOPA 6 -112.15 33.33 1135 (346) -- -- -- -- 58 0 0 0 0
LITCHFIELD PARK MARICOPA 6 -112.37 33.50 1030 (314) -- -- -- -- 86 0 0 0 0
MARICOPA 4 N PINAL 6 -112.03 33.12 1160 (354) -- -- -- -- 46 0 0 0 0
MARICOPA 9 SSW 6 -112.10 32.92 1401 (427) -- -- -- -- 58 0 0 0 0
MARINETTE MARICOPA 6 -112.30 33.63 1152 (351) -- -- -- -- 48 0 0 0 0
MESA MARICOPA 6 -111.82 33.42 1235 (376) -- -- -- -- 108 0 0 0 0
* MONTEZUMA MARICOPA 6 -113.38 33.10 741 (226) -- -- -- -- 5 0 0 0 0
MORMON FLAT MARICOPA 6 -111.45 33.55 1705 (520) -- -- -- -- 83 0 0 0 0
MUMMY MOUNTAIN MARICOPA 6 -111.97 33.55 1421 (433) -- -- -- -- 16 0 0 0 0
ORACLE 6 -110.78 32.60 4602 (1403) 16 -- 1937 1 54 7 10 6 8
ORACLE 2 SE PINAL 6 -110.73 32.60 4509 (1375) 12 -- 1967 12 56 2 3 2 3
* PAINTED ROCK DAM MARICOPA 6 -113.03 33.08 568 (173) -- -- -- -- 6 0 0 0 0
* PARADISE VALLEY NO 2 MARICOPA 6 -111.95 33.55 1421 (433) -- -- -- -- 5 0 0 0 0
* PARADISE VALLEY NO 2 MARICOPA 6 -111.97 33.57 1381 (421) -- -- -- -- 4 0 0 0 0
PHOENIX CITY MARICOPA 6 -112.08 33.45 1098 (335) -- -- -- -- 48 0 0 0 0
PHOENIX INDIAN SCHOOL MARICOPA 6 -112.07 33.50 1122 (342) -- -- -- -- 30 0 0 0 0
PHOENIX SKY HARBOR INTL AP MARICOPA 6 -112.00 33.43 1107 (337) -- -- -- -- 59 0 0 0 0
* PHOENIX SOUTH MOUNTAIN MARICOPA 6 -112.05 33.33 2645 (807) -- -- -- -- 9 0 0 0 0
PICACHO 8 SE PINAL 6 -111.40 32.65 1830 (558) -- -- -- -- 19 0 0 0 0
PICACHO RESERVOIR PINAL 6 -111.47 32.87 1512 (461) -- -- -- -- 28 0 0 0 0
PINAL RANCH PINAL 6 -110.98 33.35 4523 (1379) 25 -- 1967 12 78 16 21 12 17
* PINNACLE PEAK MARICOPA 6 -111.87 33.73 2564 (782) -- -- -- -- 4 0 0 0 0
RED ROCK 6 SSW PINAL 6 -111.33 32.48 1879 (573) -- -- -- -- 53 0 0 0 0
SACATON PINAL 6 -111.75 33.08 1285 (392) -- -- -- -- 96 0 0 0 0
SAN MANUEL PINAL 6 -110.63 32.60 3459 (1055) 9 -- 1958 11 52 1 2 1 2
SCOTTSDALE MARICOPA 6 -111.88 33.47 1201 (366) -- -- -- -- 18 0 0 0 0
SENTINEL 6 -113.22 32.87 689 (210) -- -- -- -- 31 0 0 0 0
* SLATE MOUNTAIN PINAL 6 -111.88 32.52 1932 (589) -- -- -- -- 4 0 0 0 0
SOUTH PHOENIX MARICOPA 6 -112.07 33.38 1155 (352) -- -- -- -- 45 0 0 0 0
* STANFIELD 6 -111.97 32.88 1312 (400) -- -- -- -- 2 0 0 0 0
STEWART MOUNTAIN MARICOPA 6 -111.53 33.55 1422 (433) -- -- -- -- 58 0 0 0 0
* SUNDAD 6 -113.23 33.18 1010 (308) -- -- -- -- 2 0 0 0 0
SUNFLOWER 3 NNW MARICOPA 6 -111.48 33.92 3719 (1134) -- -- -- -- 41 0 0 0 0
SUPERIOR PINAL 6 -111.10 33.30 2859 (872) -- -- -- -- 86 0 0 0 0
SUPERIOR 2 ENE PINAL 6 -111.07 33.30 4154 (1266) 7 -- 1985 12 23 1 1 0 1
* SUPERIOR SMELTER 6 -111.10 33.30 2791 (851) -- -- -- -- 5 0 0 0 0
SUPERSTITION MOUNTAIN 6 -111.43 33.37 1961 (598) -- -- -- -- 15 0 0 0 0
TEMPE MARICOPA 6 -111.93 33.43 1152 (351) -- -- -- -- 59 0 0 0 0
TEMPE 3 S 6 -111.93 33.38 1181 (360) -- -- -- -- 48 0 0 0 0
TEMPE ASU MARICOPA 6 -111.93 33.42 1170 (357) -- -- -- -- 53 0 0 0 0
* THORNBURG RANCHES 6 -112.40 33.57 1099 (335) -- -- -- -- 9 0 0 0 0
TOLLESON 1 E MARICOPA 6 -112.25 33.45 1025 (312) -- -- -- -- 55 0 0 0 0
TONOPAH 5N MARICOPA 6 -112.88 33.50 1150 (351) -- -- -- -- 31 0 0 0 0
* TONTO HILLS MARICOPA 6 -111.83 33.88 3680 (1122) -- -- -- -- 2 0 0 0 0
* VALLEY CITRUS FARM MARICOPA 6 -111.97 33.38 1181 (360) -- -- -- -- 5 0 0 0 0
* WADDELL 3 SSE 6 -112.40 33.57 1099 (335) -- -- -- -- 2 0 0 0 0
WILLOW SPRINGS RANCH PINAL 6 -110.87 32.72 3690 (1125) -- -- -- -- 30 0 0 0 0
WINKELMAN 6 S PINAL 6 -110.72 32.92 2080 (634) -- -- -- -- 38 0 0 0 0
* WINKLEMAN 12 SE PINAL 6 -110.60 32.87 2589 (789) -- -- -- -- 11 0 0 0 0
WITTMANN 4SW MARICOPA 6 -112.60 33.75 1670 (509) -- -- -- -- 47 0 0 0 0
YOUNGTOWN MARICOPA 6 -112.30 33.60 1135 (346) -- -- -- -- 42 0 0 0 0
AJO PIMA 7 -112.87 32.37 1799 (549) -- -- -- -- 92 0 0 0 0
AJO WELL PIMA 7 -112.83 32.45 1430 (436) -- -- -- -- 28 0 0 0 0
* ALPINE 18 SW GREENLEE 7 -109.33 33.63 9158 (2792) 84 -- 1987 3 4 209 251 171 207
ALPINE 8 SSE GREENLEE 7 -109.12 33.73 6728 (2051) 19 -- 1999 4 17 20 26 17 23
AMADO SANTA CRUZ 7 -111.05 31.72 3050 (930) -- -- -- -- 28 0 0 0 0
ANVIL RANCH PIMA 7 -111.38 31.98 2749 (838) -- -- -- -- 58 0 0 0 0
APACHE 6 WNW COCHISE 7 -109.23 31.72 5382 (1641) -- -- -- -- 17 0 0 0 0
APACHE POWDER COMPANY COCHISE 7 -110.25 31.90 3688 (1124) -- -- -- -- 68 0 0 0 0
* ARAVAIPA RANGER STN 7 -110.27 32.78 3670 (1119) -- -- -- -- 2 0 0 0 0
ARIVACA PIMA 7 -111.33 31.57 3619 (1103) -- -- -- -- 51 0 0 0 0
* indicates less than 15 years of data available
SHADED indicates 50-year Snow Load less than 12 PSF (negligible in typical design)

Ground Snow Loads with Statistical Data for All Sites 72 .
Station Name
* CAVE CREEK 3 ESE
CAVE CREEK DAM
CHANDLER
CHANDLER HEIGHTS
DEER VALLEY
* EAST MESA
* EL MIRAGE
ELOY 4 NE
FALCON FIELD
FLORENCE
FOUNTAIN HILLS
GILA BEND
GILA BEND AIRPORT
GOULDS RANCH
GRANITE REEF DAM
GRIGGS 3 W
HARQUAHALA PLAINS
HORSESHOE DAM
KEARNY
KELVIN
LAKE PLEASANT
* LAKE PLEASANT
LAVEEN 3 SSE
LITCHFIELD PARK
MARICOPA 4 N
MARICOPA 9 SSW
MARINETTE
MESA
* MONTEZUMA
MORMON FLAT
MUMMY MOUNTAIN
ORACLE
ORACLE 2 SE
* PAINTED ROCK DAM
* PARADISE VALLEY NO 2
* PARADISE VALLEY NO 2
PHOENIX CITY
PHOENIX INDIAN SCHOOL
PHOENIX SKY HARBOR INTL AP
* PHOENIX SOUTH MOUNTAIN
PICACHO 8 SE
PICACHO RESERVOIR
PINAL RANCH
* PINNACLE PEAK
RED ROCK 6 SSW
SACATON
SAN MANUEL
SCOTTSDALE
SENTINEL
* SLATE MOUNTAIN
SOUTH PHOENIX
* STANFIELD
STEWART MOUNTAIN
* SUNDAD
SUNFLOWER 3 NNW
SUPERIOR
SUPERIOR 2 ENE
* SUPERIOR SMELTER
SUPERSTITION MOUNTAIN
TEMPE
TEMPE 3 S
TEMPE ASU
* THORNBURG RANCHES
TOLLESON 1 E
TONOPAH 5N
* TONTO HILLS
* VALLEY CITRUS FARM
* WADDELL 3 SSE
WILLOW SPRINGS RANCH
WINKELMAN 6 S
* WINKLEMAN 12 SE
WITTMANN 4SW
YOUNGTOWN
AJO
AJO WELL
* ALPINE 18 SW
ALPINE 8 SSE
AMADO
ANVIL RANCH
APACHE 6 WNW
APACHE POWDER COMPANY
* ARAVAIPA RANGER STN
ARIVACA
Data
Source
Coop
ID
#
Year
s
Zero
Data
Min
Snow
Depth
(in)
Min
SWE
(in of
H2O)
MeanStandard
Dev.Median Mode
Skew-
nessCOV
COV (trunc-
ated)λx ζx
50-yr
Snow
Depth
(in)
50-yr
SWE
(in of
water)
30-yr
Snow
Depth
(in)
30-yr
SWE
(in of
water)
NCDC 21363 -- 0 -- 0 -- -- -- -- -- -- -- -- 0 -- 0 --
NCDC 21365 -- 0 -- 0 -- -- -- -- -- -- -- -- 0 -- 0 --
NCDC 21511 -- 0 -- 0 -- -- -- -- -- -- -- -- 0 -- 0 --
NCDC 21514 -- 0 -- 0 -- -- -- -- -- -- -- -- 0 -- 0 --
NCDC 22462 -- 0 -- 0 -- -- -- -- -- -- -- -- 0 -- 0 --
NCDC 22782 -- 0 -- 0 -- -- -- -- -- -- -- -- 0 -- 0 --
NCDC 22804 -- 0 -- 0 -- -- -- -- -- -- -- -- 0 -- 0 --
NCDC 22807 -- 0 -- 0 -- -- -- -- -- -- -- -- 0 -- 0 --
NCDC 22927 -- 0 -- 0 -- -- -- -- -- -- -- -- 0 -- 0 --
NCDC 23027 -- 0 -- 0 -- -- -- -- -- -- -- -- 0 -- 0 --
NCDC 23190 -- 0 -- 0 -- -- -- -- -- -- -- -- 0 -- 0 --
NCDC 23393 -- 0 -- 0 -- -- -- -- -- -- -- -- 0 -- 0 --
NCDC 23398 -- 0 -- 0 -- -- -- -- -- -- -- -- 0 -- 0 --
NCDC 23573 -- 0 -- 0 -- -- -- -- -- -- -- -- 0 -- 0 --
NCDC 23621 -- 0 -- 0 -- -- -- -- -- -- -- -- 0 -- 0 --
NCDC 23702 -- 0 -- 0 -- -- -- -- -- -- -- -- 0 -- 0 --
NCDC 23852 -- 0 -- 0 -- -- -- -- -- -- -- -- 0 -- 0 --
NCDC 24182 -- 0 -- 0 -- -- -- -- -- -- -- -- 0 -- 0 --
NCDC 24590 -- 0 -- 0 -- -- -- -- -- -- -- -- 0 -- 0 --
NCDC 24594 -- 0 -- 0 -- -- -- -- -- -- -- -- 0 -- 0 --
NCDC 24770 -- 0 -- 0 -- -- -- -- -- -- -- -- 0 -- 0 --
NCDC 21295 -- 0 -- 0 -- -- -- -- -- -- -- -- 0 -- 0 --
NCDC 24829 -- 0 -- 0 -- -- -- -- -- -- -- -- 0 -- 0 --
NCDC 24977 -- 0 -- 0 -- -- -- -- -- -- -- -- 0 -- 0 --
NCDC 25270 -- 0 -- 0 -- -- -- -- -- -- -- -- 0 -- 0 --
NCDC 25274 -- 0 -- 0 -- -- -- -- -- -- -- -- 0 -- 0 --
NCDC 25282 -- 0 -- 0 -- -- -- -- -- -- -- -- 0 -- 0 --
NCDC 25467 -- 0 -- 0 -- -- -- -- -- -- -- -- 0 -- 0 --
NCDC 25633 -- 0 -- 0 -- -- -- -- -- -- -- -- 0 -- 0 --
NCDC 25700 -- 0 -- 0 -- -- -- -- -- -- -- -- 0 -- 0 --
NCDC 26244 -- 0 -- 0 -- -- -- -- -- -- -- -- 0 -- 0 --
NCDC 26116 25 0 -- 2.8 3.8 1.0 0.0 1.54 1.35 1.00 0.675 0.833 10.9 -- 9.0 --
NCDC 26119 40 0 -- 1.2 2.5 0.0 0.0 2.59 2.09 1.00 -0.167 0.833 4.7 -- 3.9 --
NCDC 26194 -- 0 -- 0 -- -- -- -- -- -- -- -- 0 -- 0 --
NCDC 25765 -- 0 -- 0 -- -- -- -- -- -- -- -- 0 -- 0 --
NCDC 26246 -- 0 -- 0 -- -- -- -- -- -- -- -- 0 -- 0 --
NCDC 26486 -- 0 -- 0 -- -- -- -- -- -- -- -- 0 -- 0 --
NCDC 26476 -- 0 -- 0 -- -- -- -- -- -- -- -- 0 -- 0 --
NCDC 26481 -- 0 -- 0 -- -- -- -- -- -- -- -- 0 -- 0 --
NCDC 26479 -- 0 -- 0 -- -- -- -- -- -- -- -- 0 -- 0 --
NCDC 26513 -- 0 -- 0 -- -- -- -- -- -- -- -- 0 -- 0 --
NCDC 26506 -- 0 -- 0 -- -- -- -- -- -- -- -- 0 -- 0 --
NCDC 26561 18 0 -- 5.2 4.9 5.0 0.0 1.61 0.95 0.95 1.326 0.799 19.4 -- 16.3 --
NCDC 26603 -- 0 -- 0 -- -- -- -- -- -- -- -- 0 -- 0 --
NCDC 27058 -- 0 -- 0 -- -- -- -- -- -- -- -- 0 -- 0 --
NCDC 27370 -- 0 -- 0 -- -- -- -- -- -- -- -- 0 -- 0 --
NCDC 27530 36 0 -- 0.8 1.9 0.0 0.0 3.02 2.24 1.00 -0.537 0.833 3.2 -- 2.7 --
NCDC 27661 -- 0 -- 0 -- -- -- -- -- -- -- -- 0 -- 0 --
NCDC 27751 -- 0 -- 0 -- -- -- -- -- -- -- -- 0 -- 0 --
NCDC 27984 -- 0 -- 0 -- -- -- -- -- -- -- -- 0 -- 0 --
NCDC 28112 -- 0 -- 0 -- -- -- -- -- -- -- -- 0 -- 0 --
NCDC 28177 -- 0 -- 0 -- -- -- -- -- -- -- -- 0 -- 0 --
NCDC 28214 -- 0 -- 0 -- -- -- -- -- -- -- -- 0 -- 0 --
NCDC 28268 -- 0 -- 0 -- -- -- -- -- -- -- -- 0 -- 0 --
NCDC 28273 -- 0 -- 0 -- -- -- -- -- -- -- -- 0 -- 0 --
NCDC 28348 -- 0 -- 0 -- -- -- -- -- -- -- -- 0 -- 0 --
NCDC 28349 21 0 -- 0.4 1.6 0.0 0.0 3.90 3.59 1.00 -1.179 0.833 1.7 -- 1.4 --
NCDC 28351 -- 0 -- 0 -- -- -- -- -- -- -- -- 0 -- 0 --
NCDC 28356 -- 0 -- 0 -- -- -- -- -- -- -- -- 0 -- 0 --
NCDC 28489 -- 0 -- 0 -- -- -- -- -- -- -- -- 0 -- 0 --
NCDC 28494 -- 0 -- 0 -- -- -- -- -- -- -- -- 0 -- 0 --
NCDC 28499 -- 0 -- 0 -- -- -- -- -- -- -- -- 0 -- 0 --
NCDC 28566 -- 0 -- 0 -- -- -- -- -- -- -- -- 0 -- 0 --
NCDC 28598 -- 0 -- 0 -- -- -- -- -- -- -- -- 0 -- 0 --
NCDC 28641 -- 0 -- 0 -- -- -- -- -- -- -- -- 0 -- 0 --
NCDC 28653 -- 0 -- 0 -- -- -- -- -- -- -- -- 0 -- 0 --
NCDC 29015 -- 0 -- 0 -- -- -- -- -- -- -- -- 0 -- 0 --
NCDC 29095 -- 0 -- 0 -- -- -- -- -- -- -- -- 0 -- 0 --
NCDC 29382 -- 0 -- 0 -- -- -- -- -- -- -- -- 0 -- 0 --
NCDC 29420 -- 0 -- 0 -- -- -- -- -- -- -- -- 0 -- 0 --
NCDC 29425 -- 0 -- 0 -- -- -- -- -- -- -- -- 0 -- 0 --
NCDC 29464 -- 0 -- 0 -- -- -- -- -- -- -- -- 0 -- 0 --
NCDC 29634 -- 0 -- 0 -- -- -- -- -- -- -- -- 0 -- 0 --
NCDC 20080 -- 0 -- 0 -- -- -- -- -- -- -- -- 0 -- 0 --
NCDC 20088 -- 0 -- 0 -- -- -- -- -- -- -- -- 0 -- 0 --
NCDC 20170 0 11 -- 41.0 30.9 34.5 #N/A 1.17 0.75 0.75 3.489 0.670 129.8 -- 111.9 --
NCDC 20174 0 1 -- 8.8 5.1 8.0 11.0 0.45 0.58 0.58 2.025 0.541 23.0 -- 20.4 --
NCDC 20204 -- 0 -- 0 -- -- -- -- -- -- -- -- 0 -- 0 --
NCDC 20287 -- 0 -- 0 -- -- -- -- -- -- -- -- 0 -- 0 --
NCDC 20300 -- 0 -- 0 -- -- -- -- -- -- -- -- 0 -- 0 --
NCDC 20309 -- 0 -- 0 -- -- -- -- -- -- -- -- 0 -- 0 --
NCDC 20344 -- 0 -- 0 -- -- -- -- -- -- -- -- 0 -- 0 --
NCDC 20380 -- 0 -- 0 -- -- -- -- -- -- -- -- 0 -- 0 --
* indicates less than 15 years of data available
SHADED indicates 50-year Snow Load less than 12 PSF (negligible in typical design)

Ground Snow Loads with Statistical Data for All Sites 73 .
Station Name CountyClimate
DivisionLongitude Latitude
Elev.
(ft (m))
Max
Snow
Depth
(in)
Max
SWE
(in of
H2O)
Year
of Max
Month
of Max
# of
Years
of
Data
50-yr
Ground
Snow
Load
(psf)
[Eqn. 2.1]
50-yr
Ground
Snow
Load
(psf)
[Eqn.
3.12]
30-yr
Ground
Snow
Load
(psf)
[Eqn. 2.1]
30-yr
Ground
Snow
Load
(psf)
[Eqn.
3.12]
* ARIZONA SONORA DESERT MUSEUMPIMA 7 -111.17 32.25 2821 (860) -- -- -- -- 12 0 0 0 0
* ARSENIC TUBS 7 -109.83 33.27 4704 (1434) 7 -- 1948 2 3 6 8 4 6
* BEACH RANCH PIMA 7 -110.77 31.93 3762 (1147) -- -- -- -- 9 0 0 0 0
* BEAR VALLEY 7 -111.18 31.42 4031 (1229) -- -- -- -- 12 0 0 0 0
BEAVER HEAD GREENLEE 7 -109.20 33.70 8000 (2439) -- 12.5 68 1 68 60 60 52 52
* Beaverhead Greenlee 7 -109.22 33.68 7990 (2436) -- 8.3 98 3 11 57 57 51 51
BEAVERHEAD LODGE GREENLEE 7 -109.22 33.68 8092 (2467) 44 -- 1962 1 20 66 83 55 70
BENSON COCHISE 7 -110.28 31.97 3585 (1093) 17 -- 1919 3 74 1 2 1 2
* BENSON 23 NNW COCHISE 7 -110.38 32.30 3142 (958) -- -- -- -- 5 0 0 0 0
BENSON 6 SE COCHISE 7 -110.23 31.88 3689 (1125) -- -- -- -- 16 0 0 0 0
BISBEE COCHISE 7 -109.92 31.43 5306 (1618) 20 -- 1949 1 68 5 7 4 6
BISBEE 1 WNW COCHISE 7 -109.93 31.45 5559 (1695) 7 -- 1988 1 17 4 5 3 4
BISBEE 2 COCHISE 7 -109.90 31.43 5049 (1539) 6 -- 1980 2 28 1 1 1 1
BLACK RIVER PUMPS GRAHAM 7 -109.75 33.48 6063 (1849) 15 -- 1997 1 56 5 6 4 5
BLUE GREENLEE 7 -109.17 33.58 5419 (1652) 42 -- 1967 12 58 16 22 13 17
* BONITA CREEK 7 -109.78 33.15 4802 (1464) 10 -- 1949 1 6 7 9 5 7
BOSLEY RANCH GRAHAM 7 -110.20 32.57 4802 (1464) -- -- -- -- 25 0 0 0 0
BOWIE COCHISE 7 -109.48 32.32 3759 (1146) 10 -- 1978 1 104 1 1 1 1
* BOWIE JUNCTION R15 ON W5 7 -109.70 32.43 4723 (1440) -- -- -- -- 1 0 0 0 0
CANELO 1 NW SANTA CRUZ 7 -110.53 31.57 5009 (1527) 11 -- 1978 12 93 2 3 2 3
CASCABEL COCHISE 7 -110.42 32.32 3144 (959) -- -- -- -- 37 0 0 0 0
CHIRICAHUA NATL MONUMENT COCHISE 7 -109.35 32.00 5299 (1615) 28 -- 1967 12 69 9 13 7 10
CLIFTON GREENLEE 7 -109.30 33.05 3519 (1073) 15 -- 1949 1 112 0 1 0 0
COCHISE 4 SSE COCHISE 7 -109.88 32.07 4179 (1274) 10 -- 1912 2 33 1 2 1 2
COCHISE STRONGHOLD 7 -109.95 31.95 4749 (1448) 8 -- 1928 2 20 3 5 3 4
CORONADO N M HDQTRS COCHISE 7 -110.25 31.35 5241 (1598) 16 -- 1988 1 46 4 6 3 4
* CORONADO NATL MONUMENT 7 -110.28 31.37 5553 (1693) 15 -- 1958 3 5 8 11 6 9
CORTARO 3 SW PIMA 7 -111.12 32.33 2269 (692) -- -- -- -- 29 0 0 0 0
* COVERED WELLS 1 E PIMA 7 -112.15 32.15 2620 (799) -- -- -- -- 8 0 0 0 0
DOS CABEZAS 1 SE COCHISE 7 -109.60 32.17 5104 (1556) 12 -- 1967 12 32 6 8 5 7
DOUGLAS COCHISE 7 -109.53 31.35 4039 (1231) -- -- -- -- 37 0 0 0 0
DOUGLAS BISBEE-DOUGLAS INTL A COCHISE 7 -109.60 31.47 4104 (1251) -- -- -- -- 58 0 0 0 0
DOUGLAS SMELTER 7 -109.58 31.35 3972 (1211) -- -- -- -- 71 0 0 0 0
DUNCAN GREENLEE 7 -109.12 32.75 3659 (1116) 15 -- 1949 1 72 0 0 0 0
EAGLE CREEK GREENLEE 7 -109.48 33.40 5104 (1556) 35 -- 1967 12 46 4 5 3 4
EAGLE CREEK 2 GREENLEE 7 -109.48 33.35 4869 (1484) -- -- -- -- 17 0 0 0 0
ELGIN 5 N SANTA CRUZ 7 -110.53 31.73 4904 (1495) 13 -- 1916 1 59 3 4 2 3
FAIRBANK 1 S COCHISE 7 -110.18 31.72 3851 (1174) 10 -- 1939 2 65 1 1 1 1
* FLYING H RANCH 7 -110.23 31.40 5081 (1549) -- -- -- -- 11 0 0 0 0
FORT HUACHUCA COCHISE 7 -110.33 31.57 4664 (1422) 13 -- 1916 1 51 5 7 4 5
* FORT THOMAS GRAHAM 7 -109.95 33.03 2679 (817) -- -- -- -- 9 0 0 0 0
FORT THOMAS 2 SW GRAHAM 7 -110.00 33.02 2799 (853) -- -- -- -- 40 0 0 0 0
FRITZ RANCH GREENLEE 7 -109.18 33.33 4323 (1318) -- -- -- -- 33 0 0 0 0
FT GRANT GRAHAM 7 -109.95 32.62 4849 (1478) 40 -- 1935 3 67 3 4 2 3
GRANVILLE GREENLEE 7 -109.38 33.20 6802 (2074) 38 -- 1968 12 21 12 16 9 13
GREEN VALLEY PIMA 7 -111.00 31.90 2899 (884) -- -- -- -- 18 0 0 0 0
* GREY PEAK GREENLEE 7 -109.38 33.25 6398 (1951) 30 -- 1950 2 5 42 54 33 43
* GREYS PEAK MNTC YD GREENLEE 7 -109.38 33.25 6658 (2030) 15 -- 1979 2 7 17 23 15 20
Hannagan Meadows Greenlee 7 -109.32 33.65 9020 (2750) -- 27.1 83 4 23 167 167 150 150
HANNAGAN MEADOWS GREENLEE 7 -109.32 33.63 9090 (2771) -- 27 93 2 36 159 159 141 141
* HELMET PEAK 7 -111.05 31.95 3221 (982) -- -- -- -- 7 0 0 0 0
HELMET PEAK RUBY STAR RANCH PIMA 7 -111.08 31.92 3641 (1110) -- -- -- -- 33 0 0 0 0
* HELMET PEAK RUBY STAR RANCH PIMA 7 -111.08 31.92 3801 (1159) -- -- -- -- 3 0 0 0 0
HELVETIA SANTA RITA RANGE RES 7 -110.78 31.87 4303 (1312) 12 -- 1937 1 35 7 10 6 8
* HEREFORD 8 SW 7 -110.23 31.40 5032 (1534) -- -- -- -- 1 0 0 0 0
KITT PEAK PIMA 7 -111.60 31.97 6788 (2070) 44 -- 1966 2 46 33 43 26 35
KLONDYKE 3 SE GRAHAM 7 -110.30 32.80 3611 (1101) -- -- -- -- 26 0 0 0 0
LESLIE CANYON COCHISE 7 -109.57 31.60 4461 (1360) 35 -- 1949 2 44 3 5 3 4
MC NEAL COCHISE 7 -109.67 31.60 4169 (1271) -- -- -- -- 46 0 0 0 0
* MOUNT FAGAN RANCH PIMA 7 -110.77 31.93 3762 (1147) -- -- -- -- 9 0 0 0 0
* MOUNT LEMMON PIMA 7 -110.75 32.45 7792 (2376) 72 -- 1962 1 12 121 149 94 117
* MOUNT LEMMON 7 -110.72 32.42 7692 (2345) 24 -- 1953 3 7 36 47 31 41
* MOUNT LEMMON SUMMIT 7 -110.78 32.45 9145 (2788) -- -- -- -- 2 0 0 0 0
N LAZY H RANCH PIMA 7 -110.68 32.12 3049 (930) -- -- -- -- 44 0 0 0 0
NOGALES SANTA CRUZ 7 -110.92 31.35 3811 (1162) -- -- -- -- 63 0 0 0 0
NOGALES 6 N SANTA CRUZ 7 -110.97 31.45 3559 (1085) -- -- -- -- 54 0 0 0 0
NOGALES OLD NOGALES 7 -110.95 31.33 3903 (1190) -- -- -- -- 48 0 0 0 0
ORGAN PIPE CACTUS NM PIMA 7 -112.80 31.95 1678 (512) -- -- -- -- 59 0 0 0 0
PAINTED CANYON COCHISE 7 -109.20 31.88 5393 (1644) 8 -- 1951 1 15 5 8 4 6
PALISADE RANGER STN PIMA 7 -110.72 32.42 7954 (2425) 86 -- 1966 2 17 154 188 127 156
* PAPAGO FARMS 7 -112.28 31.78 1820 (555) -- -- -- -- 2 0 0 0 0
PARADISE 7 -109.22 31.93 5432 (1656) 27 -- 1916 1 32 16 21 12 17
PATAGONIA #2 SANTA CRUZ 7 -110.75 31.55 4041 (1232) -- -- -- -- 57 0 0 0 0
PATAGONIA #2 SANTA CRUZ 7 -110.75 31.55 4189 (1277) -- -- -- -- 28 0 0 0 0
PEARCE 5 W 7 -109.90 31.88 4924 (1501) 8 -- 1928 2 18 5 8 4 6
PEARCE SUNSITES COCHISE 7 -109.83 31.93 4349 (1326) 8 -- 1916 12 54 1 1 1 1
* PIMA R4 ON W2 7 -110.02 32.83 3772 (1150) -- -- -- -- 1 0 0 0 0
* PISINEMO 7 -112.32 32.05 1902 (580) -- -- -- -- 8 0 0 0 0
PORTAL 7 -109.17 31.90 5002 (1525) 20 -- 1923 12 41 11 15 9 12
PORTAL 4 SW COCHISE 7 -109.20 31.88 5389 (1643) 31 -- 1967 12 41 13 18 10 14
REDINGTON PIMA 7 -110.47 32.38 2939 (896) -- -- -- -- 57 0 0 0 0
RUBY 4 NW 7 -111.28 31.50 3982 (1214) -- -- -- -- 36 0 0 0 0
RUCKER CANYON COCHISE 7 -109.42 31.75 5369 (1637) 13 -- 1978 12 92 1 2 1 1
* indicates less than 15 years of data available
SHADED indicates 50-year Snow Load less than 12 PSF (negligible in typical design)

Ground Snow Loads with Statistical Data for All Sites 74 .
Station Name
* ARIZONA SONORA DESERT MUSEUM
* ARSENIC TUBS
* BEACH RANCH
* BEAR VALLEY
BEAVER HEAD
* Beaverhead
BEAVERHEAD LODGE
BENSON
* BENSON 23 NNW
BENSON 6 SE
BISBEE
BISBEE 1 WNW
BISBEE 2
BLACK RIVER PUMPS
BLUE
* BONITA CREEK
BOSLEY RANCH
BOWIE
* BOWIE JUNCTION R15 ON W5
CANELO 1 NW
CASCABEL
CHIRICAHUA NATL MONUMENT
CLIFTON
COCHISE 4 SSE
COCHISE STRONGHOLD
CORONADO N M HDQTRS
* CORONADO NATL MONUMENT
CORTARO 3 SW
* COVERED WELLS 1 E
DOS CABEZAS 1 SE
DOUGLAS
DOUGLAS BISBEE-DOUGLAS INTL A
DOUGLAS SMELTER
DUNCAN
EAGLE CREEK
EAGLE CREEK 2
ELGIN 5 N
FAIRBANK 1 S
* FLYING H RANCH
FORT HUACHUCA
* FORT THOMAS
FORT THOMAS 2 SW
FRITZ RANCH
FT GRANT
GRANVILLE
GREEN VALLEY
* GREY PEAK
* GREYS PEAK MNTC YD
Hannagan Meadows
HANNAGAN MEADOWS
* HELMET PEAK
HELMET PEAK RUBY STAR RANCH
* HELMET PEAK RUBY STAR RANCH
HELVETIA SANTA RITA RANGE RES
* HEREFORD 8 SW
KITT PEAK
KLONDYKE 3 SE
LESLIE CANYON
MC NEAL
* MOUNT FAGAN RANCH
* MOUNT LEMMON
* MOUNT LEMMON
* MOUNT LEMMON SUMMIT
N LAZY H RANCH
NOGALES
NOGALES 6 N
NOGALES OLD NOGALES
ORGAN PIPE CACTUS NM
PAINTED CANYON
PALISADE RANGER STN
* PAPAGO FARMS
PARADISE
PATAGONIA #2
PATAGONIA #2
PEARCE 5 W
PEARCE SUNSITES
* PIMA R4 ON W2
* PISINEMO
PORTAL
PORTAL 4 SW
REDINGTON
RUBY 4 NW
RUCKER CANYON
Data
Source
Coop
ID
#
Year
s
Zero
Data
Min
Snow
Depth
(in)
Min
SWE
(in of
H2O)
MeanStandard
Dev.Median Mode
Skew-
nessCOV
COV (trunc-
ated)λx ζx
50-yr
Snow
Depth
(in)
50-yr
SWE
(in of
water)
30-yr
Snow
Depth
(in)
30-yr
SWE
(in of
water)
NCDC 20415 -- 0 -- 0 -- -- -- -- -- -- -- -- 0 -- 0 --
NCDC 20433 2 0 -- 2.3 4.0 0.0 0.0 1.73 1.73 1.00 0.501 0.833 9.1 -- 7.6 --
NCDC 20640 -- 0 -- 0 -- -- -- -- -- -- -- -- 0 -- 0 --
NCDC 20665 -- 0 -- 0 -- -- -- -- -- -- -- -- 0 -- 0 --
SC 09S06 0 -- 0.2 4.0 2.6 3.4 2.9 0.83 0.66 0.66 1.201 0.604 -- 11.5 -- 10.1
ST 902 0 -- 1.2 4.3 2.4 4.7 #N/A 0.28 0.57 0.57 1.317 0.527 -- 11.0 -- 9.8
NCDC 20675 1 0 -- 20.1 12.6 17.5 18.0 0.29 0.63 0.63 2.832 0.577 55.6 -- 48.9 --
NCDC 20680 61 0 -- 0.8 2.5 0.0 0.0 4.57 3.13 1.00 -0.556 0.833 3.2 -- 2.6 --
NCDC 20690 -- 0 -- 0 -- -- -- -- -- -- -- -- 0 -- 0 --
NCDC 20683 -- 0 -- 0 -- -- -- -- -- -- -- -- 0 -- 0 --
NCDC 20768 33 0 -- 2.2 3.5 1.0 0.0 2.93 1.61 1.00 0.424 0.833 8.5 -- 7.0 --
NCDC 20775 7 0 -- 1.7 2.0 1.0 0.0 1.22 1.19 1.00 0.188 0.833 6.7 -- 5.6 --
NCDC 20773 23 0 -- 0.6 1.6 0.0 0.0 2.56 2.51 1.00 -0.788 0.833 2.5 -- 2.1 --
NCDC 20808 38 0 -- 2.0 3.6 0.0 0.0 1.95 1.80 1.00 0.338 0.833 7.8 -- 6.5 --
NCDC 20855 20 0 -- 5.1 7.3 2.5 0.0 2.74 1.44 1.00 1.283 0.833 20.0 -- 16.6 --
NCDC 20903 3 0 -- 2.7 3.9 1.0 0.0 1.67 1.47 1.00 0.634 0.833 10.4 -- 8.7 --
NCDC 20923 -- 0 -- 0 -- -- -- -- -- -- -- -- 0 -- 0 --
NCDC 20958 85 0 -- 0.6 1.6 0.0 0.0 3.15 2.56 1.00 -0.786 0.833 2.5 -- 2.1 --
NCDC 20966 -- 0 -- 0 -- -- -- -- -- -- -- -- 0 -- 0 --
NCDC 21231 62 0 -- 1.2 2.3 0.0 0.0 2.24 1.86 1.00 -0.152 0.833 4.8 -- 4.0 --
NCDC 21330 -- 0 -- 0 -- -- -- -- -- -- -- -- 0 -- 0 --
NCDC 21664 25 0 -- 3.4 4.7 2.0 0.0 2.68 1.37 1.00 0.879 0.833 13.3 -- 11.1 --
NCDC 21849 105 0 -- 0.3 1.6 0.0 0.0 7.35 5.41 1.00 -1.539 0.833 1.2 -- 1.0 --
NCDC 21870 23 0 -- 0.9 2.0 0.0 0.0 3.44 2.25 1.00 -0.476 0.833 3.4 -- 2.9 --
NCDC 21874 10 0 -- 1.6 2.0 1.0 0.0 1.76 1.32 1.00 0.092 0.833 6.1 -- 5.0 --
NCDC 22140 27 0 -- 1.8 3.3 0.0 0.0 2.57 1.83 1.00 0.244 0.833 7.1 -- 5.9 --
NCDC 22139 4 0 -- 3.0 6.7 0.0 0.0 2.24 2.24 1.00 0.752 0.833 11.7 -- 9.8 --
NCDC 22159 -- 0 -- 0 -- -- -- -- -- -- -- -- 0 -- 0 --
NCDC 22216 -- 0 -- 0 -- -- -- -- -- -- -- -- 0 -- 0 --
NCDC 22648 13 0 -- 2.4 3.4 1.0 0.0 1.54 1.41 1.00 0.544 0.833 9.5 -- 7.9 --
NCDC 22659 -- 0 -- 0 -- -- -- -- -- -- -- -- 0 -- 0 --
NCDC 22664 -- 0 -- 0 -- -- -- -- -- -- -- -- 0 -- 0 --
NCDC 22669 -- 0 -- 0 -- -- -- -- -- -- -- -- 0 -- 0 --
NCDC 22754 69 0 -- 0.3 1.8 0.0 0.0 8.23 7.13 1.00 -1.733 0.833 1.0 -- 0.8 --
NCDC 22779 33 0 -- 1.7 5.4 0.0 0.0 5.63 3.25 1.00 0.156 0.833 6.5 -- 5.4 --
NCDC 22781 -- 0 -- 0 -- -- -- -- -- -- -- -- 0 -- 0 --
NCDC 22797 41 0 -- 1.4 2.8 0.0 0.0 2.40 1.98 1.00 -0.005 0.833 5.5 -- 4.6 --
NCDC 22902 54 0 -- 0.6 1.9 0.0 0.0 4.27 3.20 1.00 -0.883 0.833 2.3 -- 1.9 --
NCDC 23071 -- 0 -- 0 -- -- -- -- -- -- -- -- 0 -- 0 --
NCDC 23120 22 0 -- 2.1 2.9 1.0 0.0 2.10 1.40 1.00 0.376 0.833 8.1 -- 6.7 --
NCDC 23144 -- 0 -- 0 -- -- -- -- -- -- -- -- 0 -- 0 --
NCDC 23150 -- 0 -- 0 -- -- -- -- -- -- -- -- 0 -- 0 --
NCDC 23258 -- 0 -- 0 -- -- -- -- -- -- -- -- 0 -- 0 --
NCDC 23110 47 0 -- 1.4 5.1 0.0 0.0 6.80 3.57 1.00 0.013 0.833 5.6 -- 4.7 --
NCDC 23635 18 0 -- 4.0 10.9 0.0 0.0 2.68 2.70 1.00 1.052 0.833 15.8 -- 13.2 --
NCDC 23668 -- 0 -- 0 -- -- -- -- -- -- -- -- 0 -- 0 --
NCDC 23697 1 0 -- 10.2 11.8 8.0 #N/A 1.62 1.15 1.00 1.976 0.833 39.9 -- 33.2 --
NCDC 23698 0 3 -- 9.6 4.2 10.0 #N/A -0.37 0.44 0.44 2.171 0.419 20.8 -- 18.9 --
ST 511 0 -- 2.2 13.8 6.7 11.8 #N/A 0.43 0.49 0.49 2.513 0.464 -- 32.1 -- 28.9
SC 09S11 0 -- 2.2 11.9 6.7 11.0 3.0 0.48 0.56 0.56 2.341 0.524 -- 30.5 -- 27.2
NCDC 23973 -- 0 -- 0 -- -- -- -- -- -- -- -- 0 -- 0 --
NCDC 27330 -- 0 -- 0 -- -- -- -- -- -- -- -- 0 -- 0 --
NCDC 23975 -- 0 -- 0 -- -- -- -- -- -- -- -- 0 -- 0 --
NCDC 23981 14 0 -- 2.8 3.5 2.0 0.0 1.36 1.23 1.00 0.683 0.833 11.0 -- 9.1 --
NCDC 23996 -- 0 -- 0 -- -- -- -- -- -- -- -- 0 -- 0 --
NCDC 24675 3 0 -- 9.2 8.4 7.0 6.0 2.42 0.91 0.91 1.923 0.775 33.6 -- 28.3 --
NCDC 24698 -- 0 -- 0 -- -- -- -- -- -- -- -- 0 -- 0 --
NCDC 24864 31 0 -- 1.6 5.4 0.0 0.0 5.78 3.34 1.00 0.132 0.833 6.3 -- 5.3 --
NCDC 25418 -- 0 -- 0 -- -- -- -- -- -- -- -- 0 -- 0 --
NCDC 25729 -- 0 -- 0 -- -- -- -- -- -- -- -- 0 -- 0 --
NCDC 25732 4 0 -- 22.3 27.3 7.0 0.0 0.90 1.23 1.00 2.756 0.833 87.1 -- 72.4 --
NCDC 25733 1 0 -- 15.4 7.5 17.0 #N/A -1.66 0.48 0.48 2.631 0.459 35.7 -- 32.2 --
NCDC 25734 -- 0 -- 0 -- -- -- -- -- -- -- -- 0 -- 0 --
NCDC 25908 -- 0 -- 0 -- -- -- -- -- -- -- -- 0 -- 0 --
NCDC 25921 -- 0 -- 0 -- -- -- -- -- -- -- -- 0 -- 0 --
NCDC 25924 -- 0 -- 0 -- -- -- -- -- -- -- -- 0 -- 0 --
NCDC 25922 -- 0 -- 0 -- -- -- -- -- -- -- -- 0 -- 0 --
NCDC 26132 -- 0 -- 0 -- -- -- -- -- -- -- -- 0 -- 0 --
NCDC 26186 8 0 -- 2.3 2.9 0.0 0.0 1.01 1.29 1.00 0.472 0.833 8.9 -- 7.4 --
NCDC 26202 0 9 -- 33.7 24.4 24.0 14.0 1.13 0.72 0.72 3.306 0.650 103.7 -- 89.9 --
NCDC 26233 -- 0 -- 0 -- -- -- -- -- -- -- -- 0 -- 0 --
NCDC 26242 5 0 -- 5.0 5.9 3.5 2.0 2.52 1.18 1.00 1.263 0.833 19.6 -- 16.3 --
NCDC 26280 -- 0 -- 0 -- -- -- -- -- -- -- -- 0 -- 0 --
NCDC 26282 -- 0 -- 0 -- -- -- -- -- -- -- -- 0 -- 0 --
NCDC 26358 4 0 -- 2.7 2.1 2.5 2.0 0.83 0.79 0.79 0.737 0.698 8.8 -- 7.5 --
NCDC 26353 42 0 -- 0.6 1.4 0.0 0.0 3.54 2.41 1.00 -0.902 0.833 2.2 -- 1.9 --
NCDC 26546 -- 0 -- 0 -- -- -- -- -- -- -- -- 0 -- 0 --
NCDC 26630 -- 0 -- 0 -- -- -- -- -- -- -- -- 0 -- 0 --
NCDC 26706 19 0 -- 3.9 5.1 1.0 0.0 1.53 1.30 1.00 1.015 0.833 15.3 -- 12.7 --
NCDC 26716 9 0 -- 4.3 5.7 2.0 0.0 2.92 1.30 1.00 1.122 0.833 17.0 -- 14.1 --
NCDC 27036 -- 0 -- 0 -- -- -- -- -- -- -- -- 0 -- 0 --
NCDC 27326 -- 0 -- 0 -- -- -- -- -- -- -- -- 0 -- 0 --
NCDC 27334 79 0 -- 0.8 2.3 0.0 0.0 3.49 2.96 1.00 -0.620 0.833 3.0 -- 2.5 --
* indicates less than 15 years of data available
SHADED indicates 50-year Snow Load less than 12 PSF (negligible in typical design)

Ground Snow Loads with Statistical Data for All Sites 75 .
Station Name CountyClimate
DivisionLongitude Latitude
Elev.
(ft (m))
Max
Snow
Depth
(in)
Max
SWE
(in of
H2O)
Year
of Max
Month
of Max
# of
Years
of
Data
50-yr
Ground
Snow
Load
(psf)
[Eqn. 2.1]
50-yr
Ground
Snow
Load
(psf)
[Eqn.
3.12]
30-yr
Ground
Snow
Load
(psf)
[Eqn. 2.1]
30-yr
Ground
Snow
Load
(psf)
[Eqn.
3.12]
SABINO CANYON PIMA 7 -110.82 32.32 2639 (805) -- -- -- -- 35 0 0 0 0
SAFFORD GRAHAM 7 -109.72 32.83 2903 (885) -- -- -- -- 50 0 0 0 0
SAFFORD AGRI CENTER GRAHAM 7 -109.68 32.82 2953 (900) 14 -- 1967 12 57 1 2 1 1
SAHUARITA 2 NW PIMA 7 -110.97 31.97 2689 (820) -- -- -- -- 17 0 0 0 0
* SAHUARITA 8 W PIMA 7 -111.07 31.90 3559 (1085) -- -- -- -- 6 0 0 0 0
SALA RANCH COCHISE 7 -109.98 31.87 5163 (1574) 11 -- 1967 12 32 8 11 6 9
SAN RAFAEL RANCH SANTA CRUZ 7 -110.62 31.35 4743 (1446) -- -- -- -- 53 0 0 0 0
SAN SIMON COCHISE 7 -109.23 32.27 3609 (1100) -- -- -- -- 74 0 0 0 0
* SAN SIMON 5 NW 7 -109.27 32.33 3611 (1101) -- -- -- -- 13 0 0 0 0
SAN SIMON 9 ESE COCHISE 7 -109.08 32.17 3879 (1183) -- -- -- -- 25 0 0 0 0
* SAN SIMON 9 NE 7 -109.13 32.37 4002 (1220) -- -- -- -- 2 0 0 0 0
SANTA MARGARITA 7 -111.58 31.68 3933 (1199) -- -- -- -- 34 0 0 0 0
SANTA RITA EXP RANGE PIMA 7 -110.85 31.77 4299 (1311) 8 -- 1951 1 56 2 3 1 2
SANTA ROSA SCHOOL PIMA 7 -112.05 32.32 1840 (561) -- -- -- -- 19 0 0 0 0
SASABE PIMA 7 -111.55 31.48 3589 (1094) -- -- -- -- 47 0 0 0 0
SASABE 6 NNE PIMA 7 -111.50 31.57 3494 (1065) -- -- -- -- 18 0 0 0 0
SASABE 7 NW PIMA 7 -111.60 31.60 3824 (1166) -- -- -- -- 55 0 0 0 0
SELLS PIMA 7 -111.88 31.92 2345 (715) -- -- -- -- 35 0 0 0 0
SIERRA VISTA COCHISE 7 -110.28 31.55 4599 (1402) -- -- -- -- 24 0 0 0 0
SILVER BELL 7 -111.50 32.38 2739 (835) -- -- -- -- 37 0 0 0 0
STEPHENS RANCH COCHISE 7 -109.20 31.40 3998 (1219) 10 -- 1980 2 55 0 0 0 0
* TANQUE R9 ON W4 7 -109.62 32.62 3562 (1086) -- -- -- -- 1 0 0 0 0
TOMBSTONE COCHISE 7 -110.05 31.70 4609 (1405) 10 -- 1997 1 109 1 2 1 1
TUCSON 17 NW PIMA 7 -111.20 32.25 2560 (781) -- -- -- -- 24 0 0 0 0
TUCSON CAMP AVE EXP FM PIMA 7 -110.95 32.28 2329 (710) -- -- -- -- 56 0 0 0 0
TUCSON INTERNATIONAL AP PIMA 7 -110.95 32.13 2548 (777) -- -- -- -- 58 0 0 0 0
TUCSON MAGNETIC OBSY PIMA 7 -110.83 32.25 2525 (770) -- -- -- -- 48 0 0 0 0
* TUCSON MOUNTAIN PARK PIMA 7 -111.17 32.25 2850 (869) -- -- -- -- 7 0 0 0 0
* TUCSON MOUNTAIN PARK 7 -111.13 32.22 2679 (817) -- -- -- -- 1 0 0 0 0
* TUCSON NURSERY 4 NW 7 -111.05 32.30 2250 (686) -- -- -- -- 1 0 0 0 0
TUCSON WFO PIMA 7 -110.95 32.23 2434 (742) -- -- -- -- 112 0 0 0 0
TUMACACORI NATL MONMNT SANTA CRUZ 7 -111.05 31.57 3266 (996) -- -- -- -- 58 0 0 0 0
TUSCON U OF A #1 PIMA 7 -111.00 32.25 2314 (706) -- -- -- -- 24 0 0 0 0
* VAIL 7 N PIMA 7 -110.72 32.13 2979 (908) -- -- -- -- 13 0 0 0 0
* WAHAK HOTRONTK PIMA 7 -112.37 32.22 1902 (580) -- -- -- -- 4 0 0 0 0
* WHITLOCK VALLEY R2 ON W1 7 -109.52 32.82 3290 (1003) -- -- -- -- 1 0 0 0 0
Wildcat Greenlee 7 -109.48 33.77 7850 (2393) -- 11.8 93 3 21 67 67 59 59
WILLCOX COCHISE 7 -109.85 32.27 4174 (1273) 9 -- 1912 2 107 1 1 1 1
Y LIGHTNING RANCH COCHISE 7 -110.23 31.45 4589 (1399) -- -- -- -- 67 0 0 0 0
* indicates less than 15 years of data available
SHADED indicates 50-year Snow Load less than 12 PSF (negligible in typical design)
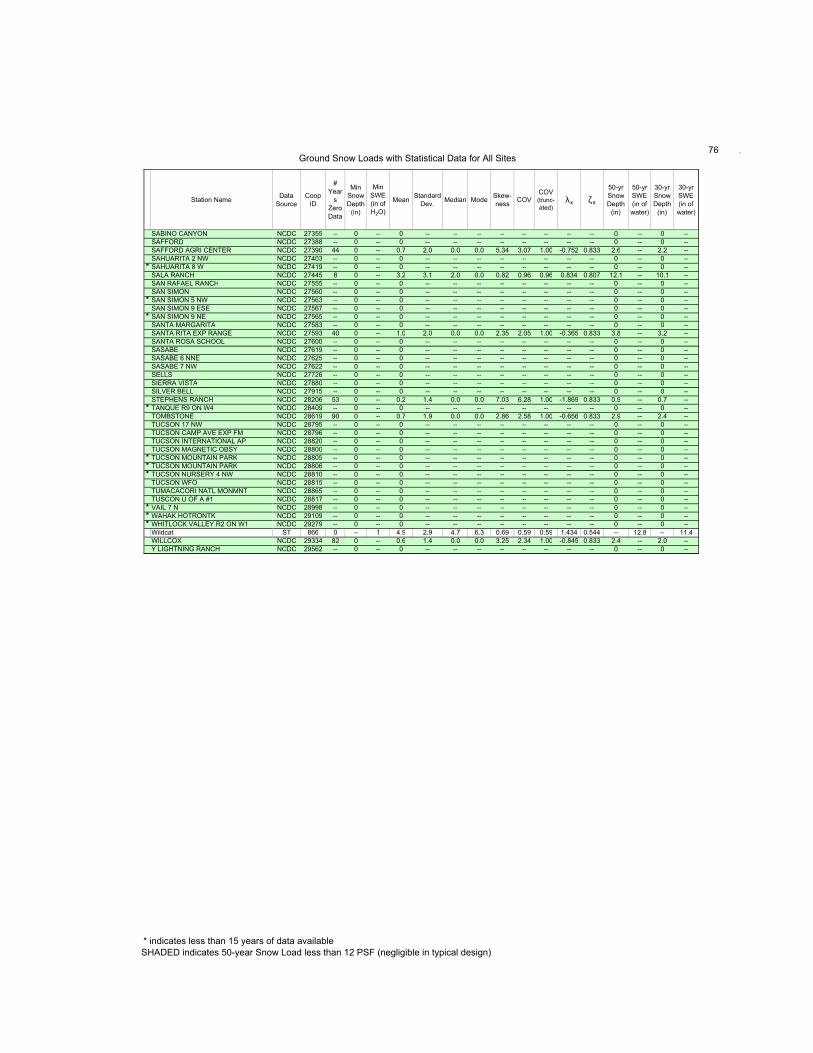
Ground Snow Loads with Statistical Data for All Sites 76 .
Station Name
SABINO CANYON
SAFFORD
SAFFORD AGRI CENTER
SAHUARITA 2 NW
* SAHUARITA 8 W
SALA RANCH
SAN RAFAEL RANCH
SAN SIMON
* SAN SIMON 5 NW
SAN SIMON 9 ESE
* SAN SIMON 9 NE
SANTA MARGARITA
SANTA RITA EXP RANGE
SANTA ROSA SCHOOL
SASABE
SASABE 6 NNE
SASABE 7 NW
SELLS
SIERRA VISTA
SILVER BELL
STEPHENS RANCH
* TANQUE R9 ON W4
TOMBSTONE
TUCSON 17 NW
TUCSON CAMP AVE EXP FM
TUCSON INTERNATIONAL AP
TUCSON MAGNETIC OBSY
* TUCSON MOUNTAIN PARK
* TUCSON MOUNTAIN PARK
* TUCSON NURSERY 4 NW
TUCSON WFO
TUMACACORI NATL MONMNT
TUSCON U OF A #1
* VAIL 7 N
* WAHAK HOTRONTK
* WHITLOCK VALLEY R2 ON W1
Wildcat
WILLCOX
Y LIGHTNING RANCH
Data
Source
Coop
ID
#
Year
s
Zero
Data
Min
Snow
Depth
(in)
Min
SWE
(in of
H2O)
MeanStandard
Dev.Median Mode
Skew-
nessCOV
COV (trunc-
ated)λx ζx
50-yr
Snow
Depth
(in)
50-yr
SWE
(in of
water)
30-yr
Snow
Depth
(in)
30-yr
SWE
(in of
water)
NCDC 27355 -- 0 -- 0 -- -- -- -- -- -- -- -- 0 -- 0 --
NCDC 27388 -- 0 -- 0 -- -- -- -- -- -- -- -- 0 -- 0 --
NCDC 27390 44 0 -- 0.7 2.0 0.0 0.0 5.34 3.07 1.00 -0.752 0.833 2.6 -- 2.2 --
NCDC 27403 -- 0 -- 0 -- -- -- -- -- -- -- -- 0 -- 0 --
NCDC 27419 -- 0 -- 0 -- -- -- -- -- -- -- -- 0 -- 0 --
NCDC 27445 8 0 -- 3.2 3.1 2.0 0.0 0.82 0.96 0.96 0.834 0.807 12.1 -- 10.1 --
NCDC 27555 -- 0 -- 0 -- -- -- -- -- -- -- -- 0 -- 0 --
NCDC 27560 -- 0 -- 0 -- -- -- -- -- -- -- -- 0 -- 0 --
NCDC 27563 -- 0 -- 0 -- -- -- -- -- -- -- -- 0 -- 0 --
NCDC 27567 -- 0 -- 0 -- -- -- -- -- -- -- -- 0 -- 0 --
NCDC 27565 -- 0 -- 0 -- -- -- -- -- -- -- -- 0 -- 0 --
NCDC 27583 -- 0 -- 0 -- -- -- -- -- -- -- -- 0 -- 0 --
NCDC 27593 40 0 -- 1.0 2.0 0.0 0.0 2.35 2.05 1.00 -0.365 0.833 3.8 -- 3.2 --
NCDC 27600 -- 0 -- 0 -- -- -- -- -- -- -- -- 0 -- 0 --
NCDC 27619 -- 0 -- 0 -- -- -- -- -- -- -- -- 0 -- 0 --
NCDC 27625 -- 0 -- 0 -- -- -- -- -- -- -- -- 0 -- 0 --
NCDC 27622 -- 0 -- 0 -- -- -- -- -- -- -- -- 0 -- 0 --
NCDC 27726 -- 0 -- 0 -- -- -- -- -- -- -- -- 0 -- 0 --
NCDC 27880 -- 0 -- 0 -- -- -- -- -- -- -- -- 0 -- 0 --
NCDC 27915 -- 0 -- 0 -- -- -- -- -- -- -- -- 0 -- 0 --
NCDC 28206 53 0 -- 0.2 1.4 0.0 0.0 7.03 6.28 1.00 -1.869 0.833 0.9 -- 0.7 --
NCDC 28409 -- 0 -- 0 -- -- -- -- -- -- -- -- 0 -- 0 --
NCDC 28619 90 0 -- 0.7 1.9 0.0 0.0 2.86 2.58 1.00 -0.656 0.833 2.9 -- 2.4 --
NCDC 28795 -- 0 -- 0 -- -- -- -- -- -- -- -- 0 -- 0 --
NCDC 28796 -- 0 -- 0 -- -- -- -- -- -- -- -- 0 -- 0 --
NCDC 28820 -- 0 -- 0 -- -- -- -- -- -- -- -- 0 -- 0 --
NCDC 28800 -- 0 -- 0 -- -- -- -- -- -- -- -- 0 -- 0 --
NCDC 28805 -- 0 -- 0 -- -- -- -- -- -- -- -- 0 -- 0 --
NCDC 28806 -- 0 -- 0 -- -- -- -- -- -- -- -- 0 -- 0 --
NCDC 28810 -- 0 -- 0 -- -- -- -- -- -- -- -- 0 -- 0 --
NCDC 28815 -- 0 -- 0 -- -- -- -- -- -- -- -- 0 -- 0 --
NCDC 28865 -- 0 -- 0 -- -- -- -- -- -- -- -- 0 -- 0 --
NCDC 28817 -- 0 -- 0 -- -- -- -- -- -- -- -- 0 -- 0 --
NCDC 28998 -- 0 -- 0 -- -- -- -- -- -- -- -- 0 -- 0 --
NCDC 29109 -- 0 -- 0 -- -- -- -- -- -- -- -- 0 -- 0 --
NCDC 29279 -- 0 -- 0 -- -- -- -- -- -- -- -- 0 -- 0 --
ST 866 0 -- 1 4.9 2.9 4.7 6.3 0.69 0.59 0.59 1.434 0.544 -- 12.8 -- 11.4
NCDC 29334 82 0 -- 0.6 1.4 0.0 0.0 3.25 2.34 1.00 -0.845 0.833 2.4 -- 2.0 --
NCDC 29562 -- 0 -- 0 -- -- -- -- -- -- -- -- 0 -- 0 --
* indicates less than 15 years of data available
SHADED indicates 50-year Snow Load less than 12 PSF (negligible in typical design)

77
APPENDIX B


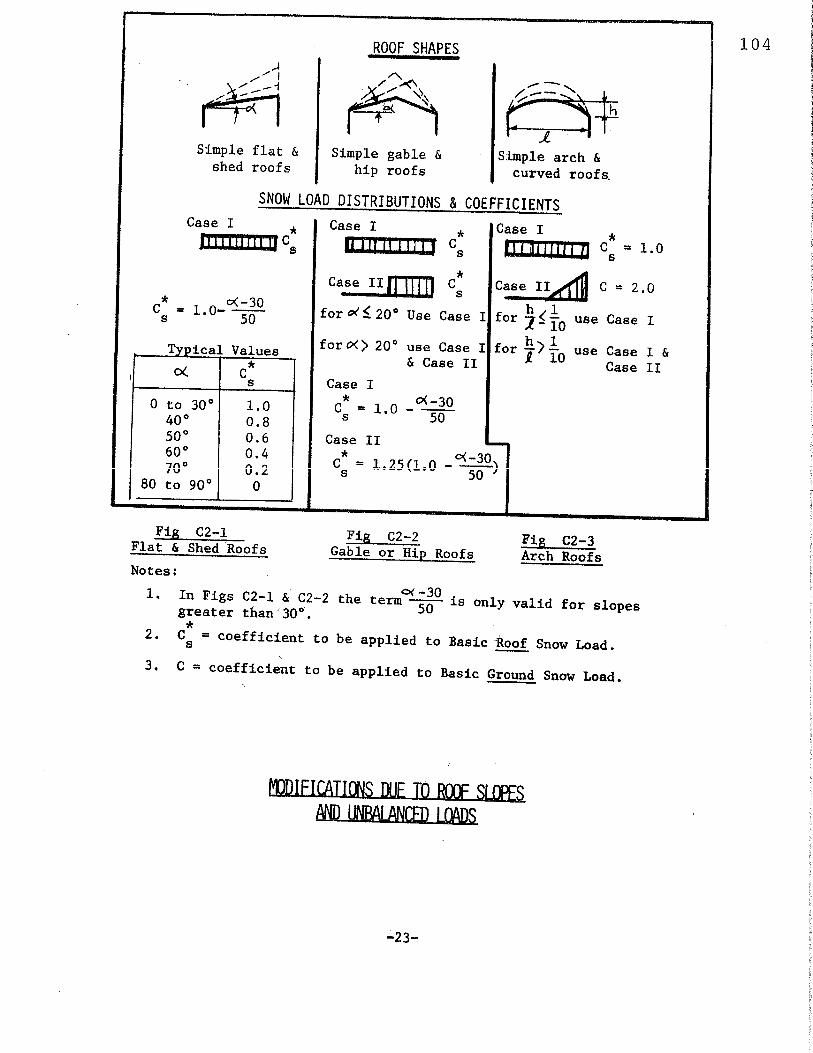
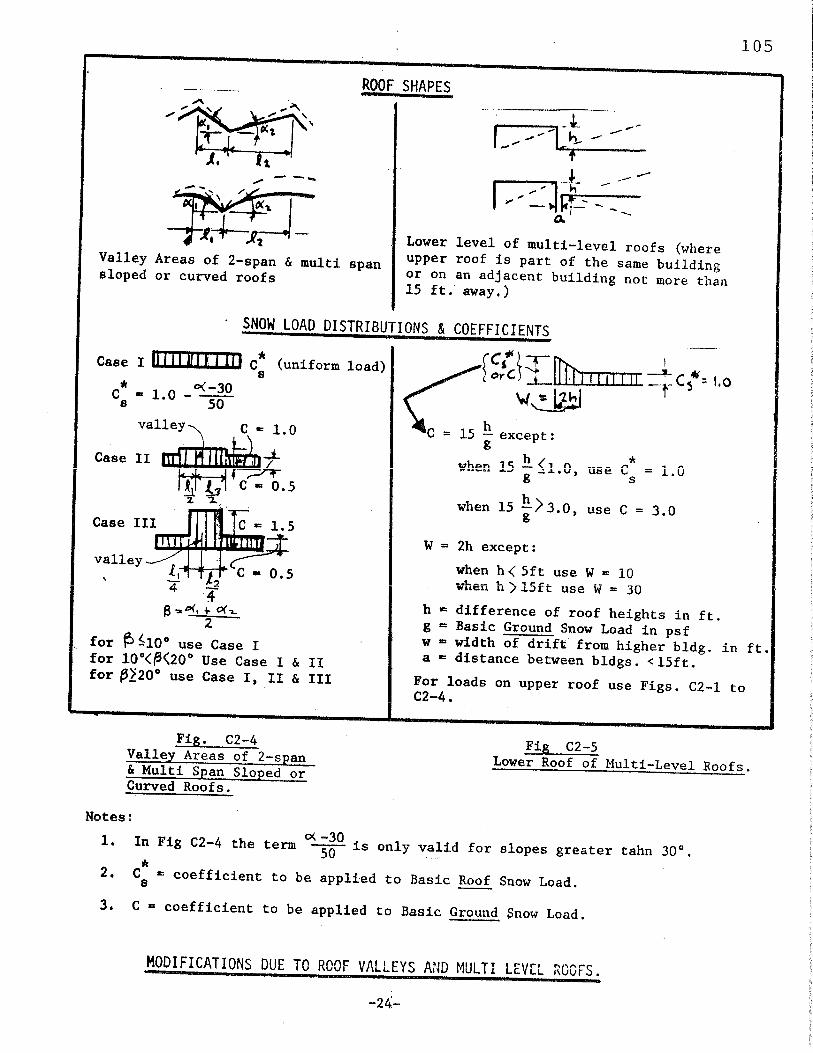
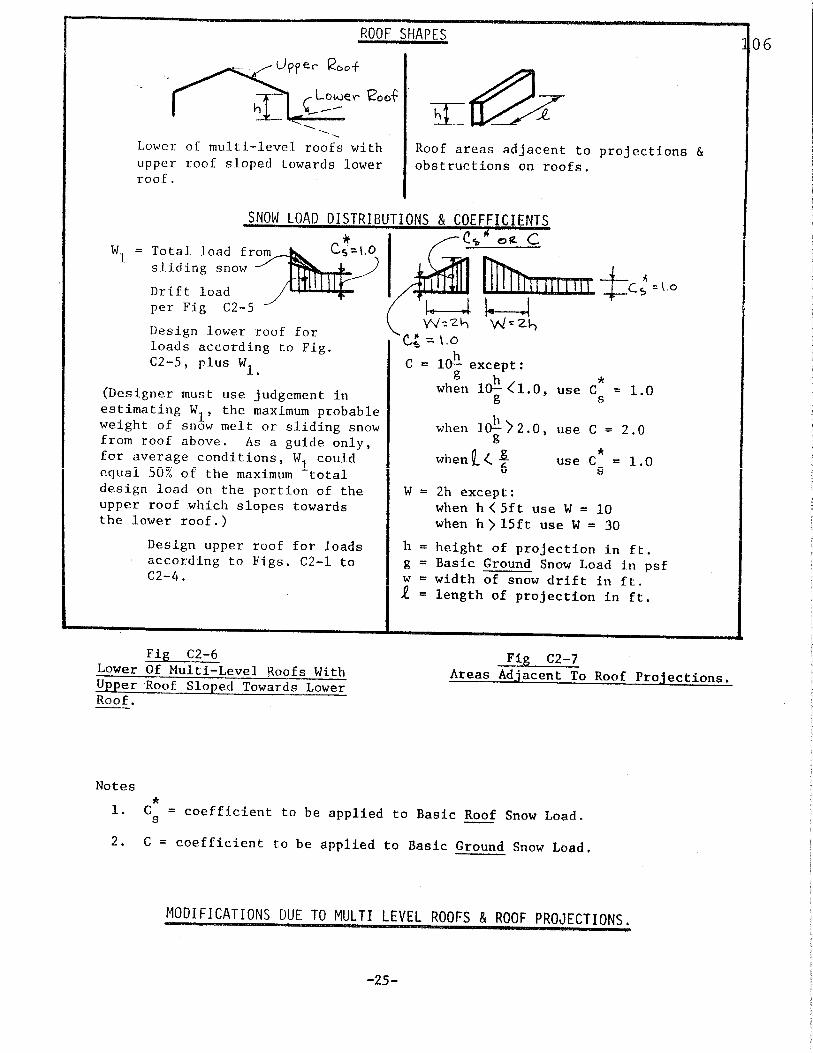

108
WORKS CITED
American National Standard Building Code Requirements for Minimum Design Loads in
Buildings and Other Structures, ANSI A58.1-1982. American National Standards
Institute. New York. 1982.
Ellingwood B and Redfield R. Ground Snow Loads for Structural Design. Journal of
Structural Engineering, Vol. 109, No. 4. April 1983. pp. 950-64.
Ellingwood B and Redfield R. Probability Models for Annual Extreme Water-Equivalent
Ground Snow. Monthly Weather Review, Vol. 112. June 1984, pp. 1153-59.
Elliot H. Actual Snow Loads in Arizona, Storm of December 13-20, 1967. 1968.
Elliot H. Snow Load Data for Arizona. Structural Engineers Association of Arizona and
Arizona State University. Tempe, Arizona, 1981.
Fridley K, Roberts K and Mitchell J. Estimating Ground Snow Loads Using Local
Climatological Data. Journal of Structural Engineering, Vol. 120, No. 12. December
1994. pp. 3567-76.
Haldar A and Mahadevan S. Probability, Reliability and Statistical Methods in
Engineering Design. John Wiley & Sons. 2000.
International Building Code, IBC 2003. International Code Council. United States of
America. 2003.
Minimum Design Loads for Buildings and Other Structures, ASCE 7-05. American
Society of Civil Engineers. Virginia. 2006.
National Climate Data Center. [Internet] 2006 [Accessed March 2006]
http://www.ncdc.noaa.gov/oa/ncdc.html
National Weather and Climate Center. [Internet] 2006. [Accessed March 2006]
http://www.wcc.nrcs.usda.gov/
O’Rourke M. Snow Loads: A guide to the Use and Understanding of the Snow Load
Provisions of ASCE 7-02. American Society of Civil Engineers. Reston, VA. 2004.
Sack R and Sheikh-Taheri A. Ground and Roof Snow Loads for Idaho. Department of
Civil Engineering, University of Idaho. Moscow, Idaho. 1986.
Sheik-Taheri A. Ground Snow Loads for the State of Idaho, A Thesis. University of
Idaho. Moscow, Idaho. April 1985.

109
Snow Load Analysis for Oregon. Structural Engineers Association of Oregon. 1971.
Snow Load Analysis for Washington, Second Edition. Structural Engineers Association
of Washington. 1995.
Snow Load Design Data for Colorado. Structural Engineers Association of Colorado.
1984.
Steel Construction Manual, 13th Edition. American Institute of Steel Construction. United
States of America. 2005.
World’s Single Largest Telescope Mirror Moves to the LBT. Space Daily, Your Portal to
Space [Internet]. November 4, 2003. [Accessed September 2005]
http://www.spacedaily.com/news/telescopes-03zr.html
Thom H. Distribution of Maximum Annual Water Equivalent of Snow on the Ground.
Monthly Weather Review, Vol. 94, No. 4. April 1966. pp. 265-71.
Tobiasson W and Greatorex A. Database and Methodology for Conducting Site Specific
Snow Load Case Studies for the United States. Snow Engineering; Recent Advances;
Proceedings of the Third International Conference on Snow Engineering. May 1996.
pp. 2249-256.
Uniform Building Code, UBC 1997. International Conference of Building Officials.
United States of America. 1997.
Recommended