34Centrum Equity Research is available on Bloomberg, Thomson Reuters and FactSet
Well casted at an inflection point We initiate coverage on Kirloskar Ferrous (KFIL) with a Buy and TP of Rs155 (56% upside). KFIL features i) a well invested asset base with spare capacity of 50%/25% in Castings/Pig Iron, ii) increasing share of high-margin casting business, iii) cost efficiencies from upcoming low-payback projects, iv) an enviable track record of converting cash profits to cash flows (5Y/10Y AOCF/CP ratio of 1x/0.9x) and v) strong earnings growth led by higher volumes and operating leverage, buttressed by a low D/E of 0.3x. Exciting future growth prospects await KFIL’s castings business which boasts of i) a strong product profile and customer relationships, ii) sustainable competitive strengths and iii) satisfactory demand visibility. We expect an impressive EBITDA/PAT CAGR of 28%/29% during FY17-20E driven by castings volume CAGR of 19% coupled with cost efficiencies. Finally, we believe that it merits rerating based on an attractive cash flow yield of 11.4%/15.9% (FY19E/20E).
� Hard yards covered in castings, strong growth underway: KFIL has alreadycompleted the augmentation of the value-added business of castings in the pastfew years and has invested heavily in i) increasing capacity by 50% to ~133ktpa, ii)adding machining facilities which fetch superior margins, iii) innovation and R&Dto reduce new product development cycle time from eight months to two months– a game changer achievement and iv) acquiring several marquee customersacross various segments. With its castings business having i) sustainable competitive strengths in a fragmented industry, ii) servicing steadily growing sectors like auto, tractor and diesel engines and iii) having well invested asset base with 50% spare capacity, KFIL is set to achieve a quantum leap in its castings volumes/turnover with CAGR of 19%/21% over FY17-20E and increase castings share in overall turnover to 51% by FY20E (from ~44% in FY18E).
� Pig iron business being made robust with meaningful cost improvement projects: KFIL has taken several steps to reduce its foundry grade pig iron business’vulnerability to the vagaries of commodity cycles (which too have become shorterand erratic in the recent past). Cost benefits are likely to accrue from H2FY18 from steps already implemented, such as i) BF-1 upgradation in FY17 and ii) coke sourcingthrough conversion arrangement at domestic third-party locations vs. imports. Big ticket cost improvement projects like i) installation of PCI system to replace ~80kgs of coke with low cost coal and ii) setting up of 200ktpa coke oven with 15 MW WHR CPP are likely soon and will improve the cost metrics of PI business materially from FY20E. Weexpect profitability of pig iron business to improve sharply, led by i) cost savings from low-payback projects, ii) higher volumes and iii) better spreads.
� Splendid combo of consistent cash flows, low D/E and spare capacity: KFILsports a solid combination of i) consistent cash flows with enviable track record ofconverting cash profits to cash flows (5Y/10Y AOCF/CP ratio of 1x/0.9x), ii) low D/Eof 0.3x and iii) well invested asset base with spare capacity of 50%/25% inCastings/Pig Iron. Additionally, KFIL is part of a pedigreed group run by highlyexperienced management professionals and scores highly on our corporategovernance framework. We expect sustainable improvement in return ratios led byimprovement in asset turnover and higher margins (driven by cost efficiency, better spreads and operating leverage) leading to attractive ROE of 25% in FY20E.
� Valuation and risks – Earnings at an inflection point, re-rating scope strong:We expect EBITDA/PAT CAGR of 28%/29% during FY17-20E, led by volume CAGRof 19% in the castings business coupled with cost efficiencies and operatingleverage leading to higher margins and strong improvement in return ratios. Wesee strong scope for re-rating and value KFIL using our conservative five-yearAOCF/EV yield methodology to arrive at a TP of Rs155, upside of ~56%. Key risksare lower volumes and raw material volatility. Currently, the stock has noinstitutional sell side coverage.
Target Price Rs155 Key Data
Bloomberg Code KKF IN
CMP* Rs99.4 Curr Shares O/S (mn) 137.3
Diluted Shares O/S(mn) 137.3
Upside 55.9% Mkt Cap (Rsbn/USDmn) 13.6/211.7
Price Performance (%)* 52 Wk H / L (Rs) 112/65.5
1M 6M 1Yr 5 Year H / L (Rs) 112/15
KKF IN 24.2 0.3 35.1 Daily Vol. (3M NSE Avg.) 244607
Nifty (3.1) 5.3 23.5
*as on 1 December 2017; Source: Bloomberg, Centrum Research
Shareholding pattern (%) *
Sep-17 Jun-17 Mar-17 Dec-16
Promoter 59.6 59.6 59.6 59.5
FIIs 0.6 0.6 0.6 0.5
DIIs 2.6 1.8 1.8 1.8
Others 37.2 38.0 38.0 38.2
Source: BSE, * as on 1 December 2017
Well invested asset base with spare capacity
Source: Centrum Research
Strong volume growth in castings underway
Source: Centrum Research Estimates
Sharp uptick in per tonne profitability in store
Source: Centrum Research Estimates
Abhisar Jain, CFA, [email protected], 91 22 42159928
Y/E Mar(Rs mn) Rev YoY (%) EBITDA EBITDA (%) PAT YoY (%) EPS (Rs) RoE (%) RoCE (%) P/E (x) EV/EBITDA (x)
FY16 11,139 (18.4) 1,509 13.6 578 17.4 4.2 12.2 11.0 12.5 5.5
FY17 11,337 1.8 1,756 15.5 907 56.9 6.6 16.9 14.0 11.4 6.3
FY18E 15,793 39.3 1,352 8.6 465 (48.7) 3.4 7.8 7.5 29.3 11.1
FY19E 17,086 8.2 2,467 14.4 1,179 153.5 8.6 17.9 14.6 11.6 6.3
FY20E 18,049 5.6 3,730 20.7 1,953 65.7 14.2 25.4 20.2 7.0 4.2
Source: Centrum Research Estimates
133000
390000
65892
291273
67108 98727
50%
25%
0%
50%
100%
0
500000
Castings Pig Iron
Tonne
Capacity Production
Spare Capacity Spare Capacity % - RHS
60396 57257 5666165892
8200097000
110000
45% 42% 42%49%
61%72%
81%
2.8% -5.2% -1.0%
16.3%24.4%
18.3%13.4%
-20%
0%
20%
40%
60%
80%
100%
0
20000
40000
60000
80000
100000
120000
FY14 FY15 FY16 FY17 FY18E FY19E FY20E
Volumes (Tonne) Utilisation - % YoY % - RHS
14428
15067
17126
14971
17137
19310
3969
4361
5497
3481
5821 8419
34.8
41.445.8 44.1
47.7 51.2
0
12
24
36
48
60
0
5000
10000
15000
20000
25000
FY15 FY16 FY17 FY18E FY19E FY20E
Rs/t
Gross Profit/t Blended EBITDA/t
Castings Share - % (RHS)
Metals BUY
Initiating Coverage 4 December 2017
INDIA
Kirloskar Ferrous

2 Kirloskar Ferrous
Table of Contents
Hard yards covered in castings, strong growth underway ................................................. 3
Leading castings producer with strong relationships in a growing industry ................................................ 3
Investment in building capacity and capability of castings division already done ..................................... 6
Strong volume growth in store, better product mix and economies of scale to enhance margins & profitability ........................................................................................................................................................................ 10
Pig iron business being made robust with meaningful cost improvement projects ...... 12
Foundry grade pig iron business with limited competition ............................................................................. 12
Spread contraction in last 12-18m hurt earnings, but recovery underway ................................................. 13
Third party coke manufacturing tie-up to reduce costs .................................................................................... 14
Low-payback backward integration projects being planned, cost metrics likely to improve significantly by FY20E .................................................................................................................................................... 15
Splendid combo of consistent cash flows, low debt/equity and spare capacity ............. 16
Spare capacity of 50%/25% in castings/pig iron businesses ............................................................................ 16
Asset turnover at a multi-year low, set to improve with higher utilisation ................................................. 16
Low leverage gives flexibility to pursue investment projects for cost savings and growth .................. 18
KFIL continues to pursue iron ore mines in Karnataka auctions and looking for attractive bidding price ..................................................................................................................................................................................... 18
Financial Analysis – Earnings at an inflection point .......................................................... 19
Revenue growth to be aided by solid volume growth in castings segment .............................................. 19
EBITDA margins to trend upwards, driven by increasing share of high margin castings and cost saving initiatives .............................................................................................................................................................. 19
Return ratios should inch higher with major uptick in FY20E .......................................................................... 20
Strong dividend payout track record ....................................................................................................................... 20
Key Assumptions and Sensitivity ....................................................................................... 21
Valuation – Strong scope for re-rating, Initiate with Buy and TP of Rs155 ..................... 22
AOCF/EV valuation – 40% premium ascribed to historical AOCF/EV yield .................................................. 22
EV/EBITDA valuation – 25% premium ascribed to historical EV/EBITDA ...................................................... 22
KFIL trading at attractive adjusted cash flow yield, leaving scope for re-rating ........................................ 23
Key risks to our thesis .......................................................................................................... 25
Company Background ......................................................................................................... 26
Corporate governance check – highlighting the finer points .......................................... 27
Independent directors’ representation on the board – KFIL has good balance ........................................ 27
Independent directors’ profile and compensation analysis ............................................................................. 28
Promoter group compensation analysis – as good as it gets .......................................................................... 29
Contingent liability ......................................................................................................................................................... 30
Related party transaction – clean history ................................................................................................................ 31
Auditor pedigree ............................................................................................................................................................. 31
Annexure – Indian Foundry (Castings) Industry ................................................................ 33
Financials - Historical ........................................................................................................... 37
Financials .............................................................................................................................. 38

3 Kirloskar Ferrous
Hard yards covered in castings, strong growth underway
Leading castings producer with strong relationships in a growing industry
KFIL’s pig iron business is forward-integrated into castings which is expected to account for ~44% of its overall sales in FY18E. Castings is the value added business in KFIL’s basket and the company has invested massively in both asset and capability development which has provided the base for a quantum leap in the castings division’s volumes/turnover with CAGR of 19%/21% expected over FY17-20E through higher utilisation of its existing world class asset base. We expect the share of castings business in overall turnover of KFIL to reach ~51% by FY20E
KFIL is a leading castings producer in India and possesses niche capabilities with production of grey iron and spheroidal graphite iron castings - key components for automobile, tractor and diesel engine OEMs. KFIL has made substantial investments in its castings business in the past two decades and painstakingly developed strong capabilities, giving it a substantial edge over competitors. KFIL also possesses strong customer relationships in a steadily-growing industry and has a well-invested asset base with significant spare capacity that provides a solid platform for strong growth. We discuss KFIL’s castings business in detail below (including industry snapshot) and then discuss the capabilities of KFIL in next section which gives us confidence in the company’s growth potential.
� Castings products of KFIL: KFIL’s foundries, located at Hospet (Koppal plant, Karnataka) andSolapur (Maharashtra) are equipped to produce Grey Iron & S.G Iron Castings for a variety ofapplications such as cylinder blocks, cylinder heads and different types of housings required byautomobile, tractor, and diesel engine Industries. A large share of production consists ofcomponents developed for the automotive sector, which includes trucks, agriculture and roadconstruction machinery, industrial and marine engines, among others. The parts manufacturedinclude engine blocks, heads, housings and components for brakes, transmission systems andaxles. KFIL has the capacity of 133 ktpa in castings in its two plants.
Exhibit 1: Cylinder blocks Exhibit 2: Cylinder heads
Source: Centrum Research Source: Centrum Research
Exhibit 3: Tractor housings Exhibit 4: SG castings & others
Source: Centrum Research Source: Centrum Research

4 Kirloskar Ferrous
� Marquee client base across auto, tractors, engines and other segments: In automobiles, KFILservices mainly the commercial vehicle (CV) segment and has a well-diversified client base,comprising all leading OEM’s. Within tractors, the company supplies to all large players and hasbeen successful in adding new customers. In the non-auto segment, KFIL services few engineproducers and construction equipment manufacturing companies.
Exhibit 5: KFIL FY17 castings sales by customer segments Exhibit 6: KFIL FY17 casting sales by product segments
Source: Centrum Research Source: Centrum Research
� Domestic castings industry growing at ~5% CAGR: Within this industry whose total productionstood at 11.4 MT in FY17, grey iron castings account for ~70% of the overall market (~8 MT). Theproduction CAGR in the industry for total castings/grey iron castings was at 5%/5.6% over FY14-17. As per various industry sources including snippets offered by the Institute of IndianFoundrymen (IIF), the industry is well poised for much stronger growth in the next five years, driven by higher demand.
Exhibit 7: Castings production in India Exhibit 8: Castings production in India - CAGR trend
Source: IIF, Centrum Research Source: IIF, Centrum Research
47.0%
43.0%
10.0%
Auto
Tractor
Diesel Engines
13.0%
22.0%
32.0%
33.0%
Cylindrical Head
Cylindrical Block
Housings
W/J Block/SG Castings
0
2
4
6
8
10
12
14
FY07 FY10 FY12 FY17
MT
Grey Cast Iron Spheroidal Graphite Iron Malleable Steel Non-Ferrous
7.2 7.4
10.0
11.4
5.6%
3.0%
4.9%5.0%
2.6%
4.7%
0%
1%
2%
3%
4%
5%
6%
3Y (FY14-17) 5Y (FY12-17) 10Y (FY07-17)
Grey Iron Castings Total
5 Kirloskar Ferrous
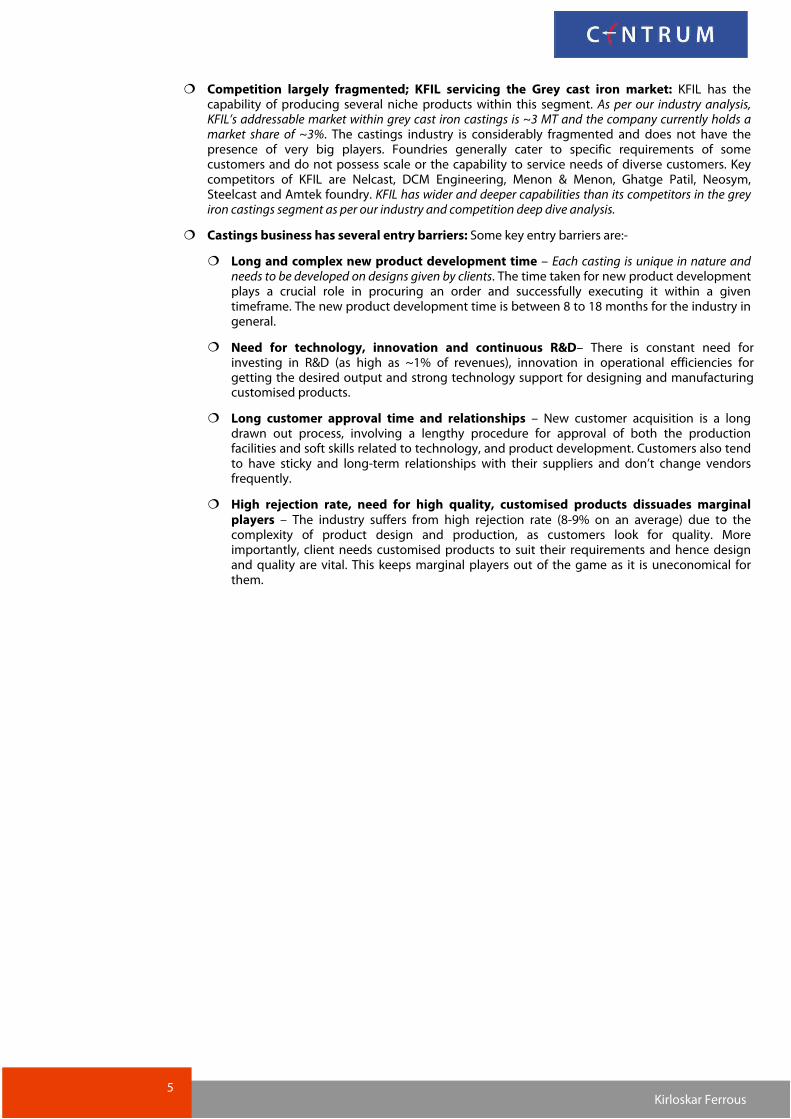
� Competition largely fragmented; KFIL servicing the Grey cast iron market: KFIL has thecapability of producing several niche products within this segment. As per our industry analysis, KFIL’s addressable market within grey cast iron castings is ~3 MT and the company currently holds a market share of ~3%. The castings industry is considerably fragmented and does not have thepresence of very big players. Foundries generally cater to specific requirements of somecustomers and do not possess scale or the capability to service needs of diverse customers. Keycompetitors of KFIL are Nelcast, DCM Engineering, Menon & Menon, Ghatge Patil, Neosym,Steelcast and Amtek foundry. KFIL has wider and deeper capabilities than its competitors in the greyiron castings segment as per our industry and competition deep dive analysis.
� Castings business has several entry barriers: Some key entry barriers are:-
� Long and complex new product development time – Each casting is unique in nature andneeds to be developed on designs given by clients. The time taken for new product developmentplays a crucial role in procuring an order and successfully executing it within a giventimeframe. The new product development time is between 8 to 18 months for the industry ingeneral.
� Need for technology, innovation and continuous R&D– There is constant need for investing in R&D (as high as ~1% of revenues), innovation in operational efficiencies for getting the desired output and strong technology support for designing and manufacturing customised products.
� Long customer approval time and relationships – New customer acquisition is a longdrawn out process, involving a lengthy procedure for approval of both the productionfacilities and soft skills related to technology, and product development. Customers also tendto have sticky and long-term relationships with their suppliers and don’t change vendorsfrequently.
� High rejection rate, need for high quality, customised products dissuades marginalplayers – The industry suffers from high rejection rate (8-9% on an average) due to thecomplexity of product design and production, as customers look for quality. Moreimportantly, client needs customised products to suit their requirements and hence designand quality are vital. This keeps marginal players out of the game as it is uneconomical forthem.

6 Kirloskar Ferrous
Investment in building capacity and capability of castings division already done
KFIL has made huge strides in not only building up capacity in its castings division but also in developing niche capabilities that give it an edge over competitors and paves way for strong volume growth in the coming years. We discuss these in detail below:-
� Impressive capacity build-up by KFIL in castings division: KFIL has made significant investments in its castings division over the past 10 years and built up a strong production base at Solapur and Hospet (Koppal) plants. The company acquired the Solapur plant in 2008 and subsequently set up a new line of 40 ktpa at the plant while abandoning the old lines completely. At its Koppal plant, KFIL set up the new line in FY13-14 with a capacity of 48 ktpa at a competitive capex. The new lines are highly robotized and efficient. KFIL has also invested in setting up machining facilities at Solapur and more recently at Koppal, providing strong value addition.
Exhibit 9: Capacity build-up in castings
Source: Centrum Research
� Focus on increasing sales of higher margin machined castings: KFIL is also focussed on increasing the sales of machined castings, which adds substantial value and fetches much higher margins. While non-machined castings fetch a realisation of ~Rs80/kgs, machined castings fetch an additional Rs40-50/kg and the company makes EBITDA margins of ~40% on the additional realisations. KFIL is currently doing machining jobs of ~10% of its overall casting volumes but intends to spend further on building more machining facilities for value addition. Machining capabilities also attract more customers who want highly value added machined castings. The payback on the investment done for machining is 4-5 years and currently the company is procuring more orders for machining work.
Exhibit 10: Machining facilities in castings division of KFIL
Source: Centrum Research, *Koppal capacity of machining is on ballpark basis
45,000 45,000
93,000
40000 40000
4000048000
-
20,000
40,000
60,000
80,000
1,00,000
1,20,000
1,40,000
FY06 FY08 FY09 FY14 FY17
Tonne/year
Koppal Solapur New Line Solapur Koppal New Line
45000
95000
133000
24000
48000 48000
48000 48000
24000
0
20000
40000
60000
80000
100000
120000
140000
FY08 FY14 FY18
Nos
Solapur - Heads Solapur - Blocks Koppal*
7 Kirloskar Ferrous
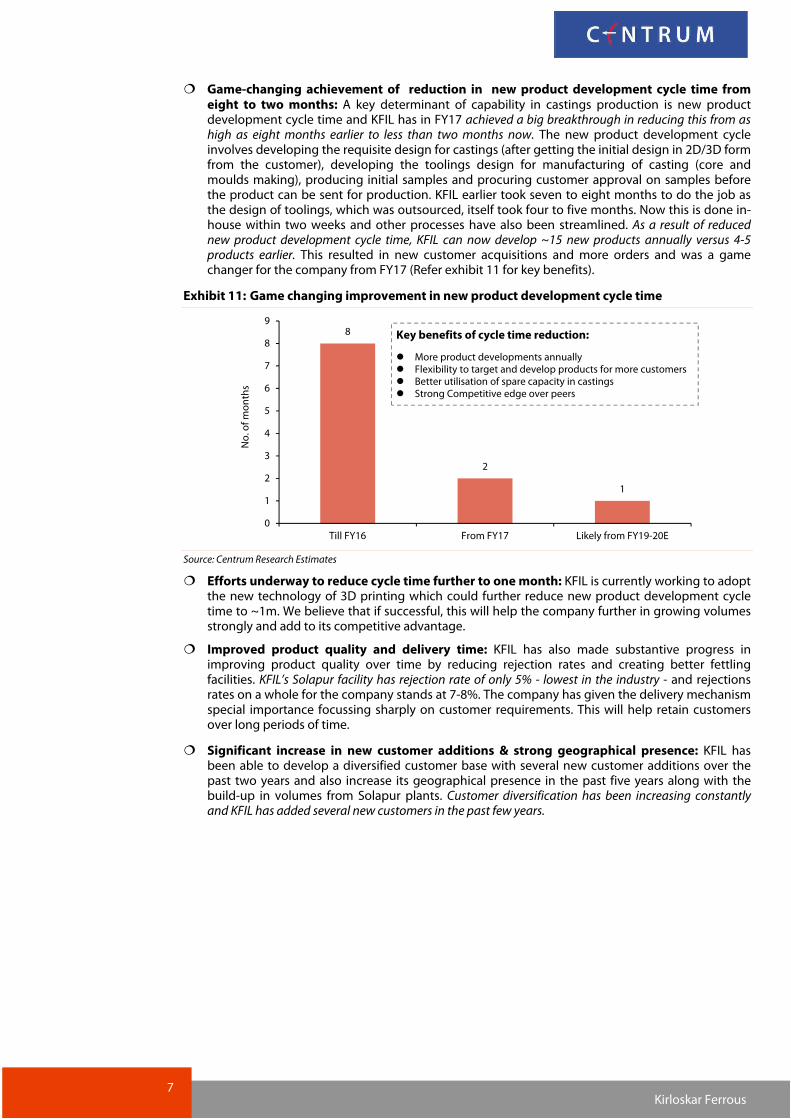
� Game-changing achievement of reduction in new product development cycle time from eight to two months: A key determinant of capability in castings production is new product development cycle time and KFIL has in FY17 achieved a big breakthrough in reducing this from as high as eight months earlier to less than two months now. The new product development cycle involves developing the requisite design for castings (after getting the initial design in 2D/3D form from the customer), developing the toolings design for manufacturing of casting (core and moulds making), producing initial samples and procuring customer approval on samples before the product can be sent for production. KFIL earlier took seven to eight months to do the job as the design of toolings, which was outsourced, itself took four to five months. Now this is done in-house within two weeks and other processes have also been streamlined. As a result of reduced new product development cycle time, KFIL can now develop ~15 new products annually versus 4-5 products earlier. This resulted in new customer acquisitions and more orders and was a game changer for the company from FY17 (Refer exhibit 11 for key benefits).
Exhibit 11: Game changing improvement in new product development cycle time
Source: Centrum Research Estimates
� Efforts underway to reduce cycle time further to one month: KFIL is currently working to adopt the new technology of 3D printing which could further reduce new product development cycle time to ~1m. We believe that if successful, this will help the company further in growing volumes strongly and add to its competitive advantage.
� Improved product quality and delivery time: KFIL has also made substantive progress in improving product quality over time by reducing rejection rates and creating better fettling facilities. KFIL’s Solapur facility has rejection rate of only 5% - lowest in the industry - and rejections rates on a whole for the company stands at 7-8%. The company has given the delivery mechanism special importance focussing sharply on customer requirements. This will help retain customers over long periods of time.
� Significant increase in new customer additions & strong geographical presence: KFIL has been able to develop a diversified customer base with several new customer additions over the past two years and also increase its geographical presence in the past five years along with the build-up in volumes from Solapur plants. Customer diversification has been increasing constantly and KFIL has added several new customers in the past few years.
8
2
1
0
1
2
3
4
5
6
7
8
9
Till FY16 From FY17 Likely from FY19-20E
No. of months
Key benefits of cycle time reduction:
� More product developments annually� Flexibility to target and develop products for more customers� Better utilisation of spare capacity in castings� Strong Competitive edge over peers

8 Kirloskar Ferrous
� Strong focus on R&D capability: KFIL has spent ~Rs115mn on R&D in the past two years, which amounts to ~0.5% of sales and ~2% of overall other expenses. The benefits of R&D, as per company’s annual report, has been in the following areas:
� Reduction of new product development cycle time.
� Acquiring of capability of developing critical castings.
� Improved quality and consistency.
� Initiation of prototype casting development through core 3D printing technology.
� Higher productivity through changes in designs of moulds/patterns.
Exhibit 12: R&D spend of KFIL
Source: Centrum Research
� Setting up a 10MW solar power plant at Solapur to reduce power cost: KFIL is currently setting up this plant at a capex of ~Rs500mn at its Solapur castings facility for captive use, which is likely to get commissioned by Q4FY18E. The operational cost of solar power is likely to be less than Rs2/unit and should cater to ~50% of the Solapur plant’s power requirement. The power cost at Solapur plant is currently north of Rs7/unit; our rough estimates suggest cost savings of ~Rs88mn/Rs61mn at EBITDA/PBT level from solar CPP from FY19E and thus translate to a payback of ~5 years from the project.
Exhibit 13: Significant power cost savings form Solar CPP
EBITDA Level PBT Level
Solar CPP Capacity (MW) 10 10
PLF - % 20 20
Power Production (mn units) 17.5 17.5
Cost/unit (Rs/unit) 2 3.5
Power Purchase Cost (Rs/unit) 7 7
Power cost savings (Rs/unit) 5 3.5
Total Savings (Rs mn) 88 61
Source: Centrum Research Estimates
70.4
43.7
0.6
0.4
2.3
1.5
0.0
0.5
1.0
1.5
2.0
2.5
0
10
20
30
40
50
60
70
80
FY16 FY17
Rs mn
R&D Spend - LHS as % of sales as % of other expenses

9 Kirloskar Ferrous
� Large investments already in place; monetisation of the same in store: As discussed in detail in the current section already, KFIL has made large investments in castings and with crucial capabilities such as quicker new product development time and marquee customer relationships already in place, the stage is set for monetisation of the existing robust asset base through higher capacity utilisation. We expect KFIL to sweat its asset base in castings; note that capacity utilisation at its Koppal/Solapur plant stood at just 44%/62% in FY17, thereby leaving large room for growth. We expect investments in castings business to be focussed incrementally on machining for the next 2-3 years and hence the capex in this business should be limited to ~Rs250-300mn/year.
Exhibit 14: Investments in castings business
Investments done in Castings Business over last 5 years
Set-up of new line (48000 ktpa) at Koppal in FY14
Set-up of new machine shop at Solapur in FY14
Set-up of new machine shop at Koppal in FY18
Set-up of fettling facilities in Solapur in FY17
Investment in R&D to reduce new product development cycle time and improve product quality
Source: Centrum Research
Exhibit 15: Enough room for capacity utilisation improvement going ahead
Source: Centrum Research
93000
40000
133000
41192
24700
6589244%
62%
50%
0%
10%
20%
30%
40%
50%
60%
70%
0
20000
40000
60000
80000
100000
120000
140000
Koppal Solapur Total
Tonne/yr
Capacity Volumes Utilisation - RHS

10 Kirloskar Ferrous
Strong volume growth in store, better product mix and economies of scale to enhance margins & profitability
KFIL has come a long way in the castings business by developing key competencies over time and simultaneously increasing capacities (as explained in detail already in previous sections) and we expect strong volume growth, driven by increased mining of existing customers as well as acquisition of new customers. We also expect better product mix and economies of scale to augment margins, culminating in strong earnings growth from the castings business.
� We expect castings volume CAGR of 18.6% during FY17-20E: We expect KFIL to clock impressive volume CAGR of 18.6% in castings division during FY17-20E with total volumes growing to 110kt by FY20E (versus 66kt in FY17). Revenue growth is likely to increase at a fast clip led by better product mix (increased share of special castings and machined castings) and sales should rise to Rs9.2bn in FY20E (~1.8x of FY17 levels of Rs5.2bn).
Exhibit 16: Castings volumes up-trend Exhibit 17: Revenue growth to remain solid
Source: Centrum Research Estimates Source: Centrum Research Estimates
� Focus on cost optimisation, higher share of machined castings and economies of scale to augment castings margins: The castings business enjoys a high gross profit/t and we expect this to improve as share of castings in the overall mix increases to 51% by FY20E (Refer exhibits 18 & 19). We expect strong margin tailwinds for the castings business for KFIL because of i) a sharp increase in volumes providing economies of scale, ii) higher share of machined castings that fetch substantially higher margins and iii) focus on cost optimisation through set-up of captive power plant at Solapur, and other cost saving exercises.
Exhibit 18: Castings gross profit/t trend Exhibit 19: KFIL gross profit/t to move up led by higher share of castings
Source: Centrum Research Estimates Source: Centrum Research Estimates
60396 57257 5666165892
82000
97000110000
45% 42% 42%49%
61%72%
81%
2.8% -5.2% -1.0%
16.3%24.4%
18.3% 13.4%
-20%
0%
20%
40%
60%
80%
100%
0
20000
40000
60000
80000
100000
120000
FY14 FY15 FY16 FY17 FY18E FY19E FY20E
Volumes (Tonne) Utilisation - % YoY % - RHS
4,600 4,745 4,607
5,191 6,970
8,148
9,240
4.1%3.1%
-2.9%
12.7%
34.3%
16.9%13.4%
-5%
5%
15%
25%
35%
1,000
3,000
5,000
7,000
9,000
11,000
FY14 FY15 FY16 FY17 FY18E FY19E FY20E
Sales (Rs mn) YoY % - RHS
40,000
45,000
50,000
55,000
60,000
65,000
FY14 FY15 FY16 FY17 FY18E FY19E FY20E
Rs/t
12971
14428
15067
17126
14971
17137
19310
37.334.8
41.445.8 44.1
47.751.2
0
10
20
30
40
50
60
10000
12000
14000
16000
18000
20000
FY14 FY15 FY16 FY17 FY18E FY19E FY20E
KFIL - Gross Profit/t (Rs) Castings - % Share - RHS

11 Kirloskar Ferrous
� Growing volumes of industry & key clients => Higher volumes for KFIL castings division: Analysis of sales volume data of CV and tractor industry indicates that i) CV industry is showing steady single digit growth in last few years but market shares of M&M and VECV have been inching up, and ii) tractor industry sales growth is on fast track coupled with increase in market share of Mahindra brand of tractors. KFIL is set to witness strong volume growth with increase in volumes of existing clients with whom the company enjoys a long term relationship coupled with acquisition of new clients.
Exhibit 20: CV industry volume trend Exhibit 21: Market share of KFIL’s clients increasing
Source: SIAM, Centrum Research, *YTD nos annualised Source: SIAM, Centrum Research
Exhibit 22: Tractor industry volume trend Exhibit 23: Market share trend in tractor industry
Source: SIAM, Centrum Research, *YTD nos annualised Source: SIAM, Centrum Research
873258
709776
701014
788828
822495
832232
0
2,00,000
4,00,000
6,00,000
8,00,000
10,00,000
FY13
FY14
FY15
FY16
FY17
YTDFY18A*
Nos
M&HCV LCV Total CV
55.950.8
47.945.4 44.4 43.5
20.525.5 25.1 24.8 25.1 26.6
7.511.4
14.9 17.8 17.6 17.5
5.4 5.5 6.0 6.6 7.1 6.80
10
20
30
40
50
60
FY13 FY14 FY15 FY16 FY17 YTDFY18
%
Tata Motors M&M
Ashok Leyland Volvo Eicher (VECV)
527737
634151
551463
493764
582844
676099
20.2%
-13.0% -10.5%
18.0%16.0%
-20.0%
-10.0%
0.0%
10.0%
20.0%
30.0%
300000
400000
500000
600000
700000
FY13
FY14
FY15
FY16
FY17
YTDFY18A
Nos
Tractor Domestic Sales YoY - %
40.2 40.6 40.1 40.9 42.6
25.0 24.7 24.4 23.020.5
11.7 10.7 10.4 10.3 10.8
9.7 10.3 12.0 11.9 11.9
0
10
20
30
40
50
FY13 FY14 FY15 FY16 FY17
%
M&M TAFE Escorts Sonalika

12 Kirloskar Ferrous
Pig iron business being made robust with meaningful cost improvement projects
Foundry grade pig iron business with limited competition
KFIL produces foundry grade pig iron (FGPI) through its two blast furnaces (MBF1 & 2) and has an installed capacity of 3.9 lakh tpa. KFIL consumes ~15% of pig iron in-house in its castings division and sells the remaining in the merchant market to various foundries through an extensive pan-India dealer network. The FGPI business is characterised by lower competition, higher prices and better margins as compared to steel grade pig iron (SGPI) but remains exposed to cyclical movements in raw material and product prices.
� Pig iron demand-supply remains largely balanced: Pig iron market in India is characterised by supplies from a large number of small producers and demand is generally driven by i) foundries (for making of castings for various end-user industries) and ii) steel producers (as feed into SMS/induction furnaces to form appropriate metallic mix) for making finished steel. Pig iron is usually of two types: steel grade (SGPI) and foundry grade (FGPI) and is manufactured and supplied by various producers having mini blast furnaces in the secondary steel sector. Large producers account for only 10% of the market and include mainly the PSU’s like SAIL & RINL. The pig iron market in India has been passing through a subdued phase with flattish consumption for the last three years, but the market remains largely balanced as supply too has not increased and remains flattish at ~9.5 MT annually.
Exhibit 24: Pig iron demand-supply
FY13 FY14 FY15 FY16 FY17 YTDFY18
Production for Sale 6.9 8.0 9.7 9.2 9.5 5.4
Production growth % 27.9 15.7 21.9 (4.8) 2.4 (2.9)
Import 0.0 0.0 0.0 0.0 0.0 0.0
Exports 0.4 0.9 0.5 0.3 0.4 0.3
Exports as % of production 6.0 11.9 5.6 3.2 4.1 5.7
Net Exports 0.4 0.9 0.5 0.3 0.4 0.3
Consumption 6.5 7.1 9.1 9.0 9.1 5.1
Consumption growth % 30.7 9.4 27.4 (0.4) 0.5 (3.1)
Source: Joint planning commission, Centrum Research
� Foundry grade pig iron less competitive, fetches better prices and margins: While the foundry grade pig iron (FGPI) market is less than 20% of overall pig iron market, the number of producers in foundry grade market is limited, as manufacturing of foundry grade requires keeping sulphur and phosphorous at a lower level and also needs better quality iron ore. While foundry grade pig iron is also a commodity like steel grade pig iron, but limited competition in FGPI enables it to fetch better prices and margins compared to steel grade pig iron.
� Upgradation of MBF1 in FY17 => reduced coke consumption, higher capacity: KFIL has completed a crucial upgrade of its mini blast furnace 1 (MBF1) in FY17 at a capex of ~Rs400mn. The upgradation was aimed at i) increasing the working volume of the furnace to 300m3 resulting in an increase of MBF1 capacity by ~30ktpa, ii) reducing the coke rate through better operational working and iii) paving the way for future installation of pulverised coal injection plant for both MBF1 & 2. The MBF1 has been re-blown at a higher capacity since Jan’17. KFIL’s overall pig iron manufacturing capacity has increased to 1100 tpd (3.9 lakh tpa) and company is also looking to upgrade MBF-2 in due course, post which the capacity would increase to 1250 tpd (4.25 lakh tpa). The company expects the capex for upgradation of MBF2 to be between Rs400 and 500mn.

13 Kirloskar Ferrous
Spread contraction in last 12-18m hurt earnings, but recovery underway
KFIL’s pig iron business has seen substantial spread contraction in the past 12 to 18 months due to a sharp increase in coke/coking coal prices, which was not accompanied by a commensurate increase in pig iron prices. However, raw material prices have recently started stabilising at lower levels, while pig iron prices are showing resilience and hence spread recovery is underway. Additionally, KFIL has already initiated several cost reduction measures for reducing the volatility in spreads of the pig iron business. We expect gross profit/t for KFIL’s pig iron business to improve from H2FY18 from the distress levels of H1FY18.
� Large increase in coke prices has hurt spreads in last 12-18 months: Coke prices have more than doubled in the last 18 months on account of supply disruptions in coking coal; this led to a sharp squeeze in the difference between pig iron and coke prices, as pig iron prices in the domestic market couldn’t mirror similar gains (refer Exhibit 25 & 26). In the last few months, coke prices have softened 25% from the peak while pig iron has remained steady to marginally positive, thereby brightening the spread situation.
Exhibit 25: Coke & coking coal prices have more than doubled in last 18m
Exhibit 26: Difference between pig iron and coke prices reduced, squeezed spreads
Source: Steelmint, Centrum Research Source: Steelmint, Centrum Research
� Spreads have bottomed out, improvements underway aided by cost improvement initiatives: Pig iron spreads have been under pressure in the past one year and have been trending well below their long-term average. We see improvements in spreads already underway and expect the same to further improve. However, we remain conservative in our assumptions for improvement in gross profit/t of pig iron business and have factored in gross profit/t of Rs3984/5657 in FY19E/20E as compared to the last five-year average of ~Rs6200/t. Moreover, a major portion of our recovery assumptions is based on several cost improvement initiatives that KFIL is taking (explained in detail in the next section) and not purely on market related improvement in spreads. Improvement in gross profit/t from current distressed levels would help KFIL see its profitability in pig iron business stabilising by Q4FY18E, in our view.
Exhibit 27: KFIL’s pig iron gross profit/t trend – we expect recovery but remain conservative
Source: Centrum Research Estimates
0
100
200
300
400
May-15
Jul-15
Sep-15
Nov-15
Jan-16
Mar-16
May-16
Jul-16
Sep-16
Nov-16
Jan-17
Mar-17
May-17
Jul-17
Sep-17
Nov-17
US$/t
Coke (Met Coke 64% China - CNF India)
Coking Coal (HCC 8% Ash - CNF India)
Sharp increase seen in last 12-18 months 4000
8000
12000
16000
20000
5000
10000
15000
20000
25000
30000
May-15
Jul-15
Sep-15
Nov-15
Jan-16
Mar-16
May-16
Jul-16
Sep-16
Nov-16
Jan-17
Mar-17
May-17
Jul-17
Sep-17
Nov-17
Rs/t
Rs/t
Pig Iron (Foundry Grade - Ex Kharagpur)Met Coke import landed (from China)Spread (PI - 0.7x Coke)
6223
5023
6846
63696713
2809
3984
5657
2,000
3,000
4,000
5,000
6,000
7,000
8,000
FY13 FY14 FY15 FY16 FY17 FY18E FY19E FY20E
Rs/t

14 Kirloskar Ferrous
Third party coke manufacturing tie-up to reduce costs
KFIL has been procuring coke mainly through imports till now and was thus getting adversely impacted by the increase in international coke prices. But the company is likely to have tied up with two domestic coke manufacturers for a third party conversion of coking coal into coke exclusively for KFIL, at a fixed conversion cost. This arrangement is likely to yield substantial cost savings of ~Rs1570/t of coke and ~Rs300mn annually at the current coking coal and coke prices as per our estimates.
� Coke manufacturing being done at third party coke plants: KFIL is likely to have tied up with two third party plants in Karnataka and Tamil Nadu for exclusive third-party conversion of coking coal into coke. The volume tie-up is for a quantity of ~10,000 tonne/month with each supplier and the agreed conversion cost is approx. Rs2000/t. KFIL is targeting savings on coke procurement through this arrangement while the producers are looking for fixed return on their capacities without taking on commodity price movement risk.
� Coke cost reduction of ~Rs1570/t vs. imports at current prices: Our calculations on potential cost savings and workings on comparison of landed cost of coke from third party arrangement vs. imports indicates a saving of ~Rs1570/t on coke landed cost for KFIL (Exhibit 28, 29 & 30 below). We note that savings on coke are dynamic in nature and dependent on the prevailing prices of coking coal and imported coke. This translates to ~Rs1100/t in savings on pig iron manufacturing, implying annual savings of ~Rs300mn at current prices. We believe KFIL can realise a significant portion of this despite volatility in both coking coal and coke prices and this would help the company to manage its spreads in the pig iron business better. The coke supply arrangements with suppliers can be terminated at short notice if it becomes non-remunerative for KFIL.
Exhibit 28: 3rd party coke landed cost for KFIL Exhibit 29: Imported coke landed cost for KFIL
Hard Coking Coal Aus - CNF India – US$/t 195
Import Duty (2.5%) – US$/t 4.9
Port Charges – US$/t 5
Ex-Port Coking Coal Price US$/t 205
USD/INR 65
Ex-Port Coking Coal Price Rs/t 13,317
Internal Freight (Port to 3rd Party Coke Plants) – Rs/t 1,000
Coking Coal Landed Cost at 3rd Party – Rs/t 14,317
Coking coal reqd. for conversion to coke 1.42
Total Coking Coal Cost for making 1 tonne of Coke – Rs/t 20,330
Conversion Charges paid to 3rd party – Rs/t 2,000
Freight from 3rd party plant to KFIL plant – Rs/t 550
Landed cost of Coke at KFIL plant – Rs/t (A) 22,880
Met Coke 64% China - CNF India – US$/t 315
Import Duty (5%) – US$/t 15.8
Anti-dumping duty – US$/t 25
Port Charges – US$/t 5
Ex-Port Coking Coal Price US$/t 361
USD/INR 65
Ex-Port Coking Coal Price Rs/t 23,449
Freight from port to KFIL plant – Rs/t 1,000
Landed cost of Coke at KFIL plant – (B) 24,449
Source: Centrum Research Estimates Source: Centrum Research Estimates
Exhibit 30: Coke savings snapshot
Price differential of imported coke vs 3rd party converted coke (B-A) - (Rs/t) 1,569
Coke reqd/t of Pig Iron 0.72
Savings per tonne of Pig Iron (Rs/t) 1,130
Coke quantity tied up on annual basis 2,40,000
Likely quantity received (80%) 1,92,000
Annual Savings (Rs mn) 301
Source: Centrum Research Estimates

15 Kirloskar Ferrous
Low-payback backward integration projects being planned, cost metrics likely to improve significantly by FY20E
KFIL is in a strong position to pursue backward integration projects with a low payback in its pig iron business thereby making the business more robust across cycles. These projects will address the issue of sourcing of coke and are likely to improve the cost metrics significantly.-
� Installation of Pulverised Coal Injection for full pig iron capacity => 80kg of cheap coal to replace high cost coke: KFIL is likely to install a pulverised coal injection unit for its mini blast furnaces (MBFs) at a capex outlay of ~Rs350mn. PCI set-up allows MBFs to charge 80kg of low-cost pulverised coal for production of hot metal thereby replacing high-cost coke to that extent. As KFIL has upgraded one of its MBFs and is also looking at upgrading another soon, installation of PCI is the next natural step in the value chain and would help the company in realising crucial savings. We estimate a cost differential of US$120/t on a normalised basis between pulverised coal and coke. We also estimate annual savings of ~Rs240mn for KFIL’s pig iron production of ~380 ktpa in FY20E, on replacement of 80kg of coke with low cost coal. We expect the PCI investment announcement before FY18E-end and commissioning before FY19-end thereby resulting in savings from FY20E. The payback for this capex is likely to be less than two years.
Exhibit 31: PCI project savings snapshot
Coke Replacement by PCI 80 Kgs
Total Coke Replaced/yr 30,600
Cost Difference (US$/t) 120
USD/INR 65
Cost Difference (Rs/t) 7,800
Total Savings/yr (Rs mn) 239
Source: Centrum Research Estimates
� Set-up of 200 ktpa coke oven with associated WHR CPP of 15MW: KFIL is likely to set up captive coke oven batteries with a capacity of 200ktpa, along with associated waste heat recovery CPP of 15MW at a total capex of ~Rs2.5bn at its Koppal plant. It has already acquired requisite land of ~80 acres adjacent to its plant and has taken EC and pollution clearances for the project. This project will provide ~75% of its coke requirement and low cost power generated from WHR CPP can be utilised in the castings business that currently sources power at a very high rate of ~Rs6.5/unit. We expect material savings on an overall basis (refer exhibit 32) from the project and a payback of less than four years.
Exhibit 32: Coke & WHR power project savings snapshot
Coke Making Waste Heat Power Generation
Savings on Captive Conversion v/s Third Party Conversion (US$/t)
15 Captive WHR Power 15 MW
Coke Capacity (tonne) 200000 Net PLF 80%
Coke Savings (US$ mn) 3 Power Generated (mn units) 105
USD/INR 65 Power Savings (Rs/unit) 5
Coke Savings (Rs mn) 195 Power Savings (Rs mn) 525
Total Coke+Power Savings (Rs mn) 720
Source: Centrum Research Estimates
Exhibit 33: Capex likely to be undertaken – Likely earnings accretion & payback period
Project Project Type Project Size Capex to be incurred
by KFIL (Rs mn)
Likely Savings/Additional EBITDA (Rs mn)
Likely Payback
PCI for BF Operational efficiency NA 350 240 <2 yrs
Coke BOOT route + WHR CPP Backward integration Coke - 200 ktpa, WHR CPP - 15 MW
2500 720 <4 yrs
Source: Centrum Research Estimates

16 Kirloskar Ferrous
Splendid combo of consistent cash flows, low debt/equity and spare capacity
Spare capacity of 50%/25% in castings/pig iron businesses
KFIL has spare capacity of 50%/25% in castings/pig iron as both businesses are well endowed with substantial investments made in the past few years. Castings has spare capacity at both Solapur and Koppal plants and with reduction in new product development cycle time already achieved, both plants are likely to see better utilisation. KFIL has focussed on building its capabilities in the past few years and has set itself up strongly for volume growth from FY18E onwards. We believe that volume growth will be strong in the years ahead as existing assets get better utilised. This will be driven by i) long-standing, vital customer relationships and quicker product development in castings, and ii) higher operational efficiency of blast furnaces for pig iron.
Exhibit 34: Snapshot of capacity and utilisations in KFIL’s castings/pig iron businesses
Source: Centrum Research
Asset turnover at a multi-year low, set to improve with higher utilisation
KFIL has been allocating capital in the past five years to projects on forward integration (increase in castings capacity for value addition and higher profitability) and operational efficiency (upgradation of blast furnace for cost savings and expansion). While the gross block has expanded by ~70% (over FY13-17), volumes and turnover have remained largely flat. Asset turnover in FY17 was at a multi-year low of 1.2x (versus 1.9x in FY13) and we see improvement in asset turnover led by higher utilisation of the existing solid asset base.
Exhibit 35: Revenue/Gross block trend
Source: Centrum Research Estimates
133000
390000
65892
291273
6710898727
50%
25%
0%
10%
20%
30%
40%
50%
60%
0
100000
200000
300000
400000
500000
Castings Pig Iron
Tonne
Capacity Production Spare Capacity - RHS Spare Capacity - RHS
1.9
1.5
1.6
1.21.2
1.5 1.5
1.3
1.0
1.2
1.4
1.6
1.8
2.0
0
4000
8000
12000
16000
20000
FY13 FY14 FY15 FY16 FY17 FY18E FY19E FY20E
Rs mn
Revenues Gross Block Rev/GB (x) - RHS

17 Kirloskar Ferrous
Strong conversion of cash profit into adjusted operating cash flows (excl. interest) => hallmark of a well-run business
We believe that one of the key signals of prudent capital management is conversion of cash profits (CP) into adjusted operating cash flows (AOCF=OCF-Interest). KFIL boasts of an enviable track record of conversion of cash profits to cash flows (5Y/10Y AOCF/CP ratio of 1x/0.9x). This in turn has resulted in greater flexibility to undertake capex and reduce debt. We expect KFIL to continue to convert majority of its cash profits into cash flows going forward.
Exhibit 36: AOCF/CP trend
Source: Centrum Research Estimates
Working capital management remains sound
KFIL’s integrated business is not working capital-intensive and the management has done a good job in controlling inventories to below 40 days. Debtor days for the pig iron business have remained low as KFIL sells specialised foundry grade on favourable terms to various markets through a strong dealer network. As per industry standards, debtors for the castings business is between 60-70 days and supplies are to long-standing customers. Creditors are between 40-60 days for sourcing of coke depending on negotiations while iron ore is procured from e-auctions in Karnataka on bidding and cash payment. On an overall basis, KFIL’s working capital management remains sound with cash conversion cycle maintained at ~30 days on an average in the past (FY11-17 average); we expect the same to remain at 40 days in FY19E/20E.
Exhibit 37: Cash conversion cycle trend
Source: Centrum Research Estimates
0.8
1.1
1.3
0.9
0.7 0.6
1.00.9
0.5
0.7
0.9
1.1
1.3
1.5
0
500
1000
1500
2000
2500
3000
FY13 FY14 FY15 FY16 FY17 FY18E FY19E FY20E
Rs mn
Cash Profit AOCF AOCF/CP (x) - RHS
33 32
24
31
50
45
40 40
0
10
20
30
40
50
60
-80
-60
-40
-20
0
20
40
60
80
FY13 FY14 FY15 FY16 FY17 FY18E FY19E FY20E
Days
Days
Inventory Debtors Creditors Cash Conversion Cycle - RHS
18 Kirloskar Ferrous
Low leverage gives flexibility to pursue investment projects for cost savings and growth
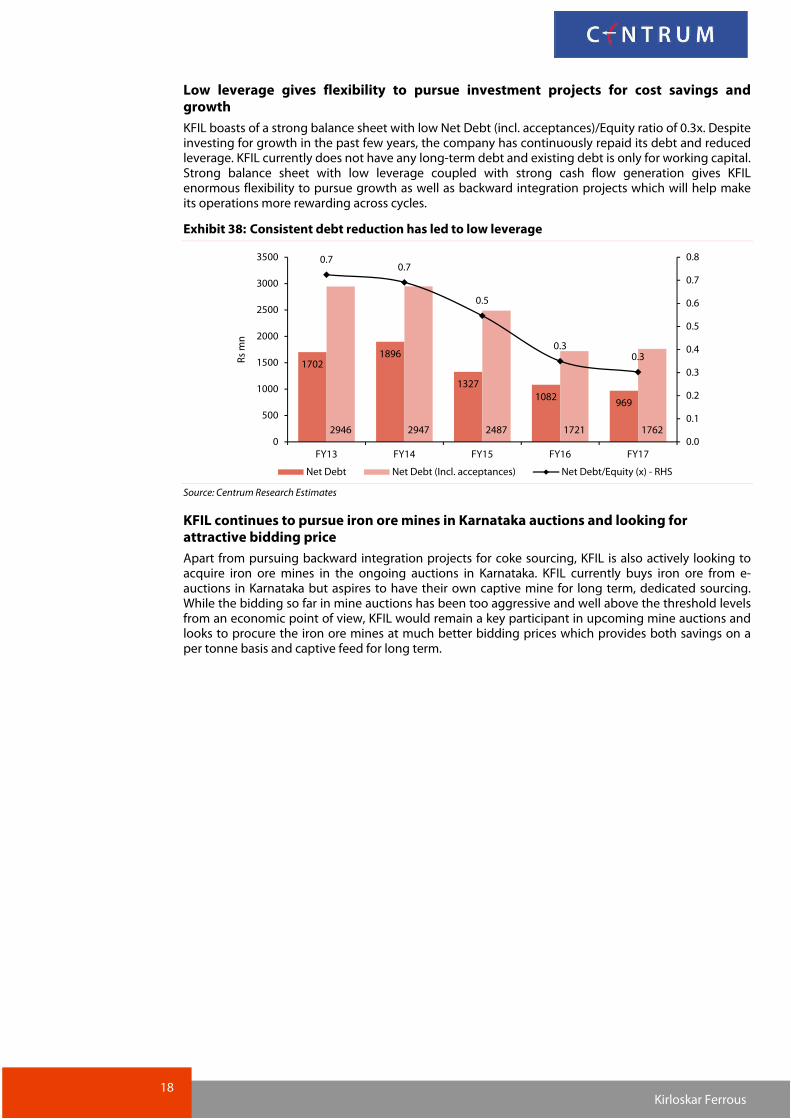
KFIL boasts of a strong balance sheet with low Net Debt (incl. acceptances)/Equity ratio of 0.3x. Despite investing for growth in the past few years, the company has continuously repaid its debt and reduced leverage. KFIL currently does not have any long-term debt and existing debt is only for working capital. Strong balance sheet with low leverage coupled with strong cash flow generation gives KFIL enormous flexibility to pursue growth as well as backward integration projects which will help make its operations more rewarding across cycles.
Exhibit 38: Consistent debt reduction has led to low leverage
Source: Centrum Research Estimates
KFIL continues to pursue iron ore mines in Karnataka auctions and looking for attractive bidding price
Apart from pursuing backward integration projects for coke sourcing, KFIL is also actively looking to acquire iron ore mines in the ongoing auctions in Karnataka. KFIL currently buys iron ore from e-auctions in Karnataka but aspires to have their own captive mine for long term, dedicated sourcing. While the bidding so far in mine auctions has been too aggressive and well above the threshold levels from an economic point of view, KFIL would remain a key participant in upcoming mine auctions and looks to procure the iron ore mines at much better bidding prices which provides both savings on a per tonne basis and captive feed for long term.
17021896
1327
1082969
2946 2947 2487 1721 1762
0.70.7
0.5
0.30.3
0.0
0.1
0.2
0.3
0.4
0.5
0.6
0.7
0.8
0
500
1000
1500
2000
2500
3000
3500
FY13 FY14 FY15 FY16 FY17
Rs mn
Net Debt Net Debt (Incl. acceptances) Net Debt/Equity (x) - RHS

19 Kirloskar Ferrous
Financial Analysis – Earnings at an inflection point
Revenue growth to be aided by solid volume growth in castings segment
We expect net sales CAGR of 16.8% for KFIL during FY17-20E. This would be led by strong volume CAGR of 18.6% from the castings segment. We estimate the share of value added castings business to reach ~51% of overall revenues by FY20E from ~44% in FY18E. With spare capacity being available in pig iron division also, we expect pig iron volume CAGR of 9.5% during FY17-20E.
Exhibit 39: Revenue CAGR of 16.8% during FY17-20E Exhibit 40: Strong volume CAGR of ~19% in Castings
Source: Centrum Research Estimates Source: Centrum Research Estimates
EBITDA margins to trend upwards, driven by increasing share of high margin castings and cost saving initiatives
We expect strong pick-up in KFIL’s EBITDA from FY19E led by higher volumes, superior product mix and better spreads. We expect an EBITDA CAGR of 28% during FY17-20E. KFIL’s blended EBITDA/t has been improving between FY15 and FY17 and we expect this to improve materially to ~Rs8400/t by FY20E led by higher share of castings which fetches higher margins. We expect gross profit/t to improve smartly to Rs19300/t (versus ~Rs15000/t currently) led by i) cost savings through backward integration projects, ii) higher contribution of castings and iii) overall better spreads in pig iron.
Exhibit 41: EBITDA CAGR of 28% during FY16-19E Exhibit 42: Blended EBITDA/tonne to improve materially
Source: Centrum Research Estimates Source: Centrum Research Estimates
13651
11139 11337
1579317086
18049
10.8
-18.4
1.8
39.3
8.2 5.6
-40
-20
0
20
40
60
0
5000
10000
15000
20000
FY15 FY16 FY17 FY18E FY19E FY20E
Net Sales - Rs mn YoY Growth - % (RHS)
318 289 253306 327 333
5757
66
8297 110
0
100
200
300
400
500
FY15 FY16 FY17 FY18E FY19E FY20Ekt
Pig Iron Castings
CAGR FY17-20ECastings - 18.6%Pig Iron - 9.5%
1490 1509 1756 1352 2467 3730
10.9
13.615.5
8.6
14.4
20.7
0
5
10
15
20
25
0
1000
2000
3000
4000
FY15 FY16 FY17 FY18E FY19E FY20E
EBITDA - Rs mn Margin - % (RHS)
14428
15067
17126
14971
17137
19310
3969
4361
5497
3481
5821
8419
34.8
41.445.8 44.1
47.751.2
0
10
20
30
40
50
60
0
5000
10000
15000
20000
25000
FY15 FY16 FY17 FY18E FY19E FY20E
Rs/t
Gross Profit/t Blended EBITDA/t Castings Share - % (RHS)

20 Kirloskar Ferrous
Return ratios should inch higher with major uptick in FY20E
KFIL’s return ratios have remained subdued on account of front loaded investments and low asset turnover due to low utilisation. However, this is set to change sustainably and with meaningful contribution from spare capacity in value-added business of castings coming in progressively by FY20E, we expect material jump in ROE/ROCE by FY20E. We forecast ROE/ROCE (post tax) to be at ~25%/20% in FY20E.
The DuPont analysis of ROE shows that the improvement is well distributed between key metrics:-
� Profit margins – This is expected to improve materially (to double digits) by FY20E led by i) higher share of high margin value-added castings, ii) cost improvement projects in pig iron business coupled with captive power facilities for castings and iii) operating leverage from higher volumes.
� Asset Turnover – We expect substantial sweating of assets despite incremental capital getting invested in backward integration projects (like coke oven and CPP which don’t fetch additional sales), and hence an increase in return ratios.
� Leverage – The leverage for KFIL remain low with no long-term debt and we expect the company to largely maintain this situation through internal accruals. Hence, leverage is expected to play a bare minimum role in improvement of ROE’s and hence ROE improvement is not borrowed from increased leverage which is again a positive sign.
Exhibit 43: Return ratios to inch up Exhibit 44: DuPont analysis
FY15 FY16 FY17 FY18E FY19E FY20E
Profit Margin - % 3.6 5.2 8.0 2.9 6.9 10.8
Asset Turnover (Net Sales/Assets) - x
1.4 1.2 1.2 1.5 1.4 1.3
Financial Leverage (Assets/Equity) - x
2.2 1.9 1.7 1.8 1.9 1.8
ROE - % 11.2 12.2 16.9 7.8 17.9 25.4
Source: Centrum Research Estimates Source: Centrum Research Estimates
Strong dividend payout track record
KFIL has maintained a good record of dividend payout of ~30% of PAT. We note that the company has carefully calibrated its cash flows and allocated them appropriately over time to i) dividends, ii) debt repayments and iii) new project investments as part of capex. We expect strong dividend payout to be maintained. We also note that promoters of KFIL do not draw any salary from the company (except board sitting fees) and instead realise money as general shareholders by way of dividends. This is positive for all shareholders (refer to details in Corporate governance section on page 27).
Exhibit 45: Dividend payout
Source: Centrum Research Estimates
11.212.2
16.9
7.8
17.9
25.4
10.4 11.0
14.0
7.5
14.6
19.9
5
10
15
20
25
30
FY15 FY16 FY17 FY18E FY19E FY20E
%
ROE ROCE (post tax)
1.2 1.2
1.8
0.8
2.1
3.635%
30%
26%25% 25% 25%
3% 2% 2%1%
2%4%
0%
5%
10%
15%
20%
25%
30%
35%
40%
0.0
0.5
1.0
1.5
2.0
2.5
3.0
3.5
4.0
FY15 FY16 FY17 FY18E FY19E FY20E
Dividend (Rs/Sh) - LHS Payout - % Div Yield - % (RHS)

21 Kirloskar Ferrous
Key Assumptions and Sensitivity
Exhibit 46: Key Assumptions
FY14 FY15 FY16 FY17 FY18E FY19E FY20E
Revenue (Rs mn)
Pig Iron 7,174 8,437 6,231 5,889 8,423 8,498 8,325
Castings 4,600 4,745 4,607 5,191 6,970 8,148 9,240
Sales Volumes (kt)
Pig Iron 2,75,692 3,18,023 2,89,485 2,53,495 3,06,300 3,26,850 3,33,000
Castings 60,396 57,257 56,661 65,892 82,000 97,000 1,10,000
Net Sales Realisations (Rs/t)
Pig Iron 26,021 26,528 21,525 23,231 27,500 26,000 25,000
Castings 76,170 82,864 81,303 78,786 85,000 84,000 84,000
Gross Profit (Rs/t)
Pig Iron 5,023 6,846 6,369 6,713 2,809 3,984 5,657
Castings 49,251 56,543 59,502 57,186 60,399 61,460 60,640
KFIL - Total 12,971 14,428 15,067 17,126 14,971 17,137 19,310
Source: Centrum Research Estimates
Exhibit 47: Earnings sensitivity to castings volumes & realisations (+1% change)
1% Chg EBITDA PAT
Castings FY19E FY20E FY19E FY20E
Volume 2.0 1.5 2.9 2.0
Realisations 3.1 2.4 4.5 3.1
Source: Centrum Research Estimates
Exhibit 48: Earnings sensitivity to RM costs (+1% change)
1% Chg EBITDA PAT
RM Costs FY19E FY20E FY19E FY20E
Iron Ore (1.1) (0.7) (1.6) (0.9)
Coke (2.2) (1.3) (3.2) (1.7)
Source: Centrum Research Estimates

22 Kirloskar Ferrous
Valuation – Strong scope for re-rating, Initiate with Buy and TP of Rs155
The KFIL stock has remained sideways in the last six months on account of pressure on gross profit/t which has kept earnings subdued, despite better product mix through higher castings sales. We see scope of re-rating led by earnings recovery and market appreciating the full potential of KFIL’s well-invested asset base in due course as utilisation picks-up and share of value-added castings business increases. We value KFIL on our differentiated AOCF/EV methodology as well as conventional EV/EBITDA and initiate with a Buy rating and a TP of Rs155. At our TP, stock would be valued at 10.9x FY20E P/E and 6.2x FY20E EV/EBITDA. We ascribe a premium to historical multiples and specify key reasons for the same below.
AOCF/EV valuation – 40% premium ascribed to historical AOCF/EV yield
For AOCF/EV based valuation, we note that five year average AOCF/EV yield stands at 9.2% for KFIL. We ascribe a 40% premium to this average for arriving at the target EV/AOCF multiple, which, in turn, is used for deriving the target EV. We arrive at a target AOCF/EV yield of 5.5% for KFIL, and hence, the implied EV/AOCF multiple of 18.1x. We use average AOCF over FY16-20E of Rs1337mn and 18.1x EV/AOCF multiple to arrive at our target EV and our TP of Rs155 (Exhibit 49). We note that FY20E AOCF of Rs2465mn is substantially higher than our 5 year average used for valuation and hence our valuation methodology builds in sufficient margin of safety.
EV/EBITDA valuation – 25% premium ascribed to historical EV/EBITDA
For EV/EBITDA based valuation, we use our FY20E EBITDA estimates and ascribe EV/EBITDA multiple of 6.5x (25% premium to last 5 year average EV/EBITDA multiple of 5.2x). From this methodology we get a fair value of Rs155/share (Exhibit 50).
Exhibit 49: AOCF/EV based valuation Exhibit 50: EV/EBITDA based valuation
9.2
40%
5.5
5 Year avg. AOCF/EV Yield - % - FY13-17
Premium assigned
Target AOCF/EV Yield - %
Implied EV/5 yr AOCF Multiple (x) 18.1
5 yr AOCF (Rs mn) - FY16-20E 1,337
EV (Rs mn) 24,216
Less: Net Debt (incl. acceptances) – FY20E (3,251)
Fair value mkt cap 20,964
No. of shares (mn) 137.3
Fair Value/share (Rs) 155
(Rs mn) Mar'20E
3,730
5.2
25%
EBITDA
Historical EV/EBITDA avg. (FY13-17)
Premium assigned
Ascribed EV/EBITDA (x) 6.5
EV 24,242
Less: Net Debt (incl. acceptances) (3,251)
Fair value mkt cap 20,991
No. of shares (mn) 137.3
Fair Value/share (Rs) 155
Source: Centrum Research Estimates Source: Centrum Research Estimates
We believe that the premium assigned to the multiple is justified on account of the following reasons:
� Margin expansion (on sustainable basis) led by increase in value-added castings business and operating improvements: KFIL’s EBITDA/t profile is expected to enter a new territory overFY19-20E led by increased contribution from the high-margin castings business and significantimprovements in operational parameters as well as captive integration of coke and power. Thisimprovement is sustainable in nature (and not cyclical driven) due to structural change in thebusiness profile of the company led by higher share of value added business of castings and longterm cost efficiency projects.
� Front-end capex fully factored in EV while positive cash flows impact expected to remain back-ended into FY20-21: As discussed in detail in the investment rationale and financialssection, full capex on likely backward integration projects for pig iron business factored in by us islikely to be spent by H1FY20E and this would contribute to earnings largely from H2FY20E. Wenote that AOCF would trend materially higher from FY20E onwards due to sharp up-tick inearnings from both divisions with full benefits of both volume growth and cost savings.
23 Kirloskar Ferrous
� Increase in return ratios with efficient capital management: KFIL’s return ratios are expected to see sharp improvement by FY20E led by efficient capital management coupled with sustainable increase in share of high-margin castings business. Return ratio profile is expected to improve sustainably for KFIL and merits a multiple re-rating.
� Undiscovered and under-owned at Institutional level: We believe that the stock has largely remained undiscovered and out of the radar of institutional investors and its capability in the castings segment has not been recognised; this could be one of the reasons for its lower valuations in the past. We see scope for re-rating once profitability improves and KFIL’s capabilities get recognised. We thus believe that premium to historical valuations is justified on account of superior fundamentals, future growth opportunity, and strong management capabilities.
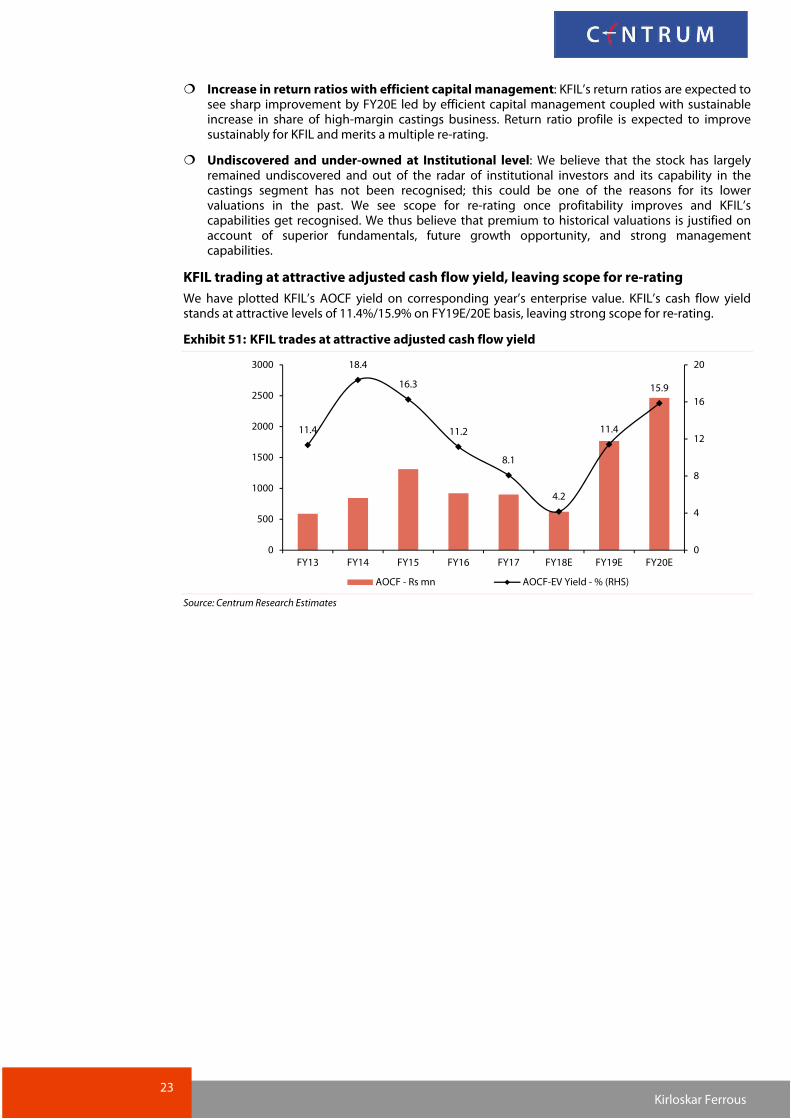
KFIL trading at attractive adjusted cash flow yield, leaving scope for re-rating
We have plotted KFIL’s AOCF yield on corresponding year’s enterprise value. KFIL’s cash flow yield stands at attractive levels of 11.4%/15.9% on FY19E/20E basis, leaving strong scope for re-rating.
Exhibit 51: KFIL trades at attractive adjusted cash flow yield
Source: Centrum Research Estimates
11.4
18.4
16.3
11.2
8.1
4.2
11.4
15.9
0
4
8
12
16
20
0
500
1000
1500
2000
2500
3000
FY13 FY14 FY15 FY16 FY17 FY18E FY19E FY20E
AOCF - Rs mn AOCF-EV Yield - % (RHS)

24 Kirloskar Ferrous
Exhibit 52: 1 year forward EV/EBITDA chart Exhibit 53: 1 year forward P/E chart
Source: Bloomberg, Centrum Research Estimates Source: Bloomberg, Centrum Research Estimates
Exhibit 54: Peer comparison – Historical Financials
Company Net Sales (Rs mn) EBITDA (Rs mn) PAT (Rs mn) EBITDA Margin % PAT Margin %
FY15 FY16 FY17 FY15 FY16 FY17 FY15 FY16 FY17 FY15 FY16 FY17 FY15 FY16 FY17
Kirloskar Ferrous 13,651 11,139 11,337 1,490 1,509 1,756 493 578 907 10.9 13.6 15.5 3.6 5.2 8.0
Nelcast 5,449 5,607 5,746 460 643 640 219 319 340 8.4 11.5 11.1 4.0 5.7 5.9
Jayaswal Neco Industries 30,243 26,326 25,162 3,593 2,628 2,800 3 (936) (4,593) 11.9 10.0 11.1 0.0 (3.6) (18.3)
Steelcast 791 1,370 1,343 0 263 154 (185) 1 24 (0.1) 19.2 11.5 (23.4) 0.1 1.8
Alicon Castalloy 7,136 7,489 7,728 709 769 868 198 222 262 9.9 10.3 11.2 2.8 3.0 3.4
Precision Camshafts 5,144 4,381 4,430 1,374 1,192 1,006 476 549 609 26.7 27.2 22.7 9.3 12.5 13.7
Company CAGR 15-17 (%) ROE % Div Yield % P/E (x) EV/EBITDA (x)
Revenue EBITDA PAT FY15 FY16 FY17 FY15 FY16 FY17 FY15 FY16 FY17 FY15 FY16 FY17
Kirloskar Ferrous (8.9) 8.6 35.7 11.2 12.2 16.9 2.5 2.4 2.3 13.9 12.5 11.4 5.5 5.5 6.4
Nelcast 2.7 18.0 24.4 8.0 10.9 10.7 2.1 1.4 1.5 12.7 14.4 14.9 7.1 7.8 8.2
Jayaswal Neco Industries (8.8) (11.7) NM 0.0 (4.3) (24.4) 0.0 0.0 0.0 NM (5.5) (1.1) 13.4 16.8 15.5
Steelcast 30.3 NM NM NM NM 3.2 - - - (3.7) 670.2 59.9 NM 3.3 8.2
Alicon Castalloy 4.1 10.6 14.9 16.9 16.3 16.4 1.1 1.3 0.9 11.4 16.1 16.6 5.5 6.8 7.6
Precision Camshafts (7.2) (14.5) 13.0 23.1 14.7 11.5 - 0.7 1.1 - 23.6 22.9 - 10.7 11.2
Source: Bloomberg, Centrum Research
0
3
6
9
12
Nov-11
May-12
Nov-12
May-13
Nov-13
May-14
Nov-14
May-15
Nov-15
May-16
Nov-16
May-17
Nov-17
EV/EBITDA Mean
Mean + Std Dev Mean - Std Dev
0
5
10
15
20
25
30
35
Nov-11
May-12
Nov-12
May-13
Nov-13
May-14
Nov-14
May-15
Nov-15
May-16
Nov-16
May-17
Nov-17
P/E Mean
Mean + Std Dev Mean - Std Dev

25 Kirloskar Ferrous
Key risks to our thesis
� Margin pressure due to higher competition from peers: The domestic castings (foundry) industry is fragmented and has unutilised capacity. Though demand outlook is good and the business is characterised by product positioning and client relationships, thus limiting competition-related margin pressures, a sudden increase in activity from some players with low utilisation could pose a potential risk to margins.
� Client concentration: KFIL has large exposures to some of its big clients and is exposed to risks associated with any issues in the volume trajectories of its large clients. However, the company has been able to increase its client base significantly in last few years and has been reducing this risk over time.
� High volatility in raw material prices: KFIL’s key raw materials are iron ore, scrap, coke and coking coal which have witnessed sharp fluctuations in the past. The raw material price fluctuations are not easily passed on to customers and any major volatility in raw material prices would impact gross margins and profitability.
� Foreign exchange fluctuations: KFIL imports its key raw materials like coking coal/coke and has to prudently manage its foreign exchange risk on the same. The company has been entering into forward covers for hedging and has incurred forex related costs both on account of losses as well as premium on contracts. The forex related costs have been brought under control through prudent management over the last few years but risk to earnings could potentially arise again.
Exhibit 55: KFIL forex gain/loss trend
(Rs mn) FY12 FY13 FY14 FY15 FY16 FY17
Forex gains (in other inc.) 0 0 0 2 0 2
Forex loss (in other exp) 178 137 1 0 0 0
PBT 557 624 580 718 853 1,216
PBT (excl. forex gain/loss) 735 761 580 716 853 1,214
Source: Centrum Research
� Transition of auto industry to electric vehicles over long term: Over the longer term, it is expected that a major portion of automobile industry might move towards electric vehicles that will not need internal combustion engines. Some of KFIL’s products find applications in engines of the CV industry and could see the impact of transition to EV in long term. However, we believe that EV transition would first be felt in passenger vehicles rather than CVs and KFIL doesn’t have any exposure to passenger vehicles segment currently. Also, we believe that EV transition could be a very long process stretching to 15-20 years and threat of the same in next ten years in KFIL’s segments remains low.

26 Kirloskar Ferrous
Exhibit 56: Shareholding pattern (%)
Sep-17 Jun-17 Mar-17 Dec-16
Promoter 59.6 59.6 59.6 59.5
FIIs 0.6 0.6 0.6 0.5
DIIs 2.6 1.8 1.8 1.8
Others 37.2 38.0 38.0 38.2
Source: BSE
Company Background
KFIL is an initiation of Kirloskar Oil Engines Limited (KOEL) and Shivaji Works Limited (SWL). Incorporated in 1991, the flagship company of the Kirloskar Group, KFIL was formed with an objective of manufacturing high quality Pig Iron and thin walled quality grey iron castings to cater to the growing demand in industry sectors such as Tractors, Automotives and Diesel Engines.
It has 2 manufacturing plants at Koppal and Solapur in Karnataka and Maharashtra respectively.
KFIL has unique capability of producing a range of products that includes Grey Iron castings upto 300 kg single piece weight, S.G. Iron castings upto 120 Kg single piece weight and in Pig Iron grade includes Foundry Grade, S.G. Iron Grade & Basic Grade.
The commercial production of Pig Iron commenced from Mini Blast Furnace I in 1994. In due course, the commercial production of Grey Iron Castings commenced in 1995 along with Mini Blast Furnace II. For effective utilization of waste gas from MBF, two Power plants of 3.5 MW each were commissioned in 1994 and in 1997 respectively. In the year 2007, KFIL acquired Solapur foundry from Kirloskar Oil Engines Limited.
Exhibit 57: KFIL product profile
Product Name Capacity (TPA) Location
Pig Iron 390,000 Koppal, Hospet, Karnataka
Castings 93,000 Koppal, Hospet, Karnataka
Castings 40,000 Solapur, Maharashtra
Source: Centrum Research
Exhibit 58: Key management personnel
Name Position Profile
Mr. Atul C. Kirloskar Chairman
Mr. Atul Chandrakant Kirloskar began his career with erstwhile Kirloskar Cummins Limited in the year 1978, where he started as a trainee. On 1 November 1984, he was appointed as the Executive Vice President of Kirloskar Oil Engines Limited (KOEL). He was co-opted on the Board of KOEL on 6 August 1985, wherein he took over as the Managing Director. In 1988, he became the Vice Chairman of KOEL and held the position till 25 July 1998 when he was appointed as Chairman of KOEL. He was appointed as Managing Director of KOEL with effect from 31 March 2010 and was appointed as Executive Chairman of KOEL with effect from 26 January 2012. He is the past President of Maharashtra Chamber of Commerce, Industries and Agriculture (MCCIA), Pune and past Chairman of CII National Committee of Defence. He was appointed as a Director of the Company on 10 August 1992. He is the Chairman of the Company.
Mr. Rahul C. Kirloskar Vice Chairman
Mr. Rahul Chandrakant Kirloskar is qualified as B.S. (Mechanical Engineering) from USA. He has been with the Kirloskar Group of Companies for more than 25 years at senior levels in different capacities. He has also been Chairman of the CII Pune Zonal Council as well as CII Maharashtra Council. He was appointed as Director of the Company on 28 October 2013. He is the Vice Chairman of the Company.
Mr. R. V. Gumaste Managing Director
Mr. Ravindranath Venkatesh Gumaste holds a bachelor’s degree in Metallurgical Engineering from Karnataka Regional Engineering College, Surathkal. Soon after graduating, he joined Kirloskar Oil Engines Limited in July 1981. In 1993, he joined Kirloskar Ferrous Industries Limited and later rose to become the SBU Chief for the pig iron business in 1998. In view of his pioneering efforts and initiatives to improve the performance of the Company, such as cost reduction drive on all fronts, improvement in the production process, increasing the productivity of foundry operations and quality of output, negotiating for reduction in raw material prices, improvement for market share of castings, etc. he was appointed as Executive Director of the Company with effect from 25 July 2002 and further as the Managing Director of the Company with effect from 1 July 2003.
Source: Company

27 Kirloskar Ferrous
Corporate governance check – highlighting the finer points
Independent directors’ representation on the board – KFIL has good balance
The strong representation of independent directors on the board ensures that decisions are made in all fairness and in the best interest of all the shareholders, thereby gaining shareholders’ trust. KFIL has maintained good balance of independent directors’ representation on the board with a share of ~60% on an average over the last six years.
Exhibit 59: Representation of Independent and promoter directors on companies board
FY12 FY13 FY14 FY15 FY16 FY17
Kirloskar Ferrous
- Total Strength 8 8 9 11 10 9
- Promoter 1 1 2 2 2 2
- Executive 1 1 1 1 1 1
- Non Executive & Non Independent 1 1 1 1 1 1
- Independent 5 5 5 7 6 5
- % share of Promoter 12.5 12.5 22.2 18.2 20.0 22.2
- % share of Executive Director 12.5 12.5 11.1 9.1 10.0 11.1
- % share of independent 62.5 62.5 55.6 63.6 60.0 55.6
Nelcast
- Total Strength 7 6 6 6 6 6
- Promoter
- Executive 3 3 2 2 2 2
- Non Executive & Non Independent 0 0 1 1 1 1
- Independent 4 3 3 3 3 3
- % share of Promoter 0.0 0.0 0.0 0.0 0.0 0.0
- % share of Executive 42.9 50.0 33.3 33.3 33.3 33.3
- % share of independent 57.1 50.0 50.0 50.0 50.0 50.0
Jayaswal Neco
- Total Strength 9 8 8 12 12 12
- Promoter 3 3 3 3 3 3
- Executive 1 1 1 2 2 2
- Non Executive & Non Independent
- Independent 5 4 4 7 7 7
- % share of Promoter 33.3 37.5 37.5 25.0 25.0 25.0
- % share of Executive Director 11.1 12.5 12.5 16.7 16.7 16.7
- % share of independent 55.6 50.0 50.0 58.3 58.3 58.3
Source: Centrum Research

28 Kirloskar Ferrous
Independent directors’ profile and compensation analysis
We find that KFIL has appointed IDs from diverse backgrounds and focused on domain experts in castings and pig iron industries. The attendance record of IDs of KFIL is 100%, which is a good sign. The compensation of IDs appears to be on the higher side but is fair and in line with normal industry practice, in our view, as it also depends on the value addition provided by IDs. One notable trait in IDs profile is the absence of their representation on any other prominent companies’ boards.
Exhibit 60: Independent directors profile and compensation
Independent Director Name
No. of directorship in other public ltd
cos
Name of other companies in which director
FY17 Compensation
(Rs mn)
As % to FY17 PBT
FY17 Board meeting
attendance (%)
Kirloskar Ferrous
Mr. A R Jamenis 0 1.5 0.1 100.0
Mr. B S Govind 0
0.8 0.1 100.0
Mr. R Sampath Kumar 1
1.4 0.1 100.0
Mrs. Nalini Venkatesh 0
1.1 0.1 100.0
Mr. Y S Bhave* 0 0.2 0.0 100.0
Nelcast
Mr. D Sesha Reddy 0
0.2 0.0 100.0
Mr. R Mohan Reddy 1 Lokesh Machines 0.2 0.0 100.0
Mr. A Balasubramaniam 1 Butterfly Gandhimati 0.1 0.0 100.0
Jayaswal Neco
Mr. B.K. Agrawal 2 Manaksia Industries, Reliance Chemotex Industries Ltd
0.2 0.0 100.0
Mr. S. N. Singh 0
0.1 0.0 100.0
Mr. D. K. Sahni 0
0.1 0.0 50.0
Mrs. Raji Nathani 0
0.1 0.0 75.0
Mr. Arvind Iyer 0
0.1 0.0 75.0
Mr. M M Vyas
0.0 0.0 0.0
Mr. Bharat Pal Singh 0 0.0 0.0 0.0
Source: Centrum Research; * Inducted during Jan'17

29 Kirloskar Ferrous
Promoter group compensation analysis – as good as it gets
KFIL performs extremely well on promoter group compensation, as the promoters have chosen not to take any salary from the company (except drawing board sitting fees). The promoters (Kirloskars) serve as Chairman and Vice Chairman on the board but draw only Rs1.4mn as compensation (board sitting fees) and are instead choosing to realise money by way of dividends. This trait is extremely positive for minority shareholders, in our view.
Exhibit 61: Promoter group compensation summary *
(Rs mn) FY12 FY13 FY14 FY15 FY16 FY17 FY15-17 Total
Kirloskar Ferrous
- Promoter Directors 0.4 0.3 0.7 0.9 1.0 1.4 3.2
- Mr. Atul C Kirloskar (Chairman) 0.4 0.3 0.4 0.4 0.5 0.7
- Mr. Rahul C Kirloskar (Vice Chairman)
0.3 0.4 0.5 0.7
- Executive Directors 16.3 21.4 27.1 30.1 34.6 44.2 108.9
- Mr. R V Gumaste (MD) 16.3 21.4 27.1 30.1 34.6 44.2
- Total Promoter Directors 0.4 0.3 0.7 0.9 1.0 1.4 3.2
- % share of PBT 0.1 0.1 0.1 0.1 0.1 0.1 0.1
Nelcast
- Promoter Directors 19.0 8.3 11.1 11.2 12.1 12.1 35.5
- Mr. P Deepak (MD) 19.0 8.3 11.1 11.2 12.1 12.1
- Executive Directors 10.3 15.6 16.5 9.6 8.0 7.4 25.0
- WTD 10.3 15.6 16.5 9.6 8.0 7.4
- Total Promoter Directors 19.0 8.3 11.1 11.2 12.1 12.1 35.5
- % share of PBT 2.8 4.0 3.1 3.8 2.6 2.5 2.8
Jayaswal Neco
- Promoter Directors 10.5 10.1 13.3 23.8 25.5 25.5 74.8
- Mr. Basant Lall Shaw (Chairman) 0.0 0.0 0.0 0.1 0.1 0.1
- Mr. Arbind Jayaswal (MD) 5.3 5.0 6.7 11.9 12.7 12.7
- Mr. Ramesh Jayaswal (Jt MD) 5.2 5.0 6.7 11.9 12.7 12.7
- Executive Directors 2.6 2.8 3.8 6.4 10.4 11.3 28.0
- Mr. P K Bharadwaj (ED & CFO) 2.6 2.8 3.8 4.4 4.6 5.1
- Mr. Megh Pal Singh (ED Steel)
2.0 5.8 6.2
- Total Promoter Directors 10.5 10.1 13.3 23.8 25.5 25.5 74.8
- % share of PBT 1.2 2.1 1.2 13.7 2.3 0.5 1.3
Source: Centrum Research, * % share considered positive even when PBT is negative to show the absolute picture

30 Kirloskar Ferrous
Contingent liability
In our analysis, we have not encountered any potential contingent liabilities which could materially change the structure of the financials or pose a significant risk to KFIL’s net worth. It mainly consists of tax related matters and bills discounting which are not sizeable in nature.
Exhibit 62: Contingent liability trend
(Rs mn) FY12 FY13 FY14 FY15 FY16 FY17
Kirloskar Ferrous
- Taxation related matters 144 73 234 216 269 288
- Central Excise & Customs 23 6 19 16 16 15
- Service Tax 34 11 30 30 54 34
- Income tax 88 51 179 103 133 174
- Sales Tax 0 5 5 66 65 65
- Others 2 2 2 180 227 165
- Bill Discounting 0 0 0 178 225 143
- Provident Fund Matters 0 0 0 0 0 19
- Labour Matters 2 2 2 2 2 4
- Bank Gaurantee 0 0 0 0 0 0
- Interest on Electricity tax 1 1 0 0 0 0
- Total 146 75 236 397 496 453
- % share of Net Worth 3.8 1.9 5.5 8.7 10.1 7.8
Net Worth 3,802 4,067 4,264 4,550 4,920 5,826
Nelcast
- For Taxation related 0 0 0 36 41 55
- Central Excise & Customs 0 0 0 33 38 52
- Sales Tax 0 0 0 3 3 3
- Others 21 1 24 19 0 10
- Bank Gaurantee 21 1 24 19 0 10
- Total 21 1 24 55 41 65
- % share of Net Worth 0.9 0.0 0.9 2.0 1.3 2.0
Net Worth 2,427 2,516 2,670 2,816 3,051 3,297
Jayaswal Neco
- Taxation related matters 857 1,408 1,520 1,296 1,337 987
- Excise & service tax 272 283 273 280 155 60
- Sales Tax 297 422 407 248 154 131
- Customs duty 79 81 83 87 10 19
- Other disputed demands 168 580 716 657 994 743
- third party claims 41 42 42 24 24 35
- Others 6,003 7,560 6,865 3,480 1,874 1,973
- Bill Discounting 1,432 1,255 1,841 1,971 974 884
- Letters of Credit 4,163 5,817 4,516 1,030 600 732
- Gaurantee (Banks & Corp) 408 488 508 478 300 358
- Total 6,861 8,968 8,385 4,776 3,211 2,960
- % share of Net Worth 55.9 49.7 39.5 21.5 15.3 18.1
Net Worth 12,276 18,063 21,237 22,179 20,977 16,373
Source: Centrum Research

31 Kirloskar Ferrous
Related party transaction – clean history
KFIL does not have any related party transactions except for the small rent paid.
Exhibit 63: Related party transaction details
Particulars (Rs mn) FY12 FY13 FY14 FY15 FY16 FY17
Kirloskar Ferrous
Building rent paid 1 1 1 1 1 1
Rent deposit receivable 0 0 0 0 0 0
Others 0 0 0 0 0 0
Nelcast
Amount of Investment during the year 50 50 60 50 20
Closing Balance 155 205 255 315 365 385
Others
Jayaswal Neco
Commission/Rent/Interest 9 37 56 59 68 95
Purchase of assets 3,137 4,121 7,681 1
Sale of Assets 0 0 0 0 0 1
Sale of Goods and services 1,347 1,379 1,160 1,167 609 483
Purchase of Goods & Services 558 2,170 1,279 735 484 574
Current borrowings-Inter corporate deposits taken 94 785 156 72 48 15
Current borrowings-Inter corporate deposits repaid 0 219 1,095 106 33 51
Source: Centrum Research
Auditor pedigree
KFIL has changed its auditor in 2015 to Kirtane & Pandit LLP from P G Bhagwat who was the auditor for more than ten years. Kirtane & Pandit LLP is the auditor for Aarti Industries, Force Motors, Garware Polyester, Maharashtra Scooters and a few others. It has a long and trusted track record of auditing companies across various industries.
Exhibit 64: Auditor details
Auditor Name Type Other Companies Audited by the auditor Auditor for the company since
Auditor Fees - FY17 (Rs mn)
As % to PBT
Kirloskar Ferrous Kirtane & Pandit LLP Statutory Aarti Industries, Force Motors, Garware Polyester, Maharashtra Scooters, few more
2015 3.6 0.3
Nelcast Reddy A V & Co Statutory NA 2016 1.5 0.3
Jayaswal Neco Chaturvedi & Shah Statutory Bajaj Hindustan, CG Power, Cox & Kings, Dewan Housing, Eros Int, Jet Airways, Reliance Industries, Reliance Ind Infra
>10 years 1.5 0.3
Source: Centrum Research

32 Kirloskar Ferrous
Exhibit 65: Quarterly financials
Particulars (Rs mn) Q3FY16 Q4FY16 Q1FY17 Q2FY17 Q3FY17 Q4FY17 Q1FY18 Q2FY18
Net Sales (incl. op. income) 2,678 2,474 2,997 2,898 2,241 3,201 3,340 4,005
Cost of Raw Materials consumed 1476 1150 1360 1455 1029 2023 2111 2607
Staff Cost 195 178 185 187 182 173 184 193
Other Operational expenses 671 779 774 767 676 769 884 872
Operating Profit (Core EBITDA) 336 368 677 489 356 236 161 332
Depreciation 110 114 119 118 117 104 125 113
EBIT 225 254 558 371 238 132 36 219
Interest 55 52 44 24 45 22 31 69
Other Revenue/Income 4 6 34 4 5 14 10 5
Other Exceptional Items 0 0 0 0 0 0 0 0
Profit Before Tax 174 208 548 351 198 123 15 156
Tax 53 78 170 125 27 -9 3 47
Tax rate (%) 30.6 37.6 31.0 35.5 13.7 -7.5 20.6 30.2
Profit After Tax 121 130 378 226 171 133 12 109
Growth (%)
Net Sales (20.4) (23.3) (1.1) (2.1) (16.3) 29.4 11.4 38.2
EBITDA (15.3) 39.6 78.4 11.6 5.9 (35.7) (76.2) (32.1)
PAT (23.8) 814.5 146.8 24.1 41.5 2.1 (96.7) (51.9)
Margin (%)
EBITDA 12.5 14.9 22.6 16.9 15.9 7.4 4.8 8.3
EBIT 8.4 10.3 18.6 12.8 10.6 4.1 1.1 5.5
PAT 4.5 5.2 12.6 7.8 7.6 4.1 0.4 2.7
Sales Volumes (tonne)
Pig Iron Merchant 74,589 59,173 72,419 69,414 39,355 72,307 66,186 72,605
Castings 13,032 15,138 17,002 17,448 14,992 16,450 18,139 20,438
Net Sales (Rs mn)
Pig Iron Merchant 1,540 1,198 1,610 1,464 1,000 1,810 1,801 1,985
Castings 1,054 1,205 1,331 1,375 1,170 1,310 1,451 1,733
Others 84 70 55 60 70 80 87 287
Realisations (Rs/t)
Pig Iron Merchant 20,646 20,246 22,232 21,087 25,410 25,032 27,214 27,342
Castings 80,878 79,601 78,285 78,777 78,042 79,635 79,999 84,769
Source: Centrum Research

33 Kirloskar Ferrous
Annexure – Indian Foundry (Castings) Industry
About metal castings & foundry
A foundry is a factory that produces metal castings. Metals are cast into shapes by melting them into a liquid, pouring the metal in a mould, and removing the mould material or casting after the metal has solidified as it cools. The most common metals processed are aluminium and cast iron. However, other metals, such as bronze, brass, steel, magnesium, and zinc, are also used to produce castings in foundries. In this process, parts of desired shapes and sizes can be formed. Metal castings have several applications across industries in Auto, Tractor, Railways, Machine tools, Sanitary, Pipe Fittings, Defence, Aerospace, Earth Moving, Textile, Cement, Electrical, Power machinery, Pumps / Valves, Wind turbile generators etc.
Casting is the process from which solid metal shapes (castings) are produced by filling voids in moulds with liquid metal. The basic steps involved in making castings are patternmaking, molding, melting and pouring, shakeout and cleaning, heat treating, and inspection. The key raw materials used for making castings are pig iron (hot metal), scrap (industrial), sand
Manufacturing Process
The manufacturing processes of castings must be executed with maximum accuracy, performance and quality, thus ensuring the final customer´s satisfaction.
Exhibit 66: Metal casting manufacturing process
Source: Industry, Centrum Research

34 Kirloskar Ferrous
The steel castings processes may be different across foundries, but the manufacturing process applied in major foundries follows the following steps:
1. Project and design
The starting point for the procedure for making castings is the order received from the client. Initially it is necessary to study the feeding and filling system of the pieces to be built, and make the necessary patterns and core boxes. Studies and computer simulations of steel castings solidification are made to ensure the highest quality of the goods to be obtained during the process. The construction of the patterns and core boxes, tools used for making sand molds and sand cores, where the liquid steel is poured until solidification, is subcontracted to qualified modelers.
2. Moulding and core-making section
The sand molds are made in the respecting molding facilities. Core making section is an auxiliary molding section, and is the part of the process where sand cores are made using the core boxes. The sand is prepared in the mills and dumped on casting patterns for compaction and compression, shaping the future piece sand mold. Once the sand mold is compacted, the casting pattern is separated and reused for making new sand molds. The manufactured cores done in the coremaking section are placed inside the sand molds in order to determine the inner shape of the work piece. The next step is the union and closing of the sand molds, and finally the molds are moved to the storage area where the melted steel is poured into the molds.
3. Melting and casting
For obtaining the liquid steel the scraps and ferroalloys are melted in electric induction furnaces of medium frequency placed in the melting section. Cupola furnaces are also used for this process. After the melting process, the steel is downloaded to the ladle, and finally the liquid steel is poured into the sand molds deposited in the casting zone. After the solidification of the steel, the solid piece (as cast) is obtained. This solid piece (as cast) must be submitted to the subsequent processes to reach the design and final shape desired by the customer.
4. Demoulding (Shake out)
Demoulding of the castings is produced with the separation of the molding sand (containing sand) of the casting good, operation that is performed by a vibrating shake-out system.
As a result of this two parts are separated:
- The casting good, which will follow the rest of the manufacturing processes, - and on the other part , the sand, that be used for recycling.
Demoulded steel (as cast) goods are ready for shot-blasting.
5. Shot-blasting
The solid pieces/goods (as cast) are collected in a basket which is subsequently introduced into a shot-blasting machine , where the rest of sand that still remain attached to the casting is removed by projecting steel granules.
6. Fettling
After the shot- blasting process the goods are prepared for the next step, the sleves-feeder cutting process, removing the entries and the channels designed from the feeding system of the good. Cutting operations: air-gaz cutting, arc-air electrodes cutting, manipulators for feeders breaking . The solid piece/good (as cast) part is subjected to special heat treatments, in order to achieve the mechanical properties of strength, hardness and toughness. Once the heat treatment is finished, the goods pass to the deburring processes. In this process are performed the operations to remove existing burrs on the work piece.
7. Quality control and inspection
All casting processes are subjected to specific quality control procedures and inspection.
8. Machining
The whole manufacturing process of steel casting ends with the machining of the castings to obtain the final dimensions and tolerances required by the customer. The main machining operations are turning, milling, drilling and balancing.
35 Kirloskar Ferrous
Global Foundry Industry scenario
As per 50th World casting Census published by Modern Castings USA, world casting production reached 104.1 MT, slightly above 103.7 MT produced in 2014 and 103 MT in 2013 with a marginal growth of ~0.4 % from 2014 to 2015. It is the 6th year in a row the market has expanded after global recession from 2008-09. China accounts for 44% of the total casting production in the World and India & USA combined account ~20% of total Production.
The total number of casting units in the world is ~47000, down from 48164 in 2010. As global casting production had increased in the last five years, the decrease in plants indicates metal castings businesses are consolidating and becoming more efficient.
Domestic Foundry Industry
The Indian foundry industry manufacturers metal cast components for applications in Auto, Tractor, Railways, Machine tools, Sanitary, Pipe Fittings, Defence, Aerospace, Earth Moving, Textile, Cement, Electrical, Power machinery, Pumps / Valves, Wind turbine generators etc. Foundry Industry has a turnover of ~US$19 bn with export of ~US$2.5 bn. However, grey iron castings have the major share of ~68% of total castings produced.
Major Foundry Clusters – There are ~1500 units are having International Quality Accreditation. Several large foundries are modern & globally competitive. Many foundries use cupolas using LAM Coke. However, these are gradually shifting to Induction Melting. India has many foundry clusters and each cluster is known for its products and end-use markets. The major foundry clusters are located in Batala, Jalandhar, Ludhiana, Agra, Pune, Kolhapur, Sholapur, Rajkot, Ahmedabad, Belgaum, Coimbatore, Chennai, Hyderabad, Chennai, etc. The Coimbatore cluster is famous for pump-sets castings, the Kolhapur and the Belgaum clusters for automotive castings and the Rajkot cluster for diesel engine castings, Howrah cluster for sanitary castings etc.
Manpower - The total manpower in Foundry Sector is approx. 500000 directly & 1500000 indirectly. The foundry sector is highly labour intensive & currently generates employment for 2 Million directly & indirectly mainly from socially & economically weaker sections of society.
Role in Manufacturing Sector - The new manufacturing policy envisages the increase in the share of manufacturing in the GDP to 25% from current 15% & to create 100 Million additional jobs in next 10 years. Since all engineering & other sectors use metal castings in their manufacturing, the role of foundry industry to support manufacturing is very vital. It is not possible to achieve the above goal without the sustainable corresponding growth of the foundry sector.

36 Kirloskar Ferrous
Domestic castings industry growing at ~5% CAGR
Domestic casting industry’s total production stood at 11.4 MT in FY17 with grey iron castings accounting for ~70% of the overall market (~8 MT). The production CAGR in the industry for total castings/grey iron castings was at 5%/5.6% over FY14-17. As per various industry sources including snippets offered by the Institute of Indian Foundrymen (IIF), the industry is well poised for much stronger growth in the next five years, driven by higher demand.
Exhibit 67: Castings production in India Exhibit 68: Castings production in India - CAGR trend
(MT) FY13 FY14 FY15 FY16 FY17
Grey Cast Iron 6.3 6.7 6.8 7.4 7.9
Spheroidal Graphite Iron 1.0 1.0 1.1 1.2 1.2
Malleable 0.1 0.1 0.1 0.1 0.1
Steel 1.2 1.1 1.0 0.9 1.0
Non-Ferrous 0.9 1.0 1.1 1.3 1.2
Total (MT) 9.3 9.8 10.0 10.8 11.4
Source: IIF, Centrum Research Source: IIF, Centrum Research
Castings demand is well-spread across several sectors with auto sector contributing to one-third of the total demand. Other sectors which drive the demand are sanitary, agriculture machinery, pipes & fittings, railways, pumps, valves, diesel engines and others. The castings industry size in India is ~US$19bn and exports are substantial at ~US$2.5bn but have remained stagnant while imports are restricted to below US$1bn.
Exhibit 69: Castings export and import trend in India Exhibit 70: Sector-wise castings demand in India
Source: IIF, Centrum Research Source: IIF, Centrum Research
5.6%
3.0%
4.9%5.0%
2.6%
4.7%
0%
1%
2%
3%
4%
5%
6%
3Y (FY14-17) 5Y (FY12-17) 10Y (FY07-17)
Grey Iron Castings Total
2572 26182729
25032366
1013 927 946 926 962
0
500
1,000
1,500
2,000
2,500
3,000
FY13 FY14 FY15 FY16 FY17
Exports (USD mn) Imports (USD mn)
Auto, 32%
Agriculture Machinery,
7%
Sanitary, 8%
Pipes & Fittings, 7%Railways, 6%
Power, 6%
Industrial Machinery,
6%
Pumps , 5%
Valves, 5%
Diesel Engines, 3%
Others, 15%

37 Kirloskar Ferrous
Financials - Historical
Exhibit 71: Income Statement
Y/E Mar(Rs mn) FY11 FY12 FY13 FY14 FY15
Revenues 10,898 10,897 11,981 12,322 13,651
Materials cost 7,685 7,117 7,540 7,962 8,236
% of revenues 70.5 65.3 62.9 64.6 60.3
Employee cost 331 428 512 496 652
% of revenues 3.0 3.9 4.3 4.0 4.8
Others 1,892 2,419 2,847 2,748 3,273
% of revenues 17.4 22.2 23.8 22.3 24.0
EBITDA 990 933 1,083 1,116 1,490
EBITDA margin (%) 9.1 8.6 9.0 9.1 10.9
Depreciation & Amortisation 270 292 332 338 504
EBIT 720 641 751 778 985
Interest expenses 41 105 152 229 298
PBT from operations 678 536 599 549 687
Other income 40 21 25 31 31
Exceptional items (1) 0 0 0 0
PBT 717 557 624 580 718
Taxes 235 186 233 181 226
Effective tax rate (%) 32.8 33.4 37.4 31.3 31.4
Reported PAT 482 371 391 398 493
Adjusted PAT 481 371 391 398 493
Source: Centrum Research
Exhibit 72: Key Ratios
Y/E Mar FY11 FY12 FY13 FY14 FY15
Growth Ratio (%)
Revenue 35.0 (0.0) 10.0 2.8 10.8
EBITDA 7.5 (5.8) 16.2 3.0 33.5
Adjusted PAT (2.4) (23.0) 5.4 1.9 23.7
Margin Ratios (%)
EBITDA 9.1 8.6 9.0 9.1 10.9
PBT from operations 6.2 4.9 5.0 4.5 5.0
Adjusted PAT 4.4 3.4 3.3 3.2 3.6
Return Ratios (%)
ROE 14.0 10.0 9.9 9.6 11.2
ROCE 13.4 10.1 8.8 8.5 10.4
ROIC 13.3 10.1 8.7 8.3 10.2
Turnover Ratios (days)
Gross block turnover ratio (x) 2.2 2.0 1.9 1.7 1.6
Debtors 45 54 47 56 47
Inventory 53 44 47 48 32
Creditors 86 69 61 73 55
Cash conversion cycle 12 28 33 32 24
Solvency Ratio (x)
Net debt-equity (0.1) 0.1 0.4 0.4 0.3
Debt-equity 0.0 0.1 0.4 0.4 0.3
Interest coverage ratio 0.1 0.2 0.2 0.3 0.3
Gross debt/EBITDA 0.0 0.6 1.6 1.7 0.9
Current Ratio 1.1 1.1 1.0 0.9 0.9
Per share Ratios (Rs)
Adjusted EPS 3.5 2.7 2.8 2.9 3.6
BVPS 26.1 27.7 29.6 31.1 33.1
CEPS 5.5 4.8 5.3 5.4 7.3
DPS 1.5 1.5 1.2 1.2 1.2
Dividend payout % 41.9 54.4 43.9 43.1 34.8
Valuation (x)*
P/E (adjusted) 9.3 8.9 9.3 7.1 13.9
P/BV 1.2 0.9 0.9 0.7 1.5
EV/EBITDA 4.3 4.0 4.8 4.1 5.4
Dividend yield % 4.5 6.1 4.7 6.1 2.5
5 Yr Avg AOCF/EV yield % 14.2 12.2 8.4 12.1 8.8
Source: Centrum Research
Exhibit 73: Balance Sheet
Y/E Mar(Rs mn) FY11 FY12 FY13 FY14 FY15
Equity Share Capital 687 687 687 687 687
Reserves & surplus 2,904 3,115 3,380 3,578 3,864
Shareholders' fund 3,591 3,802 4,067 4,264 4,550
Total Debt 0 550 1,702 1,896 1,327
Def tax liab. (net) 380 421 515 642 731
Total Liabilities 3,970 4,772 6,283 6,802 6,608
Gross Block 5,004 6,038 6,363 8,408 8,797
Less: Acc. Depreciation 2,116 2,400 2,679 2,945 3,378
Net Block 2,888 3,638 3,684 5,464 5,419
Capital WIP 703 214 1,198 227 313
Net Fixed Assets 3,591 3,852 4,882 5,691 5,731
Investments 0 0 0 0 0
Inventories 1,590 1,304 1,548 1,623 1,183
Sundry debtors 1,347 1,598 1,532 1,903 1,765
Cash 184 136 146 115 101
Loans & Advances 329 653 773 580 491
Other assets 43 2 3 4 7
Total Current Asset 3,492 3,693 4,001 4,225 3,547
Trade payables 2,565 2,061 1,998 2,456 2,043
Other current Liab. 273 435 347 414 359
Provisions 275 277 255 243 268
Net Current Assets 379 920 1,402 1,111 877
Total Assets 3,970 4,772 6,283 6,802 6,608
Source: Centrum Research
Exhibit 74: Cash Flow
Y/E Mar(Rs mn) FY11 FY12 FY13 FY14 FY15
Operating profit bef working capital changes
1,024 952 1,127 1,121 1,536
Changes in working capital (23) (620) (235) 77 206
Cash flow from operations 749 191 742 1,074 1,609
Adj. OCF (OCF - Interest) 707 86 590 845 1,311
Net Capex (480) (540) (1,589) (864) (584)
Adj. FCF 1,187 626 2,179 1,709 1,895
Cash flow from investments (470) (532) (1,580) (854) (566)
Cash flow from financing (261) 290 848 (251) (1,057)
Net change in cash 18 (52) 10 (31) (14)
Source: Centrum Research
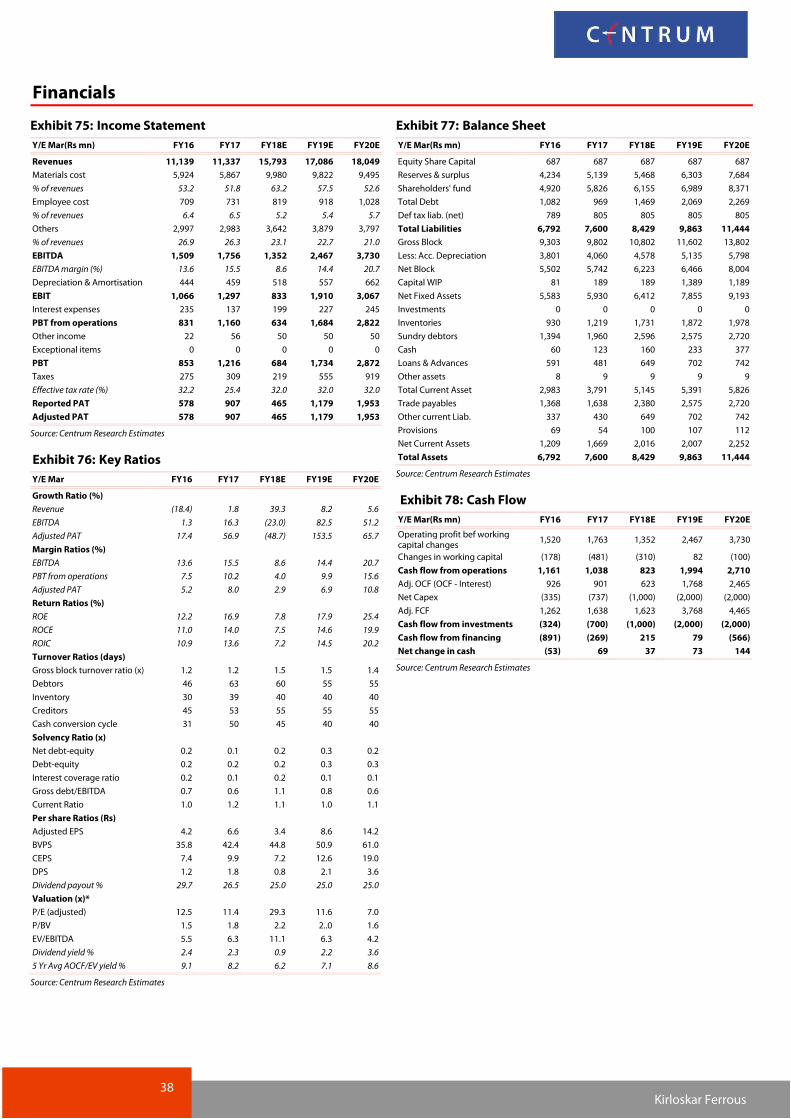
38 Kirloskar Ferrous
Financials
Exhibit 75: Income Statement
Y/E Mar(Rs mn) FY16 FY17 FY18E FY19E FY20E
Revenues 11,139 11,337 15,793 17,086 18,049
Materials cost 5,924 5,867 9,980 9,822 9,495
% of revenues 53.2 51.8 63.2 57.5 52.6
Employee cost 709 731 819 918 1,028
% of revenues 6.4 6.5 5.2 5.4 5.7
Others 2,997 2,983 3,642 3,879 3,797
% of revenues 26.9 26.3 23.1 22.7 21.0
EBITDA 1,509 1,756 1,352 2,467 3,730
EBITDA margin (%) 13.6 15.5 8.6 14.4 20.7
Depreciation & Amortisation 444 459 518 557 662
EBIT 1,066 1,297 833 1,910 3,067
Interest expenses 235 137 199 227 245
PBT from operations 831 1,160 634 1,684 2,822
Other income 22 56 50 50 50
Exceptional items 0 0 0 0 0
PBT 853 1,216 684 1,734 2,872
Taxes 275 309 219 555 919
Effective tax rate (%) 32.2 25.4 32.0 32.0 32.0
Reported PAT 578 907 465 1,179 1,953
Adjusted PAT 578 907 465 1,179 1,953
Source: Centrum Research Estimates
Exhibit 76: Key Ratios
Y/E Mar FY16 FY17 FY18E FY19E FY20E
Growth Ratio (%)
Revenue (18.4) 1.8 39.3 8.2 5.6
EBITDA 1.3 16.3 (23.0) 82.5 51.2
Adjusted PAT 17.4 56.9 (48.7) 153.5 65.7
Margin Ratios (%)
EBITDA 13.6 15.5 8.6 14.4 20.7
PBT from operations 7.5 10.2 4.0 9.9 15.6
Adjusted PAT 5.2 8.0 2.9 6.9 10.8
Return Ratios (%)
ROE 12.2 16.9 7.8 17.9 25.4
ROCE 11.0 14.0 7.5 14.6 19.9
ROIC 10.9 13.6 7.2 14.5 20.2
Turnover Ratios (days)
Gross block turnover ratio (x) 1.2 1.2 1.5 1.5 1.4
Debtors 46 63 60 55 55
Inventory 30 39 40 40 40
Creditors 45 53 55 55 55
Cash conversion cycle 31 50 45 40 40
Solvency Ratio (x)
Net debt-equity 0.2 0.1 0.2 0.3 0.2
Debt-equity 0.2 0.2 0.2 0.3 0.3
Interest coverage ratio 0.2 0.1 0.2 0.1 0.1
Gross debt/EBITDA 0.7 0.6 1.1 0.8 0.6
Current Ratio 1.0 1.2 1.1 1.0 1.1
Per share Ratios (Rs)
Adjusted EPS 4.2 6.6 3.4 8.6 14.2
BVPS 35.8 42.4 44.8 50.9 61.0
CEPS 7.4 9.9 7.2 12.6 19.0
DPS 1.2 1.8 0.8 2.1 3.6
Dividend payout % 29.7 26.5 25.0 25.0 25.0
Valuation (x)*
P/E (adjusted) 12.5 11.4 29.3 11.6 7.0
P/BV 1.5 1.8 2.2 2..0 1.6
EV/EBITDA 5.5 6.3 11.1 6.3 4.2
Dividend yield % 2.4 2.3 0.9 2.2 3.6
5 Yr Avg AOCF/EV yield % 9.1 8.2 6.2 7.1 8.6
Source: Centrum Research Estimates
Exhibit 77: Balance Sheet
Y/E Mar(Rs mn) FY16 FY17 FY18E FY19E FY20E
Equity Share Capital 687 687 687 687 687
Reserves & surplus 4,234 5,139 5,468 6,303 7,684
Shareholders' fund 4,920 5,826 6,155 6,989 8,371
Total Debt 1,082 969 1,469 2,069 2,269
Def tax liab. (net) 789 805 805 805 805
Total Liabilities 6,792 7,600 8,429 9,863 11,444
Gross Block 9,303 9,802 10,802 11,602 13,802
Less: Acc. Depreciation 3,801 4,060 4,578 5,135 5,798
Net Block 5,502 5,742 6,223 6,466 8,004
Capital WIP 81 189 189 1,389 1,189
Net Fixed Assets 5,583 5,930 6,412 7,855 9,193
Investments 0 0 0 0 0
Inventories 930 1,219 1,731 1,872 1,978
Sundry debtors 1,394 1,960 2,596 2,575 2,720
Cash 60 123 160 233 377
Loans & Advances 591 481 649 702 742
Other assets 8 9 9 9 9
Total Current Asset 2,983 3,791 5,145 5,391 5,826
Trade payables 1,368 1,638 2,380 2,575 2,720
Other current Liab. 337 430 649 702 742
Provisions 69 54 100 107 112
Net Current Assets 1,209 1,669 2,016 2,007 2,252
Total Assets 6,792 7,600 8,429 9,863 11,444
Source: Centrum Research Estimates
Exhibit 78: Cash Flow
Y/E Mar(Rs mn) FY16 FY17 FY18E FY19E FY20E
Operating profit bef working capital changes
1,520 1,763 1,352 2,467 3,730
Changes in working capital (178) (481) (310) 82 (100)
Cash flow from operations 1,161 1,038 823 1,994 2,710
Adj. OCF (OCF - Interest) 926 901 623 1,768 2,465
Net Capex (335) (737) (1,000) (2,000) (2,000)
Adj. FCF 1,262 1,638 1,623 3,768 4,465
Cash flow from investments (324) (700) (1,000) (2,000) (2,000)
Cash flow from financing (891) (269) 215 79 (566)
Net change in cash (53) 69 37 73 144
Source: Centrum Research Estimates

39 Kirloskar Ferrous
Appendix A
Disclaimer
Centrum Broking Limited (“Centrum”) is a full(service, Stock Broking Company and a member of The Stock Exchange, Mumbai (BSE) and National Stock Exchange of India Ltd. (NSE). Our holding company, Centrum Capital Ltd, is an investment banker and an underwriter of securities. As a group Centrum has Investment Banking, Advisory and other business relationships with a significant percentage of the companies covered by our Research Group. Our research professionals provide important inputs into the Group's Investment Banking and other business selection processes.
Recipients of this report should assume that our Group is seeking or may seek or will seek Investment Banking, advisory, project finance or other businesses and may receive commission, brokerage, fees or other compensation from the company or companies that are the subject of this material/report. Our Company and Group companies and their officers, directors and employees, including the analysts and others involved in the preparation or issuance of this material and their dependants, may on the date of this report or from, time to time have "long" or "short" positions in, act as principal in, and buy or sell the securities or derivatives thereof of companies mentioned herein. Centrum or its affiliates do not own 1% or more in the equity of this company Our sales people, dealers, traders and other professionals may provide oral or written market commentary or trading strategies to our clients that reflect opinions that are contrary to the opinions expressed herein, and our proprietary trading and investing businesses may make investment decisions that are inconsistent with the recommendations expressed herein. We may have earlier issued or may issue in future reports on the companies covered herein with recommendations/ information inconsistent or different those made in this report. In reviewing this document, you should be aware that any or all of the foregoing, among other things, may give rise to or potential conflicts of interest. We and our Group may rely on information barriers, such as "Chinese Walls" to control the flow of informaion contained in one or more areas within us, or other areas, units, groups or affiliates of Centrum. Centrum or its affiliates do not make a market in the security of the company for which this report or any report was written. Further, Centrum or its affiliates did not make a market in the subject company’s securities at the time that the research report was published.
This report is for information purposes only and this document/material should not be construed as an offer to sell or the solicitation of an offer to buy, purchase or subscribe to any securities, and neither this document nor anything contained herein shall form the basis of or be relied upon in connection with any contract or commitment whatsoever. This document does not solicit any action based on the material contained herein. It is for the general information of the clients of Centrum. Though disseminated to clients simultaneously, not all clients may receive this report at the same time. Centrum will not treat recipients as clients by virtue of their receiving this report. It does not constitute a personal recommendation or take into account the particular investment objectives, financial situations, or needs of individual clients. Similarly, this document does not have regard to the specific investment objectives, financial situation/circumstances and the particular needs of any specific person who may receive this document. The securities discussed in this report may not be suitable for all investors. The securities described herein may not be eligible for sale in all jurisdictions or to all categories of investors. The countries in which the companies mentioned in this report are organized may have restrictions on investments, voting rights or dealings in securities by nationals of other countries. The appropriateness of a particular investment or strategy will depend on an investor's individual circumstances and objectives. Persons who may receive this document should consider and independently evaluate whether it is suitable for his/ her/their particular circumstances and, if necessary, seek professional/financial advice. Any such person shall be responsible for conducting his/her/their own investigation and analysis of the information contained or referred to in this document and of evaluating the merits and risks involved in the securities forming the subject matter of this document.
The projections and forecasts described in this report were based upon a number of estimates and assumptions and are inherently subject to significant uncertainties and contingencies. Projections and forecasts are necessarily speculative in nature, and it can be expected that one or more of the estimates on which the projections and forecasts were based will not materialize or will vary significantly from actual results, and such variances will likely increase over time. All projections and forecasts described in this report have been prepared solely by the authors of this report independently of the Company. These projections and forecasts were not prepared with a view toward compliance with published guidelines or generally accented accounting principles. No independent accountants have expressed an opinion or any other form of assurance on these projections or forecasts. You should not regard the inclusion of the projections and forecasts described herein as a representation or warranty by or on behalf of the Company, Centrum, the authors of this report or any other person that these projections or forecasts or their underlying assumptions will be achieved. For these reasons, you should only consider the projections and forecasts described in this report after carefully evaluating all of the information in this report, including the assumptions underlying such projections and forecasts.
The price and value of the investments referred to in this document/material and the income from them may go down as well as up, and investors may realize losses on any investments. Past performance is not a guide for future performance. Future returns are not guaranteed and a loss of original capital may occur. Actual results may differ materially from those set forth in projections. Forward (looking statements are not predictions and may be subject to change without notice. Centrum does not provide tax advice to its clients, and all investors are strongly advised to consult regarding any potential investment. Centrum and its affiliates accept no liabilities for any loss or damage of any kind arising out of the use of this report. Foreign currencies denominated securities are subject to fluctuations in exchange rates that could have an adverse effect on the value or price of or income derived from the investment. In addition, investors in securities such as ADRs, the value of which are influenced by foreign currencies effectively assume currency risk. Certain transactions including those involving futures, options, and other derivatives as well as non(investment(grade securities give rise to substantial risk and are not suitable for all investors. Please ensure that you have read and understood the current risk disclosure documents before entering into any derivative transactions.
This report/document has been prepared by Centrum, based upon information available to the public and sources, believed to be reliable. No representation or warranty, express or implied is made that it is accurate or complete. Centrum has reviewed the report and, in so far as it includes current or historical information, it is believed to be reliable, although its accuracy and completeness cannot be guaranteed. The opinions expressed in this document/material are subject to change without notice and have no obligation to tell you when opinions or information in this report change.
This report or recommendations or information contained herein do/does not constitute or purport to constitute investment advice in publicly accessible media and should not be reproduced, transmitted or published by the recipient. The report is for the use and consumption of the recipient only. This publication may not be distributed to the public used by the public media without the express written consent of Centrum. This report or any portion hereof may not be printed, sold or distributed without the written consent of Centrum.
The distribution of this document in other jurisdictions may be restricted by law, and persons into whose possession this document comes should inform themselves about, and observe, any such restrictions. Neither Centrum nor its directors, employees, agents or representatives shall be liable for any damages whether direct or indirect, incidental, special or consequential including lost revenue or lost profits that may arise from or in connection with the use of the information.
This document does not constitute an offer or invitation to subscribe for or purchase or deal in any securities and neither this document nor anything contained herein shall form the basis of any contract or commitment whatsoever. This document is strictly confidential and is being furnished to you solely for your information, may not be distributed to the press or other media and may not be reproduced or redistributed to any other person. The distribution of this report in other jurisdictions may be restricted by law and persons into whose possession this report comes should inform themselves about, and observe any such restrictions. By accepting this report, you agree to be bound by the fore going limitations. No representation is made that this report is accurate or complete.

40 Kirloskar Ferrous
The opinions and projections expressed herein are entirely those of the author and are given as part of the normal research activity of Centrum Broking and are given as of this date and are subject to change without notice. Any opinion estimate or projection herein constitutes a view as of the date of this report and there can be no assurance that future results or events will be consistent with any such opinions, estimate or projection.
This document has not been prepared by or in conjunction with or on behalf of or at the instigation of, or by arrangement with the company or any of its directors or any other person. Information in this document must not be relied upon as having been authorized or approved by the company or its directors or any other person. Any opinions and projections contained herein are entirely those of the authors. None of the company or its directors or any other person accepts any liability whatsoever for any loss arising from any use of this document or its contents or otherwise arising in connection therewith.
Centrum and its affiliates have not managed or co(managed a public offering for the subject company in the preceding twelve months. Centrum and affiliates have not received compensation from the companies mentioned in the report during the period preceding twelve months from the date of this report for service in respect of public offerings, corporate finance, debt restructuring, investment banking or other advisory services in a merger/acquisition or some other sort of specific transaction.
As per the declarations given by them, Mr. Abhisar Jain research, analyst and and/or any of his family members do not serve as an officer, director or any way connected to the company/companies mentioned in this report. Further, as declared by him, he has not received any compensation from the above companies in the preceding twelve months. He does not hold any shares by him or through his relatives or in case if holds the shares then will not to do any transactions in the said scrip for 30 days from the date of release such report. Our entire research professionals are our employees and are paid a salary. They do not have any other material conflict of interest of the research analyst or member of which the research analyst knows of has reason to know at the time of publication of the research report or at the time of the public appearance.
While we would endeavour to update the information herein on a reasonable basis, Centrum, its associated companies, their directors and employees are under no obligation to update or keep the information current. Also, there may be regulatory, compliance or other reasons that may prevent Centrum from doing so.
While we would endeavour to update the information herein on a reasonable basis, Centrum, its associated companies, their directors and employees are under no obligation to update or keep the information current. Also, there may be regulatory, compliance or other reasons that may prevent Centrum from doing so.
Non(rated securities indicate that rating on a particular security has been suspended temporarily and such suspension is in compliance with applicable regulations and/or Centrum policies, in circumstances where Centrum is acting in an advisory capacity to this company, or any certain other circumstances.
This report is not directed to, or intended for distribution to or use by, any person or entity who is a citizen or resident of or located in any locality, state, country or other jurisdiction where such distribution, publication, availability or use would be contrary to law or regulation or which would subject Centrum Broking Limited or its group companies to any registration or licensing requirement within such jurisdiction. Specifically, this document does not constitute an offer to or solicitation to any U.S. person for the purchase or sale of any financial instrument or as an official confirmation of any transaction to any U.S. person unless otherwise stated, this message should not be construed as official confirmation of any transaction. No part of this document may be distributed in Canada or used by private customers in United Kingdom.
The information contained herein is not intended for publication or distribution or circulation in any manner whatsoever and any unauthorized reading, dissemination, distribution or copying of this communication is prohibited unless otherwise expressly authorized. Please ensure that you have read “Risk Disclosure Document for Capital Market and Derivatives Segments” as prescribed by Securities and Exchange Board of India before investing in Indian Securities Market.
KFIL price chart
Source: Bloomberg, Centrum Research
0
20
40
60
80
100
120
Nov-14 May-15 Nov-15 May-16 Nov-16 May-17 Nov-17
Kirloskar Ferrous Industries Ltd

41 Kirloskar Ferrous
Disclosure of Interest Statement
1 Business activities of Centrum Broking Limited (CBL)
Centrum Broking Limited (hereinafter referred to as “CBL”) is a registered member of NSE (Cash, F&O
and Currency Derivatives Segments), MCX-SX (Currency Derivatives Segment) and BSE (Cash
segment), Depository Participant of CDSL and a SEBI registered Portfolio Manager.
2 Details of Disciplinary History of CBL CBL has not been debarred/ suspended by SEBI or any other regulatory authority from accessing /dealing in securities market.
3 Registration status of CBL: CBL is registered with SEBI as a Research Analyst (SEBI Registration No. INH000001469)
KFIL
4 Whether Research analyst’s or relatives’ have any financial interest in the subject company and nature of such financial interest No
5 Whether Research analyst or relatives have actual / beneficial ownership of 1% or more in securities of the subject company at
the end of the month immediately preceding the date of publication of the document. No
6 Whether the research analyst or his relatives has any other material conflict of interest
No
7 Whether research analyst has received any compensation from the subject company in the past 12 months and nature of
products / services for which such compensation is received No
8 Whether the Research Analyst has received any compensation or any other benefits from the subject company or third party in
connection with the research report No
9 Whether Research Analysts has served as an officer, director or employee of the subject company No
10 Whether the Research Analyst has been engaged in market making activity of the subject company. No
Rating Criteria
Rating Market cap < Rs20bn Market cap > Rs20bn but < 100bn Market cap > Rs100bn
Buy Upside > 20% Upside > 15% Upside > 10%
Hold Upside between -20% to +20% Upside between -15% to +15% Upside between -10% to +10%
Sell Downside > 20% Downside > 15% Downside > 10%
Member (NSE and BSE)
Regn No.:
CAPITAL MARKET SEBI REGN. NO.: BSE: INB011454239 CAPITAL MARKET SEBI REGN. NO.: NSE: INB231454233 DERIVATIVES SEBI REGN. NO.: NSE: INF231454233
(TRADING & CLEARING MEMBER) CURRENCY DERIVATIVES: MCX-SX INE261454230
CURRENCY DERIVATIVES:NSE (TM & SCM) – NSE 231454233
Depository Participant (DP) CDSL DP ID: 120 – 12200
SEBI REGD NO. : CDSL : IN-DP-CDSL-661-2012
PORTFOLIO MANAGER
SEBI REGN NO.: INP000004383
Website: www.centrum.co.in Investor Grievance Email ID: [email protected]
Compliance Officer Details:
Kavita Ravichandran
(022) 4215 9842; Email ID: [email protected]
Centrum Broking Ltd. (CIN :U67120MH1994PLC078125)
Registered Office Address
Bombay Mutual Building ,
2nd Floor,
Dr. D. N. Road, Fort, Mumbai - 400 001
Corporate Office & Correspondence Address
Centrum House
6th Floor, CST Road, Near Vidya Nagari Marg, Kalina,
Santacruz (E), Mumbai 400 098.
Tel: (022) 4215 9000
Recommended