Business Analytics Capstone Framework for Strategy
Learner Name: Tang Chat Peng
Date: 1st May 2016

Problem Statement

Problem Statement–Describe the Problem Adblockers present to Yahoo
• Use this space for describing the problem. Be as specific as possible! Consider the implications of adblockers on the following: customers, revenue, and Yahoo’s internal organization.
•Background•Cost-per-click: Many advertisers pay money each time an ad is shown to a visitor (contrary to the popular notion that ads only pay when clicked).
•But ad blockers cut off this revenue stream and make it difficult to offset even the running cost of storing and delivering content to visitors.
•According to PageFair, ad-blocking software use grew 41 percent in the 12 months to August 2015. The number of ad block users have increased steadily as shown by the graph on next slide.

Problem Statement–Describe the Problem Adblockers present to Yahoo
• Use this space for describing the problem. Be as specific as possible! Consider the implications of adblockers on the following: customers, revenue, and Yahoo’s internal organization.
Reference: Statista.com

Problem Statement–Describe the Problem Adblockers present to Yahoo
• Use this space for describing the problem. Be as specific as possible! Consider the implications of adblockers on the following: customers, revenue, and Yahoo’s internal organization.
•How concerned should Yahoo be?
Reference: trefis.com
• Yahoo should be
concerned a lot.• Yahoo's business
model is founded on
selling digital
advertising on its Web
properties.
• As seen from left, most
of Yahoo's revenues
come from online and
mobile advertising,
where it relies heavily
on a patchwork of
companies to supply
advertising technology.

Problem Statement–Describe the Problem Adblockers present to Yahoo
• Use this space for describing the problem. Be as specific as possible! Consider the implications of adblockers on the following: customers, revenue, and Yahoo’s internal organization.
•Problem defined
•The increased use of ad-blocking software is a threat to Yahoo’s profit as Yahoo rely heavily on revenues from online and mobile advertising.

Problem Statement–Describe the Problem Adblockers present to Yahoo
• Use this space for describing the problem. Be as specific as possible! Consider the implications of adblockers on the following: customers, revenue, and Yahoo’s internal organization.
•What are ad blockers?•They are software which
•filter out ads from webpages, based on predefined filter lists.
•also block away pieces of code that “resemble” or uses iframes, bad scripts (such as analytics scripts), large blocks or files (images, videos).
Reference: http://marketing.happymarketer.com/how-
adblockers-help-content-marketing-through-mobile
Problem Statement–Describe the Problem Adblockers present to Yahoo
• Use this space for describing the problem. Be as specific as possible! Consider the implications of adblockers on the following: customers, revenue, and Yahoo’s internal organization.
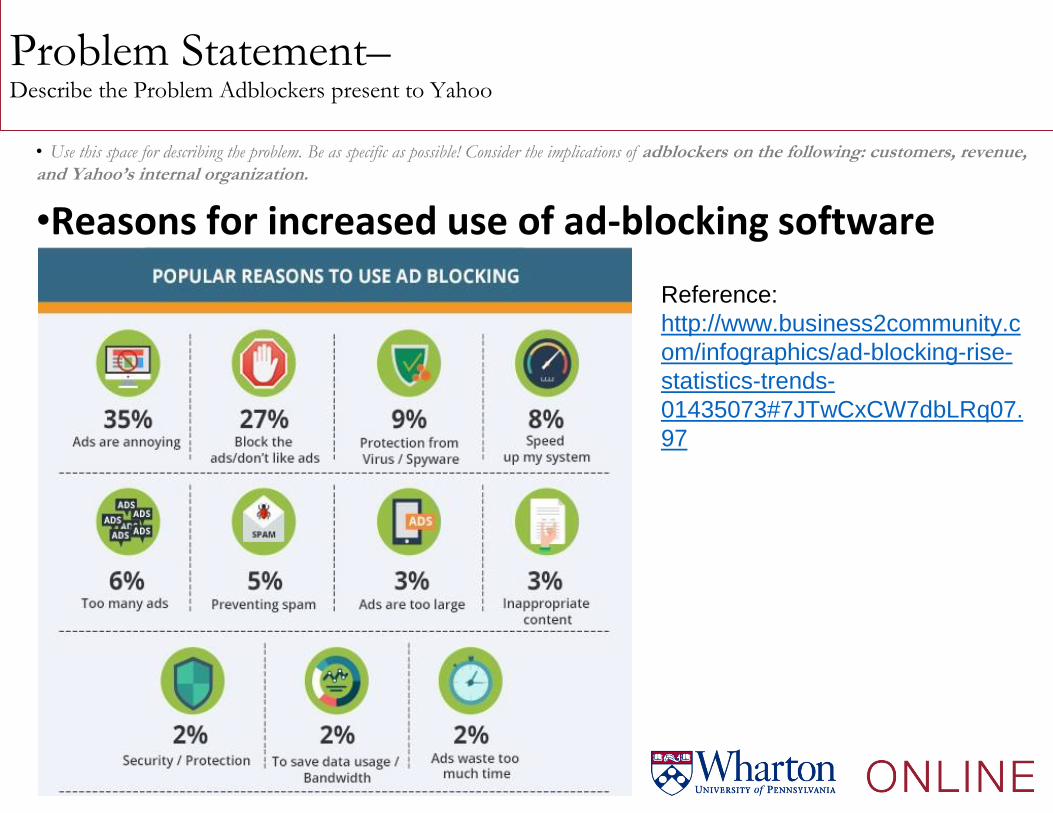
•Reasons for increased use of ad-blocking software
Reference:
http://www.business2community.c
om/infographics/ad-blocking-rise-
statistics-trends-
01435073#7JTwCxCW7dbLRq07.
97
Problem Statement–Describe the Problem Adblockers present to Yahoo
• Use this space for describing the problem. Be as specific as possible! Consider the implications of adblockers on the following: customers, revenue, and Yahoo’s internal organization.
•Implications on Customer Analytics•Increased use of Ad-blocking causes the loss of data:
•The loss of web data from consumers – basically all the different kinds of searches done on internet and all the different websites people might be visiting, etc.
•The loss of mobile data – the tracking of mobile app users and their locations

Problem Statement–Describe the Problem Adblockers present to Yahoo
• Use this space for describing the problem. Be as specific as possible! Consider the implications of adblockers on the following: customers, revenue, and Yahoo’s internal organization.
•Implications on Customer Analytics•What the loss of data means for Marketing Research:
•For Descriptive Research (An advertiser is aware of a problem): for passively observing behaviour (unobtrusive) – web data and mobile data – loss of data means less effective research leads to less effective managerial questions.
•For Causal Research (An advertiser has clearly defined a problem): Doing A/B testing will be less effective as adblockers are busy blocking trackers, social media sharing buttons and other features that you may be using to better understand your customers and measure your conversion goals.

Problem Statement–Describe the Problem Adblockers present to Yahoo
• Use this space for describing the problem. Be as specific as possible! Consider the implications of adblockers on the following: customers, revenue, and Yahoo’s internal organization.
•Implications on Customer Analytics•What the loss of data means for Predicting Consumer Behaviour:
•Regression analysis – not enough data at a certain time for independent variables (data for different ad campaigns that causes a certain consumer behaviour) to explain a dependent variable means:
•With too small a sample, regression model may over-fit the data, meaning it fits the sample data well, but does not generalize the whole population => can’t do regression effectively.
•Needs time to collect more web and mobile data which can be costly in the long run.
•Specific Example: Demand Analysis: With lack of data for Past Demand (past online and offline sales conversions) vs prices => can’t do regression properly => can’t adjust prices effectively to predict future demand.

Problem Statement–Describe the Problem Adblockers present to Yahoo
• Use this space for describing the problem. Be as specific as possible! Consider the implications of adblockers on the following: customers, revenue, and Yahoo’s internal organization.
•Implications on Customer Analytics•What the loss of data means for Marketing Decisions:
•For an advertiser: If we cannot predict consumer behaviour effectively for a certain independent variable , then we can’t find the optimal independent variable effectively to maximise revenue.
•eg. Demand Analysis: If we cannot predict demand effectively for a certain price, we cannot optimize price effectively to maximize revenue.
•What the loss of data means for Marketing Strategy:•For an advertiser, as it is more time-consuming and costly to gather, interpret and model info => less effective strategy for any upcoming ad campaign.
Problem Statement–Describe the Problem Adblockers present to Yahoo
• Use this space for describing the problem. Be as specific as possible! Consider the implications of adblockers on the following: customers, revenue, and Yahoo’s internal organization.
•Implications on Operations Analytics•What models would I use to predict the effects of adblockersand why?:
•I would use time-series based models with significant amount of data.
•Reason#1: The aim is to isolate patterns in past data so as to compare the effects without ad-blockers and the effects with ad-blockers easily.
•Reason#2: The expected effect is uncertain as we do not control user behaviour, as a result we cannot predict future user behaviour with certainty.

Problem Statement–Describe the Problem Adblockers present to Yahoo
• Use this space for describing the problem. Be as specific as possible! Consider the implications of adblockers on the following: customers, revenue, and Yahoo’s internal organization.
•Implications on Operations Analytics•Measuring Viewability to predict the effects of adblockers:
•Viewability is an online advertising metric that aims to track only impressions that can actually be seen by users. For example, if an ad is loaded at the bottom of a webpage but a user doesn't scroll down far enough to see it, that impression would not be deemed viewable.
•I choose Viewability as many advertisers pay money each time an ad is shown to a visitor.
•Predicted casual effect:
More ad-blocks lesser Viewability

Problem Statement–Describe the Problem Adblockers present to Yahoo
• Use this space for describing the problem. Be as specific as possible! Consider the implications of adblockers on the following: customers, revenue, and Yahoo’s internal organization.
•Measuring Viewability to predict the effects of adblockers(continued):
•For an ad campaign, for a PC webpage and mobile app each, steps:
1. Enable adblock detection and measurement. Build an in-house solution - can be done like downloading an image hosted on Yahoo’s server and then counting the hits to that image through the Apache server logs. (Reason: choices like uBlock, NoScript and Ghostery do block Flurry analytics)
2. Measure and collect Viewability without ad-blocks for >= 30 days–the number of visitors without ad-blocks who view the ad campaign on the webpage. Call it Set A.
3. Measure and collect Viewability with ad-blocks for the same period >= 30days – the number of visitors with ad-blocks who view the same ad campaign on the webpage. Call it Set B.

Problem Statement–Describe the Problem Adblockers present to Yahoo
• Use this space for describing the problem. Be as specific as possible! Consider the implications of adblockers on the following: customers, revenue, and Yahoo’s internal organization.
•Measuring Viewability to predict the effects of adblockers(continued):
4. Get sample means, sample standard deviations (make sure coefficient of variation = sample mean divided by sample standard deviations is less than 1) for Set A and Set B respectively. Hypothetical result: Set B’s mean Viewability should be significantly lower than Set A’s mean Viewability due to ad-blocking.
5. Can also plot Set A vs Set B for the same period of time. Hypothetically, Set B’s Viewability should be generally lower than Set A’s Viewability due to ad-blocking.
6. Repeat step 1-5 for a certain number of advertisers (eg.25) to see how Set A’s mean compare to Set B’s mean. Hypothetically, overall, Set B’s mean should be lower due to ad-blocking.

Problem Statement–Describe the Problem Adblockers present to Yahoo
• Use this space for describing the problem. Be as specific as possible! Consider the implications of adblockers on the following: customers, revenue, and Yahoo’s internal organization.
•Implications on Accounting Analytics•How would I calculate or predict any loss of revenue from adblockers:
1. Get an estimate of potential adblocked revenue (in 2015):statista.com: in 2015, no of global ad block users is around 198M and the no. of internet users is around 3.17 billion. So the global ad block rate is around 6.24%.
PageFair: in 2015: US ad block rate is around 14%.
PageFair, in 2015, the share of ad-block for desktop/PC is 98% and for mobile is 2%.
=> PC ad-block rate estimated to be 10%.
=> mobile ad-block rate estimated to be 0.3%.
=> 2015 PC estimate = 10% X desktop revenue (2015)
=> 2015 mobile estimate = 0.3% X mobile revenue (2015)

Problem Statement–Describe the Problem Adblockers present to Yahoo
• Use this space for describing the problem. Be as specific as possible! Consider the implications of adblockers on the following: customers, revenue, and Yahoo’s internal organization.
•How would I calculate or predict any loss of revenue from adblockers:
2. Put in calculations in a table for the year 2015 as shown below:
An example of a table which estimates the loss of revenue from ad
blocking in the year 2015 for Yahoo.

Problem Statement–Describe the Problem Adblockers present to Yahoo
• Use this space for describing the problem. Be as specific as possible! Consider the implications of adblockers on the following: customers, revenue, and Yahoo’s internal organization.
•Implications on Accounting Analytics•Non-Financial factors at play:
1. The increase in ad-blocking usage (as shown in past patterns)
2. The expected improvement in ad-blocking technology
3. Increase in ad-blocking usage leads to lower Advertisers Satisfaction which leads to a lower advertising revenue for Yahoo.

Problem Statement–Describe the Problem Adblockers present to Yahoo
• Use this space for describing the problem. Be as specific as possible! Consider the implications of adblockers on the following: customers, revenue, and Yahoo’s internal organization.
•Implications on People Analytics•Effects of adblockers on the internal organisation:
•Assuming no effective ad-blocking strategy is employed, increased use of adblockers leads to lower performance of Yahoo employees.
•Reason: External factor = increased use of adblocking is affecting the performance evaluations of individuals and groups in different departments.
•The lower performance of Yahoo employees will also lead to lesser data to correlate performance with various objective performance metrics. This leads to poorer hiring process due to ineffectiveness of using multivariate regression to separate out influences of different characteristics.

Problem Statement–Describe the Problem Adblockers present to Yahoo
• Use this space for describing the problem. Be as specific as possible! Consider the implications of adblockers on the following: customers, revenue, and Yahoo’s internal organization.
•Implications on People Analytics•Effects of adblockers on the internal organisation:
•Assuming no effective ad-blocking strategy is employed, increased use of adblockers also leads to higher advertising loss which leads to more cost-cutting which can in turn leads to internal unstableness –
•Weaker collaboration network (weaker overtime in individuals, group and whole of Yahoo’s organisation as measured by Network size, Network strength, Network range, Network density and Network centrality).
•Higher turnover rate
•Inability to attract better talentDiagram on left: An hypothetical scenario of
Survival Model when there is increased use
of adblocking and when there is insignificant
adblocking. A lower curve implies a higher
turnover rate

Strategy

StrategyDescribe your proposed strategy
• Make sure your strategy is clear, well-defined, and feasible
• Objectives of my strategy to deal with ad-blockers• To address the key challenges facing the industry by proposing a
desired future vision of what advertising could and should be, accompanied by a concrete set of actions to achieve that future.
• To deliver value and results for advertisers.
• To improve on users’ experience on Yahoo’s websites and mobile apps by delivering relevant content.
• To increase the revenue of Yahoo’s online ad business.
• To turn around Yahoo’s advertising business by gaining back shares in the worldwide ad market.
StrategyDescribe your proposed strategy
• Make sure your strategy is clear, well-defined, and feasible
My “Multiple Engagements” strategy• Nature of my strategy
• Incorporates a new mental model of advertising: To get people to view ads – listen to what people want and give them something of value.
• Approach to my strategy • Take a user-centric approach to ad blocking.
• Experience with different models and constantly evolve => have the adaptive capability to create a process for experimentation and undertake disciplined experimentation.
• Run different types of strategy in different types of Yahoo.

StrategyDescribe your proposed strategy
• Make sure your strategy is clear, well-defined, and feasible
• Definition of my strategy
• Actions to run internally:• Run a much improved clear content strategy:
• Human Resources team: Focused on hiring quality writers.
• Advertising team: Focused on dedicated resources to reporting the news. Framework for a successful content strategy is on next slide.

StrategyDescribe your proposed strategy
• Make sure your strategy is clear, well-defined, and feasible
• Run a much improved clear content strategy (continued)
Reference: https://www.adngin.com/blog/blogging-best-practices/do-buzz-news-publishers-need-a-new-content-strategy/

StrategyDescribe your proposed strategy
• Make sure your strategy is clear, well-defined, and feasible
• Actions to run internally (continued):• Advertising team: Through Yahoo’s websites and mobile apps,
use push notifications (Used by Google and Facebook) with the right content in real time to engage with targeted audience.
• Advertising team: Improve on selection and placement of online ads – make sure the ads are not intrusive and only place them in relevant categories of content.• Only allow an ad to be displayed with a specified minimum rating based on the
R.A.V.E.S metric. (Based on the advertisers engagement campaign to be discussed later in the slides.)

StrategyDescribe your proposed strategy
• Make sure your strategy is clear, well-defined, and feasible
• Actions to run internally (continued):• Technology team: Work on a new experimental feature to users
of Yahoo’s web and mobile apps: • A “News” tab that highlights news stories from its website and a
number of mainstream media partners, including the New York Times and USA Today.
• Can consist of a “Trending News” page that collects some of the top most-shared news articles from the company’s partners.
• Key reasons:• Yahoo hosts the content, the articles display much more quickly and look
better than they would otherwise.
• Yahoo has the massive audience reach it provides. Can follow Facebook’s Instant Articles revenue model: share advertising revenue with its news partners. (For Facebook: 100% if the media company sells its own ads, and 70% if they allow Facebook to handle the advertising).

StrategyDescribe your proposed strategy
• Make sure your strategy is clear, well-defined, and feasible
• Actions to run internally (continued):• Technology team: Do more in-image advertising in Native ads.
They are less obtrusive than usual banner ad units and offer contextually relevant offers that are more likely to meet consumers’ needs. Info about in-image advertising:
https://en.wikipedia.org/wiki/In-image_advertising

StrategyDescribe your proposed strategy
• Make sure your strategy is clear, well-defined, and feasible
• Definition of my strategy
• Actions to run externally:• Media team: Run an on-going user-engagement campaign:
• Inform the users about the impact ad blocking has on Yahoo’s businesses, that Yahoo understand their main concerns and that Yahoo is working towards a better user experience: Tell the users Yahoo is focusing on providing the best content with relevant and non-intrusive ads.
• Do this online on social media platforms like Facebook and Youtube. Do this offline by placing news articles on newspapers, magazines.

StrategyDescribe your proposed strategy
• Make sure your strategy is clear, well-defined, and feasible
• Actions to run externally (continued):• Media team: If the user-engagement campaign doesn’t work as
effectively (as measured from the effects covered later) after 3-4 months. For advertising and technical teams:• Do micropayments options where non-subscribers are given the
opportunity to pay for access to premium content on an ad-hoc basis.
• Micropayment model: Create a service which offers consumers an option of paying a small monthly figure in return for ad-free access to content.
• Must have yahoo accounts and be signed in to enable the system to associate a visit to a website with a specific consumer and apply the appropriate payment splits.
• Offers to reduce the number of ads although the service will replace ads with images acknowledging consumers’ contributions.

StrategyDescribe your proposed strategy
• Make sure your strategy is clear, well-defined, and feasible
• Actions to run externally (continued):• Run an on-going advertisers engagement campaign
• Advertising team: Focus on working with advertisers on making ads that are R.A.V.E.S – relevant, actionable, valuable and value-generating with an exceptional experience and a share-worthy story.
• For e.g. 2014 award winning video from #likeagirl, a female hygiene brand received more than 60 million views from Youtube. It is entertaining, informative, and thought-provoking.
https://www.youtube.com/watch?v=XjJQBjWYDTs
• Use a R.A.V.E.S metric to rate an advertisement.
• Only allow an ad to be displayed with a specified minimum rating based on the R.A.V.E.S metric.

StrategyDescribe your proposed strategy
• Make sure your strategy is clear, well-defined, and feasible
• Viability of my strategy• Yahoo is known for its rich contents in news, sports, finance and
lifestyle. By spending efforts on working on a much-improved clear content strategy, Yahoo can strengthen its fundamental news base.
• The costs of holding a user-engagement campaign and an advertisers engagement campaign are low relative to building Yahoo’s ad technology. Also in the long run, no matter how advantageous the ad technology is, users will find ways to install better ad blockers to block ads if they do not like them.

StrategyDescribe your proposed strategy
• Make sure your strategy is clear, well-defined, and feasible
• Viability of my strategy• A much better use of resources - instead of a battle against
consumer preferences, we create a mutually beneficial interaction.

Effects and Measurement

Effects and MeasurementDescribe the anticipated effects of your strategy and how you will measure them
• Please describe the anticipated effects of your strategy. Make sure you address the effects on customers, revenue, and the internal organization.
• Then, please outline your plan for measuring these effects using data. Make sure you use techniques you learned about in the courses
• Effects on Customer Analytics:• Causal Business Model:
“Multiple Engagements” Strategy (Keys: R.A.V.E.S Ads and Content Engagements) employed Improved User Engagement More Users of Yahoo’s websites and mobile apps Less Ad-blocksHigher Sales Conversion Advertisers Satisfaction -> More Advertisers paying Yahoo for online advertising Higher Advertising Revenue
We focus on effects of the strategy (in bold above) on Yahoo’s customers.

Effects and MeasurementDescribe the anticipated effects of your strategy and how you will measure them
• Please describe the anticipated effects of your strategy. Make sure you address the effects on customers, revenue, and the internal organization.
• Then, please outline your plan for measuring these effects using data. Make sure you use techniques you learned about in the courses
• Effects on Customer Analytics:• How I will measure these effects:
• Effect = Measure ad-block rates across different websites and mobile apps: build our own in-house solution – like downloading an image hosted on Yahoo’s server and then counting the hits to that image through the Apache server logs. (Reason: choices like uBlock, NoScript and Ghostery do block Flurry analytics)
• Effect = Measure Daily average users (DAUs) of Yahoo’s websites and mobile apps

Effects and MeasurementDescribe the anticipated effects of your strategy and how you will measure them
• Please describe the anticipated effects of your strategy. Make sure you address the effects on customers, revenue, and the internal organization.
• Then, please outline your plan for measuring these effects using data. Make sure you use techniques you learned about in the courses
• How I will measure these effects (continued):• For Effect = online sales for an advertiser: To get online sales
conversion for a certain period of time – specific steps:
1. Get click-through rate, CTR = number of clicks the advertiser’s ads receives divided by the number of times the ads is shown expressed as a percentage (clicks ÷ impressions = CTR).
2. Go to Using Time-Series Models to measure these effects, page 41.

Effects and MeasurementDescribe the anticipated effects of your strategy and how you will measure them
• Please describe the anticipated effects of your strategy. Make sure you address the effects on customers, revenue, and the internal organization.
• Then, please outline your plan for measuring these effects using data. Make sure you use techniques you learned about in the courses
• How I will measure these effects (continued):• For effect = offline sales: To get offline sales conversion for a certain
period of time – specific steps:
1. An advertiser starts an online advertising campaign with the help of my strategy through Yahoo’s websites and mobile apps.
2. Keep track of users who view the ads (by keeping track of paths through retargeting across different channels)
3. Keep track of converted users who end up buying in the advertiser's physical stores by matching against the advertiser’s customer database.
4. Offline sales conversion = 𝑁𝑢𝑚𝑏𝑒𝑟 𝑜𝑓 𝑐𝑜𝑛𝑣𝑒𝑟𝑡𝑒𝑑 𝑢𝑠𝑒𝑟𝑠
𝑁𝑢𝑚𝑏𝑒𝑟 𝑜𝑓 𝑡𝑟𝑎𝑐𝑘𝑒𝑑 𝑢𝑠𝑒𝑟𝑠
5. Go to Using Time Series models to measure these effects, page 41. Hypothetical example is shown on next slide.

Effects and MeasurementDescribe the anticipated effects of your strategy and how you will measure them
• Please describe the anticipated effects of your strategy. Make sure you address the effects on customers, revenue, and the internal organization.
• Then, please outline your plan for measuring these effects using data. Make sure you use techniques you learned about in the courses
The chart above shows an example of an actual data from an AdRoll customer – showing the conversion ratio before and after the launch of an retargeting advertising campaign.For eg. If you tracked all 10,000 users and then got a total of 120 customers => at 1.2% conversion ratio. Ref: https://blog.adroll.com/product/measuring-retargeting

Effects and MeasurementDescribe the anticipated effects of your strategy and how you will measure them
• Please describe the anticipated effects of your strategy. Make sure you address the effects on customers, revenue, and the internal organization.
• Then, please outline your plan for measuring these effects using data. Make sure you use techniques you learned about in the courses
• Using Time-Series models to measure these effects:1. Collect significant amount of data for each effect (eg. Ad-block rates)
for a period of time when no strategy is employed = Set A and when strategy is employed = Set B
2. For online and offline sales conversion, de-seasonalize the data (steps and example on how to de-seasonalize is Operations Analytics course, Week 1, page 17-22 of the slides.)
3. For both Sets A and B, get sample means and sample standard deviation.
4. If Set B’s sample mean is > set A ‘s sample mean significantly (opposite for effect = Ad-block rate) AND set B’s coefficient of variation (sample standard deviation ÷ sample mean) is < 1 => strategy is working.
Effects and MeasurementDescribe the anticipated effects of your strategy and how you will measure them
• Please describe the anticipated effects of your strategy. Make sure you address the effects on customers, revenue, and the internal organization.
• Then, please outline your plan for measuring these effects using data. Make sure you use techniques you learned about in the courses
• Using Time-Series models to measure these effects(continued):5. For online sales and offline sales conversions only, repeat step 1 -4 for
each advertisers for a significant number of advertisers(eg. >100) so as to show the significant effect of my strategy.

Effects and MeasurementDescribe the anticipated effects of your strategy and how you will measure them
• Please describe the anticipated effects of your strategy. Make sure you address the effects on customers, revenue, and the internal organization.
• Then, please outline your plan for measuring these effects using data. Make sure you use techniques you learned about in the courses
• Effects on Customer Analytics:• Changes meant for market research:

Effects and MeasurementDescribe the anticipated effects of your strategy and how you will measure them
• Please describe the anticipated effects of your strategy. Make sure you address the effects on customers, revenue, and the internal organization.
• Then, please outline your plan for measuring these effects using data. Make sure you use techniques you learned about in the courses
• Changes meant for market research (continued):• When you want to improve the view of an R.A.V.E.S ad campaign, do
A/B testing, using A/B testing software
1. Assign variation to an optimized ad campaign on the same webpage or app.
2. Assign control to an ad campaign(before optimization) on webpage or app.
3. Kick off your experiment and wait for visitors to participate. Visitors will be randomly assigned to either the control or variation of your experience. Their interaction with each experience is measured, counted, and compared to determine how each performs.
4. Analyze Results. A/B testing software will present the data from the experiment and show you the difference between how the two versions of your page performed, and whether there is a statistically significant difference.

Effects and MeasurementDescribe the anticipated effects of your strategy and how you will measure them
• Please describe the anticipated effects of your strategy. Make sure you address the effects on customers, revenue, and the internal organization.
• Then, please outline your plan for measuring these effects using data. Make sure you use techniques you learned about in the courses
• Effects on Customer Analytics:• Changes meant for predictive analytics:
• Advertisers can use regression analysis to do predictive analytics to predict online and offline sales if they change the price of a product.
Steps:
1. With strategy employed, for online and offline sales conversion each, collect data for demands at different prices. Price = independent variable. Demand = dependent variable.
2. Plot the graph of Quantity (Demand) vs Price.
3. If overall pattern on graph is such that as price goes up, Quantity goes down, find the line of best fit. Make sure R2 which tells you how good the regression line is is at least more or equal to 70% before continuing.

Effects and MeasurementDescribe the anticipated effects of your strategy and how you will measure them
• Please describe the anticipated effects of your strategy. Make sure you address the effects on customers, revenue, and the internal organization.
• Then, please outline your plan for measuring these effects using data. Make sure you use techniques you learned about in the courses
• Changes meant for predictive analytics (continued):4. From the line of best fit, Quantity = a + b(Price) + e
Where a = y-intercept, b = price sensitivity and e = error.
An hypothetical example is shown on next slide.

Effects and MeasurementDescribe the anticipated effects of your strategy and how you will measure them
• Please describe the anticipated effects of your strategy. Make sure you address the effects on customers, revenue, and the internal organization.
• Then, please outline your plan for measuring these effects using data. Make sure you use techniques you learned about in the courses
An example of a Quantity vs Price graph from Customer Analytics course.

Effects and MeasurementDescribe the anticipated effects of your strategy and how you will measure them
• Please describe the anticipated effects of your strategy. Make sure you address the effects on customers, revenue, and the internal organization.
• Then, please outline your plan for measuring these effects using data. Make sure you use techniques you learned about in the courses
• Changes meant for predictive analytics (continued):
5. To do prediction, start by looking at the line and start inserting different prices that are not in the data set. Thus predictions can be done for different prices.
An example from Customer Analytics course of how we can make Quantity predictions(the right column) by inserting different price (on the left column)

Effects and MeasurementDescribe the anticipated effects of your strategy and how you will measure them
• Please describe the anticipated effects of your strategy. Make sure you address the effects on customers, revenue, and the internal organization.
• Then, please outline your plan for measuring these effects using data. Make sure you use techniques you learned about in the courses
• Changes meant for predictive analytics (continued):
• Can also use regression to do cover multiple independent variables if R2 is more or equal to 70% for Quantity vs another independent variable = advertising expenditure.
Example:
Quantity = a + b(Price) + c(Adv) +e
Where Adv = advertising expenditure and follow the same steps as discussed.

Effects and MeasurementDescribe the anticipated effects of your strategy and how you will measure them
• Please describe the anticipated effects of your strategy. Make sure you address the effects on customers, revenue, and the internal organization.
• Then, please outline your plan for measuring these effects using data. Make sure you use techniques you learned about in the courses
• Effects on Customer Analytics:• Changes meant for marketing decisions:
• Advertisers can use regression analysis to find the price that generates max online sales and offline sales respectively. Steps:
1. Continuing from Changes meant for predictive analytics steps, page 16, with data for demands at different prices (demand follows regression equation), calculate Revenue = Demand X Price. Example of a revenue table data shown on next slide.
2. Plot graph of Revenue vs Price.
3. Find the maximum Revenue.
4. Find the optimal price that corresponds to this maximum revenue. Example of graph of Revenue vs Price shown on next slide.

Effects and MeasurementDescribe the anticipated effects of your strategy and how you will measure them
• Please describe the anticipated effects of your strategy. Make sure you address the effects on customers, revenue, and the internal organization.
• Then, please outline your plan for measuring these effects using data. Make sure you use techniques you learned about in the courses
Examples of a data table and graph of Revenue vs Price from Customer Analytics course to find the optimal price for max revenue.

Effects and MeasurementDescribe the anticipated effects of your strategy and how you will measure them
• Please describe the anticipated effects of your strategy. Make sure you address the effects on customers, revenue, and the internal organization.
• Then, please outline your plan for measuring these effects using data. Make sure you use techniques you learned about in the courses
• Effects on Customer Analytics:• Changes meant for marketing decisions:
• Advertisers can use regression analysis to find the price that generates max online profit and offline profit respectively. Steps:
1. Continuing from last table of data with Demand, Price and Revenue, create 2 more columns: One for cost of those products sold and the other column = Profit = Revenue - Cost.
2. Plot graph of Profit vs Price.
3. Find the max profit.
4. Find the optimal price that corresponds to this maximum profit. Example of graph of Revenue vs Price shown on next slide.

Effects and MeasurementDescribe the anticipated effects of your strategy and how you will measure them
• Please describe the anticipated effects of your strategy. Make sure you address the effects on customers, revenue, and the internal organization.
• Then, please outline your plan for measuring these effects using data. Make sure you use techniques you learned about in the courses
Examples of a data table and graph of Profit vs Price from Customer Analytics course to find the optimal price for max profit.

Effects and MeasurementDescribe the anticipated effects of your strategy and how you will measure them
• Please describe the anticipated effects of your strategy. Make sure you address the effects on customers, revenue, and the internal organization.
• Then, please outline your plan for measuring these effects using data. Make sure you use techniques you learned about in the courses
• Effects on Customer Analytics:• Changes meant for marketing strategy:
• Based on the results of market research(doing AB testing), predictive analytics(adjustment of price to predict online sales and offline sales respectively) and marketing decisions (to find optimized prices to find max online sales an offline sales and max online and offline profits), advertisers can adjust our strategy for a much improved upcoming ad campaign.

Effects and MeasurementDescribe the anticipated effects of your strategy and how you will measure them
• Please describe the anticipated effects of your strategy. Make sure you address the effects on customers, revenue, and the internal organization.
• Then, please outline your plan for measuring these effects using data. Make sure you use techniques you learned about in the courses
• Effects on Operations Analytics:• Models to measure the effects of my strategy:
• I use time series models to measure the effects of my strategy as discussed in detail in Effects on Customer Analytics.
• Reason #1: We can easily take into account the period in which no strategy is employed and the period in which the strategy is employed.
• Reason #2: The expected data is uncertain as we do not control purchasing behavior, as a result we cannot predict future demand with certainty.

Effects and MeasurementDescribe the anticipated effects of your strategy and how you will measure them
• Please describe the anticipated effects of your strategy. Make sure you address the effects on customers, revenue, and the internal organization.
• Then, please outline your plan for measuring these effects using data. Make sure you use techniques you learned about in the courses
• Effects on Operations Analytics:• Models to measure the effects of my strategy (continued):
• Steps for Operations problem for advertisers(They have to know how to make a decision to forecast demand for a product before a demand is known.) For each advertiser:
1. For online and offline sales only, continuing from Using Time-Series Models to measure these effects, page 41 in Effects on Customer Analytics, if strategy is working, plot Set B – the graph of sales conversion(past demand) vs time)

Effects and MeasurementDescribe the anticipated effects of your strategy and how you will measure them
• Please describe the anticipated effects of your strategy. Make sure you address the effects on customers, revenue, and the internal organization.
• Then, please outline your plan for measuring these effects using data. Make sure you use techniques you learned about in the courses
• Models to measure the effects of my strategy (continued):2. If there is no trend in the plot, then assuming past demand data is in
continuous probability distribution – Normal distribution,
Mean for prediction = Descriptive Sample Mean
Sample deviation for prediction = s + 𝑠
𝑛
where s = sample standard deviation and n = number of data in set B.
Make sure coefficient of variation is less than 1

Effects and MeasurementDescribe the anticipated effects of your strategy and how you will measure them
• Please describe the anticipated effects of your strategy. Make sure you address the effects on customers, revenue, and the internal organization.
• Then, please outline your plan for measuring these effects using data. Make sure you use techniques you learned about in the courses
• Models to measure the effects of my strategy (continued):
3. If the plot of Set B reveals trend, we can fit a trend line and use linear regression to predict demand.
Where the model is
Demand D = a + b(time)
4. Evaluate the advertisers’ forecasts: 3 ways to measure error (details on operations analytics week 1 slides 2, page 23 – 28):
1. Find Mean Absolute Demand or MAD
2. Mean Squared Error or MSE
3. Mean Absolute Percentage Error or MAPE

Effects and MeasurementDescribe the anticipated effects of your strategy and how you will measure them
• Please describe the anticipated effects of your strategy. Make sure you address the effects on customers, revenue, and the internal organization.
• Then, please outline your plan for measuring these effects using data. Make sure you use techniques you learned about in the courses
• Models to measure the effects of my strategy (continued):5. If there is no trend in Set B (past demand vs time)=> the expected data
is uncertain => we can use mean for prediction to run a simulation (Go to hypothetical example on next slide for more detail) to obtain estimates of reward and risk.
6. Continuing from step 5, do optimization (Go to hypothetical example on next slide for more detail) to decide on the quantity to maximize profit.

Effects and MeasurementDescribe the anticipated effects of your strategy and how you will measure them
• Please describe the anticipated effects of your strategy. Make sure you address the effects on customers, revenue, and the internal organization.
• Then, please outline your plan for measuring these effects using data. Make sure you use techniques you learned about in the courses
• Models to measure the effects of my strategy (continued):Hypothetical example to run simulation and do optimization:
Simulation (1000 times):
For Set B: Mean for prediction = 52.81. Sample deviation for prediction = 15.10.
Algebraic formulation:
Given unit cost of a product = $3, sales price of product = $12:
Order = Q, Demand = D
Profit P = 12 X min (D, Q) – 3Q (non-linear)
For each sample demand D, calculate profit.

Effects and MeasurementDescribe the anticipated effects of your strategy and how you will measure them
• Please describe the anticipated effects of your strategy. Make sure you address the effects on customers, revenue, and the internal organization.
• Then, please outline your plan for measuring these effects using data. Make sure you use techniques you learned about in the courses
• Models to measure the effects of my strategy (continued):Hypothetical example to run simulation and do optimization - link:
https://docs.google.com/spreadsheets/d/1Wfe5g6-i9O2XDjTni-x2DJ77HYcVJG0__qfpUT0USWQ/edit?usp=sharing
Optimization:
Decide on Q to maximize profit.
Q = Order quantity = Decision variable
Average profit = Objective function = reward
Can place constraints on minimum and maximum order quantity.
Suppose we want to limit the retailor’s risk: Limit the standard deviation of the profit <= $100
Optimal quantity = 51.1

Effects and MeasurementDescribe the anticipated effects of your strategy and how you will measure them
• Please describe the anticipated effects of your strategy. Make sure you address the effects on customers, revenue, and the internal organization.
• Then, please outline your plan for measuring these effects using data. Make sure you use techniques you learned about in the courses
My specific example of optimization

Effects and MeasurementDescribe the anticipated effects of your strategy and how you will measure them
• Please describe the anticipated effects of your strategy. Make sure you address the effects on customers, revenue, and the internal organization.
• Then, please outline your plan for measuring these effects using data. Make sure you use techniques you learned about in the courses
• Effects on Accounting Analytics:• Causal Business Model:
“Multiple Engagements” Strategy (Keys: R.A.V.E.S Ads and Content Engagements) employed Improved User Engagement More Users of Yahoo’s websites and mobile apps Less Ad-blocks Higher Sales Conversion Advertisers Satisfaction -> More Advertisers paying Yahoo for online advertising Higher Advertising Revenue
We focus on effects of the strategy (in bold above).

Effects and MeasurementDescribe the anticipated effects of your strategy and how you will measure them
• Please describe the anticipated effects of your strategy. Make sure you address the effects on customers, revenue, and the internal organization.
• Then, please outline your plan for measuring these effects using data. Make sure you use techniques you learned about in the courses
• Effects on Accounting Analytics:• How would I calculate or predict any gain or loss of revenue from
my strategy:• Steps to linking non-financial metrics to financial performance
1. Identify the right drivers.
a) Hypothesis in the business model: Advertisers Satisfaction leads to more advertisers paying for Yahoo for online advertising leads to higher advertising revenue. Main Non-financial factor = Advertisers Satisfaction.
b) Link drivers of Advertisers Satisfaction to intermediate outcomes. How? Identify drivers and immediate outcomes of Advertisers Satisfaction. Construct valid and reliable measures for them and do marketing research by doing focus groups with advertisers.

Effects and MeasurementDescribe the anticipated effects of your strategy and how you will measure them
• Please describe the anticipated effects of your strategy. Make sure you address the effects on customers, revenue, and the internal organization.
• Then, please outline your plan for measuring these effects using data. Make sure you use techniques you learned about in the courses
For step 1b: Hypothetical example of linking Advertisers Satisfaction to intermediate outcomes. The drivers are in the blue boxes. The intermediate outcomes are in the green boxes. The numbers in the circles are performance scores (0-100) for each boxes. The numbers on the arrows are coefficients from a regression model. Example: If inverse ad blocks rate = + 1, Advertisers Satisfaction = +0.8 and Recommendation = +0.8. Keep note of cost of Increasing score too.
Ref: Accounting Analytics Week 4 slides

Effects and MeasurementDescribe the anticipated effects of your strategy and how you will measure them
• Please describe the anticipated effects of your strategy. Make sure you address the effects on customers, revenue, and the internal organization.
• Then, please outline your plan for measuring these effects using data. Make sure you use techniques you learned about in the courses
• How would I calculate or predict any gain or loss of revenue from my strategy only (continued):
1c. Do further research: Hypothetical example:
Reference: Accounting
analytics, week 4 slides

Effects and MeasurementDescribe the anticipated effects of your strategy and how you will measure them
• Please describe the anticipated effects of your strategy. Make sure you address the effects on customers, revenue, and the internal organization.
• Then, please outline your plan for measuring these effects using data. Make sure you use techniques you learned about in the courses
• How would I calculate or predict any gain or loss of revenue from my strategy only (continued):
2. Set targets: Which advertisers(customers) do Yahoo want to focus on? Hypothetical example: Focus on the people you are going to get the biggest bang for the buck – the people in the red bars –about 16% of the customers,
Reference: Accounting Analytics Week 4 slides

Effects and MeasurementDescribe the anticipated effects of your strategy and how you will measure them
• Please describe the anticipated effects of your strategy. Make sure you address the effects on customers, revenue, and the internal organization.
• Then, please outline your plan for measuring these effects using data. Make sure you use techniques you learned about in the courses
• How would I calculate or predict any gain or loss of revenue from my strategy only (continued):
3. Come up with a financial model to calculate Net Present Value of Action Plan = gain of revenue from strategy.
Hypothetical: Assume after 5 years, advertisers satisfaction will have no impact due to disruption of new technology. Link:
https://docs.google.com/spreadsheets/d/1ySpVzS2mAvsVLZYRCkYv1eJurWtmmNb9-yMrQ_JdDy0/edit?usp=sharing

Effects and MeasurementDescribe the anticipated effects of your strategy and how you will measure them
• Please describe the anticipated effects of your strategy. Make sure you address the effects on customers, revenue, and the internal organization.
• Then, please outline your plan for measuring these effects using data. Make sure you use techniques you learned about in the courses
• Effects on People Analytics:• Causal Effects on Yahoo’s internal organisation:
• “Multiple Engagements” strategy (key = R.A.V.E.S ads and content engagements) executed leads to better collaboration between employees inside Yahoo AND better performance of employees AND lower turnover rate

Effects and MeasurementDescribe the anticipated effects of your strategy and how you will measure them
• Please describe the anticipated effects of your strategy. Make sure you address the effects on customers, revenue, and the internal organization.
• Then, please outline your plan for measuring these effects using data. Make sure you use techniques you learned about in the courses
• Effects on People Analytics:• How I will measure effect = better collaboration of employees:
1. capture collaboration patterns by collecting network data from 3 sources:
Reference: People Aanlytics course slides
Effects and MeasurementDescribe the anticipated effects of your strategy and how you will measure them
• Please describe the anticipated effects of your strategy. Make sure you address the effects on customers, revenue, and the internal organization.
• Then, please outline your plan for measuring these effects using data. Make sure you use techniques you learned about in the courses
• How I will measure effect = better collaboration of employees:2. Evaluate collaboration patterns: do simple descriptive statistics on 5 building blocks (Network size, Network strength,Network range, Network density and Network centrality).
- compare across individuals
- compare changes over time (period when strategy is not employed vs period when strategy is employed)
=> if there is statistically significant improvement in collaboration changes over time in individuals, group and whole of Yahoo’s organisation => better collaboration of employees.

Effects and MeasurementDescribe the anticipated effects of your strategy and how you will measure them
• Please describe the anticipated effects of your strategy. Make sure you address the effects on customers, revenue, and the internal organization.
• Then, please outline your plan for measuring these effects using data. Make sure you use techniques you learned about in the courses
Example of evaluating collaboration by doing descriptive statistics on 1 building block = Network size - comparing across individuals only.

Effects and MeasurementDescribe the anticipated effects of your strategy and how you will measure them
• Please describe the anticipated effects of your strategy. Make sure you address the effects on customers, revenue, and the internal organization.
• Then, please outline your plan for measuring these effects using data. Make sure you use techniques you learned about in the courses
• How I will measure effect = better performance of employees:
Make sure the performance criteria is fulfilled for performance evaluation:
Criteria from People Analytics course.
Effects and MeasurementDescribe the anticipated effects of your strategy and how you will measure them
• Please describe the anticipated effects of your strategy. Make sure you address the effects on customers, revenue, and the internal organization.
• Then, please outline your plan for measuring these effects using data. Make sure you use techniques you learned about in the courses
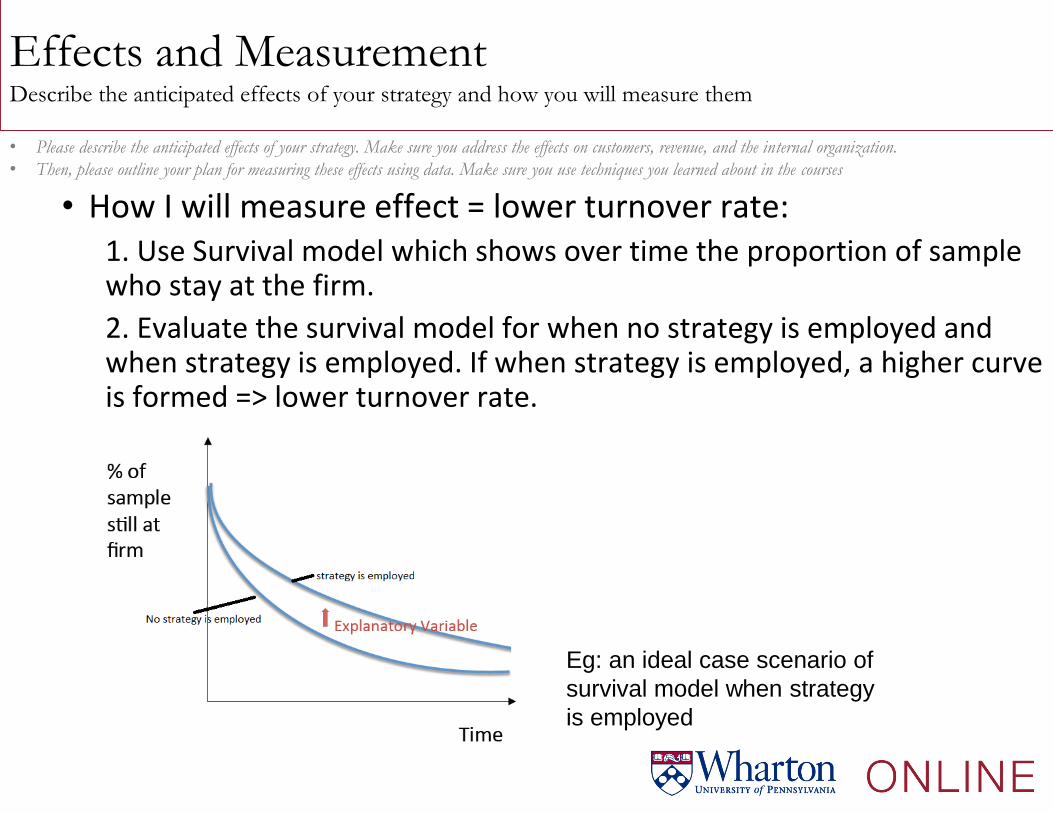
• How I will measure effect = lower turnover rate:1. Use Survival model which shows over time the proportion of sample who stay at the firm.
2. Evaluate the survival model for when no strategy is employed and when strategy is employed. If when strategy is employed, a higher curve is formed => lower turnover rate.
Eg: an ideal case scenario of
survival model when strategy
is employed

Effects and MeasurementDescribe the anticipated effects of your strategy and how you will measure them
• Please describe the anticipated effects of your strategy. Make sure you address the effects on customers, revenue, and the internal organization.
• Then, please outline your plan for measuring these effects using data. Make sure you use techniques you learned about in the courses
• Suitability of the Measurement Plan:• For effects on Customer Analytics and Operations Analytics – As web and
mobile data is always collected by Yahoo analytics team, measurements of effects like Ad-block rate, Daily Average Users (DAUs), Click-through Rate and offline sales conversion (by working with advertisers to get mutual benefits) are essential.
• For effects on Accounting analytics, it is important to link non-financial metrics to financial performance to forecast future financial performance. • Suitability: Yahoo has rich data to test value propositions.
• Key advantage: Once we set up an ongoing mechanism, analyses can be used to continually refine strategy, value propositions and measures.

Effects and MeasurementDescribe the anticipated effects of your strategy and how you will measure them
• Please describe the anticipated effects of your strategy. Make sure you address the effects on customers, revenue, and the internal organization.
• Then, please outline your plan for measuring these effects using data. Make sure you use techniques you learned about in the courses
• Suitability of the Measurement Plan:• For effects on People analytics, information on large networks is normally
available. Collecting data from 3 sources: Big data, archival records, fieldwork also provides more objective measures, less invasive and less expensive than doing surveys internally.
Recommended