Confidential
Mark Mitchell [email protected]
Building Embedded Intel Applications With Open-Source Tools

Introduction
Apr-12-10 Confidential 2

Which Embedded Architectures Are You Using?
Intel
ARM
ColdFire
MIPS
Power
SuperH
Other
Apr-12-10 Confidential 3

Which Embedded Operating Systems?
Apr-12-10 Confidential 4
BSD FreeRTOS GNU/Linux QNX ThreadX vxWorks None

Embedded Systems Are Different
Apr-12-10 Confidential 5

Fewer Programming Languages
Apr-12-10 Confidential 6
C
C++
Assembly
Python
Perl
Java
Ruby
C# Visual Basic
Fortran
LISP
Haskell
CAML

Fewer Programming Languages
Apr-12-10 Confidential 7
C
C++
Assembly
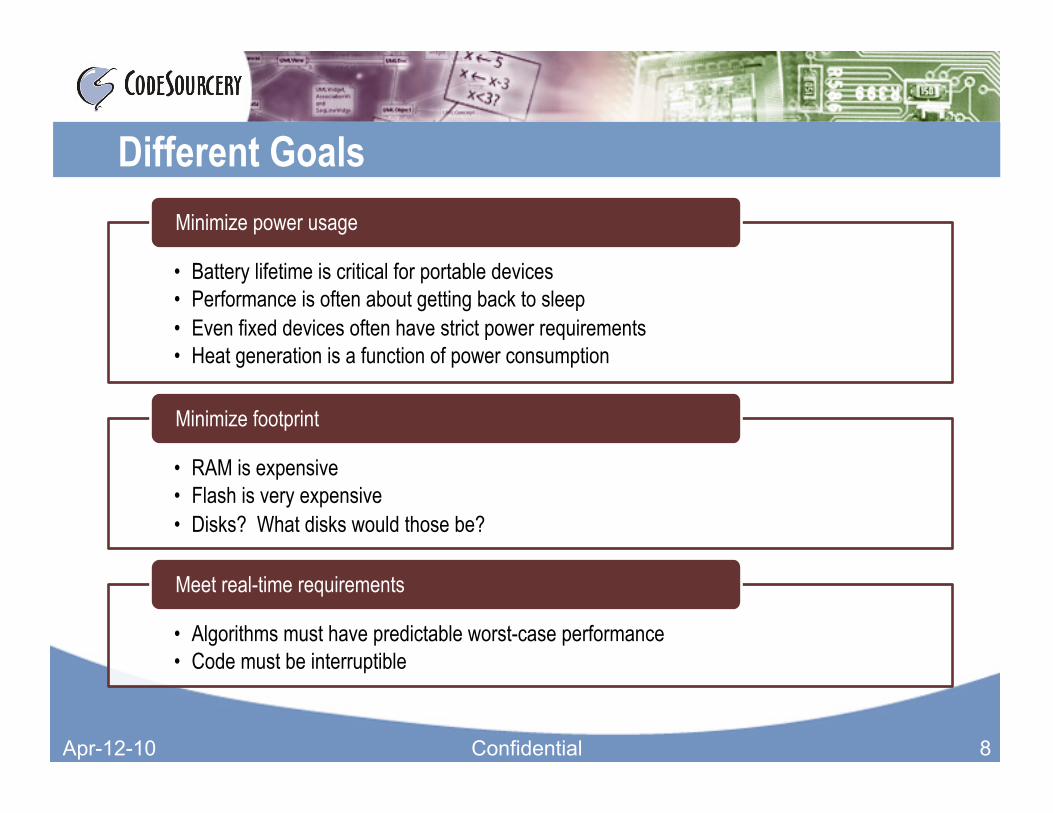
Different Goals
• Battery lifetime is critical for portable devices • Performance is often about getting back to sleep • Even fixed devices often have strict power requirements • Heat generation is a function of power consumption
Minimize power usage
• RAM is expensive • Flash is very expensive • Disks? What disks would those be?
Minimize footprint
• Algorithms must have predictable worst-case performance • Code must be interruptible
Meet real-time requirements
Apr-12-10 Confidential 8
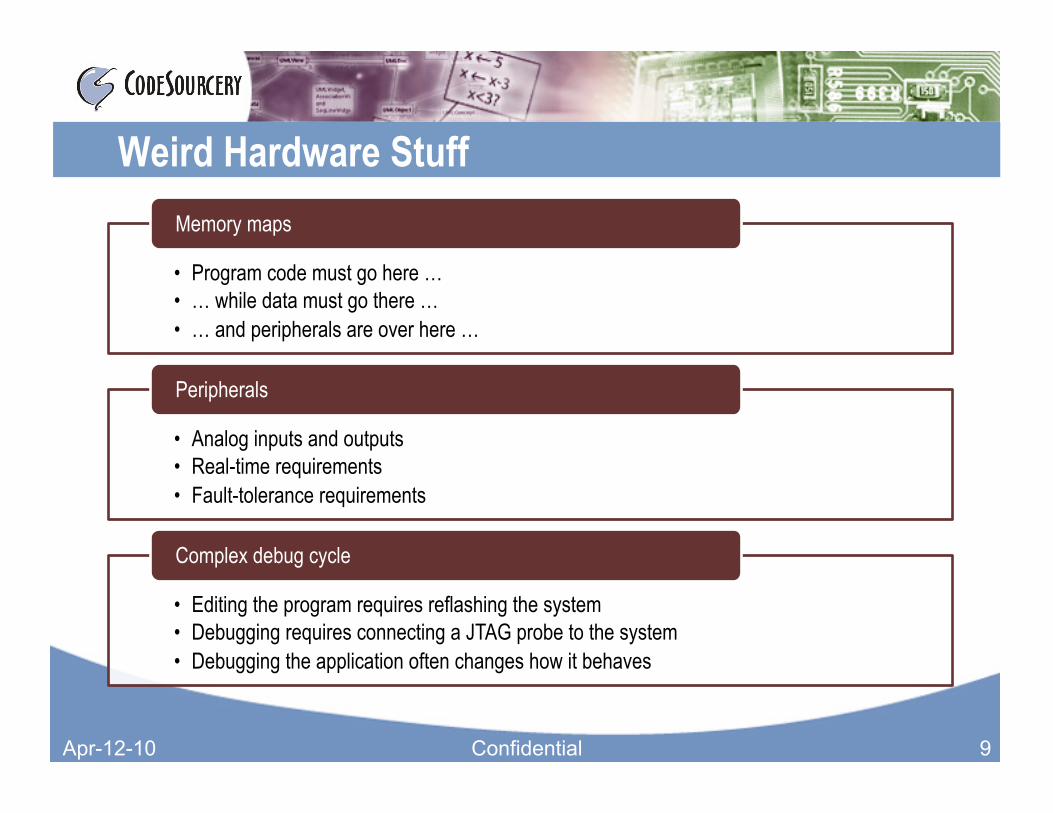
Weird Hardware Stuff
• Program code must go here … • … while data must go there … • … and peripherals are over here …
Memory maps
• Analog inputs and outputs • Real-time requirements • Fault-tolerance requirements
Peripherals
• Editing the program requires reflashing the system • Debugging requires connecting a JTAG probe to the system • Debugging the application often changes how it behaves
Complex debug cycle
Apr-12-10 Confidential 9

Open-Source Tools
Apr-12-10 Confidential 10

GNU Toolchain
Apr-12-10 Confidential 11
C/C++ GNU C/C++
Compiler (GCC)
Assembly GNU Assembler (GAS)
Object
Executable GNU Linker (GLD)
C/C++ GNU C/C++
Compiler (GCC)
Assembly GNU Assembler (GAS)
Object
Libraries
• Inline assembly • Intrinsics • Generic vectors
• Section placement • Initialization support
• Configurable features • Replaceable system calls

Host System
Target System
GNU Debug Architecture
Apr-12-10 © CodeSourcery, Inc. 12
Stub CPU
Debugger
RSP
JTAG
GDB Server
Application
OS
print x
get *0x12345678
wiggle, shift

Eclipse
Apr-12-10 Confidential 13
• Register display • Hardware breakpoints • Hardware watchpoints
• Disassembly view • Hardware single-step

Analysis Tools oprofile
• System-wide profiler – Kernel driver – Daemon for collecting data – Post-processing tools
• Leverages Intel hardware performance counters – Low overhead (1%-8%)
valgrind • Debugging tool
– Memory bugs – Threading bugs – Pluggable interface for building
new tools • Dynamically modifies running
programs – Inserts instrumentation code – Collects data as program runs
Apr-12-10 Confidential 14

Advantages of Open-Source Tools
• Tools work on non-Intel architectures too • Easier to leverage investment in skills or software
Portability across architectures
• Silicon companies • Software developers • University researchers
Improvements from many sources
• Possible to change the tools
Great for research!
Apr-12-10 Confidential 15

CodeSourcery & Intel
Apr-12-10 Confidential 16

Activities for Intel CPUs
Apr-12-10 Confidential 17
• Instruction selection • Instruction scheduling
Performance Optimization
• “Bare-metal” toolchains • JTAG debug for Atom
Embedded Functionality
• For GNU/Linux and bare-metal/RTOS platforms • Zero-cost command-line tools • Commercial packages available
Regular High-Quality Releases

Sourcery G++ Editions
Lite Edition
Personal Edition
Standard Edition
Professional Edition
Confidential 18
Personal Edition
• Full IDE (Eclipse) • GNU/Linux prelinker • Library optimizer • Application simulator • 30 days support • $399/user
Lite Edition
• Core command-line tools • No support • Zero-cost solution
Standard Edition
• Personal Edition plus… • Optimized run-time libraries • Debuggable libraries • Unlimited support • $1599/user
Professional Edition
• Standard Edition plus… • Priority defect resolution • Floating license option • Long-term support option • $2799/user

Future Directions I: Optimization
Apr-12-10 Confidential 19

Optimization Opportunities
• Loop optimizations • Instruction scheduling • SIMD auto-vectorization
Traditional optimizations
• Overcome limitations of separate compilation • Propagate link-time constants • Inline across modules • Align data on cache lines
Link-time optimization
• Learn from program execution • Optimize hot code for speed; cold code for space • Layout program images to maximize cache performance • Optimize for expected data values
Profile-directed feedback
• GNU tools are blissfully unaware of power impact • Choose low-power instructions • Provide expected power consumption information
Power optimization
Apr-12-10 Confidential 20
Future Directions II: Analysis
Apr-12-10 Confidential 21

Compilers Are Black Boxes
Apr-12-10 Confidential 22
C/C++ GNU C/C++ Compiler
(GCC) Assembly
What’s going on in here?

Compilers Should Be White Boxes
Apr-12-10 Confidential 23
C/C++ GNU C/C++ Compiler
(GCC) Assembly
Abstract Syntax Tree
Parsed Representation
Control Flow Graph
Loop Nests Program Invariants
Performance Estimates
Data Flow Graph
Footprint Estimates
Guidance
Reports & Analysis

Questions
Apr-12-10 Confidential 24

Confidential
Mark Mitchell [email protected]
Building Embedded Intel Applications With Open-Source Tools
Recommended