1
Brazilian Forests in a nutshell2013
BRAZILIAN FORESTSat a glance
Ministry of EnvironmentBrazilian Forest Service
2013

2
President of the Republic of BrazilDilma Vana Rousseff
Vice-President of the RepublicMichel Miguel Elias Temer Lulia
Minister of EnvironmentIzabella Mônica Vieira Teixeira
Executive Secretary of the Ministry of the EnvironmentFrancisco Gaetani
Deputy Director General of the Brazilian Forest ServiceMarcus Vinícius da Silva Alves
Board of Directors of the Brazilian Forest ServiceMarcus Vinicius da Silva AlvesJoberto Veloso de FreitasRaimundo Deusdará FilhoThiago Longo Menezes
Technical CoordinationJoberto Veloso de Freitas, Daniel Piotto, Claudia Maria Mello Rosa
Research, Analysis and Editorial StaffClaudia Maria Mello Rosa, Carolina Fernanda de Souza Mendes, Ana Laura Cerqueira Trindade and Rejane Maria Ludwig
SupportDeutsche Gesellschaft für Internationale Zusammenarbeit (GIZ) GmbH
CollaboratorsJoão Paulo Sotero, José Humberto Chaves, Marcelo Argüelles, Humberto Mesquista, Ana Cristyna Reis Lacerda, Monique Pinheiro Santos, Andreza Lima, Ricardo Vilar Neves, Liliana Osako, Marcela Barbosa, Rebla Vasconcelos and Renato Tormin
Cartographic ProductionIvan Dornelas e Thaís Mendes
Bibliographic StandardizationCarolina Fernanda de Souza Mendes
Design and TranslationSelene Fortini
PhotosSFB collection, Chirle Colpini, Daniel Piotto, Elza Fiuza, IFFSC Staff, Gabriel Rosa, Lucas Fortini, Miguel Von Behr, Monique Pinheiro Santos and Sidney Valeriano

Brazilian Forests in a nutshell2013
Ministry of EnvironmentBrazilian Forest Service
2013
BRAZILIAN FORESTSat a glance
Data from 2007 to 2012
2013

Brazilian Forest Service
Brazilian Forests at a glance - 2013: data from 2007 to 2012. / BrazilianForest Service. – Brasília: SFB, 2013.
188 p., il.; 9 x 12,5 cm.
ISBN 978-85-63269-10-2
1. Brazilian Forests. 2. Forest Management. 3. Forest Sector. 4. Forest Education and Research. 5. Biodiversity and Forests. I. Title.
CDU 630*9
160 pág.

Brazilian Forests in a nutshell2013
2013BRAZILIAN FORESTS
at a glance

6
The Brazilian Forest Service has striven to collect data and information as current as possible, from various national sources, produced by the main actors involved in the management, use, conservation and restoration of our forests, and to gather them in a concise format for future reference. This effort is consistent with the mandate/competence of the Forest Service to create and maintain a National Forest Information System.
A good management of forest resources depends on the availability of reliable, relevant and up-to-date information. For this reason, we are pleased to launch the third edition
orewordF

7
Brazilian Forests in a nutshell2013
of the booklet Brazilian Forests - at a glance, with data covering the period from 2007 to 2012.
This publication has been used by different stakeholders interested in the Brazilian forest sector, such as students, private sector representatives, public managers, researchers and teachers who work with forest issues.
We believe the information contained herein reveal the size and importance of the Brazilian forests, both natural and planted, and in this sense, we hope to positively contribute to the society in the challenge and opportunity for the protection and sustainable production of goods and services from forests.
Marcus Vinicius da Silva AlvesDeputy Director General of the Brazilian Forest Service

8

ain National StatisticsM
Total population 194 millionTotal land area 851 million haTotal forest area 463 million haPercentage of forest area compared to the total area 54.4 %Forest area per capita 2.38 haNatural forest area 456 million haPlantation forest area 7.2 million haRegistered public forests area 308 million haFederal community forest area 124 million haFederal and State public forests area under concession 622.2 thousand ha
Formal employments in forest sector 673 thousandCertified forests area 8.6 million haSawnwood production (2010) 4.9 million m3
Panel production (2010) 6.4 million m3
Pulp production 14.6 million tPaper production 10.1 million tExtraction of roundwood for fuel 133.1 million m3
Extraction of roundwood for industry 139.9 million m3
Main non-timber products extracted from natural forests - Mate 229.7 thousand t - Açaí berry fruit 215.4 thousand t - Babaçu almond 102.5 thousand t - Piaçava fiber 61.4 thousand tExports of forest sector 9 billion US$Imports of forest sector 2.4 billion US$Main importer countries of forest products from Brazil (2011) - United States 1.8 billion US$ - China 1.3 billion US$ - Holland 1.0 billion US$
Year of reference 2011/2012
Brazilian Forests at a glance2013

ummarySForeword 6Main National Statistics 9Brazilian Territory 13Brazilian Forests 21
What is a Forest? 22Extent of Forests 24Natural Forests 25Planted Forests 26Public and Private Forests 30Forests Designated Functions 32Forest Volume and Biomass 33National Forest Inventory 34SisPP - National System of Permanent Plots 36
Brazilian Biomes and their Forests 39Amazon 44Cerrado 46Atlantic Forest 48Caatinga 50Pampa 52Pantanal 54
Forest Protection 57Protected Areas 58Biodiversity 65Endangered and Protected Species 66
Sustainable Forest Management 69Sustainable Forest Management in Amazon 71Sustainable Forest Management in Caatinga 72Sustainable Forest Management in Public Forests (Forest Concessions) 73Community Forestry 74

Brazilian Forests in a nutshell2013
Deforestation and Forest Degradation 77Deforestation 78Forest Fires 86
Forest Management 89Forest Governance Institutions 90Social Participation in Forest Management 93Native Vegetation Protection Law 94Government Plans for Forest Protection 95Sustainable Forest District of Road BR-163 100National Forest Development Fund 103Amazon Fund 104Source Control of Forest Products 106National Forest Information System - Nfis 107
Socioeconomic Aspects of the Forest Sector 109Employment 111Forest Exploration and Production 112Exports of Forest Products 120Imports of Forest Products 124Internal Trade of Timber in the Legal Amazon 126Forest Certification 130Forests in the Energy Mix 132Forest Financing 133
Forest Education 135Undergradutates and Postgraduates 138Technical Education 140
Forest Research 143Main Research Centers 144Forest Research Financing 147Main Brazilian Journals on Forest Sciences 149
International Forest Data Comparison 151References 154
2013Brazilian Forests at a glance

12

13
Brazilian Forests in a nutshell2013
he Brazilian TerritoryT

14
Source: IBGE (2002)
Federative Units / Regions
Regions
NorthNortheastMidwestSoutheastSouth

15
Brazilian Forests in a nutshell2013
Source: IBGE (2002)
GEIF-FBR.9.1
Climate
2013
EquatorialTemperateTropical Central BrazilTropical Eastern NortheastTropical Equatorial Zone
Brazilian Forests at a glance

Source: EMBRAPA and IBGE (2001)
16
Soils
GEIF-FBR.6.1
AcrisolsCambisolsChernozemsSpodosolsGleysolsLatosolsLuvisolsEntisolsNitisolsHistosolsPlanosolsPlinthosolsVertisols

Brazilian Forests in a nutshell2013
Source: ANA (2003)
17
2013Hydrographic Regions
GEIF-FBR.5.1
Brazilian Forests at a glance
AmazonTocantins - AraguaiaParaguayParnaibaSão FranciscoWestern Northeast AtlanticEastern Northeast AtlanticEast AtlanticSoutheast AtlanticParanáUruguaySouth Atlantic
Hydrographic Regions

18
Vegetation Cover
Source: IBGE (2007)
Dense Humid ForestOpen Humid ForestMixed Humid ForestSemi Deciduous Seasonal ForestDecidual Seasonal ForestCampinaranaSavannah
Savannah SteppeSteppePioneer FormationEcotoneEcological RefugeWater

Brazilian Forests in a nutshell2013
19
2013Brazilian Forests at a glance

20

21
Brazilian Forests in a nutshell2013
razilian ForestsB

22
What is a Forest?
The Brazilian Forest Service, when developing its actions and elaborating national and international reports on forest resources in Brazil, considers as forests the following vegetation typologies according to the Classification System of the Brazilian Institute of Geography and Statistics (IBGE)*:
ü Dense Humid Forest; ü Open Humid Forest; ü Mixed Humid Forest; ü Semideciduous Seasonal Forest; ü Decidual Seasonal Forest; ü Campinarana (forested and wooded); ü Savannah (forested and wooded) - Cerradão and Cerrado;
ü Steppe Savannah (forested steppe and wooded steppe) - Wooded caatinga;
ü Steppe (tree steppe); ü Forest vegetation under marine influence, forest vegetation under fluviomarine influence (wooded);
ü Transitional zones with at least one forest formation; ü Secondary Vegetation in Forest areas; ü Reforestation.
* According to FAO’s definitions, these typologies include forests and other wooded lands.
Brazilian Forests in a nutshell20132013
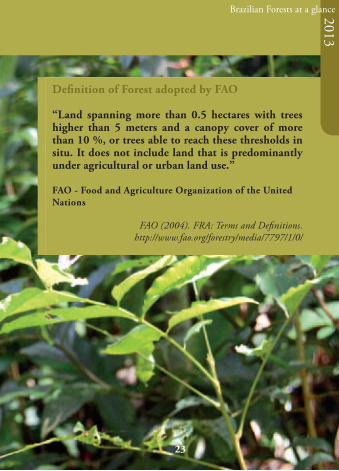
Definition of Forest adopted by FAO
“Land spanning more than 0.5 hectares with trees higher than 5 meters and a canopy cover of more than 10 %, or trees able to reach these thresholds in situ. It does not include land that is predominantly under agricultural or urban land use.”
FAO - Food and Agriculture Organization of the United Nations
FAO (2004). FRA: Terms and Definitions.http://www.fao.org/forestry/media/7797/1/0/
23
Brazilian Forests at a glance

24
Extent of Forests
Brazil is a forest country with 463 million hectares (54,4% of its territory) of natural and planted forests - representing the second largest forest area in the world.
Estimated forest areas in Brazil (2012)
Type of Forest Total area (ha) % Forests area
% Brazil area
Natural Forests 456,083,955 98.45 53.56
Planted Forests 7,185,943 1.55 0.84
Total 463,269,898 100 54.40
Source: Brasil. MMA (2007b), adapted/SFB.GEIF; ABRAF (2013).

Brazilian Forests in a nutshell2013
25
2013Brazilian Forests at a glance
Natural Forests
The estimate of forest areas was calculated by the Brazilian Forest Service based on maps of remnant vegetation in the Brazilian biomes, produced by the Ministry of Environment from Landsat images, for reference year of 2002 (MMA, 2007b), with an updating in 2009.
Available deforestation rates for each biome were applied to estimate Forest area in 2012.
Estimated area of natural forests in Brazilian biomes (2012)Biome Area (ha)
Amazon 325,469,969Caatinga 41,409,651Cerrado 57,321,446Pantanal 8,937,485
Atlantic Forest 20,128,299Pampa 2,817,106Total 456,083,955
Source: Brasil. MMA (2007b), adapted / SFB.GEIF.

26
Planted Forests
There are about 7.2 million hectares of planted forests in Brazil, mainly with species Eucalyptus and Pinus, which represent 92.8% of the total area. This area corresponds to 1.55% of the total forest area.
Composition of forest plantations in Brazil (2012)
Species Scientific name Area (ha) %
Eucalyptus Eucalyptus spp 5,102,030 71.00
Pine Pinus spp 1,562,782 21.75
Acacia Acacia mearnsii / Acacia mangium 148,311 2.12
Rubber tree Hevea brasiliensis 168,848 2.36
Paricá Schizolobium amazonicum 87,901 1.22
Teak Tectona grandis 67,329 0.97Araucaria Araucaria angustifolia 11,343 0.16
Poplar Populus spp 4,216 0.06Others 33,183 0.12Total 7,185,943 100
Source: ABRAF (2013).

Brazilian Forests in a nutshell2013
27
2013
Distribution of forest plantations with Pine and Eucalyptus in Brazil (2012)
StateArea with
Eucalyptus (ha)
Area with Pine (ha)
Total Area (ha) %
MG 1,438,971 52,710 1,491,681 22.38
SP 1,041,695 144,802 1,186,497 17.80PR 197,835 619,731 817,566 12.27BA 605,464 11,230 616,694 9.25SC 106,588 539,377 645,965 9.69RS 284,701 164,832 449,533 6.74MS 587,310 9,825 597,135 8.96ES 203,349 2,546 205,895 3.09PA 159,657 0 159,657 2.40MA 173,324 0 173,324 2.60GO 38,081 16,432 54,513 0.82AP 49,506 445 49,951 0.75MT 59,980 0 59,980 0.90TO 109,000 853 109,853 1.65PI 27,730 0 27,730 0.42RJ 18,368 0 18,368 0.28
Others 470 0 470 0.01Total 5,102,029 1,562,783 6,664,812 100.00
Source: ABRAF (2013).
Brazilian Forests in a nutshell

28
Forest Plantations of Pine and Eucalyptus
Source: ABRAF (2012)
Eucalyptus (1,000 ha)
Pine (1,000 ha)
Total Area
Total Area
0.10.1 - 44 - 2020 - 100100 - 250250 - 700
1,562,783 ha
5,102,029 ha

Brazilian Forests in a nutshell2013Florestas do Brasil em resumo2013
29
Evolution of the Mean Annual Increment (MAI) of planted forests by companies associated to the Brazilian Association of Forest Plantation Producers (Abraf) (2005-2012)
Source: ABRAF (2012).
2013
Brazilian planted forests have shown increasing productivity. Besides environmental factors favouring silviculture, new technologies are being used to enhance productivity, such as genetic manipulation of seeds and the cloning of forest species. Such improvement makes Brazil stand out in both coniferous and broadleaved forest productivity.
Brazilian Forests at a glance

30
The areas of public forests in Brazil are under a permanent process of identification and registration by the Brazilian Forest Service. Public forests included in the National Public Forests Registry (CNPF) by November 2012, comprised an area of about 308 million hectares, representing 36.2% of the national territory. The Brazilian public forests are distributed into different biomes and regions of the country. However, the majority (91%) is in the Amazon biome.
Public and Private Forests
Distribution per biome public forests included in the CNFP - Cadastro Nacional de Florestas Públicas (National Public Forest Registry) until November 2012
Biome Area 2012 (ha) (%) Public Forests 2012
Amazon 282,221,415 91.60Cerrado 18,069,018 5.86
Atlantic Forest 3,523,333 1.14Caatinga 1,281,423 0.42Pantanal 861,073 0.28Pampa 230,510 0.07
Outside IBGE boundary 1,898,595 0.62
Total 308,085,367 100

Brazilian Forests in a nutshell2013Florestas do Brasil em resumo2012
31
2013Brazilian Forests at a glance
Private forest areas in Brazil are estimated. (IBGE, 2007a).
Private forests area in rural areas in Brazil (1,000 ha)
1970 1975 1980 1985 1995 2006
Forests 57,881 70,722 88,168 88,984 94,294 98,480
Source: IBGE (2007a).

32
Forest Designated Functions
Forests have primary functions according to the uses to which they are designated for. Brazilian forests designations may be distributed according to the categories and definitions established by FAO, such as production, protection and conservation, social services and others.
Area of Brazilian forests distributed per category of primary designated function (2011/2012)Primary designated functions of forests Area (1,000 ha)Production1 37,129.44Protection of soil and water2 102,500.00Conservation of biodiversity3 53,457.50Social services4 135,106.18Multiple use5 42,987.00Unknown6 92,089.77
Total 463,269.89
Source: Brasil. MMA (2012); ABRAF (2013); Sparovek, et al. ( 2010); Funai (2012).
Notes:1 Production: National Forests, State Forests and Forest Plantations.2 Protection of soil and water: Estimate of Permanent Preservation Areas provided by the Law, according to Sparovek et al. (2010).3 Conservation of biodiversity: Ecological Station (Federal and State); Biological Reserve (Federal and State); National Park; State Park; Natural Monument (Federal and State); Wildlife Refuge (Federal and State); Area of Relevant Ecological Interest (Federal and State) and Natural Heritage Private Reserve.4 Social Services: Extractivist Reserve (Federal and State); Indigenous Lands; Sustainable Development Reserve (Federal and State).5 Multiuse: Area of Environmental Protection (Federal and State).6 Unknown: Forest areas with unknown designated primary function.

Brazilian Forests in a nutshell2013
33
2013Brazilian Forests at a glance
Forest Volume and Biomass
The volume of timber is an important variable to estimate forest biomass and commercial stock, and is also a variable used in forest management.
The biomass of the Brazilian forests was estimated through studies that determine the volume of timber per area unit in the various forest typologies and its relationship with biomass, considering the area occupied by each of these typologies in each Brazilian biome.
Total timber volume and biomass quantity estimated per biome (2012)
BiomassTotal timber volume Total biomass*
Million m³ % Million t %
Amazon 84,749 87.16 88,526 84.18Caatinga 2,859 2.94 4,095 3.89Cerrado 4,311 4.43 6,158 5.86Pantanal 717 0.74 1,083 1.03
Atlantic forest 4,345 4.47 5,009 4.76
Pampa 255 0.26 290 0.28Total 97,236 100 105,161 100
Source: Brasil. MMA (2007b), adapted/SFB.GEIF.*Total biomass= Aboveground biomass + belowground biomass

34
National Forest Inventory
The National Forest Inventory (NFI) is coordinated by the Brazilian Forest Service (SFB) and aims at producing detailed information on forest resources in Brazil. Such information will base the formulation of public policies related to the use, conservation and restoration of forest resources.

Brazilian Forests in a nutshell2013Florestas do Brasil em resumo2013
35
2013
The NFI’s methodology was developed through a participatory process and has a national standardization, with possible adaptations to the peculiarities of Brazilian biomes. The methodology consists on gathering biophysical, socio-environmental and landscape data in a systematic grid of 20 km x 20 km, covering the entire national territory. Measurements in sample points are carried out every five years, making the NFI a tool for monitoring the quantity and quality of the country’s forests.
In 2012, the NFI activities were initiated in the states of Ceará, Sergipe, Paraná, Rio Grande do Sul and Rio de Janeiro and concluded in Santa Catarina and in the Federal District. During the years 2013 and 2014, activities in the states of the Amazon and the Cerrado will be initiated.
Brazilian Forests at a glance

36
SisPP - National System of Permanent Plots
The National System of Permanent Plots (SisPP) is a network of institutions working with forest dynamics monitoring. Its main purpose is to produce information on growth and yield based on experimental plots in different Brazilian biomes, to support the definition of standards for sustainable forest management practices. This system congregates subnational networks for all Brazilian biomes.

Brazilian Forests in a nutshell2013Florestas do Brasil em resumo2012
37
2013Brazilian Forests at a glance

38

39
Brazilian Forests in a nutshell2013razilian biomes and their Forests
B

40

41
Brazilian Forests in a nutshell2013
Brazil hosts six continental biomes: Amazon, Cerrado, Atlantic Forest, Caatinga, Pampa and Pantanal.
Brazilian natural forests are distributed in these six biomes, of which the Amazon, Cerrado and Caatinga represent more than 93% from the total. Approximately 71.36% of natural forests are in the Amazon biome.
Percentage of natural forest cover per biome (2012)Source: Brasil. MMA (2007b), adapted / SFB. GEIF.
Biome is a set of life forms (plant and animal) characterized by communities of contiguous and identifiable types of vegetation at regional scale, sharing similar geoclimatic conditions and history of changes, resulting in its own biological diversity (IBGE, 2004a).
2013Brazilian Forests at a glance
Amazon
Cerrado
Atlantic Forest
Caatinga
Pampa
Pantanal
1.96%0.62%9.08 %
4.41 %
12.57 %
71.36 %

42

43
Brazilian Forests in a nutshell2013Brazilian Biomes
Source: IBGE and MMA (2004)
GEIF-FBR.2.1
2013
AmazonCaatingaCerradoAtlantic ForestPampaPantanal
Brazilian Forests at a glance

44
Amazon
The Amazon biome represents about 8% of all the world’s remaining forests. Its importance is recognized nationally and internationally. This is mainly due to its large extent (4.2 million km2) and huge range of environments, with more than 600 different types of terrestrial and freshwater habitats, resulting in a very rich biodiversity, with about 45,000 plant and vertebrate species.
Amazon biome (2012)Total Biome %
Biome area (ha) 419,694,300 49.3*Forest cover estimate (ha) 325,469,969 77.5Protected areas within Conservation Units (Federal and State) (ha) 110,964,400 26.4
Source: IBGE (2004b); Brasil. MMA (2007b), adapted / SFB.GEIF; MMA (2012).Note: *In relation to the country area.

45
Brazilian Forests in a nutshell2013 Forests of the Amazon Biome
Source: MMA (2007)
GEIF-FBR.12.1
2013
Dense Humid ForestOpen Humid ForestSemi deciduous Seasonal ForestForested and Wooded CampinaranaForested and Wooded Savannah (Cerradão and Campo-Cerrado)Forested and Wooded Steppe Savannah (tree-steppe Caatinga)Vegetation Under Marine and Fluviomarine Influence (Mangrove / Restinga)Ecotone (Transitional Zone)Secondary VegetationPlanted Forests
Forest Typology
Brazilian Forests at a glance

46
Cerrado
Cerrado is the second largest biome in South America and covers an area of 2,036,448 km² or about 24% of the Brazilian territory. This territorial space holds the springs of three major basins in South America (Amazon/Tocantins, São Francisco and Prata). Regarding biological diversity, the Brazilian Cerrado is recognized as the richest savannah in the world, holding 11,627 catalogued native plant species (BRASIL. MMA, 2007a).
Cerrado biome (2012) Total Bioma %
Biome area (ha) 203,644,800 23.9*Forest cover estimate (ha) 57,321,446 28.1Protected areas within Conservation Units (Federal and State) (ha) 16,532,900 8.1
Source: IBGE (2004b); Brasil. MMA (2007b), adapted / SFB.GEIF; MMA (2012).Note: *In relation to the country area.

47
Brazilian Forests in a nutshell2013Cerrado Biome Forests
2013
Forested Savannah (Cerradão)Wooded Savannah (Campo-Cerrado) Semi deciduous Seasonal ForestDense and Open Humid ForestVegetation Under Marine and Fluviomarine Influence (Mangrove and Restinga) Steppe Savannah (wooded Caatinga)Secondary VegetationPlanted Forests
Forest Typology
Brazilian Forests at a glance
Source: MMA (2007)

48
Atlantic Forest
The Atlantic Forest biome encompasse an area of 1.1 million km² (13% of the Brazilian territory). However, in the light of centuries of occupation, the forest area in this biome was drastically reduced and is nowadays extremely fragmented. Nevertheless, the Atlantic Forest still hosts a significant portion of Brazil’s biological diversity.
Atlantic Forest Biome (2012)Total Bioma %
Biome area (ha) 111,018,200 13.0*Forest cover estimate (ha) 20,128,299 18.1Protected areas within Conservation Units (Federal and State) (ha) 10,738,600 9.6
Source: IBGE (2004b); Brasil. MMA (2007b), adapted / SFB.GEIF; MMA (2012).Note: *In relation to the country area.

Brazilian Forests in a nutshell2013Florestas do Brasil em resumo2013
49
Forests of the Atlantic Forest Biome
Source: MMA (2007)
2013
Forest TypologyDense Humid Forest (Tropical rain forest)Open Humid ForestMixed Humid Forest (Araucaria forest)Vegetation Under Marine and Fluviomarine Influence (Mangrove and Restinga)Deciduous Seasonal ForestSemi deciduous Seasonal ForestWooded SteppeForested and Wooded Steppe Savannah (tree-steppe Caatinga)Forested Savannah (Cerradão)Ecotone (Transitional Zone)Secondary VegetationPlanted Forests
Brazilian Forests at a glance

50
Caatinga
The Caatinga biome covers an area of approximately 844,453 km², equivalent to 10% of the national territory and is the only exclusively Brazilian biome. Its vegetation is a mosaic of thorny shrubs and seasonally dry forests and, despite occupying a semiarid region, its biodiversity is extremely heterogeneous, sustaining various economic activities aimed at agrosilvopastoris and industrial purposes.
Caatinga biome (2012)Total Biome %
Biome area (ha) 84,445,300 9.9*Forest cover estimate (ha) 41,409,651 49Protected areas within Conservation Units (Federal and State) (ha) 6,312,300 7.5
Source: IBGE (2004b); Brasil. MMA (2007b), adapted / SFB.GEIF; MMA (2012).Note: *In relation to the country area.

51
Brazilian Forests in a nutshell2013
Source: MMA (2007)
Forests of the Caatinga Biome
2013
Forested Steppe Savannah (dense Caatinga)Wooded Savannah (open Caatinga) Dense and Open Humid ForestDeciduous and Semi deciduous Seasonal ForestVegetation Under Marine and Fluviomarine Influence (Mangrove and Restinga) Forested and wooded savannah (Cerradão and Campo-Cerrado)Ecotone (Transitional Zone)Secondary Vegetation
Forest Typology
Brazilian Forests at a glance

Pampa
The Pampa, also commonly known as the Southern grasslands, occurs in the state of Rio Grande do Sul and extends across Uruguay and Argentina. The dominant vegetation consists of pampa grass interspersed with semi deciduous forests, subtropical forests (mainly Araucaria forests) and seasonal forests.
Pampa biome (2012)Total Biome %
Biome area (ha) 17,649,600 2.1*Forest cover estimate (ha) 2,817,106 15.9Protected areas within Conservation Units (Federal and State) (ha) 475,409 2.7
Source: IBGE (2004b); Brasil. MMA (2007b), adapted / SFB.GEIF; MMA (2012).Note: *In relation to the country area.

53
Brazilian Forests in a nutshell2013 Forests of the Pampa Biome
GEIF-FBR.13.1
2013
Tree Steppe Steppe Savannah (Campanha Gaúcha)Dense Humid Forest (Tropical Rain Forest)Deciduous and Semi deciduous Seasonal ForestVegetation Under Marine and Fluviomarine Influence (Mangrove and Restinga) Planted Forests
Forest Typology
Source: MMA (2007)
Brazilian Forests at a glance

54
Pantanal
The Pantanal biome is considered one of the largest continuous wetland of the planet. It has an approximate area of 150,355 km², representing 1.8% of the total area of Brazil. Pantanal is under direct influence of three major biomes: Amazon, Cerrado and Atlantic Forest. In addition, it is also influenced by the Chaco biome (name given to the Pantanal located in northern Paraguay and eastern Bolivia).
Pantanal biome (2012)Total Biome %
Biome area (ha) 15,035,500 1.8*Forest cover estimate (ha) 8,937,485 59.4Protected areas within Conservation Units (Federal and State) (ha) 440,100 2.9
Source: IBGE (2004b); Brasil. MMA (2007b), adapted / SFB.GEIF; MMA (2012).Note: *In relation to the country area.

55
Brazilian Forests in a nutshell2013
Source: MMA (2007)
GEIF-FBR.17.1
Forests of the Pantanal Biome
2013
Ecotone (Transitional Zone)EnclaveDeciduous Seasonal ForestSemi deciduous Seasonal ForestFluvial or Lacustre Influenced Vegetation Forested and Wooded Savannah (Cerradão and Campo-cerrado)Forested and Wooded Steppe SavannahSecondary Vegetation
Forest Typology
Brazilian Forests at a glance

56

57
Brazilian Forests in a nutshell2013
orest ProtectionF

58
Protected Areas
Protected areas are defined as legally protected territories, destined for preservation or conservation of nature and its associated cultural values. In Brazil, protected areas can be public or private. The main public protected areas are the Indigenous Lands, the Conservation Units and the private protected areas, established by Law No. 12,651 of May 25th, 2012, which provides for the protection of native vegetation, named Legal Reserves and Permanent Preservation Areas.
Conservation Units are divided in two groups, Full Protection and Sustainable Use. In Full Protected Areas, in order to preserve the Nature, it is not allowed any direct use of the natural resources. While in Sustainable Use ones activities aimed at forest production are allowed.There is also a private category included in the Snuc that can be created and maintained by private owners, the Private Natural Heritage Reserve - RPPN.

Brazilian Forests in a nutshell2013Florestas do Brasil em resumo2012
59
Conservation Units
2013Brazilian Forests at a glance
Situation of Federal Conservation Units (June of 2012)Group Category No. Area (ha)
Full Protection
Ecological Station 31 6,923,700Natural Monument 3 44,300
National Park 68 25,265,300Biological Reserve 30 3,904,500Wildlife Refuge 7 201,900
Subtotal 139 36,339,700
Sustainable Use
Area of Environmental Protection 32 10,014,400
Area of Relevant Ecological Interest 16 44,800
National Forest 65 16,343,800Sustainable Development
Reserve 1 64,400
Extractivist Reserve 59 12,287,500Private Natural Heritage
Reserve 574 392,277
Subtotal 747 39,147,177Grand total 886 75,486,877
Source: Brasil. MMA (2012).

Situation of State Conservation Units (June of 2012)Group Category No. Area (ha)
Full Protection
Ecological Station 59 4,767,800Natural Monument 16 79,600
State Park 177 9,398,300Biological Reserve 21 1,346,600Wildlife Refuge 21 167,800
Subtotal 294 15,760,100
Sustainable Use
Area of Environmental Protection 181 32,972,600
Area of Relevant Ecological Interest 24 44,500
State Forest 35 13,599,800Sustainable
Development Reserve 26 10,920,000
Extractivist Reserve 28 2,021,100Private Natural
Heritage Reserve 70 142
Subtotal 294 59,558,000Grand total 658 75,318,100
Source: Brasil. MMA (2012).
60

Brazilian Forests in a nutshell2013Florestas do Brasil em resumo2012
61
2013Brazilian Forests at a glance
Amazon Region Protected Areas Program (Arpa)
The Amazon Region Protected Areas Program (Arpa), coordinated by the Ministry of Environment, was created in 2003 with the main objective of assuring and supporting financial resources for the creation, consolidation and maintenance of 60 million hectares of Brazilian Amazon Conservation Units. During its first phase, concluded in 2009, the program supported the creation and consolidation of 62 Conservation Units, totaling more than 32 million hectares of Protected Areas. From this total, 31 are Full Protection Units (21.1 million ha) and 31 are Conservation Units of Sustainable Use (10.9 million ha) (WWF, 2010b). The second phase of the program (Arpa II), planned for the period 2010-2015, has as main objectives the consolidation of all Conservation Units created in the first phase, the creation of new preservation areas and the operation of the Protected Areas Fund - FAP with US$ 70 million (BRASIL. MMA, 2011b).

Situation of Brazilian Indigenous Areas (2012)Situation Quantity Area (ha) Indigenous
Lands %Regularized ¹ 422 104,117,642 94.81Delimited ² 28 2,775,364 2.53Declared ³ 47 1,849,890 1.68
Homologated 4 18 1,025,672 0.93Under process as
Indigenous Reserves 536 44,612 0.04
Total 551 109,813,180 100
12.9% of the country areaSource: FUNAI (2012).Note: Besides the areas shown in the table, there are 138 under study.
Note:1 Indigenous land registered at the Registry of Property Registration and Secretariat Equity Union;2 Indigenous land with anthropological report and boundaries approved by FUNAI;3 Indigenous land with anthropological report and limits approved by the Ministry of Justice;4 Indigenous land with demarcation approved by the President of Republic;5 Indigenous land acquired, under procurement process or recorded as dominial.
Indigenous Lands
62

Brazilian Forests in a nutshell2013Florestas do Brasil em resumo2012
63
2013Brazilian Forests at a glance
Permanent Preservation Areas
Permanent Preservation Areas (PPA) are lands protected by Law No. 12,651 of May 25th, 2012, which can be covered or not by native vegetation, having the environmental role of preserving water resources, landscape, geological stability, biodiversity, genetic flow of fauna and flora, protecting the soil and ensuring the well-being of human populations. The Permanent Preservation Areas are usually those located:
I. Along rivers or any water stream;II. Around natural lakes and lagoons;III. Around artificial water reservoirs; IV. Around springs and perennial water sources; V. On slopes or part of them greater than 45o; VI. On coastal pioneer vegetation such as dune or
mangrove stabilizers;VII. On mangroves, in all their extension; VIII. On mesa or plateau edges; IX. On hilltops, hills, mountains, and mountain ranges,
with minimum height of 100 m and slope greater than 25°;
X. On areas situated at altitudes over 1,800m;XI. On veredas, the marginal strip with a minimum
width of 50 m.
For further details see: http://www.florestal.gov.br/pngf/

64
Legal Reserve
A Legal Reserve is defined as “an area within any rural property or holding, designated as status of permanent conservation, necessary for the sustainable use of natural resources, by conservation and rehabilitation of ecological processes, by biological conservation and shelter and protection of the native fauna and flora.” (Law 12,651, of May 25th, 2012).
This Law determines the maintenance of the minimum area below as Legal Reserve in all private properties:
• 80%, in rural property located in forest areas within the Legal Amazon;
• 20%, in rural property located in grassland areas within the Legal Amazon;
• 35%, in rural property located in Cerrado areas within the Legal Amazon;
• 20%, in rural property located in other regions of the country.
üFor further details see: http://www.florestal.gov.br/pngf/

Brazilian Forests in a nutshell2013Florestas do Brasil em resumo2013
65
2013Brazilian Forests at a glance
Biodiversity
Brazil hosts one of the most diverse and exuberant floras of the planet. Studies point to the existence of at least 103,870 animal species and 43,020 plant species in Brazil. On average, 700 new animal species are described each year in Brazil (BRASIL MMA, 2011).
The Amazon forest occupies a prominent place in this scenario and its importance is recognized worldwide. About 10% of all the diversity of the planet is in the Amazon region (MPEG, 2001). In the last ten years, 637 plants have been discovered in this region. (WWF, 2010a).

66
Endangered and Protected Species
Unfortunately, 472 species are enlisted in the “Endangered Species of the Wild Brazilian Flora List” (BRASIL, MMA, 2008). Biomes with the highest number of threatened species are: Atlantic Forest (276), Cerrado (131) and Caatinga (46). The Amazon biome appears with 24 species, Pampa with 17 and Pantanal with just two.
Brazil has some tree species protected by federal law. These tree species cannot be cut. They are:
• Brazilian nut tree (Bertholetia excelsa) Decree 5,975/2006; • Rubber tree (Hevea spp.) Decree 5,975/2006; and • Mahogany (Swietenia macrophylla king) Decree
4,722/2003).
There are other tree species protected by State laws.

Brazilian Forests in a nutshell2013Florestas do Brasil em resumo2012
67
2013Brazilian Forests at a glance
Endangered Tree Species (2008)Common name Scientific name Family BiomeAroeira, Aroeira
do SertãoMyracrodruon
urundeuva Anacardiaceae Cerrado/Caatinga
Baraúna Schinopsis brasiliensis Anacardiaceae Cerrado/
Caatinga
Brazilian Pine Araucaria angustifolia Araucariaceae Atlantic Forest
Cerejeira Amburana cearensis var. acreana Fabaceae Amazon
Pau-brasil Caesalpinia echinata Fabaceae Atlantic ForestJacarandá-da-
bahia Dalbergia nigra Fabaceae Atlantic Forest
Braúna Melanoxylon brauna Fabaceae Atlantic Forest
Pau-roxo Peltogyne maranhensis Fabaceae Amazon
Canela-preta Ocotea catharinensis Lauraceae Atlantic Forest
Canela-sassafrás Ocotea odorifera Lauraceae Atlantic Forest
Imbuia Ocotea porosa Lauraceae Atlantic ForestBrazilian nut
tree Bertholletia excelsa Lecythidaceae Amazon
Mahogany Swietenia macrophylla Meliaceae Amazon
Pau-amarelo Euxylophora paraensis Rutaceae Amazon
Source: Brasil. MMA (2008), adapted.

68

69
Brazilian Forests in a nutshell2013
ustainable Forest ManagementS

70
Sustainable Forest Management is the management of forests aiming of achieving economical, social and environmental benefits, respecting the mechanisms that sustain the ecosystem and considering the use of both timber and non-timber forest products, as well as other forest assets and services.
Exploring forests and secondary formations under a sustainable forest management regime, either within public or private domain, will depend on previous approval of a Sustainable Forest Management Plan by the competent forestry authority (Article 31, Law 12,651/2012).
The Sustainable Forest Management Plan is the basic technical document that contains guidelines and procedures for forest management aimed at obtaining economic, social and environmental benefits, observing the definition of sustainable forest management.

Brazilian Forests in a nutshell2013Florestas do Brasil em resumo2013
71
In the last 30 years, Brazil has developed a forest management system for timber production in the Amazon forests that combines use and conservation of forest resources. Meanwhile, the country has developed an adequate regulatory framework, enhanced over the years by a set of standards that include the elaboration of Sustainable Forest Management Plans, Annual Operating Plans and monitoring of forest management through technical inspections.
The forest management system used in the Amazon is polycyclic, based on a 35-year cutting cycle with a maximum cutting intensity of 30 m3 ha-1, and a tree selection based on technical and environmental criteria to promote the regeneration of the managed forest species. In practice, only 4-6 trees per hectare are felled, through techniques of reduced-impact logging (RIL), in order to protect the soil and the remaining forest.
Sustainable Forest Management in Amazon
2013Brazilian Forests at a glance

72
Forest management in Caatinga is extremely important, especially to meet the high demand for forest products for firewood and charcoal. This management is based on a monocyclic system, with a rotation period estimated between 12-15 years. The system is based on the application of simple coppice in annual stands, which consists on cutting trees near the base to allow sprouting regeneration by regrowth.
Área acumulada dos Planos de Manejo Florestal Sustentável (PMFS) aprovados na região Nordeste
0
50000
100000
150000
200000
250000
300000
350000
400000
1988
1992
1994
1995
1996
1997
1998
1999
2000
2001
2002
2003
2004
2005
2006
2007
2008
2009
2010
2011
Área (h
a)
Ano
Sustainable Forest Management in Caatinga
Are
a (h
a)
Year
Area of Sustainable Forest Management Plans approved in the Northeast region (Caatinga biome).

Brazilian Forests in a nutshell2013Florestas do Brasil em resumo2012
73
2013Brazilian Forests at a glance
Sustainable Forest Management in Public Forests (Forest Concessions)
Forest concession is one of the modalities of public forest management stipulated by Law 11,284 of March 2nd, 2006. It allows the Federal Government, states and municipalities to grant, through bidding, the legal right for private companies to manage the forests in public domain in a sustainable way and through fee payment.
The first three forest concessions initiated in 2008, in Forest Management Units (FMU) located in the Jamari National Forest, State of Rondônia, totaling 96,361 hectares. In 2011 two more contracts were signed for FMU in Saracá-Taquera National Forest, State of Pará, totaling 48,703 hectares. Currently, there are five forest concession contracts of federal scope, totaling 145,000 hectares of public forests under sustainable production. Additionally, five more contracts with approximately 200,000 hectares are under bidding process.
The Amazon region States also hold large areas of public forests and are setting up state programs for public forests concession. The State of Pará already has six contracts totaling approximately 477,000 hectares of forests under forest concession. In 2013, three concession contracts were to be signed in the State Forests of Pará, comprising an area of 108,000 hectares.
In total, the country has 622,200 hectares of public forests under forest concession regime.
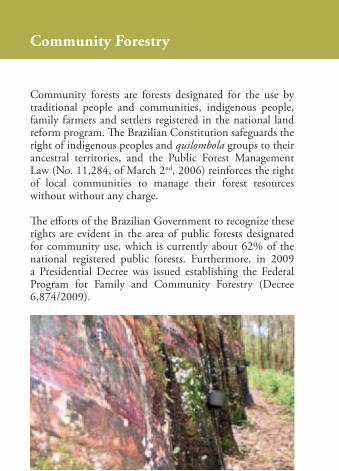
Community forests are forests designated for the use by traditional people and communities, indigenous people, family farmers and settlers registered in the national land reform program. The Brazilian Constitution safeguards the right of indigenous peoples and quilombola groups to their ancestral territories, and the Public Forest Management Law (No. 11,284, of March 2nd, 2006) reinforces the right of local communities to manage their forest resources without without any charge.
The efforts of the Brazilian Government to recognize these rights are evident in the area of public forests designated for community use, which is currently about 62% of the national registered public forests. Furthermore, in 2009 a Presidential Decree was issued establishing the Federal Program for Family and Community Forestry (Decree 6,874/2009).
Community Forestry

Brazilian Forests in a nutshell2013Florestas do Brasil em resumo2012
75
2013Brazilian Forests at a glance
Federal communitaire forests (2012)Reserves Area (ha)
Extractivist Reserves (RESEX) 11,735,793
Sustainable Development Reserve (RDS) 64,550Indigenous Lands 102,817,112
Agrarian Reform Settlement (PAF), Agro-Extractive Settlement Project (PAE) and Sustainable Development Program (PDS)
9,954,142
Total 124,571,597
Source: SFB (2012).*Data from the National Register of Public Forests

76

77
Brazilian Forests in a nutshell2013eforestation and Forest Degradation
D

78
Deforestation
Deforestation is the direct human-induced conversion of forested land to non-forested land. (UNFCCC, 2001). The areas chosen for alternative land use are those destined for population settlements, agriculture, industries, power generation, mining, plantation and transport (IBAMA, 2002).
Amazon
The INPE - National Institute for Space Research monitors the Amazon forest cover by satellites, through different systems, detecting deforestation in areas down to 6.25 ha since 1980´s. Major operating systems are: Prodes, Deter and Degrad. These systems are complementary to each other and are designed to meet different purposes.
Prodes
The Amazon Forest Satellite Monitoring Project (Prodes) uses Landsat images to measure annual deforestation rates for periods ranging from August of the preceding year to July of the current year, since 1988.
Between August 2011 and July 2012, the deforestation rate dropped 29% in relation to the previous period, recording the lowest annual deforested area in the Amazon in the last 24 years, equivalent to 4,571 km².

79
Brazilian Forests in a nutshell2013
Annual deforestation rates 1988 - 2012 in the Legal Amazon (Prodes)Source: INPE (2012a).
Deforestation rates reduction is even greater when comparing the current data with the year of 2004, when the Action Plan for Protection and Control of Deforestation in the Amazon (PPCDAm) began. Since then, the decrease was 84%.
2013Brazilian Forests at a glance
Ano1988198919901991199219931994199519961997199819992000200120022003
Fonte: INPE (2012a). 200420052006200720082009201020112012
Taxa anual de desmatamento da Amazônia Legal (Prodes)
0
5.000
10.000
15.000
20.000
25.000
30.000
35.000
1988
19
89
1990
19
91
1992
19
93
1994
19
95
1996
19
97
1998
19
99
2000
20
01
2002
20
03
2004
20
05
2006
20
07
2008
20
09
2010
20
11
2012
Ano
km²/ano
Year
Km
2 /ye
ar
35,000
30,000
25,000
20,000
15,000
10,000
5,000
0

80
Monthly average deforestation area in the Brazilian Amazon (Deter) (May 2004 - September 2012)Source: INPE (2012b).
Fonte: INPE (2012b).
Área média mensal de desmatamento da Amazônia brasileira (Deter) (maio 2004 – setembro 2012)
0
500
1.000
1.500
2.000
2.500
Jane
iro
Fevereiro
Março
Abril
Maio
Junh
o
Julho
Agosto
:Setembro
Outub
ro
:Novem
bro
:Dezembro
km 2
Mês
Deter
The Real Time Detection Deforestation System (DETER), developed by INPE in 2004, uses data from the Modis Sensor of Terra/Aqua satellite and the WFI Sensor of CBERS satellite, to monthly publish an alert map of areas with more than 25 hectares, indicating completely deforested areas (clear-cutting) as well as areas undergoing deforestation by gradual forest degradation.
Janu
ary
Febr
uary
Mar
ch
Apri
l
May
June
July
Augu
st
Sept
embe
r
Oct
ober
Nov
embe
r
Dec
embe
r
Month
2,500
2,000
1,500
1,000
500
0
Km
2

81
Brazilian Forests in a nutshell2013
Degrad
The Degrad System, developed by INPE in 2007, uses Landsat and CBERS satellite imagery to annually map areas undergoing deforestation process, where forest cover has not been completely removed and therefore not detected by the Prodes system. Out of 24,417 km² mapped as degraded forest areas in 2008, 328 km² were converted to clear-cutting in 2009, and thus calculated by Prodes. In 2009, 13,301 km² were mapped as degraded forest areas, and in 2010, this area was 7,508 km².
Forest degradation in the Brazilian Amazon (2007 - 2010) (km2)State 2007 2008 2009 2010Acre 122.8 121.34 31 76Amazonas 257.6 412.42 181 459Amapá 50.42 63.18 61 20Maranhão 1,976.75 4,230.70 2,423 383Mato Grosso 8,951.14 12,987.74 8,486 2,502Pará 3,899.23 8,264.82 1,559 3,499Rondônia 412.32 643.32 232 315Roraima 137.28 171.39 99 61Tocantins 179.71 522.18 229 194Total 15,987.25 27,417.10 13,301 7,508
Source: INPE (2011).
2013Brazilian Forests at a glance

Atlantic Forest
The NGO SOS Mata Atlântica, in partnership with INPE, has carried out the monitoring of deforestation rates in the Atlantic Forest biome through CBERS and Landsat satellite imagery. Such effort showed a drop in the annual deforestation rate averaging of 34,313 ha in 2005-2008 to 12,875 ha in 2010-2011.
Deforested area in the Atlantic Forest Biome (2005 - 2011) (ha)State 2005 - 2008 2008 - 2010 2010-2011Bahia 24,148 * 4,493Espírito Santo 573 160 364Goiás 733 161 33Minas Gerais 32,728 12,524 6,339Mato Grosso Sul 2,215 154 588Paraná 9,978 2,699 71Rio de Janeiro 1,039 315 92Rio Grande do Sul 3,117 1,897 111Santa Catarina 25,953 2,149 568São Paulo 2,455 743 216Total 102,939 20,802 12,875
Source: Fundação SOS Mata Atlântica; INPE (2009, 2010, 2012).Note: *Not available.
82

Brazilian Forests in a nutshell2013Florestas do Brasil em resumo2012
Cerrado
Within the scope of the Satellite Monitoring of Deforestation in Brazilian Biomes Project, by the Ministry of Environment, the deforestation situation in Cerrado was mapped based on the comparison of images from Landsat and CBERS satellites.
Deforested area in the Cerrado biome (2002 - 2010) (km2)State 2002 - 2008 2008 - 2009 2009 - 2010Maranhão 14,825 2,338 1,587Bahia 9,266 1,000 726Mato Grosso 17,598 833 770Minas Gerais 8,927 534 522Piauí 4,213 701 979Tocantins 12,198 1,311 970Mato Grosso do Sul 7,153 241 310Goiás 9,898 664 596Paraná 0.5 1 1Rondônia 8 0.8 -São Paulo 903 7.5 3Distrito Federal 84 1 5Annual Average 14,179 7,636 6,469
Source: IBAMA (2009).
83
2013Brazilian Forests at a glance

84
Other Biomes
Deforested areas in Caatinga, Pampa and Pantanal biomes (2002 - 2009) (km²)
Biome Before 2002 2002-2008 2008-2009 Total
Caatinga 358,540 16,576 1,921 377,037Pampa 93,448 2,179 331 95,958Pantanal 18,662 4,279 188 23,129
Source: IBAMA (2009).

Brazilian Forests in a nutshell2013Florestas do Brasil em resumo2012
85
Florestas do Brasil em resumo20122013
Brazilian Forests at a glance

86
Forest FiresSince 1998, INPE provides daily data on heat spots received from several satellites. Data on the night passages of the satellite NOAA and the satellite Terra and Aqua (MODIS sensor) are loaded into the IBAMA information system, agency responsible for the National Forest Fire Prevention and Suppression System (Prevfogo). Using a geographic information system, satellite images and several databases with detailed information on the entire national territory, the monitoring team identifies areas at risk of fire outbreaks.
The heat spots detected in risk areas enter into an alert system that classifies them according to persistence, location and risk posed.

Brazilian Forests in a nutshell2013Florestas do Brasil em resumo2012
87
Total annual heat spots detected in Brazil (May 1998 - December 2012)Source: IBAMA (2012).
Monthly average of heat spots (May 1998 - May 2012)Source: IBAMA (2012).
Total anual de focos de calor detectados no Brasil (maio 1998 – dezembro 2012)
Fonte: IBAMA (2012).
0
50.000
100.000
150.000
200.000
250.000
1998
1999
2000
2001
2002
2003
2004
2005
2006
2007
2008
2009
2010
2011
2012
Nº de
Focos de Ca
lor
Ano
Média mensal de focos de calor (maio 1998 – maio 2012)
Fonte: IBAMA (2012).
0
10.000
20.000
30.000
40.000
50.000
60.000
Jan
Fev
Mar
Abr
Mai
Jun
Jul
Ago
Set
Out
Nov
Dez
Nº de
Focos de Ca
lor
MonthJan Feb Mar Apr May Jun Jul Aug Sep Oct Nov Dec
2013Brazilian Forests at a glance
No.
of H
eat S
pots
No.
of H
eat S
pots
Year
250,000
200,000
150,000
100,000
50,000
0
00
10,000
20,000
30,000
40,000
50,000
60,000
88

89
Brazilian Forests in a nutshell2013
orest ManagementF

90
Forest Governance Institutions
The responsibility of managing the Brazilian forests involves different institutions and the three levels of government: federal, state and local. At the Federal Government level, forest management lies under the direct responsibility of four institutions.
The Ministry of Environment (MMA) is responsible for the formulation of forest policies. It is the granting authority for sustainable forest production activities and it is responsible for signing forest concession contracts (www.mma.gov.br).
The Brazilian Forest Service (SFB) is the managing agency of federal public forests for sustainable production of goods and services. It also holds the responsibility of generating information, training and promotion of the forest sector (www.florestal.gov.br).
The Brazilian Institute of Environment and Renewable Natural Resources (Ibama) is the environmental and inspection agency responsible for the environmental licensing and control of Brazilian forests (www.ibama.gov.br).

91
Brazilian Forests in a nutshell2013
The Chico Mendes Institute for Biodiversity Conservation (ICMBio) is responsible for proposing, implementing, managing, protecting, inspecting and monitoring the Conservation Units instituted by the Federal Government (www.icmbio.gov.br).
State and Local Forest Management
Within the scope of the States and the Federal District, the institutional arrangement has some variations, but in general, the State departments of environment are responsible for the formulation of forest policies and regulation, while the State environmental agencies are responsible for licensing, supervision and control of forestry practices and conservation actions. Some states have created specific bodies for the management of public forests.
In municipalities that have structure for forest management, the arrangement is similar.
2013Brazilian Forests at a glance

Prin
cipa
is at
ribui
ções
do
s Órg
ãos
Con
trole
e F
iscal
izaçã
o Am
bien
tal d
as F
lore
stas
Con
serv
ação
Flo
resta
l
Ges
tão
de
Flor
esta
s Pú
blic
as/C
once
ssõe
s
Órg
ãos C
oleg
iado
s de
Part
icip
ação
na
Ges
tão
Flor
esta
l
Polít
ica
Flor
esta
l/ Po
der
Con
cede
nte
Uni
ão
Esta
dos
Mun
icíp
ios
MM
A Se
cret
aria
Esta
dual
de
Mei
o A
mbi
ente
Se
cret
aria
Mun
icip
al
de M
eio
Am
bien
te
IBAM
A Ó
rgão
Esta
dual
ou
Secr
etar
ia d
e M
eio
Ambi
ente
Órg
ão M
unic
ipal
de
Mei
o Am
bien
te
ICM
Bio
Órg
ão E
stadu
al d
e M
eio
Ambi
ente
Ó
rgão
Esta
dual
de
Mei
o Am
bien
te
Serv
iço
Flor
esta
l Br
asile
iro
Órg
ão E
stadu
al d
e G
estã
o de
Flo
resta
s Pú
blic
as
CO
NAM
A C
ON
AFLO
R/C
GFL
OP
Con
selh
o Es
tadu
al d
e M
eio
Ambi
ente
C
onse
lho
Mun
icip
al d
e M
eio
Ambi
ente
Inst
itutio
nal a
rran
gem
ent f
or fo
rest
man
agem
ent i
n th
e go
vern
men
tal l
evel
s
92
Mai
n fu
ncto
ns o
f the
In
stit
utio
ns
Fore
st P
olic
ies/
Gra
ntor
Min
istr
y of
the
Envi
ronm
ent
Stat
e Se
cret
aria
ts
of E
nvir
onm
ent
Mun
icip
al
Secr
etar
iats
of
Envi
ronm
ent
Envi
ronm
enta
l Con
trol
an
d Su
rvei
llanc
e of
Fo
rest
sIB
AM
ASt
ate
Age
ncy
or
Dep
artm
ent o
f En
viro
nmen
t
Mun
icip
al A
genc
y of
Env
iron
men
t
Fore
st C
onse
rvat
ion
ICM
Bio
Stat
e A
genc
y of
En
viro
nmen
tM
unic
ipal
Age
ncy
of E
nvir
onm
ent
Man
agem
ent o
f Pub
lic
Fore
sts/
Con
cess
ions
Bra
zilia
n Fo
rest
Se
rvic
e
Stat
e A
genc
y of
Pu
blic
For
ests
M
anag
emen
t-
Col
legi
ate
bodi
es fo
r pa
rtic
ipat
ion
in fo
rest
m
anag
emen
t
CO
NA
MA
CO
NA
FLO
R/
CG
FLO
P
Stat
e C
ounc
il of
En
viro
nmen
tM
unic
ipal
Cou
ncil
of E
nvir
onm
ent
Fede
ral
Stat
esM
unic
ipal
itie
s

Brazilian Forests in a nutshell2013Florestas do Brasil em resumo2012
93
Social Participation in Forest Management
In addition to the public hearings and consultations held in local communities, according to specific situations provided by law, there are three collegiate institutions that enable social participation in the forest management decision-making process.
The National Environmental Council (Conama) is the consulting and deliberative body of the National Environmental System (SISNAMA). It is a collegiate body representing federal, state and municipal environmental agencies, the private sector and civil society.
The National Forest Commission (Conaflor) provides guidelines for implementing actions of the National Forest Program (NFP) and coordinates the joint participation of different stakeholders in the development of public policies for the Brazilian forest sector.
The Public Forest Management Comission (CGFLOP) is the Brazilian Forest Service, advisory board whose purpose is to advise, assess and propose guidelines for the management of public forests in Brazil and to contribute to the Annual Forests Concessions Plan.
Social participation in forest management, in the states, occurs in most cases under the state councils of environment.
2013Brazilian Forests at a glance

94
Native Vegetation Protection Law
The Law No 12,651 of May 25th, 2012 provides rules for protection of native vegetation.The Law lays down general rules on the protection of vegetation, Permanent Preservation Areas and Legal Reserves; forest exploitation, the supply of forest raw materials, forest products chain of custody, the prevention and control of forest fires, and provides economic and financial instruments for achieving its goals.
Further details on the Native Vegetation Protection Law in the following address: http://www.florestal.gov.br/pngf/

Brazilian Forests in a nutshell2013Florestas do Brasil em resumo2013
95
2013Brazilian Forests at a glance
Government Plans for Forest Protection
The Brazilian government has implemented several plans aiming at promoting sustainable development and reducing deforestation and greenhouse gas emissions, which directly affect the management of the country’s forests.
Action Plan for Prevention and Control of Deforestation in the Legal Amazon (PPCDAM)
Launched in 2004, the PPCDAM goal is to reduce deforestation in the Legal Amazon region. The Plan is organized in three axes: Territorial and Land Region Tenure Organization; Monitoring and Environmental Control; Promoting Sustainable Productive Activities (BRASIL. Casa Civil, 2004).
For more information see: http://www.mma.gov.br
National Plan on Climate Change (PNMC)
Launched in 2008, the PNMC goal is to identify, plan and coordinate the actions and measures that are able to mitigate greenhouse gas emissions generated in Brazil, as well as other activities required for society’s adaptation to the impact of climate change. Two of PNMC’s main targets are related to the forest sector:
1. Seek sustained reduction of deforestation rates, in four-year averages, in all Brazilian biomes, until

96
achieving zero illegal deforestation. In practice, it means reduction of 40% in the average deforestation rate by 2006-2009 period, in relation to the average rate of the ten-year period of 1996 to 2005, and 30% more in each of the two following four-year periods, in relation to the preceding periods. In the case of Amazon biome, reaching this specific goal may avoid emissions of around 4.8 billion tons of carbon dioxide, in the period of 2006 to 2017, considering the magnitude order of 100 tC/ha.
2. Eliminate the net loss of forest cover area by 2015, which means that, in addition to preserving forests at the levels stipulated by the previous goal, the area of planted forests should double from the 5.5 million ha in 2008 to 11 million ha until 2020, of which 2 million ha will be planted with native species, especially in areas of degraded pastures, aiming their economic and environmental restoration.
For more information see: http://www.mma.gov.br

97
Brazilian Forests in a nutshell20132013
Brazilian Forests in a nutshell
Action Plan to Prevent and Control Deforestation and Wildfires in Cerrado (PPCerrado)
Launched in 2009, the PPCerrado aims at coordinating, articulating and carrying out initiatives to reduce deforestation in this biome, establishing targets for deforestation reduction rates and providing the foundation for estimating greenhouse gas emissions. Such estimates will be used to define emission reduction targets under the National Plan on Climate Change (BRASIL. MMA, 2009).
For more information see: http://www.mma.gov.br
Payment for Environmental Services
“Bolsa Verde” Federal Program
Launched in October 2011 by Law No. 12,512 and the Environmental Conservation Support Program, known as the “Bolsa Verde” Program, awards quarterly financial benefits of R$ 300 (~ US$ 130) to the families in situations of extremely poverty who live in environmental protection priority areas.
The program purpose is to combine population income increasing up with ecosystem conservation and sustainable use of natural resources, once 47% of the 16.2 million

98
people in extreme poverty live in rural areas. The first phase of the “Bolsa Verde” Program was applied primarily in the Legal Amazon area in October 2011 and in 2012 it was expanded to the whole country.
For more information see: http://www.mma.gov.br/desenvolvimento-rural/bolsa-verde. stare
“Bolsa Floresta” Program of the State of Minas Gerais
“Bolsa Floresta” Program of Minas Gerais state, established by Law No. 17,727 of 2008 and regulated by Decree No. 45,113 of 2009, preceded the national initiative. In 2011, the program had a budget of R$ 8.5 million (~US$ 3.7 million), with approximately 900 landowners participating in the Program. The plan provides that each landowner receives R$ 200 (~US$ 87) per year for each hectare covered with native vegetation.
More informtation is available in the site: http://www.ief.mg.gov.br/bolsa-verde. (MINAS GERAIS. IEF, 2011).

Brazilian Forests in a nutshell2013Florestas do Brasil em resumo2012
99
2013Brazilian Forests in a nutshell
“Bolsa Floresta” Program of the State of Amazonas
In June 2007, in a pioneer initiative, the Amazonas State Government launched the “Bolsa Floresta” Program. The Program is focused on populations living in Conservation Units (CUs). The “Bolsa Floresta” establishes an annual payment R$ 1,360 per family (~US$ 590), divided into four components: 1) “Bolsa Floresta” which provides direct payments to the woman representative of each family; 2) Income Forest Grant, directed for income generation (production of Brazilian nuts, arapaima fish, açaí berry, tourism, etc.); 3) Social Forest Grant, which focuses on social investments, especially education and health; 4) “Bolsa Floresta” Association, which foresees investments in strengthening community-based organizations. In order to be eligible to participate in the Forest Grant Program, families must be living for two or more years in the Conservation Units. This rule tends to avoid migration to these areas motivated by the Program’s benefits.

100100
Sustainable Forest District of Road BR-163
A Presidential Decree of February 13th, 2006, established the geo-economic and social complex named Sustainable Forest District (DFS) of the road BR-163, with the purpose of implementing public policies to stimulate sustainable forest production in that region. The legal act also established the Interagency Working Group (IWG), with representatives of the Presidency Civil House and other 13 ministries. Its purpose is to propose actions aimed at fostering socioeconomic development based on sustainable forestry and environmental conservation in the Sustainable Forest District of road BR-163, as well as to elaborate an implementation plan for the proposed actions.
It covers the municipalities of Altamira, Aveiro, Belterra, Itaituba, Jacareacanga, Juriti, Novo Progresso, Óbidos, Placas, Prainha, Rurópolis, Santarém and Trairão.
Approximately 57% of the area of SFD BR-163 is comprised by federal Conservation Units, totaling 10.8 million hectares, of which 8.3 million belong to the category of Federal Conservation Units of Sustainable Use. The mosaic of federal Conservation Units includes three National Parks, two Extractivist Reserves, one Environmental Protection Area and eight National Forests. ItItIt

101
Brazilian Forests in a nutshell2013Florestas do Brasil em resumo2012
101
2013Brazilian Forests at a glance
It covers the municipalities of Altamira, Aveiro, Belterra, Itaituba, Jacareacanga, Juriti, Novo Progresso, Óbidos, Placas, Prainha, Rurópolis, Santarém and Trairão.
Some 57% of the area of DFS BR-163 is comprised by federal comprised by Federal Conservation Units, totaling 10.8 million hectares, of which 8.3 million are considered as Federal Conservation Units of Sustainable Use. The mosaic of federal Conservation Units includes three National Parks, two Extractivist Reserves, one Environmental Protection Area and eight National Forests.

102
Sustainable Forest Disctrict of Road BR-163
Source: MMA (2010)
Land Cover
Federal Conservation Units
ForestOther Wooded Lands
Full Protection
Other Lands
Sustainable Use

Brazilian Forests in a nutshell2013Florestas do Brasil em resumo2012
103
National Forest Development Fund (FNDF)
Created by Law No. 11,284/2006 (Public Forest Management Law) and regulated by Decree No. 7,167/2010, the National Forest Development Fund is a public fund of financial nature, which is part of the Federal Government budget and it is managed by the Brazilian Forest Service. It aims at fostering the development of forest-based sustainable activities in Brazil and promoting technological innovation in the sector.
The FNDF supports actions in eight priority areas: (I) research and technological development in forest management; (II) technical assistance and forestry extension; (III) restoration of degraded areas with native species; (IV) sustainable exploitation of forest resources; (V) control and monitoring of forestry activities and deforestation; (VI) training in forest management and training of multipliers in forestry activities; (VII) environmental education; and (VIII) environmental protection and conservation of natural resources.
The main financial source of the FNDF is the forest concession contracts in federal public forests, as shown in the table below. Additionally, the Fund may receive donations from national or international, public or private entities.
Destination of resources from federal forest concessions
Institution Concession in National Forests
Concession in other Public Forests
ICMBio 40% -States 20% 30%Municipalities 20% 30%FNDF 20% 40%
2013Brazilian Forests at a glance

104
Amazon Fund
The Amazon Fund aims at raise donations for non-reimbursable investments to prevent, monitor and combat deforestation and promote the conservation and sustainable use of forests in the Amazon biome, according to Decree No. 6,527 of August 1st, 2008.
The Amazon Fund is managed by the National Bank for Economic and Social Development (BNDES), which also undertakes fund-raising, contracting and monitoring responsibilities for the supported projects and activities.
The Amazon Fund supports projects in the following areas:
• Management of public forests and protected areas; • Environmental control, monitoring and enforcement; • Sustainable forest management; • Economic activities from sustainable forest use; • Ecological and economic zoning, spatial planning and
land tenure regulation; • Conservation and sustainable use of biodiversity, and • Restoration of deforested areas.
The Amazon Fund may use up to 20% of its resources to support the development of deforestation monitoring and control systems in other Brazilian biomes and tropical countries. 30 Projects had been contracted by November 7, 2012, totaling R$ 315.2 million (~US$ 137 million)

for financial support and 4 projects were approved, totaling R$ 81.1 million (~US$ 35 million). In the same period, disbursements amounted to R$ 119 million (~US$ 52 million).
The Amazon Fund also relies on donations from foreign governments and companies, and is getting structured to receive donations from multilateral institutions, non-governmental organizations and individuals. By October 4th 2012 the Amazon Fund had received donations from the Government of Norway (R$ 903,465,000 equivalent to ~US$ 392,810,870), the Federal Republic of Germany-KFW (R$ 55,185,900.00, equivalent to ~US$ 23,993,870) and the Petróleo Brasileiro S.A. - Petrobrás R$ 7,929,444 (~US$ 3,447,584). Total contribution R$ 966,580,344 (~US$ 420,252,324). (BRASIL. MMA. FUNDO AMAZÔNIA, 2012).
105
Brazilian Forests in a nutshell20132013
Brazilian Forests at a glance

Source Control of Forest Products
The source control of timber, charcoal and other forest products or by-products is carried out through a national system that integrates data from states and federal entities, being coordinated, supervised and regulated by IBAMA.
Any kind of transport and storage of timber, firewood or charcoal and other forest products or sub-products from native species forests for commercial or industrial purposes require licensing by the relevant agency, called the Forest Source Document - DOF. This license must follow the product to the final processing facilities.
Source analysis on timber coming from natural forests, based on transport authorizations granted by the integrated entities of the DOF System, in the 2007-2010 period, showed that approximately 49% of timber come from sustainable forest management and 51% from authorized deforestation.
Out of the percentage of timber from authorized deforestation, 46% come from areas of alternative land use such as livestock and agriculture and the remaining 5% from areas where vegetation removal is permitted for implementation of projects such as highways, industries and other.
106

Brazilian Forests in a nutshell2013Florestas do Brasil em resumo2012
107
2013Brazilian Forests at a glance
National Forest Information System - Nfis
The National Forest Information System - Snif is a national database of forest information, composed by collecting, producing, treating, organizing, storing, processing and disseminating data, information and knowledge on forest related issues, from diverse sources, which allows easy access to all interested parties.
The Brazilian Forest Service is responsible for creating and maintaining the National Forest Information System, in accordance with Law 11,284/2006. The main information axes are: Forest Resources (information provided by several institutions and by the National Forest Inventory - NFI), Forest Management (information provided by governmental agencies), Forest Production (information produced by the forest sector and federal institutions, including exploration, production, consumption and market), information on Education and Forest Research (information collected in education institutions and forest research centers).
For more information see: www.florestal.gov.br/snif

108

109
Brazilian Forests in a nutshell2013ocioeconomic Aspects of the Forest Sector
S

110

Brazilian Forests in a nutshell2013Florestas do Brasil em resumo2012
111
Num
ber o
f for
mal
em
ploy
men
ts p
er fo
rest
sect
or se
gmen
tFo
rest
sect
or se
gmen
t20
0720
0820
0920
1020
11¹
Supp
ortin
g fo
rest
prod
uctio
n ac
tiviti
es60
,787
52,3
7644
,419
53,4
2554
,151
Woo
d pr
oces
sing
99,1
8387
,929
83,1
1485
,302
86,1
23Pu
lp a
nd p
aper
pro
duct
ion
158,
676
161,
354
163,
182
173,
219
174,
244
Woo
d str
uctu
res a
nd a
rtifa
cts
prod
uctio
n45
,407
45,0
6143
,742
47,5
59
50,0
00²
Vene
ers a
nd p
lyw
ood
prod
uctio
n 50
,786
45,0
8939
,491
42,0
4541
,600
Fore
st pr
oduc
tion
- nat
ive
fore
sts8,
671
6,44
36,
382
7,16
07,
742
Fore
st pr
oduc
tion
- for
est
plan
tatio
ns62
,499
65,4
5462
,877
67,0
9768
,481
Furn
iture
man
ufac
turin
g16
8,13
917
1,21
817
2,74
018
8,17
819
0,82
6To
tal
654,
148
634,
924
615,
947
663,
985
673,
167
Sour
ce: B
rasil
. MT
E (2
012)
.
Not
e:1
Incl
udes
the
num
ber o
f for
mal
em
ploy
men
ts un
til S
epte
mbe
r 201
1.2
Esti
mat
ed.
Employment
2013Brazilian Forests at a glance

Roundwood Quantity (1,000 m3) Value (million R$)
Source Use 2007 2008 2009 2010 2011 2007 2008 2009 2010 2011
Native forest
Fuel 64,153 59,894 54,558 50,230 48,384 1,392 1,439 1,304 1,274 1,321
Industry 16,389 14,127 15,248 12,655 14,116 1,801 1,822 2,571 2,156 2,709
Subtotal of native forest 80,542 74,021 69,806 62,885 62,500 3,193 3,261 3,875 3,430 4,030
Forest plantation
Fuel 69,538 73,841 68,439 75,688 84,763 2,698 3,282 2,839 3,315 4,135
Industry 105,132 101,262 106,911 115,742 125,852 5,481 5,424 6,083 7,246 8,862
Subtotal of forest plantation 174,670 175,103 175,350 191,430 210,615 8,179 8,706 8,922 10,561 12,997
Total 255,212 249,124 245,156 255,273 273,115 11,372 11,967 12,797 14,000 17,027
Quantity and value of roundwood from native forests and forest plantations and their main uses
Timber Products
Source: IBGE. PEVS (2012).Note: Fuel value is achieved by the sum of firewood and charcoal turned into firewood (1m³ firewood = (1t charcoal x 1000/250) x 2).
Forest Exploration and Production
112

Brazilian Forests in a nutshell2013Florestas do Brasil em resumo2012
Roundwood Quantity (1,000 m3) Value (million R$)
Source Use 2007 2008 2009 2010 2011 2007 2008 2009 2010 2011
Native forest
Fuel 64,153 59,894 54,558 50,230 48,384 1,392 1,439 1,304 1,274 1,321
Industry 16,389 14,127 15,248 12,655 14,116 1,801 1,822 2,571 2,156 2,709
Subtotal of native forest 80,542 74,021 69,806 62,885 62,500 3,193 3,261 3,875 3,430 4,030
Forest plantation
Fuel 69,538 73,841 68,439 75,688 84,763 2,698 3,282 2,839 3,315 4,135
Industry 105,132 101,262 106,911 115,742 125,852 5,481 5,424 6,083 7,246 8,862
Subtotal of forest plantation 174,670 175,103 175,350 191,430 210,615 8,179 8,706 8,922 10,561 12,997
Total 255,212 249,124 245,156 255,273 273,115 11,372 11,967 12,797 14,000 17,027
113
2013Brazilian Forests at a glance

114
Participation of natural and planted forests in the production of roundwood and firewood.Source: IBGE. PEVS (2012), adapted / SFB.GEIF.
Annual production of wood-based panels Panels produced
(1,000 m³) 2007 2008 2009 2010 2011
Plywood (veneers and laminates) 3,790 3,188 2,354 2,207 --
Particle board(MDP + OSB) 2,784 2,768 2,623 3,194 3,069*
Hardboard 527 511 400 380 362Medium Density Fiberboard (MDF) 1,879 2,074 2,395 3,036 3,039
Total 8,980 8,541 7,772 8,817 6,470
Source: ABIPA (2012); ABRAF (2012); IBGE. PIA (2008, 2009, 2010, 2011a, 2012). *This information did not include OSB.
89.91%
63.66%
10.09%
36.34%
0%10%20%30%40%50%60%70%80%90%
100%
Roundwood FirewoodNatural Forest Forest PlantationPe
rcen
tage
of ro
undw
ood
and
firew
ood
prod
uctio
n

Brazilian Forests in a nutshell2013Florestas do Brasil em resumo2012
Annual production of wood pulp and paper Wood pulp and paper produced (1,000 t) 2007 2008 2009 2010 2011
Wood pulp 12,520 13,199 14,510 14,615 14,639Newsprint paper 144 140 127 124 129Printing and writing paper 2,575 2,534 2,622 2,733 2,745
Household and sanitary paper 812 850 868 905 961
Wrapping and Packaging Paper 4,424 4,775 4,649 4,994 5,168
Paperboard 645 713 748 799 754Other kinds of paper 409 397 414 423 402Total 21,529 22,608 23,938 24,593 24,798
Source: BRACELPA (2012).
Annual production of sawnwood
Sawnwood produced (1,000 m³) 2007 2009 2010
Sawnwood, planed or polished 7,241 4,713 4,098
Boards and laths 669 578 536
Planks 708 124 292Joists, rafters, beams and similar for construction 74 87 63
Total 8,692 5,502 4,989
Source: IBGE. PIA (2008, 2009, 2011a, 2012).
115
2013Brazilian Forests at a glance

Non-timber Forest Products
Quantity produced(2006 - 2011).Source : IBGE. PEVS (2012).
116
Non-timber products derived from natural forests:
Percentage of each product produced (2011);
Percentage produced per region (2011) and;
Food
Rubber
Wax
Fiber
Oil
Other
Food
Rubber
Wax
Fiber
Oil
Other
North
Northeast
Southeast
South
Midwest

Brazilian Forests in a nutshell2013Florestas do Brasil em resumo2012
117
Quantity and value of main non-timber products extracted from forest plantations
ProductQuantity produced (t)
2007 2008 2009 2010 2011Bark of black wattle 172,090 158,548 109,010 107,171 105,578
Eucalyptus leaf 53,084 58,326 64,077 96,907 56,797
Pine resin 65,652 58,061 56,565 71,073 71,619
Total 290,826 274,935 229,652 275,151 233,994
Source: IBGE. PEVS (2012).
ProductProduction value (1,000 R$)
2007 2008 2009 2010 2011Bark of black wattle 18,201 14,064 10,554 9,586 11,799
Eucalyptus leaf 1,745 2,245 2,459 4,064 2,544
Pine resin 79,065 66,832 76,331 126,026 137,528
Total 99,011 83,141 89,344 139,676 151,871
Source: IBGE. PEVS (2012).
2013Brazilian Forests at a glance

Product Quantity (t) Value (1,000 R$) Main Biome2007 2008 2009 2010 2011 2007 2008 2009 2010 2011
Açai berry 108,033 120,890 115,947 124,421 215,380 106,664 133,746 160,528 179,378 304,566 Amazon
Cashew-nut 5,480 4,447 4,238 4,030 3,179 5,853 4,161 4,013 4,774 3,820 Caat./Atl.F./Cerr.
Brazilian nut 30,406 30,815 37,467 40,357 42,152 45,492 45,732 52,261 55,194 69,404 Amazon
Mate 225,957 219,773 218,102 227,462 229,681 87,667 102,635 86,587 100,526 118,049 Atlantic Forest
Palm heart 6,037 5,873 5,076 4,920 5,563 9,903 5,988 7,353 8,691 9,535 Amazon
Pine nut 4,887 4,768 5,066 5,715 8,032 5,473 6,229 6,878 9,120 10,955 Atlantic Forest
Umbu (berry) 8,619 9,268 9,428 9,804 9,323 5,092 6,413 6,671 7,499 7,600 Caatinga
Latex (Hevea) 3,958 3,625 3,463 3,516 3,005 7,705 7,894 7,603 8,235 8,202 Amazon
Carnauba wax 22,464 21,511 21,131 21,462 21,274 78,672 80,884 97,136 103,603 108,268 Caatinga
Buriti fiber 500 610 803 465 465 1,150 1,269 1,404 1,693 2,054 Amazon
Piaçava fiber 82,096 78,167 72,232 63,776 61,409 97,857 104,120 110,245 117,706 123,435 Amaz./Atl.F.
Carnauba fiber 1,488 1,517 1,540 1,552 1,640 822 905 1,019 1,226 1,387 Caatinga
Licuri (coconut) 5,355 4,649 4,654 4,307 4,213 4,508 3,714 3,816 3,623 4,105 Caatinga
Copaiba oil 523 514 538 580 214 3,790 3,788 4,148 4,908 2,178 Amazon
Babaçu almond 114,874 110,636 109,299 106,055 102,499 113,268 115,636 121,351 130,940 142,208 Cerrado
Cumaru almond 97 86 97 95 103 542 644 710 744 925 Amazon
Pequi almond 5,363 5,531 5,992 5,786 7,047 6,035 6,818 8,793 10,688 11,113 Cerrado
Source: IBGE. PEVS (2012); IBGE. PAM (2011).
Quantity and value of main non-timber forest products extracted from native species
118

Brazilian Forests in a nutshell2013Florestas do Brasil em resumo2012
Product Quantity (t) Value (1,000 R$) Main Biome2007 2008 2009 2010 2011 2007 2008 2009 2010 2011
Açai berry 108,033 120,890 115,947 124,421 215,380 106,664 133,746 160,528 179,378 304,566 Amazon
Cashew-nut 5,480 4,447 4,238 4,030 3,179 5,853 4,161 4,013 4,774 3,820 Caat./Atl.F./Cerr.
Brazilian nut 30,406 30,815 37,467 40,357 42,152 45,492 45,732 52,261 55,194 69,404 Amazon
Mate 225,957 219,773 218,102 227,462 229,681 87,667 102,635 86,587 100,526 118,049 Atlantic Forest
Palm heart 6,037 5,873 5,076 4,920 5,563 9,903 5,988 7,353 8,691 9,535 Amazon
Pine nut 4,887 4,768 5,066 5,715 8,032 5,473 6,229 6,878 9,120 10,955 Atlantic Forest
Umbu (berry) 8,619 9,268 9,428 9,804 9,323 5,092 6,413 6,671 7,499 7,600 Caatinga
Latex (Hevea) 3,958 3,625 3,463 3,516 3,005 7,705 7,894 7,603 8,235 8,202 Amazon
Carnauba wax 22,464 21,511 21,131 21,462 21,274 78,672 80,884 97,136 103,603 108,268 Caatinga
Buriti fiber 500 610 803 465 465 1,150 1,269 1,404 1,693 2,054 Amazon
Piaçava fiber 82,096 78,167 72,232 63,776 61,409 97,857 104,120 110,245 117,706 123,435 Amaz./Atl.F.
Carnauba fiber 1,488 1,517 1,540 1,552 1,640 822 905 1,019 1,226 1,387 Caatinga
Licuri (coconut) 5,355 4,649 4,654 4,307 4,213 4,508 3,714 3,816 3,623 4,105 Caatinga
Copaiba oil 523 514 538 580 214 3,790 3,788 4,148 4,908 2,178 Amazon
Babaçu almond 114,874 110,636 109,299 106,055 102,499 113,268 115,636 121,351 130,940 142,208 Cerrado
Cumaru almond 97 86 97 95 103 542 644 710 744 925 Amazon
Pequi almond 5,363 5,531 5,992 5,786 7,047 6,035 6,818 8,793 10,688 11,113 Cerrado
Note: Production of permanent crops in 2011 (t): Rubber - 274,163; Cashew-nut - 230,785; Mate - 443,635; Palm heart - 103,419.
119
2013Brazilian Forests at a glance

120
Exports of Forest Products
Product Quantity Value (1,000 US$)Unit 2008 2009 2010 2011 2012 2008 2009 2010 2011 2012
Wood pulp 1,000 t 7,202 8,586 8,793 8,880 8,912 3,901,136 3,308,862 4,750,531 4,984,783 4,700,438
Paper and paperboard 1,000 t 1,856 1,910 1,969 1,942 1,764 1,663,955 1,480,177 1,784,148 1,916,305 1,716,063
Wood Charcoal 1,000 t 5 6 3 1 1 1,609 2,200 1,116 560 457
Recovered paper 1,000 t 3 2 5 27 29 1,009 437 1,459 6,682 5,432
Other fiber pulp 1,000 t 11 4 6 4 -- 15,225 5,978 9,688 10,153 --
Wood chips and particles 1,000 m3 5,658 4,100 4,744 4,249 4,371 142,180 91,187 110,807 107,490 116,865
Sawnwood 1,000 m3 2,120 1,394 1,359 1,325 1,222 679,549 398,922 418,128 408,696 351,757
Plywood 1,000 m3 2,144 1,496 1,447 1,217 1,348 632,173 343,453 418,259 370,360 408,101
Fiberboard 1,000 m3 236 192 141 147 204 101,534 69,107 57,966 67,790 88,487
Veneer sheets 1,000 m3 120 33 42 69 55 55,978 25,571 30,290 36,091 34,427
Agglomerate 1,000 m3 71 59 77 85 98 26,293 16,698 23,747 26,776 28,152
Roundwood 1,000 m3 22 6 24 75 66 5,752 1,144 5,045 11,943 12,655
Wood residues 1,000 m3 4 4 1 1 2 67 98 29 23 103
Quantity and value of main timber forest products exports
Source: Brasil. MDIC (2013).

Brazilian Forests in a nutshell2013Florestas do Brasil em resumo2012
Product Quantity Value (1,000 US$)Unit 2008 2009 2010 2011 2012 2008 2009 2010 2011 2012
Wood pulp 1,000 t 7,202 8,586 8,793 8,880 8,912 3,901,136 3,308,862 4,750,531 4,984,783 4,700,438
Paper and paperboard 1,000 t 1,856 1,910 1,969 1,942 1,764 1,663,955 1,480,177 1,784,148 1,916,305 1,716,063
Wood Charcoal 1,000 t 5 6 3 1 1 1,609 2,200 1,116 560 457
Recovered paper 1,000 t 3 2 5 27 29 1,009 437 1,459 6,682 5,432
Other fiber pulp 1,000 t 11 4 6 4 -- 15,225 5,978 9,688 10,153 --
Wood chips and particles 1,000 m3 5,658 4,100 4,744 4,249 4,371 142,180 91,187 110,807 107,490 116,865
Sawnwood 1,000 m3 2,120 1,394 1,359 1,325 1,222 679,549 398,922 418,128 408,696 351,757
Plywood 1,000 m3 2,144 1,496 1,447 1,217 1,348 632,173 343,453 418,259 370,360 408,101
Fiberboard 1,000 m3 236 192 141 147 204 101,534 69,107 57,966 67,790 88,487
Veneer sheets 1,000 m3 120 33 42 69 55 55,978 25,571 30,290 36,091 34,427
Agglomerate 1,000 m3 71 59 77 85 98 26,293 16,698 23,747 26,776 28,152
Roundwood 1,000 m3 22 6 24 75 66 5,752 1,144 5,045 11,943 12,655
Wood residues 1,000 m3 4 4 1 1 2 67 98 29 23 103
121
2013Brazilian Forests at a glance

122
Mai
n de
stin
atio
ns f
or B
razi
lian
tim
ber
fore
st p
rodu
cts
expo
rts
(201
2)
(mill
ion
US$
)
The
Net
herl
ands
1,05
0 Ger
man
y17
5
Chi
na1,
363
Japa
n24
1
Ital
y52
4B
elgi
um38
3A
rgen
tina 456
Sour
ce: M
DIC
(201
3)
Fran
ce31
4
Uni
ted
Kin
gdom 40
5
Uni
ted
Stat
es1,
788
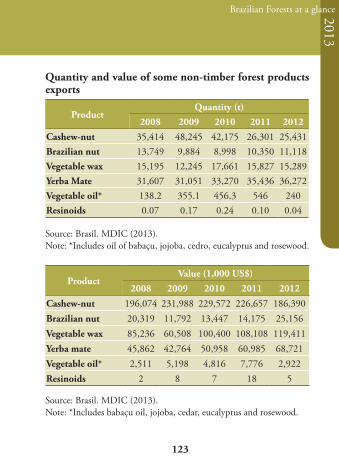
123
Brazilian Forests in a nutshell2013
Quantity and value of some non-timber forest products exports
ProductQuantity (t)
2008 2009 2010 2011 2012Cashew-nut 35,414 48,245 42,175 26,301 25,431Brazilian nut 13,749 9,884 8,998 10,350 11,118Vegetable wax 15,195 12,245 17,661 15,827 15,289Yerba Mate 31,607 31,051 33,270 35,436 36,272Vegetable oil* 138.2 355.1 456.3 546 240Resinoids 0.07 0.17 0.24 0.10 0.04
Source: Brasil. MDIC (2013).Note: *Includes oil of babaçu, jojoba, cedro, eucalyptus and rosewood.
ProductValue (1,000 US$)
2008 2009 2010 2011 2012
Cashew-nut 196,074 231,988 229,572 226,657 186,390Brazilian nut 20,319 11,792 13,447 14,175 25,156Vegetable wax 85,236 60,508 100,400 108,108 119,411Yerba mate 45,862 42,764 50,958 60,985 68,721Vegetable oil* 2,511 5,198 4,816 7,776 2,922Resinoids 2 8 7 18 5
Source: Brasil. MDIC (2013).Note: *Includes babaçu oil, jojoba, cedar, eucalyptus and rosewood.
2013Brazilian Forests at a glance

124
Prod
uct
Qua
ntit
yVa
lue
(1,0
00 U
S$)
Uni
t20
0820
0920
1020
1120
12
2008
2009
2010
2011
20
12W
ood
char
coal
1,00
0 t
355
8512
411
077
19,1
646,
934
11,5
4112
,177
8,66
7
Pape
r an
d pa
perb
oard
1,00
0 t
1,20
11,
006
1,38
91,
315
1,27
91,
104,
856
869,
886
1,21
6,17
01,
292,
957
1,23
4,50
5
Rec
over
ed
pape
r1,
000
t19
1320
118
2,12
197
33,
027
2,59
91,
778
Woo
d pu
lp1,
000
t34
137
642
441
042
326
4,08
922
8,92
634
1,53
335
4,46
431
6,08
3
Oth
er fi
ber
pulp
1,00
0 t
48
98
118,
068
11,7
6515
,522
17,3
1221
,319
Woo
d re
sidu
es1,
000
m3
296
263
275
245
150
450
688
747
840
741
Saw
nwoo
d1,
000
m3
113
100
8458
4518
,157
15,3
9514
,735
18,8
0822
,618
Fibe
rboa
rd1,
000
m3
182
103
146
172
104
69,9
5734
,410
55,2
8174
,170
48,3
44
Agg
lom
erat
e1,
000
m3
5240
184
516
,017
8,92
75,
384
1,95
72,
808
Vene
er sh
eets
1,00
0 m
314
1010
98
14,7
649,
456
9,87
59,
095
8,03
4
Rou
ndw
ood
1,00
0 m
319
2626
925
1,37
32,
611
1,15
41,
338
1,12
4
Plyw
ood
1,00
0 m
34
44
22
3,00
61,
617
2,38
61,
748
2,65
8
Woo
d ch
ips
and
part
icle
s1,
000
m3
1,9
0,2
111
0,3
7430
617
735
338
5
Imports of Forest ProductsQ
uant
ity
and
valu
e of
the
mai
n ti
mbe
r fo
rest
pro
duct
s im
port
s
Sour
ce: B
rasil
. MD
IC (2
013)
.

125
Brazilian Forests in a nutshell2013
Com
pari
son
of m
ain
tim
ber
fore
st p
rodu
cts e
xpor
ts a
nd im
port
s in
Bra
zil
Sour
ce: B
rasil
. MD
IC (2
013)
.
2013Brazilian Forests at a glance

126
Domestic Trade of Timber in the Legal Amazon
The total volume of roundwood from Legal Amazon native forests legally traded in 2011 was 12.9 million m³, of which 89% were from the states of Pará, Mato Grosso and Rondônia. An amount of 5.9 million m³ of sawnwood was produced this year, generating around R$ 4.3 billion reais (~US$ 1.9 billion).
Roundwood consumption and sawnwood production in the Legal Amazon (2011)
State of origin
Roundwood consumption (m³)
Sawnwood production (m³)*
Values (million R$)
Acre1 414,215 142,488 62Amapá1 131,768 89,907 56Amazonas1 429,683 212,009 108Maranhão1 218,965 196,597 89Mato Grosso2 4,937,976 1,425,985 1,218Pará2 4,245,326 2,319,020 2,044Rondônia1 2,234,206 1,328,945 613Roraima1 261,899 204,165 74Tocantins1 15,101 27,228 16Legal Amazon 12,889,139 5,946,342 4,280
Source: 1 IBAMA. DOF (2012); 2 OEMAs. Sisflora (2012).
Note: * Sawnwood in the following forms: planks, rafters, squared or sliced boxboards, scantlings, benefitted planks, boards, rods, beams, joists, laths, battens and sleepers.

Brazilian Forests in a nutshell2013Florestas do Brasil em resumo2012
127
2013
The volume of timber extracted from the Legal Amazon states and traded to other states outside this region in 2011 was 5.5 million m3. Approximately 60% was sold to the States of São Paulo, Minas Gerais, Paraná, Santa Catarina and Bahia, from which São Paulo represents alone 23%.
Brazilian Forests at a glance

128
Volume of timber from the Legal Amazon traded in other states (2011)
State Volume (m³) State Volume (m³)São Paulo 1,268,383 Pernambuco 202,452Minas Gerais 574,201 Rio Grande do Norte 167,818Paraná 547,736 Paraíba 148,002Santa Catarina 418,869 Alagoas 144,072Bahia 395,688 Espírito Santo 125,880Rio de Janeiro 343,813 Sergipe 101,855Ceará 288,615 Distrito Federal 94,404Goiás 286,334 Mato Grosso do Sul 93,173Rio Grande do Sul 252,205 Piauí 87,166Total 5,540,666Source: IBAMA. DOF (2012).
Percentage of total native timber volume from the Legal Amazon traded in other states (2011)
Source: IBAMA. DOF (2012).
Estados Volume (m³) Percentual do volume de madeira nativa oriunda da Amazônia Legal comercializada no atacado para outros estados em 2011 . Fonte: DOF - 2011
SP 22,89
MG 10,36
PR 9,89
SC 7,56
BA 7,14
RJ 6,21
CE 5,21
GO 5,17
RS 4,55
PE 3,65
RN 3,03
PB 2,67
AL 2,60
ES 2,27
SE 1,84
DF 1,70 Fonte: Ibama. DOF (2012).
MS 1,68
PI 1,57
0
5
10
15
20
25
SP MG PR SC BA RJ CE GO RS PE RN PB AL ES SE DF MS PI
Estados
% d
e M
adei
ra N
ativ
a %
of N
ativ
e T
imbe
r
States

Brazilian Forests in a nutshell2013Florestas do Brasil em resumo2012
129
Volume of timber from the Legal Amazon traded outside the region, per product type (2011)
Product type Volume (m³) Product type Volume
(m³)Squared or sliced boxboards 42,892 Rod 162
Briquette 112 Beam 1,401,913Scantling 404 Joist 149,521Wood chips 8,406 Batten board 9,773Plywood 229,122 Fence Post 586Decking 48,665 Wooden flooring 82,082Sleepers 10,428 Round logs 7Stakes 167 Finished product 288,370Parallel lumber 183,089 Blade residues 22,721Sliced lumber 54,186 Sawmill residues 5,682Planned lumber 160 Lath 318,551Rafter 696,176 Batten 95,250Plank 657,072 Parquet flooring 3,565Large plank 37,261 Roundwood 1,249Board 1,191,565 Post 1,529Total 5,540,666Source: IBAMA. DOF (2012).
2013Brazilian Forests at a glance

130
Forest Certification
The forest and chain of custody certification in Brazil is carried out by several certification companies, through two certification systems: the Brazilian Program for Forest Certification (Cerflor), bound to the Program for the Endorsement of Forest Certification Schemes (PEFC), and the Forest Stewardship Council (FSC).
Cerflor - Brazilian Program for Forest Certification
Cerflor aims at forest management and chain of custody certification. By the end of November 2012, there were in Brazil 34 chain of custody certifications for forest products and 16 forest management certifications by Cerflor, totaling 1,463,308 hectares of forests, of which 65,078 ha are native forests and 1,398,230 ha are planted forests.
Área florestal certificada com selo Cerflor no Brasil (2011)
UF Quantidade Área %MS 2 476.750,96 32,58SP 1 298.908,17 20,43ES 2 269.472,30 18,42MG 1 101.803,55 6,96RS 1 99.730,00 6,82BA 2 90.497,00 6,18RO 3 65.078,37 4,45SC 3 30.932,00 2,11PR 1 30.136,00 2,06Total 16 1.463.308,35 100,00
1.463.308,00 Fonte: INMETRO (2011).
6.900.000,008.363.308,00
Certificações por estado
32,58
20,43 18,42
6,96 6,82 6,18 4,45
2,11 2,06
0
5
10
15
20
25
30
35
MS SP ES MG RS BA RO SC PR
Área Cer@fi
cada %
Percentage of forest area certified by Cerflor stamp in Brazil per State (2012)
Cer
tifie
d A
rea
%
32.58
20.43 18.42
6.184.45
6.82
2.11 2.06
6.96

Brazilian Forests in a nutshell2013Florestas do Brasil em resumo2012
131
2013Brazilian Forests at a glance
Certified forest areas with FSC stamp in Brazil per state (2012)Source: FSC (2012).
FSC - Forest Stewardship Council
The FSC aims at the dissemination of good forestry practices according to principles and criteria that bring together ecological safeguards, social benefits and economic viability, and are the same for the whole world.
By the end of November 2012, there were in Brazil 919 chain of custody certifications for forest products and 93 forest management and chain of custody certifications by the FSC, covering 7.2 million hectares of forests, of which 3.9 million hectares are planted forests, 3 million hectares are native forests and 300 thousand hectares are mixed forest management.
Planted Native

132
Forests in the Energy Mix
Firewood and charcoal accounted for 10% of Brazil’s energy mix in 2011.
Energy consumption in Brazil (2011)Souce: Brasil. MME (2012).
Use of firewood from native forests and forest plantations (2011) (%) Source: MME (2012).
The domestic use of firewood for cooking food is still significant in the country, representing 25% of its total allocation.

133
Brazilian Forests in a nutshell20132013
Brazilian Forests at a glance
Forest Financing
To meet the great demand for information on how to finance the various forestry activities (such as reforestation of Legal Reserves and Permanent Preservation Areas; planting native species; implementation of agroforestry and silvopastoral systems; industrial forest plantations in order to supply mainly demands for charcoal, energy and wood pulp), the Brazilian Forest Service prepared a Forest Financing Guide, which provides key information about credit lines and financing programs, beneficiaries, value limits , interest rates, reimbursement terms and grace periods, safeguards and financial agents that operate them. The full text of the Forest Financing Guide can be accessed on the website http://www.florestal.gov.br.

134

135
Brazilian Forests in a nutshell2013
orest EducationF

In Brazil, 55 undergraduate courses in Forest Engineering are offered by 50 Universities, and 21 postgraduate courses in Forest Engineering and Forest Sciences (BRASIL. MEC, 2012).
Moreover, there are 2 forest-related technical courses (1 in Silviculture and 1 in Pulp and Paper) and 30 forest-related High School courses (21 for Forest Technicians, 7 for Pulp and Paper Technicians, 1 for Agroforestry Technicians and 1 for Indigenous Agroforestry Agents) (BRASIL. MEC, 2012).
For more information see Snif website - Forest Education and Research: http://www.florestal.gov.br/snif/
136

Brazilian Forests in a nutshell2013Florestas do Brasil em resumo2012
137
Distribution of undergradute, postgraduate and technical forest-related courses
2013
Undergraduate
Master Degree
Technical
Source: MEC (2010)
Master/Doctor Degree
Brazilian Forests at a glance

138
Number of graduates in Forest Engineering Undergraduate and Postgraduate courses
Courses 2005 2006 2007 2008 2009 2010 2011Graduation 679 882 937 893 1,109 1,134 1,419
Master´s Degree 181 200 177 199 249 239 362
Doctor´s Degree 63 49 71 73 74 103 83
Total 923 1,131 1,185 1,165 1,432 1,476 1,864
Source: INEP (2011, 2012); CAPES (2012).
In the 2005-2011 period there was a relevant increase in the number of graduates in Forest Engineering and Forest Sciences in Brazil.
Undergraduates and Postgraduates

Brazilian Forests in a nutshell2013Florestas do Brasil em resumo2012
139
Number of Forest Engineering and Forest Sciences postgraduates, per yearSource: CAPES (2012).
Number of Forest Engineering graduates, per year and genderSource: INEP (2011, 2012).
Ano Feminino Masculino1990 49 1181991 73 1581992 90 1401993 90 1431994 79 1821995 104 1551996 81 1631997 110 1731998 129 1871999 150 2392000 128 2052001 170 2492002 180 2672003 225 3532004 236 3402005 272 4072006 341 5412007 392 5452008 345 5482009 441 668 Número de formados em cursos de graduação em Engenharia Florestal, por ano, por gênenro
2010 465 6692011 610 809
Fonte: INEP (2011, 2012).
0
200
400
600
800
1000
1200
1400
1600
1990
1991
1992
1993
1994
1995
1996
1997
1998
1999
2000
2001
2002
2003
2004
2005
2006
2007
2008
2009
2010
2011
Masculino Feminino
Núm
ero
de fo
rman
do e
m e
ngen
hari
a flo
rest
al
Cursos 2005 2006 2007 2008 2009 2010 2011Pós-Graduação (mestrado) 181 200 177 199 249 239 362Pós-graduação (doutorado) 63 49 71 73 74 103 83
Fonte: CAPES (2012).
Número de graduados em programas de pós-graduação em Engenharia Florestal e Ciência Florestal, por ano
0
50
100
150
200
250
300
350
400
2005 2006 2007 2008 2009 2010 2011
Pós-‐Graduação (mestrado) Pós-‐graduação (doutorado)
Núm
ero de
pós-‐
graduado
s N
umbe
r of
pos
tgra
duat
es
2013
Num
ber
of g
radu
ates
Men
Master´s Degree Doctor´s Degree
Women
Brazilian Forests at a glance

140
Technical Courses by Region of Brazil (2011) (%)Source: Brasil. MEC. (2012).
Technical Education
Forest-related technical education in Brazil is divided into 4 types of expertises: Indigenous Agroforestry Agent, Agroforestry Technician, Pulp and Paper Technician, and Forest Technician. These courses are distributed in all regions of the country.
Quantity of Technical Courses by Expertise (2011)
SpecialityNumber of Courses
North Northeast Midwest Southeast South Total
Indigenous Agroforestry Agent 1 0 0 0 0 1
Agroforestry Technician 1 0 0 0 0 1Pulp and Paper Technician 0 1 1 1 4 7
Forest Technician 5 1 4 7 4 21Total 7 2 5 8 8 30Source: Brasil. MEC. (2012).

Brazilian Forests in a nutshell2013Florestas do Brasil em resumo2012
Florestabilidade Project Florestabilidade is an education project for forest management, created by Fundação Roberto Marinho in partnership with Fundo Vale and the Brazilian Forest Service. It aims at raising young people´s awareness to an important mission: to become the managers of the largest rainforest on the planet.
The content of Florestabilidade encompasses the techniques of forest management for timber products, non-timber products and environmental services. The extractivist, riverine and indigenous populations and the forest technicians are the educators that tell the stories about the opportunities and challenges of those who live and work in the Amazon.
All didactic material of the project can be found on the website: www.florestabilidade.org.br (access Aulas and Biblioteca); as well as information on the used teaching methodology and also about how Florestabilidade comes to public school teachers and rural extension professionals in the Amazon.
In the years 2012 and 2013, the Florestabilidade will reach the States of Acre, Amapá, Amazonas and Pará, in partnership with the Departments of Education and the Environmental and Rural Extension Agencies, such as the Technical Assistance and Rural Extension Agency of Pará (EMATER-PA).
About 2,000 teachers and 100 rural extension technicians will be trained to use the teaching materials with students and communities in the Amazon (Roberto Marinho Foundation, 2012).
More information at: www.florestabilidade.org.br.
141
2013Brazilian Forests at a glance

142

143
Brazilian Forests in a nutshell2013
orest ResearchF

144
Main Research Centers
Forest Products Laboratory - LPF It is a Specialized Center of the Brazilian Forest Service that has been functioning since 1973 developing wood and other forest products technologies, generating and transferring knowledge to contribute to sustainable development in the forest sector. The lines of research are: • Sustainability of tropical forests resources, especially in the
Amazon; • Multiple use of planted forests; and, • Agroforestry products and environment.
Brazilian Enterprise for Agricultural Research - EmbrapaFounded in 1973, under the Ministry of Agriculture, Livestock and Food Supply, its mission is to facilitate solutions for the sustainable development in rural areas. Embrapa has specialized research centers, and among these there are research centers focused on forest issues: • Embrapa Forests - Curitiba/PR • Embrapa Eastern Amazon - Belém/PA • Embrapa Western Amazon - Manaus/AM • Embrapa Amapá - Macapá/AP • Embrapa Roraima - Boa Vista/RR • Embrapa Rondônia - Porto Velho/RO • Embrapa Acre - Rio Branco/AC
National Institute of Amazonian Research - INPAConducts scientific studies on the physical environment and livelihoods of the Amazon region to promote human welfare and regional socio-economic development.

145
Brazilian Forests in a nutshell2013
Currently, INPA is a global reference in Tropical Biology, with the following lines of research in the forest area: • Forest products; and, • Tropical silviculture.
Institute for Technological Research of the State of São Paulo - IPT The Institute for Technological Research of the State of São Paulo hosts the Technology Center of Forest Resources (CT-Floresta), with specialized laboratories in the field of wood technology. The lines of research of IPT in the forest area are: • Wood and derived products; • Wood Preservation and Biodeterioration of Materials; • Pulp and Paper; and, • Sustainability of Forest Resources.
Paraense Emilio Goeldi Museum - MPEG It is a research institution under the Ministry of Science, Technology and Innovation. Its main mission is to conduct research, promote scientific innovation, train human resources, conserve collections and spread knowledge in the areas of natural sciences and humanities related to the Amazon. The main lines of research in the forest area are: plant systematics, economic botany, landscape ecology, plant ecology, conservation and management.
2013Brazilian Forests at a glance

146
Num
ber
of re
sear
cher
s per
rese
arch
cen
ter
Res
earc
h C
ente
rsQ
uant
ity
of P
rofe
ssio
nals
(200
8/20
12)
Post
D
octo
rate
Doc
tor´
s D
egre
eM
aste
r´s
Deg
ree
Spec
ializ
atio
nB
ache
lor
Tota
l
Fore
st Pr
oduc
ts La
bora
tory
(LPF
)/SF
B (2
012)
112
43
1030
Embr
apa
(For
ests,
W
este
rn A
maz
on,
Rond
ônia
, Acr
e,
Rora
ima)
(201
2)
ND
*88
10N
D*
ND
*98
Inpa
(Silv
icul
ture
an
d Fo
rest
Prod
ucts)
(201
2)2
287
1N
D*
38
IPT
(Woo
d Te
chno
logy
) (20
08)
ND
*4
1235
ND
*51
Para
ense
Em
ilio
Goe
ldi M
useu
m
(MPE
G) (
2008
)N
D*
34
ND
*N
D*
7
Tota
l3
135
3739
1022
4
Not
e: *
Not
dec
lare
d

Brazilian Forests in a nutshell2013Florestas do Brasil em resumo2012
147
Investment in forest research by CNPq per line of research * (2012)(%)Sourcee: CNPq (2013).* Reported by researchers
Forest Research Financing
Number of researchers that received funding from CNPq for forest research, per degree and gender (2012)
Degree GenderFemale Male
Doctor´s Degree 18 24Master´s Degree 56 59Post Doctorate 6 5Total 80 88Source: CNPq (2013).
2013Brazilian Forests at a glance

148
Investment by CNPq by line of research (R$)Line of Research 2010 2011 2012
Nature Conservation 662,682 610,710 415,986
Forest Biomass Energy 73,370 165,698 170,764
Forest Management 588,822 393,471 323,314Silviculture 527,501 320,344 307,950Forest Techniques and Operations 51,528 26,570 --
Forest Products Technology and Use 289,834 277,532 200,182
Not Declared 1,450,926 2,335,266 2,661,088Total 3,644,663 4,129,591 4,079,284Source: CNPq (2013).
Investment by CNPq in forest research by State (2012) (R$)Source: CNPq (2013).
Inve
stm
ent (
R$)

149
Brazilian Forests in a nutshell2013Main Brazilian Journals on Forest
Sciences
The main scientific journals that publish articles related to forest services in Brazil are:
• Revista Acta Amazônica - INPA - http://acta.inpa.gov.br/
• Revista Cerne - UFLA - http://www.dcf.ufla.br/cerne/ • Revista Árvore - UFV - http://revistas.cpd.ufv.br/
arvoreweb/index.php • Scientia Forestalis - IPEF - http://www.ipef.br/
publicacoes/scientia/ • Revista Floresta - FUPEF - http://www.floresta.ufpr.br/
revista_floresta/index.html • Floresta e Ambiente - UFRRJ - http://www.floram.org/ • Revista de Ciências Agrárias - UFRA - http://www.
portal.ufra.edu.br/index.php/Table/Revista-de-Ciencias-Agrarias/
• Ciência Florestal - UFSM - http://cascavel.ufsm.br/revistas/ojs-2.2.2/index.php/cienciaflorestal/index
• Revista Brasil Florestal - http://www.ibama.gov.br/ojs/index.php/braflor
• Pesquisa Florestal Brasileira - Embrapa Florestas - http://www.cnpf.embrapa.br/pfb/index.php/pfb
2013Brazilian Forests at a glance

150
Brazilian Forests in a nutshell2013Florestas do Brasil em resumo2013
151
nternational Forest Data Comparison
I

Global comparative of forest area (2010)*Country Forest area (1,000 ha)1 Russia 809,0902 Brazil 519,5223 Canada 310,1344 United States 304,0225 China 206,8616 Congo 154,1357 Australia 149,3008 Indonesia 94,4329 Sudan 69,94910 India 68,43411 Peru 67,992Note: *The estimate of the total area of forests in Brazil in November 2010 was 516,586,045 hectares. Source: FAO (2010).
Global comparative of carbon stock in living forest biomass (2010)Country Carbon stock (million ton.)1 Brazil 62,6072 Russia 32,5003 Democratic Republic of Congo 19,639
4 United States 19,3085 Canada 13,9086 Indonesia 13,0177 Peru 8,5608 Columbia 6,8059 China 6,20310 Bolivia 4,44211 Angola 4,385Source: FAO (2010).
152
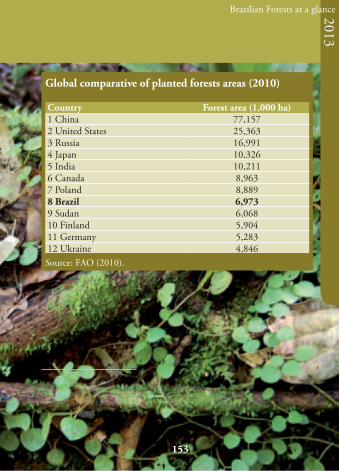
Brazilian Forests in a nutshell2013Florestas do Brasil em resumo2012
Global comparative of planted forests areas (2010)
Country Forest area (1,000 ha)1 China 77,1572 United States 25,3633 Russia 16,9914 Japan 10,3265 India 10,2116 Canada 8,9637 Poland 8,8898 Brazil 6,9739 Sudan 6,06810 Finland 5,90411 Germany 5,28312 Ukraine 4,846Source: FAO (2010).
153
2013Brazilian Forests at a glance

154
ASSOCIAÇÃO BRASILEIRA DA INDÚSTRIA DE PAPÉIS DE MADEIRA (ABIPA). Números [produção madeireira no Brasil]. São Paulo, 2012. Disponível em: <http://www.abipa.org.br/numeros.php>. Acesso em: 22 out. 2012.
ASSOCIAÇÃO BRASILEIRA DE CELULOSE E PAPEL (BRACELPA). Relatório Estatístico 2011/2012. 2012. Disponível em: <http://www.bracelpa.org.br/bra2/sites/default/files/estatisticas/rel2012.pdf>. Acesso em: 27 nov. 2012.
ASSOCIAÇÃO BRASILEIRA DE PRODUTORES DE FLORESTAS PLANTADAS (ABRAF). Anuário estatístico da ABRAF 2013 ano base 2012. Brasília, DF, 2013. 146 p.
BRASIL. Casa Civil. Decreto nº 4.722, de 05 de junho de 2003. Diário Oficial [da] República Federativa do Brasil, Brasília, 06 jun. 2003. Seção 1, p. 12.
BRASIL. Casa Civil. Decreto nº 5.975, de 30 de novembro de 2006. Diário Oficial [da] República Federativa do Brasil, Brasília, 01 dez. 2006. Seção 1, p. 1.
BRASIL. Casa Civil. Decreto nº 6.874, de 05 de junho de 2009. Diário Oficial [da] República Federativa do Brasil, Brasília, 08 jun. 2009. Seção 1, p. 1.
BRASIL. Casa Civil. Decreto nº 7.167, de 05 de maio de 2010. Diário Oficial [da] República Federativa do Brasil, Brasília, 06 maio 2010. Seção 1, p. 4.
BRASIL. Casa Civil. Decreto nº 7.747, de 5 de junho de 2012. Diário Oficial [da] República Federativa do Brasil, Brasília, 06 junho. 2012. Seção 1, p. 9-11.
BRASIL. Casa Civil. Decreto nº 45.113, de 05 de junho de 2009. Minas Gerais Diário do Executivo, Belo Horizonte, 06 jun. 2009. Col. 2, p. 1.
BRASIL. Casa Civil. Grupo Permanente de Trabalho Interministerial para a Redução dos Índices de Desmatamento da Amazônia Legal. Plano de ação para a prevenção e controle do desmatamento na Amazônia Legal [PPCDAM]. Brasília, 2004. 156 p. Disponível em: <http://www.planalto.gov.br/casacivil/desmat.pdf> Acesso em: 13 out. 2010.
BRASIL. Casa Civil. Lei nº 9.985, de 18 julho 2000. Diário Oficial [da] República Federativa do Brasil, Brasília, 19 jul. 2000. Seção 1, p.45-48.
BRASIL. Casa Civil. Lei nº 11.284, de 02 de março de 2006. Diário Oficial [da] República Federativa do Brasil, Brasília, 03 mar. 2006. Seção 1, p. 1-9.
BRASIL. Casa Civil. Lei nº 12.651, de 02 de março de 2006. Diário Oficial [da] República Federativa do Brasil, Brasília, 28 maio. 2012. Seção 1, p. 1-8.
BRASIL. Comitê Interministerial sobre Mudança do Clima (CIM). Plano nacional sobre mudança do clima (PNMC): versão para consulta pública. Brasília, 2008. 154 p. Disponível em: <http://www.mma.gov.br/estruturas/169/_arquivos/169_29092008073244.pdf>. Acesso em: 01 out. 2010.
BRASIL. Ministério da Educação e Cultura (MEC). Sistema nacional de informações da educação profissional e tecnológica. 2012. Disponível em: <http://sistec.mec.gov.br/
References
155
Brazilian Forests in a nutshell2013
consultapublicaunidadeensino>. Acesso em: 12 nov. 2012.
BRASIL. Ministério de Minas e Energia (MME). Balanço energético nacional 2012 – ano base 2011: relatório final. Brasília, 2012. Disponível em: <http://www.mme.gov.br/mme/galerias/arquivos/publicacoes/BEN/2-BEN-Ano_Base/1-BEN_Portugues_-_Inglxs-Completo.pdf>. Acesso em: 10 dez. 2012.
BRASIL. Ministério do Desenvolvimento, Indústria e Comércio Exterior (MDIC). [Exportação dos principais produtos florestais brasileiro] In: Aliceweb. Brasília, 2012. Disponível em: <http://aliceweb.desenvolvimento.gov.br/>. Acesso em: 22 nov. 2012.
BRASIL. Ministério do Meio Ambiente. Biodiversidade do cerrado e pantanal: áreas e ações prioritárias para conservação. Brasília: MMA, 2007a. 540 p., il. color. (Série Biodiversidade, 17).
BRASIL. Ministério do Meio Ambiente (MMA). Fundo Amazônia. 2012. Disponível em: <http://www.fundoamazonia.gov.br>. Acesso em: 07 dez. 2012.
BRASIL. Ministério do Meio Ambiente (MMA). Instrução Normativa n° 6, de 23 de setembro de 2008. Diário Oficial [da] República Federativa do Brasil, Brasília, DF, 24 set. 2008. Seção 1, p. 75-83.
BRASIL. Ministério do Meio Ambiente (MMA). Mapas de cobertura vegetal dos biomas brasileiros [2007]. Brasília, 2007b. Disponível em: <http://www.mma.gov.br/portalbio>. Acesso em: 22 out. 2010b.
BRASIL. Ministério do Meio Ambiente (MMA). Plano de ação para prevenção e controle do desmatamento e das queimadas no cerrado: PPCerrado. Brasília, 2009. 152 p. Disponível em: <http://www.mma.gov.br/estruturas/182/_arquivos/ppcerrado_consultapublica_182.pdf>. Acesso em: 01 out. 2010.
BRASIL. Ministério do Meio Ambiente (MMA). Quarto relatório nacional l para a convenção sobre diversidade biológica: Brasil. Brasília, 2011. 247 p. (Biodiversidade, 38).
BRASIL. Ministério do Meio Ambiente (MMA). Secretaria de Biodiversidade e Florestas (SBF). Cadastro nacional de unidades de conservação (CNUC). Brasília, 2012. Disponível em: <http://www.mma.gov.br/areas-protegidas/cadastro-nacional-de-ucs/dados-consolidados>. Acesso em: 22 out. 2012.
BRASIL. Ministério do Meio Ambiente (MMA). Secretaria de Biodiversidade e Florestas (SBF). Relatório de avanço da consolidação da gestão das unidades de conservação apoiadas pelo Programa Arpa2010 – 2011. Brasília, DF, 2011b. Disponível em: <http://www.programaarpa.org.br/wp-content/uploads/2012/11/Relat%C3%B3rio-de-Progresso-2010-2011.pdf>. Acesso em: 08 nov. 2012.
BRASIL. Ministério do Meio Ambiente (MMA). Secretaria de Extrativismo e Desenvolvimento Rural Sustentável(SEDR). Bolsa Verde. Brasília, DF, 2011c. Disponível em: <http://www.mma.gov.br/publicacoes/desenvolvimento-rural/category/140-bolsa-verde?download=872:bolsa-verde>. Acesso em: 08 nov. 2012.
2013Brazilian Forests at a glance

156
BRASIL. Ministério do Trabalho e Emprego (MTE). Programa de Disseminação de Estatísticas do Trabalho (PDET): Bases Estatísticas RAIS/CAGED. Brasília, 2012. Disponível em: <http://sgt.caged.gov.br/>. Acesso em: 22 mar. 2012.
CONSELHO NACIONAL DE CONHECIMENTO CIENTÍFICO E TECNOLÓGICO (CNPQ). Financiamento para capacitação de recursos humanos para pesquisa e inovação. [mensagem pessoal]. 2013. Mensagem recebida por <[email protected]> em jan. 2013.
COORDENAÇÃO DE APERFEIÇOAMENTO DE PESSOAL DE NÍVEL SUPERIOR (CAPES). Estatísticas. Brasília, 2012. Disponível em: <http://geocapes.capes.gov.br/geocapesds/>. Acesso em: 22 out. 2012.
FOOD AND AGRICULTURE ORGANIZATION OF THE UNITED NATIONS (FAO).Global forest resources assessment FRA 2005: terms and definitions. Rome, 2004. 34 p. Disponível em: <http://www.fao.org/forestry/media/7797/1/0/>. Acessoem: 10 jun. 2010.
FOOD AND AGRICULTURE ORGANIZATION OF THE UNITED NATIONS (FAO).Global forest resources assessment FRA 2010. Rome: FAO, 2010. 340 p.
FOREST STEWARDSHIP COUNCIL (FSC). FSC Certificate Database. 2012. Disponível em: <http://br.fsc.org/fatos-e-nmeros.188.htm>. Acesso em: 04 dez 2012.
FUNDAÇÃO NACIONAL DO ÍNDIO (FUNAI). Situação fundiária indígena. Brasília, 2012. Disponível em: <http://mapas.funai.gov.br/dados/pdf/BRASIL_11_2012.pdf >. Acesso em: 28 nov. 2012.
FUNDAÇÃO ROBERTO MARINHO. Florestabilidade. 2012 Disponível em: <http://www.frm.org.br/>. Acesso em: 04 dez. 2012.
FUNDAÇÃO SOS MATA ATLÂNTICA; INSTITUTO NACIONAL DE PESQUISAS ESPACIAIS (INPE). Atlas dos remanescentes florestais da Mata Atlântica: período 2005-2008. São Paulo, 2009. Disponível em: <http://mapas.sosma.org.br/site_media/download/atlas%20mata%20atlantica-relatorio2005-2008.pdf>. Acesso em: 22 jul. 2010.
FUNDAÇÃO SOS MATA ATLÂNTICA; INSTITUTO NACIONAL DE PESQUISAS ESPACIAIS (INPE). Atlas dos remanescentes florestais da Mata Atlântica: período 2008-2010, dados parciais dos estados avaliados até maio de 2010. São Paulo, 2010. Disponível em: <http://mapas.sosma.org.br/site_media/download/atlas-relatorio2008-2010parcial.pdf>. Acesso em: 22 jul. 2010.
FUNDAÇÃO SOS MATA ATLÂNTICA; INSTITUTO NACIONAL DE PESQUISAS ESPACIAIS (INPE). Atlas dos remanescentes florestais da Mata Atlântica: período 2010-2011, dados parciais dos estados avaliados até maio de 2011. São Paulo, 2012. Disponível em: <http://www.sosma.org.br/5690/frente-ambientalista-debateu-atlas-da-mata-atlantica/>. Acesso em: 22 jul. 2010.
GARIGLIO, M. A.(Org) et al. Uso sustentável e conservação dos recursos florestais da caatinga. Brasília: SFB, 2010.
INSTITUTO BRASILEIRO DE GEOGRAFIA E ESTATÍSTICA (IBGE). Censo agropecuário 2006. Rio de Janeiro, 2007a. 777 p.
INSTITUTO BRASILEIRO DE GEOGRAFIA E ESTATÍSTICA (IBGE). Mapa da Vegetação do Brasil. Rio de Janeiro, 2004a. Disponível em: <http://www.ibge.gov.br/home/presidencia/

Brazilian Forests in a nutshell20132013
157
noticias/noticia_impressao.php?id_noticia=169>. Acesso em: 19 out. 2010.
INSTITUTO BRASILEIRO DE GEOGRAFIA E ESTATÍSTICA (IBGE). Mapa de biomas do Brasil. Brasília: MMA; IBAMA, 2004b. Escala 1: 5.000.000.
INSTITUTO BRASILEIRO DE GEOGRAFIA E ESTATÍSTICA (IBGE). Pesquisa agrícola municipal 2007. Rio de Janeiro, v. 38, 2011.
INSTITUTO BRASILEIRO DE GEOGRAFIA E ESTATÍSTICA (IBGE). Pesquisa industrial anual 2007. Rio de Janeiro, v. 26, n. 2, 2009b.
INSTITUTO BRASILEIRO DE GEOGRAFIA E ESTATÍSTICA (IBGE). Pesquisa industrial anual 2008. Rio de Janeiro, v. 27, n. 2, 2010.
INSTITUTO BRASILEIRO DE GEOGRAFIA E ESTATÍSTICA (IBGE). Pesquisa industrial anual 2009. Rio de Janeiro, v.28, n. 2, 2011a.
INSTITUTO BRASILEIRO DE GEOGRAFIA E ESTATÍSTICA (IBGE). Pesquisa industrial anual 2010. Rio de Janeiro, v.29, n. 2, 2012.
INSTITUTO BRASILEIRO DE GEOGRAFIA E ESTATÍSTICA (IBGE). Produção da extração vegetal e da silvicultura 2007. Rio de Janeiro, v.22, n. 2, 2008.
INSTITUTO BRASILEIRO DE GEOGRAFIA E ESTATÍSTICA (IBGE). Produção da extração vegetal e da silvicultura 2008. Rio de Janeiro, v.23, n. 2, 2009.
INSTITUTO BRASILEIRO DE GEOGRAFIA E ESTATÍSTICA (IBGE). Produção da extração vegetal e da silvicultura 2009. Rio de Janeiro, v.24, n. 2, 2010.
INSTITUTO BRASILEIRO DE GEOGRAFIA E ESTATÍSTICA (IBGE). Produção da extração vegetal e da silvicultura 2010. Rio de Janeiro, v.25, n. 2, 2011.
INSTITUTO BRASILEIRO DE GEOGRAFIA E ESTATÍSTICA (IBGE). Produção da extração vegetal e da silvicultura 2011. Rio de Janeiro, v.26, n. 2, 2012.
INSTITUTO BRASILEIRO DE GEOGRAFIA E ESTATÍSTICA (IBGE). [Desmatamento: definição]. Brasília, 2002. Disponível em: <http://www.ibama.gov.br/desmatamento/home_conceitos.htm>. Acesso em: 17 dez. 2012.
INSTITUTO BRASILEIRO DE GEOGRAFIA E ESTATÍSTICA (IBGE). Sistema IBGE de recuperação automática (SIDRA): banco de dados agregados. Sistema produção da extração vegetal e da silvicultura. Rio de Janeiro, 2011. Disponível em: <http://www.sidra.ibge.gov.br/bda/pesquisas/pevs/default.asp>. Acesso em: 22mar. 2012.
INSTITUTO BRASILEIRO DO MEIO AMBIENTE E DOS RECURSOS NATURAIS RENOVÁVEIS (IBAMA). Centro de Sensoriamento Remoto. Monitoramento do desmatamento nos biomas brasileiros por satélite: monitoramento do bioma Cerrado, 2002 a 2009. Brasília, 2009. Disponível em: < http://siscom.ibama.gov.br/monitorabiomas/>. Acesso em: dez. 2012.
INSTITUTO BRASILEIRO DO MEIO AMBIENTE E DOS RECURSOS NATURAIS RENOVÁVEIS (IBAMA). Dados de focos de calor. Brasília, 2012. Disponível em: <http://www.ibama.gov.br/prevfogo/areas-tematicas/monitoramento/dados-de-focos-de-calor/>. Acesso em: 22 mar. 2012.
Brazilian Forest at a glance

158
INSTITUTO BRASILEIRO DO MEIO AMBIENTE E DOS RECURSOS NATURAIS RENOVÁVEIS (IBAMA). Documento de origem florestal (DOF). Brasília, 2012. [Base de dados]
INSTITUTO CHICO MENDES DE CONSERVAÇÃO DA BIODIVERSIDADE (ICMBio). Dados Gerais das Unidades de Conservação. Brasília, 2012a. Disponível em: <http://www.icmbio.gov.br/portal/images/stories/comunicacao/downloads/planilha_editada.pdf>. Acesso em: 22 mar. 2012.
INSTITUTO NACIONAL DE ESTUDOS E PESQUISAS EDUCACIONAIS ANÍSIO TEIXEIRA (INEP). Censo da educação superior 2010. Brasília, 2011. Disponível em: <http://www.inep.gov.br/superior/censosuperior/default.asp>. Acesso em: 22mar. 2012.
INSTITUTO NACIONAL DE ESTUDOS E PESQUISAS EDUCACIONAIS ANÍSIO TEIXEIRA (INEP). Censo da educação superior 2011: engenharia florestal [mensagem pessoal]. Brasília, 2012. Mensagem recebida por: <[email protected]> em 06 nov. 2012.
INSTITUTO NACIONAL DE METROLOGIA, NORMALIZAÇÃO E QUALIDADE INDUSTRIAL (INMETRO). Certificação florestal (CERFLOR). 2012. Disponível em: < http://www.inmetro.gov.br/qualidade/pdf/empresas-cerflor.pdf >. Acesso em: 04 dez. 2012.
INSTITUTO NACIONAL DE PESQUISAS ESPACIAIS (INPE). DEGRAD: mapeamento da degradação florestal na Amazônia brasileira. 2011. Disponível em: <http://www.obt.inpe.br/degrad/>. Acesso em: 22mar. 2012.
INSTITUTO NACIONAL DE PESQUISAS ESPACIAIS (INPE). Projeto PRODES: monitoramento da floresta amazônica brasileira por satélite. 2012a. Disponível em: <http://www.obt.inpe.br/prodes/>. Acesso em: 22 mar. 2012.
INSTITUTO NACIONAL DE PESQUISAS ESPACIAIS (INPE). Sistema DETER: detecção do desmatamento em tempo real. 2012b. Disponível em: <http://www.obt.inpe.br/deter/index.html>. Acesso em: 22mar. 2012.
MINAS GERAIS. Instituto Estadual de Florestas(IEF). Bolsa verde. Belo Horizonte, 2011. Disponível em: <http://www.ief.mg.gov.br/bolsa-verde>. Acesso em: 08 nov. 2012.
ÓRGÃO ESTADUAL DE MEIO AMBIENTE (Oema). Sistema de controle e transporte de produtos florestais (Sisflora). Estados de Mato Grosso, Pará e Rondônia, 2011. [Base de dados].
SERVIÇO FLORESTAL BRASILEIRO. Cadastro nacional de florestas públicas: atualização ano base 2011. Brasília, 2012. 1 mapa. Escala 1:7.500.000.
SERVIÇO FLORESTAL BRASILEIRO (SFB). Resolução nº4, de 23 de junho de 2008. Diário Oficial [da] República Federativa do Brasil, Brasília, 25 jun. 2008. Seção 1, p.76.
SPAROVEK, G. et al. Brazilian agriculture and environmental legislation: status and future challenges. Environ. Sci. Technol., Washington, DC, v. 44, n. 16, p. 6046-6053, jul. 2010.
WWF. Amazônia viva!: uma década de descobertas, 1990-2009. Brasília, 2010a. 64 p.
WWF. ARPA: Programa Áreas Protegidas da Amazônia. Um novo caminho para conservação da Amazônia. Brasília, 2010b. Disponível em: <http://www.wwf.org.br/informacoes/bliblioteca/?26364/Resultados-da-primeira-fase-do-programa-Arpa-Areas-Protegidas-da-Amazonia>. Acesso em: 05 out. 2010.

Brazilian Forests in a nutshell2013
159159
2013Brazilian Forest at a glance
Brazilian Forest ServiceHeadquarters and Regional Units

160
www.florestal.gov.br
Provided by
Support
Recommended