8/8/2019 Brand Survery
http://slidepdf.com/reader/full/brand-survery 1/20

8/8/2019 Brand Survery
http://slidepdf.com/reader/full/brand-survery 2/20
2
communications, entertainment, education and services. Nevertheless, the forecasted
tendency of consuming expense for the category of clothing appears according to is ascendant
and at least for the last decade, to touch upon a percentage almost equal to what had been in
the late 80¶s. This development is mainly the result of a continuous increase in the national
income in this decade and an increase improvement in the naturally available income of
households.
The present research studies the consumer behavior and the satisfaction of the
modern Greek consumers. It researches into the views of young persons aged 18-27 years as
for their preferences in clothing and the factors that influence their purchasing behavior. The
study and analysis of the consumer as deciding is also remarkable. Emphasis is given in the
strategic repercussions of the psychological and social influence that the consumer undergoes
during the process of decision-making. Finally, an equally important aim is the examination
of models of consumer behavior. Subjects that should be covered include: influence of
motives in the behavior of the consumer, decision-making, elaboration of information,
perceptions, concentration in the brand name of product, product¶s marketing mix,
measurement and change of attitudes, social and cultural effects in the behavior of the
consumer, models of consumer behavior, applications in the apportionment of the market, the
placement and the promotion of products.
2. Literature review
2.1. Consumer Behaviour.
Definition: The official definition of consumer behaviour is given by the American
Marketing Association as: the dynamic interaction of the affect and cognition, the
behaviour and environment through which people carry out transactions in their life.
(Bennett 1995, page 59).
Consumer behaviour reflects consumers¶ decisions with respect to:
y
the acquisition, consumption, and dispositiony of goods and services, time, and ideas
y By (human) decision making (over time).
(Prof. Dr. Maggie Geuens, Consumer Behaviour, 1999)

8/8/2019 Brand Survery
http://slidepdf.com/reader/full/brand-survery 3/20
3
C recei es sti li which affect on his consuming behaviour. This stimuli
comes from:
y The f inancial environment (favourable or ominous f inancial conditions).
y The political environment (smoothl or foggy political setting).
y The technological environment (technological progress or recession).
y The company¶s marketing mi as for the product the pr ice, the place and the
promotion. (E.g. a television adver tising spot or a handing-over in the pr ice of
product).
Fi -S M l i
(Kotler 1993, p. 182)
This model implies that consumers pass through all f ive stages in buying a product.
This may be the case in high-involving purchases. In low-involvement purchases,
consumers may sk i p or reverse some of these stages. This model showsthe full range
of considerations that ar ise when a consumer face a highly involving new purchase.
Through the studying of consumer behaviour some fundamental questions comesabroad such as:
y Why does consumer buy a product?
y How does consumer buy the product?
y How does consumes or use the product?
y How does consumer develop a product af ter buying it?
y How consumer exempted from the product (or his pack ing) af ter its
usage?

8/8/2019 Brand Survery
http://slidepdf.com/reader/full/brand-survery 4/20
4
(Prof. Dr. Maggie Geuens, Consumer Behaviour, 1999)
Those questions f ind answers through the study of the factors that inf luences
consumer¶s behaviour. Those factors are separated in four categor ies: social, cultural,
demographical and psychological. Those factors and its categor ies are the following:
1. CULTURAL FACTORS
Culture: Culture (or civili ation) is the highest entity of personal identif ication with
the society. These entities were in the past the nations and could be in the future the
civili ations (Western, Muslim,Hindi, Chinese). Humane behaviour is largely
learned. The growing child acquires a set of values, perceptions, preferences and
behaviours through a process of sociali ation involving the family and other education institutions.
Subculture: Each culture consists of smaller subcultures that provide more specif ic
identif ication and sociali ation for its members. We can distinguish several
subcultures in the different countr ies.We can distinguish:
National groups (immigrants, Europeans and non-Europeans)
R eligious groups (Catholics, Protestants, Or thodox, Muslims, and Jews)
Geographical areas (R egions, regional identity)
2. SO L FACTORS
Social class: ³Social classes are relatively homogeneous and enduring divisions in a
society, which are hierarchically ordered and whose members share similar values
interests and behaviour´ Social classes show distinct product and brand preferences

8/8/2019 Brand Survery
http://slidepdf.com/reader/full/brand-survery 5/20
5
i ¡ ¢ £
¤
¥ ¦ § ¥ ¡ ¥ ¡ £ l ̈ t ¤
i ©
¤
¨ § f ¢ ¦ i¡
¤
i ©
l § i¡ ¢ ¦ § ¥ £ ti iti§ ¡
¥ ¢ t ¨ ̈
il § ¡
¥
f ¨ ̈
¥
§ § ¦ ¥ © § ¡ . (KOTLER 2000
. 161)
Soci l rol and st at ses: A person participates in many groups throughout life such
as family, clubs, and organizations. The person¶s position in each group can bedefined in terms of role and status. A role consists of the activities that a person is
expected to perform according to the persons around him or her. Each role carries a
status reflecting the esteem accorded to it by society. Roles and statuses are at the
same time dynamic and static phenomena:
o they change with the economic and social progress (land owner, entrepreneur)
o People with higher status like to remain their position.
People choose products that communicate their role and status in society. But status
symbols vary for social classes and also geographically.
Reference group: ³A person¶s reference groups consist of all social groups that have
a direct (face to face) or indirect influence on the person¶s attitudes or behaviour´
(KOTLER, 2000, p. 163-164). We distinguish different reference groups:
o Membership groups are the groups to which the person belongs.
o Non-membership groups are the groups to which a person not belongs, but
which influence the attitudes and behaviour of the person.
o Aspiration groups are groups to which a person would like to belong.
o Dissociate groups are groups whose values or behaviour are rejected.
O pi ni on l eaders: Individuals which constitute source of information for specific
products and brands, and they influence consumer decisions (opinion follower).
3. PSY CH OLOGI CA L FAC O R S
Personality: The total internal characteristics of an individual that determines the way
how he reacts. (E.g. self-monitoring, self-concept, sociability, etc).
Sel f-concept: The picture or the perception that each individual has for his exterior
appearance, his mental faculties, his character and generally speaking what concerns
the individual as a social being.

8/8/2019 Brand Survery
http://slidepdf.com/reader/full/brand-survery 6/20
6
Li festyl e: It expresses the values that an individual has in their life. It constitutes
important variable of market segmentation.
M otivati on .
Percepti on: The process, with which an individual selects, organises and it interprets
incomes of information with an aim to create a reasonable picture for the world.
Beli efs and attit udes: The total knowledge from advertises or other promotion
energies, but also personal experiences, that the individual - consumer acquires and
maintains in his memory. Configuration of specific beliefs and attitudes for specific
products, specific brands, specific retailers, even though for specific production
countries.
4 . PE R S ON A L FAC ! O R S .
A ge and li fe-c ycl e st age: People buy different goods and services over their lifetime.
They eat baby food in the early years, most foods in the growing and maturing years,
and special diets in the later years.
Li festyl e: People coming from the same subculture, social class, occupation but may
lead different lifestyles. A person¶s lifestyle in the person¶s pattern of living in the
world as expressed in the persons activities, interests, and opinions. Lifestyle portrays
the ³whole person´ interacting with his or her environment.
Occupati on: A person¶s consumption pattern is also influenced by his or her
occupation. A white-collar worker will buy other clothing and food as a blue-collar
worker.
Economi c ci rcumst ances consist of their:
o spendable income
o savings and assets
o borrowing power
o Attitude toward spending and saving.

8/8/2019 Brand Survery
http://slidepdf.com/reader/full/brand-survery 7/20
7
To sum up, we can conclude that consumer¶s behaviour in interaction with the factors
that inf luenced it can be attr i buted concisely with the following diagram:
2.2 Customer S tisfaction.
R esearchers def ine consumer satisfaction in var ious ways (see Table 1). Some of the
def initions provided in the consumer satisfaction literature are fundamentally inconsistent
with one another. In other cases, the def initions have over lapping components but are
par tially inconsistent.When examined as a whole, three general components can be identif ied
in extant def initions: 1) consumer satisfaction is a response (emotional or cognitive); 2) the
response per tains to a par ticular focus (expectations, product, consumption exper ience, etc.);
and 3) the response occurs at a par ticular time (af ter consumption, af ter choice, based on
accumulated exper ience, etc). As can be seen by examining Table 1, these three general
categor ies capture the essence of all the def initions presented. As expected, existing

8/8/2019 Brand Survery
http://slidepdf.com/reader/full/brand-survery 8/20
8
definitions are inconsistent in the specifics associated with the type, focus and timing of the
satisfaction response.
TABLE 1
Conceptual and perational Definitions in Consumer atisfaction Literature
Tse andWilton1988
The consumer¶s response to theevaluation of the perceived discrepancy between prior expectations (or somenorm of performance) and the actual
performance of the product as perceived after its consumption (p.
204).
Responseto the
evaluation
Perceiveddiscrepancy between
prior expectations (or some norm of
performance) and theactual performance of
the product
Postconsump
tion
Cadotte,Woodruff
andJenkins
1987
Conceptualized as a feeling developedfrom an evaluation of the use
experience (p. 305).
Feelingdevelopedfrom an
evaluation
Use experienceDuring
consumption
Westbrook 1987
Global evaluative judgment about product usage/consumption (p. 260)
Also cited Hunt (1977).
Globalevaluative judgment
Productusage/consumption
Duringconsump
tion
" ource Conceptual Definition # esponse Focus Time
Oliver 1997
The consumer¶s fulfilment response. Itis a judgment that a product or servicefeature, or the product or service itself,
provided (or is providing) a pleasurablelevel of consumption-related fulfilment,
including levels of under- or over fulfilment (p. 13)
Fulfilmentresponse/judg
ment
Product or service
Duringconsump
tion
Halstead,Hartman,
andSchmidt
1994
A transaction-specific affectiveresponse resulting from the customer¶scomparison of product performance tosome prepurchase standard (e.g., Hunt
1977; Oliver 1989) (p. 122).
Affectiveresponse
Product performancecompared to
some prepurchase
standard
Duringor after
consumption
Manoand
Oliver 1993
(Product satisfaction) is an attitude -like post consumption evaluative
judgment (Hunt 1977) varying alongthe hedonic continuum (Oliver 1989; Westbrook and Oliver 1991) (p. 454).
Attitude -evaluative judgment
Varying alongthe hedoniccontinuum
ProductPost
consumption
Fornell1992
An overall post purchase evaluation(p.11).
Overallevaluation
Post purchase perceived product
performancecompared with prepurchaseexpectations
Post purchase
Westbroo
k andOliver 1991
A post choice evaluative judgmentconcerning a specific purchaseselection (Day 1984) (p. 84).
Evaluative judgment
Specific purchaseselection
Postchoice
Oliver and Swan
1989
No conceptual definition. (With thesalesperson) a function of fairness,
preference, and disconfirmation (pp.28-29).
SalespersonDuring
purchase
8/8/2019 Brand Survery
http://slidepdf.com/reader/full/brand-survery 9/20
9
LaBarber a and
Mazursk y 1983
Post purchase evaluation. CitedOliver¶s (1981) definition: An
evaluation of the surprise inherent in a product acquisition and/or consumption
experience (p. 394).
Evaluation Surprise
Post purchaseProductacquisiti
onand/or
consump
tionexperience
Westbrook andReilly1983
An emotional response to theexperiences provided by and associated
with particular products or services purchased, retail outlets, or even molar patterns of behaviour such as shopping
and buyer behaviour, as well as theoverall marketplace (p. 256). An
emotional response triggered by acognitive evaluative process in whichthe perceptions of (or beliefs about) an
object, action, or condition arecompared to one¶s values (or needs,wants, desires) (p. 258).
Emotionalresponse
Experiences provided by and associated
with particular products or services
purchased, retailoutlets, or even molar patterns of behaviour such as shopping and
buyer behaviour Perceptions of (or beliefs about) an
object, action, or condition arecompared to one¶s
values
Postpurchase
Churchilland
Surprenant 1982
Conceptually, an outcome of purchaseand use resulting from the buyer¶s
comparison of the rewards and costs of the purchase relative to anticipated
consequences. Operationally, similar toattitude in that it can be assessed as a
summation of satisfactions with variousattributes (p. 493).
Outcome
Comparison of therewards and costs of the purchase relative
to anticipatedconsequences
Impliesafter
purchaseand use
Oliver 1981
An evaluation of the surprise inherentin a product acquisition and/or
consumption experience. In essence,the summary psychological stateresulting when the emotion
surrounding disconfirmed expectationsis coupled with the consumer¶s prior
feelings about the consumptionexperience (p. 27).
EvaluationSummary psychologi
cal stateEmotion
SurpriseDisconfirmedexpectations coupledwith the consumer¶s
prior feelings
Productacquisiti
onand/or
consumption
experience
Swan,Trawick
andCarroll1980
A conscious evaluation or cognitive judgment that the product has
performed relatively well or poorly or that the product was suitable or
unsuitable for its use/purpose. Another dimension of satisfaction involves
affect of feelings toward the product (p.17).
Consciousevaluation
or cognitive
judgmentAnother
dimensioninvolvesaffect of feelings
Product has performed relativelywell or poorly or that
the product wassuitable or unsuitable
for its use/purpose
Toward the product
Duringor after
consumption
Westbrook 1980
Refers to the favourability of theindividual¶s subjective evaluation of
the various outcomes and experiencesassociated with using or consuming it
(product) (Hunt 1977) (p. 49).
Favourability of the
individual¶s
subjectiveevaluation
Outcomes andexperiences
Duringconsump
tion

8/8/2019 Brand Survery
http://slidepdf.com/reader/full/brand-survery 10/20
10
Customer satisfaction has three stages:
1. The pre-sales stage where there are the expectations for the product, the profits, the
price and the availability of product.2. The sales stage when customer trays the environment, the product, the type of
service, the delivery, the quality and the redress from the market.
3. The after-sales stage when customer expects the support or the advices, the
replacement of product or the return of sum, repairs and processes of charges.
(Churchill and Suprenant, 1982).
As concluded by the literature review and validated by the group and personal
interview data, there appears to be three essential components of consumer
satisfaction:
1. Summary affective response which varies in intensity;
2. Satisfaction focus around product choice, purchase and consumption; and
3. Time of determination which varies by situation, but is generally limited induration. (Giese and Cote / Defining Consumer Satisfaction, 2002)
So consumer sati s f action i s:
A summar y affective response of var yi ng i nt ensity . T $
e exact t % & e o f a ff ecti' e
response and t $
e l evel o f int ensit % lik el % t o be exper ienced must be explicitl %
de fined by a resear cher depend ing on t he cont ext o f int erest.
W it h a ti me-speci f i c poi nt of det ermi nati on and li mit ed durati on . T he resear cher
shoul d sel ect t he point o f det ermination most rel evant f or t he resear ch questions
and identif y t he lik el y duration o f t he summar y response. I t i s reasonabl e t o expect
t hat consumers ma y consciousl y det ermine t heir sati s f action response when ask ed
by a resear cher; t here f ore, timing i s most cr itical t o ascer t ain t he most accurat e,
well-f ormed response. Direct ed t oward focal aspect s of product acqui siti on
and/or consumpti on . T he resear cher shoul d identif y t he f ocus o f int erest based on

8/8/2019 Brand Survery
http://slidepdf.com/reader/full/brand-survery 11/20
11
t he manager ial or resear ch question t he y f ace. T hi s ma y incl ude a broad or
narrow range o f acqui sition or consumption activities/ i ssues.
(Giese and Cote / Defining Consumer Satisfaction, 2002)
Dissatisfaction.
Conceptualizing dissatisfaction has received relatively little attention in consumer
research. The existing research in the area has examined the unidimensionality of the
satisfaction / dissatisfaction construct (Maddox 1981; Swan and Combs 1976).
Researchers have taken two approaches to conceptualizing and operationalizing the
dissatisfaction construct:
y Consumer dissatisfaction is portrayed as the bipolar opposite of
satisfaction (e.g., Mittal, Kumar, and Tsiros 1999 (completely
satisfied/very dissatisfied) Spreng, MacKenzie, and Olshavsky 1996
(very satisfied/very dissatisfied));
Or
y Consumer satisfaction and dissatisfaction are viewed as two
different dimensions (e.g., Mano and Oliver 1993 and Westbrook
and Oliver 1991 use unipolar satisfaction and unipolar
dissatisfaction measures).
easons for realization of purchases
The reasons that are considered by young people as important for the realization of
purchases are:
y The pleasure from the process of purchase. This is the main reason that affects
the consumers at a percentage of 33,9 %.
y Satisfaction of the need for projection and a sense of uniqueness. Each person and
especially young persons want to feel comfortable in his clothes and distinctive.
Especially this reason is catching on at a percentage of 33,9% that is also a very
high percentage.
y A lesser percentage goes to clothes being worn out.
y Finally it is realized at a percentage of 47, 8% that new consumers buy things that
they never use because they see the purchasing process as recreational.

8/8/2019 Brand Survery
http://slidepdf.com/reader/full/brand-survery 12/20
12
ethodology
S t ruct ure of questi onnai re
In order to study the need of clothing satisfaction in young persons a research
was held with the help of a suitable questionnaire. The questionnaire is constituted by
19 questions of closed type, which is divided into:
y 12 categorical (nominal) and,
y 7 ordinal, questions.
For the achievement of the research objectives a questionnaire of Vidal Diaz
Rada from the University of Navarre, was used (a single consumer or different types
of consumer, 1998) translated and modified according to the needs and the aims of
research but also according to the Greek reality.
The questionnaire referred to issues with regard to:
The recording of place of realization of purchases.
The consuming satisfaction from the purchases that they realize.
The factors that influence the consumers in their purchases.
The satisfaction that they feel from the process of purchase.
Their preferences, by means of a list of the most popular companies of clothing.
For the answers was selected the fifth degree Linkert scale from ³Disagrees
Absolutely´ (1) until ³Agrees Absolutely´ (5). Finally, categorical and ordinal questions of
closed type were used. For the statistical analysis the statistical parcel SPSS was used. As
statistical analysis method, the descriptive statistics were used, which contribute in the
inferences of useful conclusions with the calculation of meters as the medium, the median, the
top, the breadth, the quadrants as well as the frequencies. Also for the better optical
comprehension of results were used histograms.
election of sample
The research took part in the wider region of Athens which demographically covers
the 40% of the country. We were addressed to the 5,57% of young persons who lives in the
wider region of Attica aged from 18 to 27 years (GREEK NATIONAL STATISTICAL

8/8/2019 Brand Survery
http://slidepdf.com/reader/full/brand-survery 13/20
13
ORGANISATION). That corresponds the 1,48% of young persons in entire country (GREEK
NATIONAL STATISTICAL ORGANISATION). We were addressed in 267 individuals
form which only 124 were supplemented and filled the specifications, so the rate of the
successful answering is 46, 44 %.
Method of collection of elements
By the existing 124 questionnaires 24 were selected with accidental sampling, for the
control of any faults or omissions. Then the answers that exist in the questionnaires were
checked with the answers which have been typed in SPSS. From this check no result error
registrations, double registrations or omissions was found.
Period of conduct of research
The research took place from 25-11-200 4 until 25-5-2005 in a period of 6 months,
included also author's process.
Demographic elements
The age mean of the asked persons is the 21 years. The 43, 5% asked is men and the
56, 5% women.
Diagram 1: Percentage of men -women
MEN-WOMEN
43,50% 56,50%
8/8/2019 Brand Survery
http://slidepdf.com/reader/full/brand-survery 14/20
14
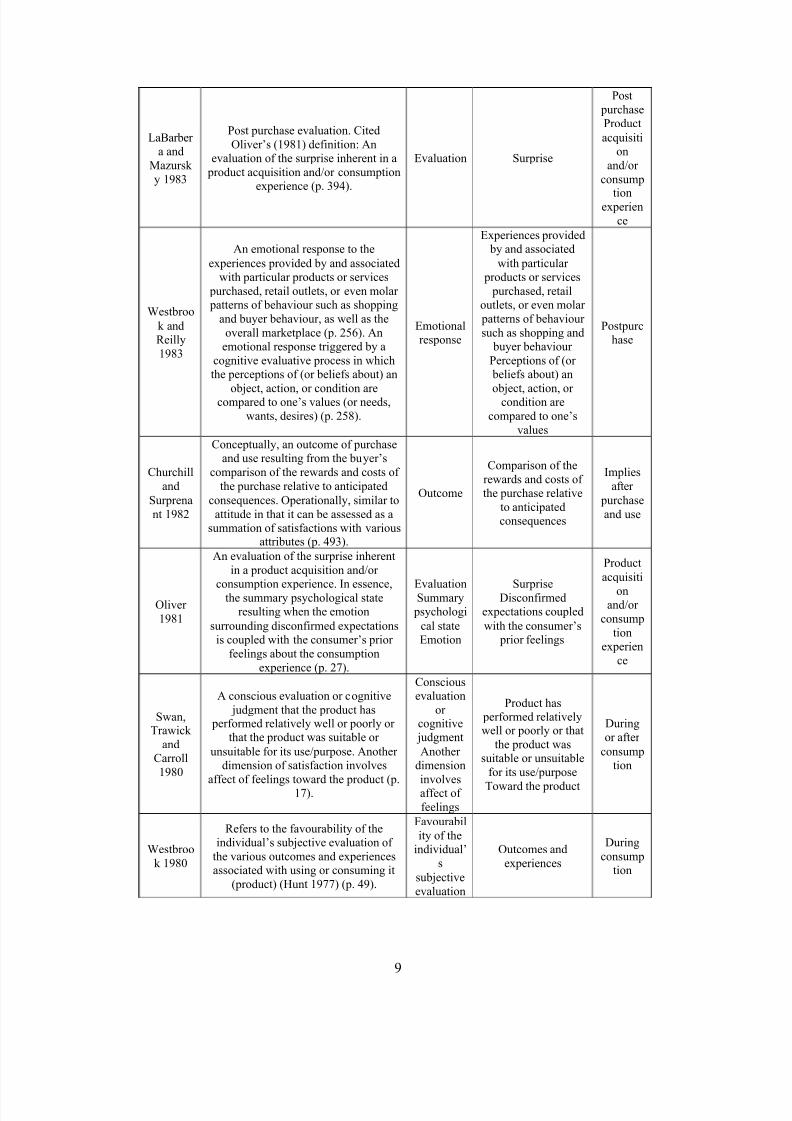
Research for t he cl ot hi ng preferences of young persons
The sum that is expended on average for clothing annually is 1359¼. Because
there is no symmetry of sample¶s variable mean (factor of asymmetry S = 4,306>1)
cannot be considered the medium numerical representative statistical meter. The
prevailing price that is simultaneously also sample¶s intermediate is calculated in1000¼. The equality of this two statistical meters of location made us to consider the
price of 1000¼ very significant. Thus, the 62, 6% of sample expends approximately
1000¼ for clothing while remainder percentage 37, 4% expends above 1000¼. The
table with the more important meters of location and dissemination that concerns the
sum that is being expended annually for clothing is given below.
Table1: Sum expended annually for clothing
Mean 1359,55
Median 1000
Mode 1000
Std. Deviation 1400,33
Skew ness 4,306
Std. Error of Skew ness ,218
Range 9800
Minimum 200
Maximum 10000
With a first view to the following diagram and to the table where is presented
the means of annual expenses of men and women we observe that there does not exist
difference in the amount that is expended by these two categories. It is more verified
also with a t - test by which it is checked if the means are same. So it is examined thehypothesis m1=m2 (m1 the mean of men and m2 of women). From this control of
hypothesis check it results that m1=m2.
Diagram 2: Percentage of annual expenses (men women)

8/8/2019 Brand Survery
http://slidepdf.com/reader/full/brand-survery 15/20
15
Q 1 5
5 0 0 0 , 0 0
3 0 0 0 , 0 0
2 3 0 0 , 0 0
1 8 0 0 , 0 0
1 5 0 0 , 0 0
1 3 5 0 , 0 0
1 2 0 0 , 0 0
1 0 0 0 , 0 0
9 0 0 , 0 0
7 5 0 , 0 0
7 0 0 , 0 0
6 0 0 , 0 0
5 0 0 , 0 0
4 0 0 , 0 0
3 0 0 , 0 0
M i s s i n g
P
e r c e n t
60
50
40
30
20
10
0
Q 1 7
GY NAIKA
A N T R A S
Table 3: Average of annual expenses (Men Women)
Views for the choice of shop
Important criterion for the shop choice constitutes the variety of the colors,
models (71%), service (73, 4%), and the easy access with the means of mass transport
(62, 9%) and finally the shop-window (62, 1%). This percentage comes from the sum
of the answers ³enough important´ and ³very important´. Below we give the table
that appears the means and the formal divergences of individual criterion that are used
in the shop choice for the purchase of some clothing. Although these criterion are
presented with order of classification.
Table 4: Criterion for the selection of the shop
MAN N 54
Mean 1361,57
Std. Deviation 1508,87
WOMAN N 69
Mean 1357,97
Std. Deviation 1320,47

8/8/2019 Brand Survery
http://slidepdf.com/reader/full/brand-survery 16/20
16
Mean Std. Deviation
SERVICE 3,97 ,914
VARIETY OF
COLORS AND
DRAWINGS
3,73 1,044
SHOP-WINDOW 3,62 1,143
EASY ACCESS BY
MMT
3,60 1,124
STRATEGIC
LOCATION
3,28 1,123
ALTERNATIVES OF
PAY
2,97 1,309
CAPABILITY OF
PARKING
2,79 1,385
Examining the preference of consumers for the type of shop that is selected for
the purchases of clothing goods, is concluded that big part of new purchasers does not
prefer the ward shops (percentage of negative answers roughly equal with 65,3%), the
stock houses (77,4%), and hypermarkets (rate of refusal 97,6). The commercial
centers and department stores assemble the bigger percentage of positive answers. Of
course it has to be pointed out that for the department stores and commercial centers
the negative and positive answers are shared. Simply we consider these two categories
the most preferable market locations because the remainder categories present very
small percentage of positive answers.
In search of tendency for the prevailing regions that prefer the young persons for
their purchases the Centre assembles the biggest percentage of preferences (40,
3%). The region of Piraeus constitutes the second pole of attraction (22, 6%).
Significant element of research constitutes the finding of 12 most popular companies
of clothing that prefer the young persons. The table of these companies where
criterion of classification constituted the mean is given below.

8/8/2019 Brand Survery
http://slidepdf.com/reader/full/brand-survery 17/20
17
Table : Most popular companies
Mean Std. Deviation
NIKE ,59 ,508
DIESEL ,55 ,498
ZARA ,53 ,500
ADIDAS ,52 ,501
PUMA ,41 ,495
TOMMY HILFIGER ,38 ,489
LEVI¶S ,35 ,480
O¶NEIL ,31 ,466
D.K.N.Y ,28 ,451
CALVIN KLEIN ,27 ,447
TRUSSARDI ,22 ,419
NAUTICA ,22 ,419
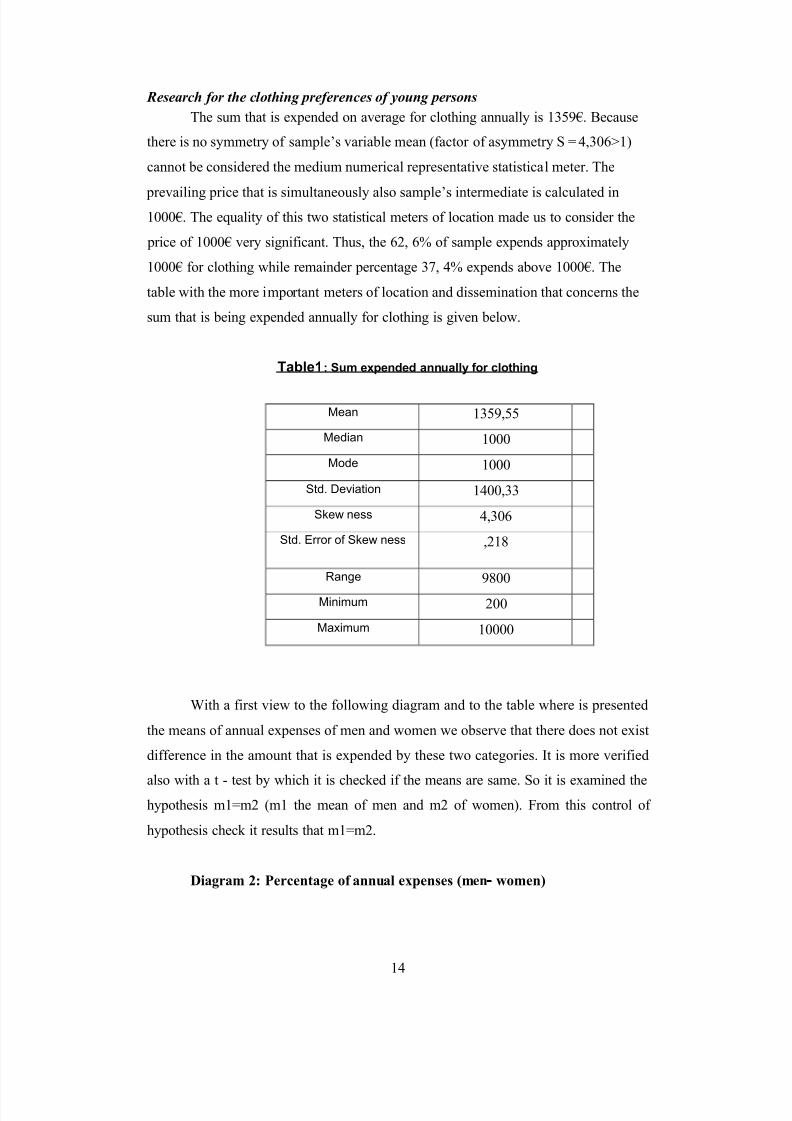
Models of consuming behaviour resulting from the sample
The analysis of particular sample helps in the distinguishing of consumer¶s
behavior type. The elements that compose the consumer¶s behavior sample are also ineffect for the men and for the women. The predominating consuming man enjoys
shopping, considers that is given him more pleasure than the use of good, stops wear
some clothing when it does not like it anymore if it is except fashion. Also sometimes
bu y s things that they could never be used, and gives more importance in what he likes
really and no in the brand name of clothing. The total of sample believes that real
bargains exist, if someone could find them. Also, the individuals usually decide at the
buying time which new shop they would like to visit. (Table 6)
8/8/2019 Brand Survery
http://slidepdf.com/reader/full/brand-survery 18/20
18
Table 6: Below is given the table with the means of each variable that concerns
the types of consuming behavior.
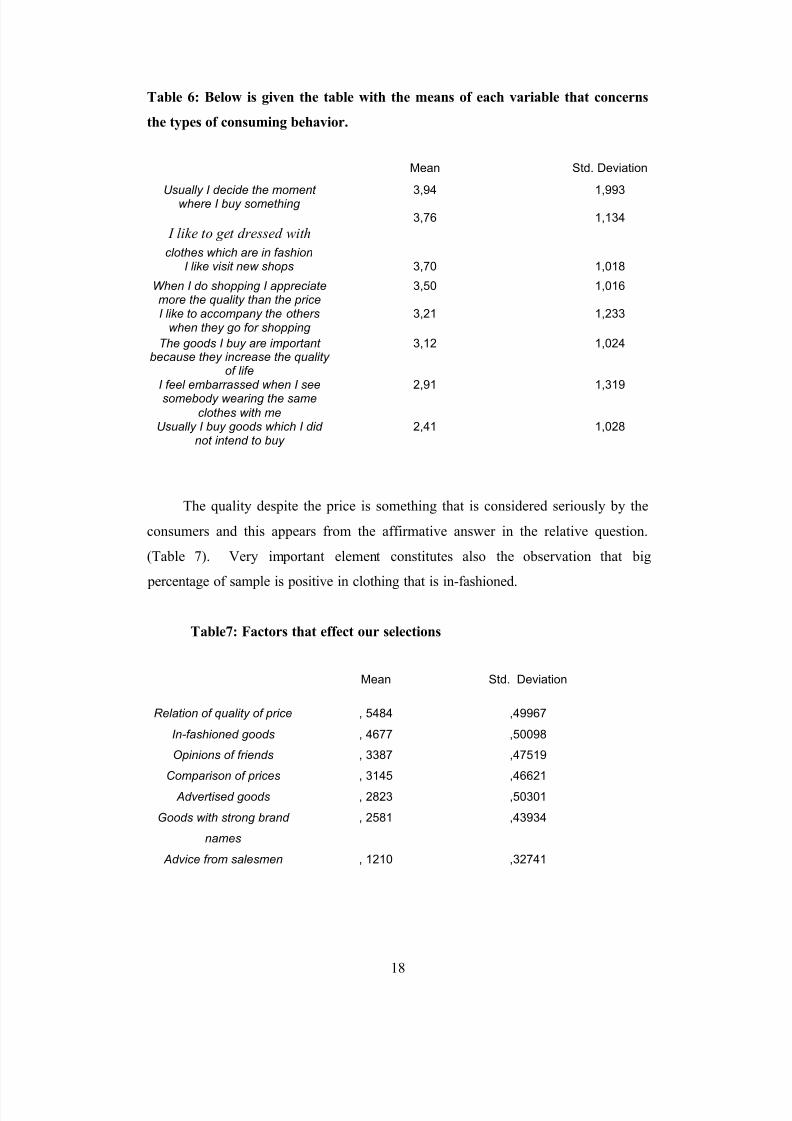
The quality despite the price is something that is considered seriously by the
consumers and this appears from the affirmative answer in the relative question.
(Table 7). Very important element constitutes also the observation that big
percentage of sample is positive in clothing that is in-fashioned.
Table7: Factors that effect our selections
Mean Std. Deviation
Relation of quality of price , 5484 ,49967
In-fashioned goods , 4677 ,50098
Opinions of friends , 3387 ,47519
Comparison of prices , 3145 ,46621
Advertised goods , 2823 ,50301
Goods with strong brand
names
, 2581 ,43934
Advice from salesmen , 1210 ,32741
Mean Std. Deviation
U sually I decide the moment where I buy something 3,94 1,993
I lik e t o get dressed wit h
clothes which are in fashion
3,76 1,134
I like visit new shops 3,70 1,018
When I do shopping I appreciatemore the quality than the price
3,50 1,016
I like to accompany the otherswhen they go for shopping
3,21 1,233
The goods I buy are important because they increase the quality
of life
3,12 1,024
I feel embarrassed when I seesomebody wearing the same
clothes with me
2,91 1,319
U sually I buy goods which I did not intend to buy
2,41 1,028

8/8/2019 Brand Survery
http://slidepdf.com/reader/full/brand-survery 19/20
19
Conclusions
Considering the importance of the classic variables such as age, sex, education and social
place, becomes easily understanding that from the present research comes out a question.³How much the traditional consuming behavior is opposed to the current consuming behavior
of young persons ( ´ It was realized that there are consumers who mainly buy goods aiming to
the satisfaction that they will have for some of their basic needs and some other ± the young
persons that they come from a safety socio-economic environment ± who breaks the
traditional consuming habits through selecting expensive brand-name products for reasons
such as prestige and social projection. In a lot of cases the last ones, byes goods that probably
will never use because for them, the process of purchase is a way of entertainment,
characterizing thus their consuming behavior as total absurd.
In our opinion, this behavior is an outcome of a particular social growth and, even if
behavior of young persons could change from certain social circumstances in a given
moment, in long run will return in the same situation when these circumstances change again.
In the next years, when the current parents will become older and the youth replace them,
will be possible to be examined in which point this behavior is based in the age factor of
youth, or if their behavior it is actually a result of a social process.
eferences:
1. Survey: Kroeber ± Riel / Weinberger, Konsumententenverhalen ±
TECHNISCHE UNIVERSITÄT MÜNCHEN (TUM)
2. Survey: Systematically varying consumer satisfaction and its implications for
product choice - Shaun McQuitty New Mexico State University, Adam Finn
University of Alberta, James B. Wiley Victoria University3. http://www.ama.org (American Marketing Association )
4. G. Siomkos (Ph.D) / Consumer Behavior and Strategic Marketing, Stamoulis
publications, 1999.
5. Philip Kotler, Marketing Management, Interbooks publications, 2000.

8/8/2019 Brand Survery
http://slidepdf.com/reader/full/brand-survery 20/20
6. Defining customer satisfaction / Joan L. Giese Washington State University
Joseph A. Cote Washington State University / Academy of Marketing Science
Review Volume 2000 No. 1 Available:
http://www.amsreview.org/articles/giese01-2000.pdf Copyright © 2002 ±
Academy of Marketing Science.7. www.statistics.gr / National statistical service
Recommended